
Abstract
Previous clinical studies have shown good efficacy of the traditional Chinese medicinal herbal water extract Chan-Yu-Bao-Yuan-Tang (CYBYT) in lung cancer patients. In this study, CYBYT’s effects on proliferation and apoptosis of human lung adenocarcinoma cell line SPC-A-1 cultured in vitro were explored. An XTT assay, cell cycle analysis, Annexin V-FITC staining and Western blot were applied to identify the viability of cells, cell cycle arrest, stages of apoptosis, and signaling proteins, respectively. The results showed that CYBYT inhibited the growth of SPC-A-1 cells by reducing the cells in G0/G1 phase but increasing them in S phase in a concentration-dependent manner, and inducing apoptosis, whereas it had no significant inhibitory effects on the normal human IMR-90 fibroblasts. Furthermore, early and total induction of apoptosis was positively correlated with the concentration of CYBYT in SPC-A-1 cells, and the rate of total apoptosis was greater in the CYBYT 100 µg/mL and 50 µg/mL groups than that of the positive control 5-fluorouracil (5-Fu) group. Moreover, CYBYT upregulated bax, cleaved caspase-3 protein expression, downregulated bcl-2 protein expression, and released mitochondrial cytochrome c into the cytosol in a time- and concentration-dependent manner. Our findings indicated that CYBYT could significantly inhibit growth and induce apoptosis via the mitochondrial pathway in human lung adenocarcinoma cell line SPC-A-1.
Introduction
Use of Western medicine alone is restricted in the treatment of lung cancer because of low efficiency, toxic side effects, and drug resistance. 1 Meanwhile, natural Chinese herbal medicines that can increase immune activity and antitumor activity have unique advantages in the treatment of lung cancer. They have been shown to improve both immune function and clinical symptoms, enhance tumor stability and quality of life, prolong survival, and play roles in attenuating side effects and sensitizing tumors when combined with radiotherapy and chemotherapy. 2 The traditional Chinese medicinal herbal extract Chan-Yu-Bao-Yuan-Tang (CYBYT) has been used for many years to treat lung cancer in China, and it has shown good efficacy for lung cancer in our previous clinical and experimental studies. 3 Meanwhile, it was previously reported that many single herbs of CYBYT were effective against lung cancer cells, such as toad extract, Solanum nigrum, Astragalus, and Radix Ranunculi ternate, which have been reported to have anti–lung cancer activities by inducing apoptosis and inhibiting cell proliferation.4-7 Moreover, raw Pinellia ternata and raw Rhizoma Arisaematis had fast-acting effects on lung cancer. 8 The above studies all evaluated the inhibitory effect of single herbs on lung cancer. Nevertheless, CYBYT can more closely represent the combination effects of herbs and can better reflect the actual treatments used in the clinic for individualized therapies compared with single herbs. Therefore, CYBYT may become a useful supplemental therapy for lung cancers with minimal side effects.
5-Fluorouracil (5-Fu) is one of the antitumor agents most frequently used for treating tumors, such as breast, cervical, lung, and gastric cancers. But 5-Fu treatment causes high incidences of toxicity in the bone marrow, gastrointestinal tract, central nerve system, skin, and mucous membrane.9-11 So the anticancer drug CYBYT with low-toxicity used alone or combined with 5-Fu may provide a significant method for the treatment of lung cancer.
In this article, we sought to understand the mechanism by which CYBYT extract may inhibit lung cancer cells in vitro; the 5-Fu group was the positive control. Apoptosis is regarded as the preferred mechanism for managing cancer cells. 12 We investigated the effects of CYBYT on cell growth and apoptosis in SPC-A-1 cells, particularly focusing on releasing mitochondrial cytochrome c into the cytosol, increasing ratio of bax/bcl-2 and activating caspase-3.
Materials and Methods
Chemicals and Reagents
5-Fluorouracil (5-Fu) was purchased from Shanghai Xudong Haipu Pharmaceutical Co. (Shanghai, China). RPMI-1640 medium and fetal calf serum (FCS) were obtained from GIBCO BRL (Gaithersburg, MD). The Annexin V-FITC apoptosis detection kit was purchased from Beckman Coulter (Fullerton, CA). The sodium 3′-(1-(phenylamino- carbonyl)-3,4-tetrazolium)-bis (4-methoxy-6-nitro)benzene-sulfonic acid hydrate (XTT) kit was purchased from Roche Diagnostics (Mannheim, Germany). Dimethyl sulfoxide (DMSO) was purchased from Beyotime Institute of Biotechnology (Haimen, China). Sodium dodecyl sulfate–polyacrylamide gel electrophoresis (SDS-PAGE) reagents were purchased from Sigma (St. Louis, MO). Anti-caspase-3, anti-bcl-2, anti-bax, and anti-β-actin antibodies were obtained from Cell Signaling Technology (Beverly, MA). Anti-cytochrome c antibody was obtained from BioVision (Mountain View, CA). Anti-rabbit and anti-mouse secondary horseradish peroxidase (HRP) antibodies were purchased from Santa Cruz Biotechnology (Santa Cruz, CA). All other chemicals were of analytical grade.
CYBYT Preparation
CYBYT was prepared as a lyophilized dry powder of hot water extracts from 11 species of medical herbs: Rehmannia root (30 g), Radix Astragali (60 g), toad skin (18 g), limax (10 g), raw Rhizoma Arisaematis (15 g), raw Pinellia tuberifera tenore (15 g), black nightshade herb (30 g), Radix Ranunculi ternati (18 g), Oldenlandia diffusa (60 g), Bulbus Fritillariae thunbergii (30 g), and Radix Stemonae (30 g). All herbs were provided by Tong Ren Tang Co. Ltd. (Beijing, China). The authenticity of the plants was confirmed by Dr Gang Chen, Experimental Center of TCM, Hubei University of Chinese Medicine. Each prescription (316 g) was decocted 3 times with 1.5 L of boiling distilled water for 1.5 hours. Raw Rhizoma Arisaematis and raw Pinellia tuberifera tenore were decocted for 30 minutes previously. The decoction was filtered, collected, concentrated, and lyophilized. The average yield of CYBYT obtained was 19.5 %.
Cell Culture
Human lung adenocarcinoma cell line SPC-A-1 and normal human IMR-90 fibroblasts were kindly provided by the Shanghai Institute of Cell Biology, Chinese Academy of Sciences. Cells (1 × 10⁵ to 5 × 10⁵/mL) were cultured in RPMI-1640 medium containing 10 % inactivated FCS, at 37°C under an atmosphere of 5% CO2. The medium was changed every 2 days and passaged every 3 days.
Morphological Observations of Treated Cells by Light Microscopy
The cells at logarithmic growth phase were harvested and seeded on 6-well plates at 1 × 10⁵ cells/well. The cells were divided into 6 groups: control group (untreated group), CYBYT (100, 50, 25, 12.5 µg/mL) and 5-Fu (3 µg/mL) treated groups. The cells were incubated for 48 hours followed by observation of the morphological changes under an inverted microscope (Olympus CK-30, Tokyo, Japan).
In Vitro Cell Growth Assay
Inhibition of cell proliferation by CYBYT and 5-Fu was measured by XTT assay. Briefly, SPC-A-1 and IMR-90 cells were plated in 96-well culture plates (5 × 10³ cells/well) and incubated for 24 hours. Then, the SPC-A-1 and IMR-90 cells were treated with CYBYT (100, 50, 25, 12.5 µg/mL) for 24 or 48 hours, and the SPC-A-1 cells were treated with 5-Fu (30, 15, 7.5, 3.75, 1.875, 0.9375, 0.46875 µg/mL) for 24 or 48 hours. After that, 50 µL of XTT test solution, which was prepared by mixing 5 mL of the XTT-labeling reagent with 100 µL of electron coupling reagent was added to each well. After 4 hours of incubation, the optical density (OD) value of each well was measured using a Model 680 Microplate Reader (Bio-Rad Laboratories, Hercules, CA) at a test wavelength of 490 nm. The cell inhibitory rate (A value) was expressed by the following formula: A = (OD of control well − OD of drug well)/(OD of control well − OD of blank well) × 100%. The 50% inhibitory concentration (IC50) of test substances against of cancer cells was calculated based on absorbance values.
Cell Cycle Analysis
Cell cycle analysis and measurement of cellular DNA content were performed after synchronization. Briefly, cultured cells were washed twice with phosphate buffered saline (PBS) at first, and then cultured in RPMI-1640 medium containing 1% serum for 72 hours. Finally, cells were collected and resuspended in culture medium. As described above, a serum starvation experiment was used to synchronize cells. Then all the collected cells (1 × 10⁵) were seeded in 6-well plates and allowed to attach overnight, and treated with various concentrations of CYBYT (100, 50, 25, 12.5 µg/mL) and 5-Fu (4.2 µg/mL) for 24 hours. The cells were harvested by trypsin treatment, washed with cold PBS (pH 7.4), and then stained with propidium iodide (PI) solution (50 µg/mL of PI, 100 µg/mL RNase, and 0.1% Triton X-100 in PBS). The stained cells were analyzed by flow cytometry (Calibur, BD Bioscience, San Jose, CA) to generate DNA histograms and cell cycle phase distributions. Data analysis was performed with CellQuest software (Becton Dickinson, Franklin Lakes, NJ).
Annexin V and PI Flow Cytometry Analysis
Apoptosis of SPC-A-1 cells was assayed by Annexin V and PI staining and analyzed by flow cytometry. Two milliliters of 1 × 10⁵ cells/mL were seeded in each well of a 6-well plate and incubated for 24 hours. Then the cells were treated with CYBYT (100, 50, 25, 12.5 µg/mL) and 5-Fu at IC50 concentration of 4.2 or 3 µg/mL for 24 or 48 hours, after which all cells in suspension and adherent cultures were collected. The cell samples were washed with ice-cold PBS after centrifugation at 4°C for 5 minutes at 500 × g. The supernatants were discarded, and the cell pellets were resuspended in ice-cold, diluted binding buffer (10 mM HEPES/NaOH, pH 7.4, 140 mM NaCl, and 2.5 mM CaCl2) at 5 × 10⁵ to 5 × 10⁶ cells/mL. Annexin V-FITC solution (5 µL) and 2.5 µL dissolved PI were added to 100 µL of the cell suspension, which was mixed gently and kept on ice for 10 minutes in the dark. Additional ice-cold 1× binding buffer (400 µL) was added to the prepared cell samples, which were mixed gently and analyzed by flow cytometry and with CellQuest software. 13
Western Blot Analysis
The cells were treated as described above. The bcl-2, bax, caspase-3, and the release of mitochondrial cytochrome c were assessed by Western blot analysis. After treatments, the cytosolic fraction of cells was isolated using the mitochondria/cytosol fractionation kit (BioVision, Mountain View, CA) as specified by the manufacturer. Aliquots of cell lysates containing 20 µL of proteins were separated by 12% SDS-PAGE gel, and transferred to PVDF membranes. The membranes were blocked with TBST buffer (10 mM Tris–HCl, pH 7.5, 150 mM NaCl, and 0.05% Tween-20) containing 5% skimmed milk, incubated with a polyclonal antibody to bcl-2 (1:1000), bax (1:1000), caspase-3 (1:1000), cytochrome c (1:1000), and β-actin (1:1000) overnight, respectively. Then membrane was incubated with either HRP-conjugated goat anti-rabbit IgG (1:2000) or goat anti-mouse IgG (1:2000) secondary antibodies. Peroxidase activity was detected with ECL visualization of the bands. The images were analyzed using the Bio-Rad image detection system (Bio-Rad, Universal Hood II), and quantitation was performed by using Quantity One software (Bio-Rad).
Statistical Analysis
All data are presented as means ± standard deviations (mean ± SD) of five independent experiments. Analyzed by one-way analysis of variance and paired t tests. Otherwise, linear regression and correlation were applied. For all tests, statistical significance was considered at the level of P < .05.
Results
Morphological Changes Under Light Microcopy
SPC-A-1 cells were treated with CYBYT and 5-Fu for 48 hours, and cellular morphological changes due to apoptosis were observed under an inverted microscope (Figure 1). Cell growth was inhibited after drug treatment, and different forms of apoptotic cells could be seen in each drug group, such as dispersed cells, altered proportion of nucleus to the cytoplasm, formed buds at the membrane, and shed apoptotic bodies. Furthermore, while the cell membrane was intact, it was shrunken with dark edges. The endochylema produced transparent vacuoles, the cytoplasm presented radial, lobulated, and nail-like protrusions. The apoptotic morphology was more obvious with the increase in concentrations of CYBYT; the cell size decreased, the intercellular space was larger, and boundaries became clearer. It is noteworthy that more necrotic cells were visible in 5-Fu group as compared with the CYBYT group.

Morphological changes of SPC-A-1 cells by inverted light microscopy for 48 hours after treatment with CYBYT and 5-Fu (400×)
Growth Inhibition Rate of SPC-A-1 and IMR-90 Cells by CYBYT Treatment
SPC-A-1 cells were exposed to CYBYT (100, 50, 25, 12.5 µg/mL) for 24 or 48 hours, resulting in the growth inhibition of the cells. A linear correlation was found between cell growth inhibition rate and the concentration of CYBYT. Under the same concentration of CYBYT, the cell growth inhibition rate increased with treatment time, while at the same time points, the cell growth inhibition rate also increased with drug concentration. The IC50 of CYBYT on SPC-A-1 cells was 74.6 and 45.6 µg/mL for 24 and 48 hours, respectively (Figure 2A).

Curve of growth inhibitory rate of SPC-A-1 and IMR-90 cells after treatment with CYBYT and 5-Fu
5-Fu was effective at all concentrations (30, 15, 7.5, 3.75, 1.875, 0.9375, 0.46875 µg/mL) tested for growth inhibition of SPC-A-1 cells for 24 and 48 hours. The cell growth inhibition rate was positively correlated with 5-Fu treatment concentration or time. The IC50 of 5-Fu on SPC-A-1 cells was 4.2 and 3.0 µg/mL for 24 and 48 hours, respectively (Figure 2B).
Of note, CYBYT had little effect on IMR-90 cells during 24 and 48 hours of treatment, suggesting that the proliferation inhibitory effect of CYBYT was relatively potent against lung cancer cells but not for normal fibroblasts when compared at the same concentrations and time (Figure 2A).
Effect of CYBYT on Cell Cycle Distributions of SPC-A-1 Cells
To examine the mechanism responsible for CYBYT-mediated cell inhibition of proliferation, cell cycle distributions were evaluated using flow cytometry. The results showed that treating cells with CYBYT and 5-Fu caused a significant inhibition of cell cycle progression in SPC-A-1 cells. After treatment for 24 hours, when compared with the untreated cells, a sub-G1 apoptosis peak appeared with a concomitant decrease (from 78.97 ± 5.62% to 55.61 ± 3.84%) in the proportion of cells in the G0/G1 phase and an increase (from 13.65 ± 4.93 % to 34.21 ± 3.64%) in those in the S phase (Figure 3). Along with increasing concentrations of CYBYT, the cells in G0/G1 phase increased (from 64.15 ± 1.68% to 72.78 ± 6.40%), accompanied by a significant decrease (from 29.05 ± 0.83% to 21.09 ± 6.16%) in S phase cells. Few apoptotic cells were induced by CYBYT: The maximum apoptotic rate induced by CYBYT during the cell cycle was 6.58 ± 0.90%, compared with 6.09 ± 0.44% of apoptotic cells in the 5-Fu group (Figure 3B, Appendix A1). Thus, CYBYT was not more effective than 5-Fu on apoptosis rate of cell cycle analysis.

(A) Cell cycle profiles of SPC-A-1 cells for 24 hours after treatment with CYBYT and 5-Fu and (B) stacked column graph of cell cycle distributions of SPC-A-1 cells at 24 hours in each group
Annexin V-FITC/PI Labeling Detection of Apoptotic Rate in SPC-A-1 Cells
Annexin V-FITC labels apoptotic cells, whereas PI labels necrotic or mid- and late apoptotic cells. Representative flow cytometry plots are shown in Figures 4A and 4B, with the vertical axis as the fluorescence intensity of Annexin V-FITC, and the horizontal axis as the fluorescence intensity of PI. Accordingly, the cells could be clearly divided into 4 types, including normal living cells, early apoptotic cells, mid and late apoptotic or necrotic cells, and mechanically injured cells.

A and B, Apoptosis of SPC-A-1 cells detected by flow cytometry for 24 and 48 hours after the treatment of CYBYT and 5-Fu. Early apoptotic cells are in the left upper quadrant (a zone, Annexin V+/PI−); middle and late apoptotic cells or necrotic cells are in the right upper quadrant (b zone, Annexin V+/PI+); mechanically injured cells are in the right lower quadrant (c zone, Annexin V−/Pl+); normal live cells are in the left lower quadrant (d zone, Annexin V−/PI−). C, The column bar graph shows apoptosis of SPC-A-1 cells that was detected after treatment with CYBYT and 5-Fu for 24 or 48 hours. Data are expressed as mean ± SD, n = 5. Comparison at the same time and different concentrations: compared with untreated group, *P < .05, **P < .01; compared with 5-Fu positive group, ΔP < .05, ΔΔP < .01. Comparison at the same concentration and different time: compared with 24-hour group, #P < .05, ##P < .01. 5-Fu concentration was 4.2 µg/mL (24 hours) and 3 µg/mL (48 hours), respectively
Figure 4 shows CYBYT treatment of 24 or 48 hours. Early and total apoptotic rates of SPC-A-1 cells were significantly increased in CYBYT (100, 50, 25, 12.5 µg/mL) groups in a time- and dose-dependent manner. Nevertheless, Figure 4C, and Appendix A2 shows that the early apoptotic rates of CYBYT 100 µg/mL groups at 24 and 48 hours were 49.75 ± 3.45% and 46.46 ± 1.82% respectively, and the early apoptotic rate was lower at 48 hours than at 24 hours. Moreover, CYBYT 100 and 50 µg/mL groups were superior to the 5-Fu group in the early and total apoptotic rate at 24 or 48 hours.
CYBYT Induces Apoptosis via a Mitochondria-Mediated Pathway
Alterations in mitochondria function have been shown to play a crucial role in apoptosis, and thus the effect of CYBYT and 5-Fu on SPC-A-1 cells was investigated. The results demonstrated that the intrinsic pathway of apoptosis was activated. The protein levels of bax, bcl-2, cytochrome c, and caspase-3 in SPC-A-1 cells are shown in Figure 5. As shown in Table 1, CYBYT resulted in a significant increase of bax expression from 0.35 ± 0.01 to 1.11 ± 0.08 at 24 hours and from 0.64 ± 0.04 to 1.19 ± 0.06 at 48 hours. But CYBYT resulted in a significant decrease of bcl-2 expression from 0.76 ± 0.04 to 0.48 ± 0.03 at 24 hours and from 0.54 ± 0.06 to 0.11 ± 0.05 at 48 hours. Meanwhile, a time- and concentration-dependent shift in the ratio of bax/bcl-2 was observed after 24 and 48 hours of treatment with CYBYT (Figure 5C, Appendix A3).
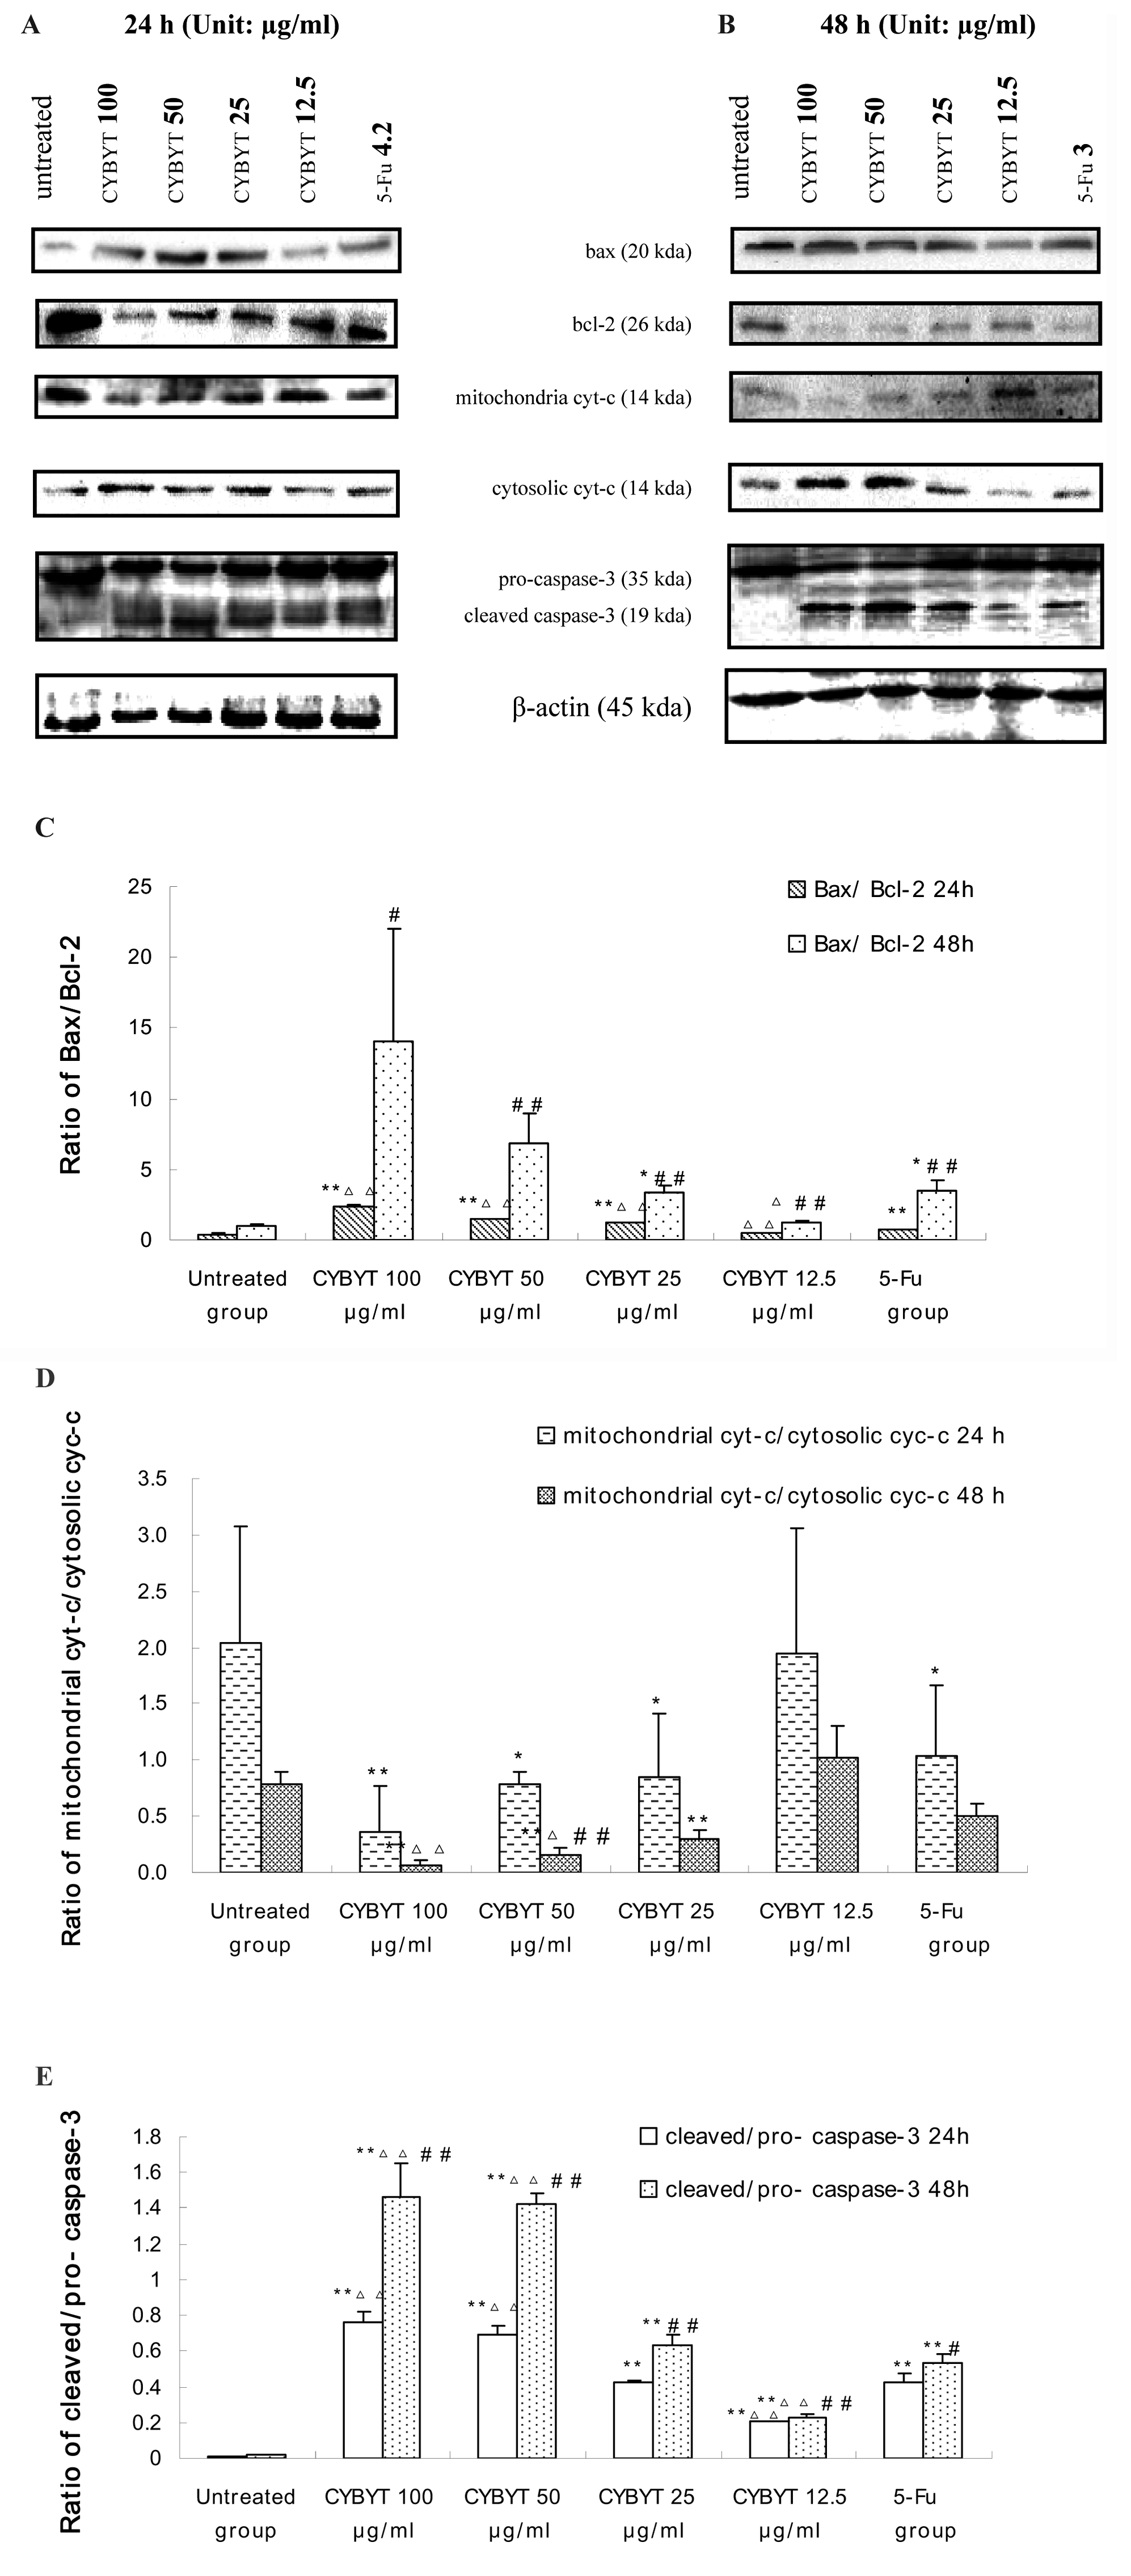
A and B, The effects on bax, bcl-2, mitochondrial cytochrome c, cytosolic cytochrome c, cleaved caspase-3, and pro-caspase-3 protein expression level were detected by Western blot after exposure to CYBYT and 5-Fu for 24 and 48 hours. C, Protein expression level of bax/bcl-2 was detected by Western blot after exposure to CYBYT and 5-Fu. D, Protein expression level of mitochondrial cytochrome c/cytosolic cytochrome c was detected by Western blot after exposure to CYBYT and 5-Fu. E, Protein expression level of cleaved caspase-3/pro-caspase-3 was detected by Western blot after exposure to CYBYT and 5-Fu. β-Actin was used as a control in all histograms. Data are expressed as mean ± SD, n = 5. Comparison at the same time and different concentrations: compared with untreated group, *P < .05, **P < .01; compared with 5-Fu positive group, ΔP < .05, ΔΔP < .01. Comparison at the same concentration and different time: compared with 24-hour group, #P < .05, ##P < .01. 5-Fu concentration was 4.2 µg/mL (24 hours) and 3 µg/mL (48 hours), respectively
Western Blot Analysis: bax and bcl-2 Protein Levels in SPC-A-1 Cells After Exposure to CYBYT and 5-Fu a

Data are expressed as mean ± SD, n = 5. Comparison at the same time and different concentrations: compared with untreated group, *P < .05, **P < .01; compared with 5-Fu positive group, ΔP < .05, ΔΔP < .01. Comparison at the same concentration and different time: compared with 24-hour group, #P < .05, ##P < .01. 5-Fu concentration was 4.2 µg/mL (24 hours) and 3 µg/mL (48 hours).
Furthermore, the release of cytochrome c from mitochondria into the cytoplasm was then investigated. CYBYT increased cytosolic cytochrome c expression from 0.23 ± 0.03 to 0.75 ± 0.07 at 24 hours and from 0.38 ± 0.06 to 0.98 ± 0.03 at 48 hours, whereas it decreased mitochondrial cytochrome c expression from 0.44 ± 0.22 to 0.26 ± 0.29 at 24 hours and from 0.38 ± 0.07 to 0.07 ± 0.05 at 48 hours (Table 2). Figure 5D, and Appendix A4 also shows that CYBYT resulted in a significant increase in cytosolic cytochrome c expression and a significant decrease in mitochondrial cytochrome c expression in a time- and concentration-dependent manner.
Western Blot Analysis: Mitochondria and Cytosolic Cytochrome c Protein Levels in SPC-A-1 Cells After Exposure to CYBYT and 5-Fu a

Data are expressed as mean ± SD, n = 5. Comparison at the same time and different concentrations: compared with untreated group, *P < .05, **P < .01; compared with 5-Fu positive group, ΔP < .05, ΔΔP < .01. Comparison at the same concentration and different time: compared with 24-hour group, #P < .05, ##P < .01. 5-Fu concentration was 4.2 µg/mL (24 hours) and 3 µg/mL (48 hours).
The effects of CYBYT on the expression of caspase-3 in SPC-A-1 cells were also analyzed. In the 24- and 48-hour groups, the results showed that with the increase of CYBYT concentration, the density of bands of pro-caspase-3 (the uncleaved precursors of caspase-3) decreased and cleaved caspase-3 increased gradually (Figures 5A and 5B), and the relative expression values of cleaved caspase-3/β-actin and cleaved caspase-3/pro-caspase-3 both increased gradually, being positively concentration dependent (Table 3, Figure 5E and Appendix A5). In addition, when comparing 48 and 24-hour groups, the relative expression values between cleaved caspase-3 protein and pro-caspase-3 protein gradually increased in different groups, indicating that pro-caspase-3 was hydrolyzed and activated in a time- and concentration-dependent manner after CYBYT treatment.
Expression of Caspase-3 Activated Fragments of SPC-A-1 Cells Detected by Western Blot After Exposure to CYBYT and 5-Fu a
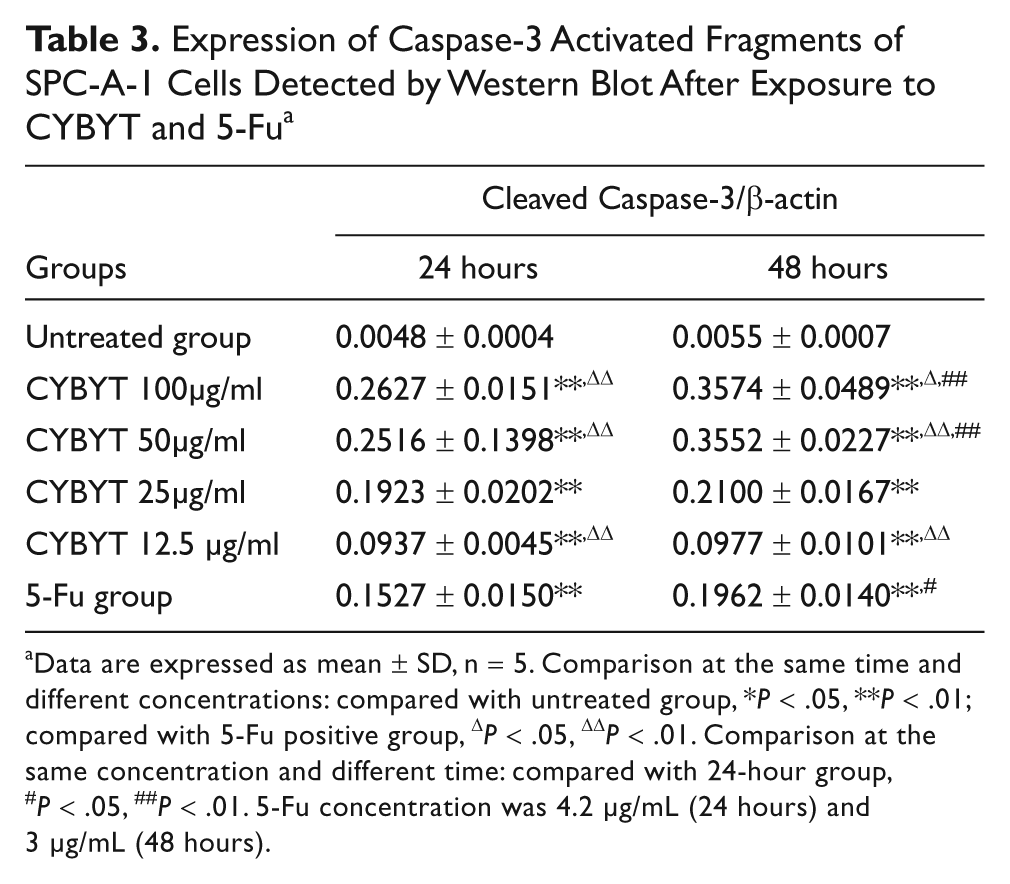
Data are expressed as mean ± SD, n = 5. Comparison at the same time and different concentrations: compared with untreated group, *P < .05, **P < .01; compared with 5-Fu positive group, ΔP < .05, ΔΔP < .01. Comparison at the same concentration and different time: compared with 24-hour group, #P < .05, ##P < .01. 5-Fu concentration was 4.2 µg/mL (24 hours) and 3 µg/mL (48 hours).
The above results indicated that CYBYT could upregulate bax, cytosol cytochrome c, and cleaved caspase-3 protein expression, and downregulate bcl-2 protein expression in a time- and concentration-dependent manner. It was further confirmed that CYBYT and 5-Fu could both induce apoptosis of SPC-A-1 cells via a mitochondria-mediated pathway, eventually activating caspase-3 protein.
Discussion
In recent years, clinical applications have shown that CYBYT therapy exerts certain beneficial effects on patients before and after surgery, radiotherapy, and chemotherapy. Tumor growth involves a different number of cellular processes that ultimately leads to its establishment. These involve induction of cell cycle progression, escape from the apoptotic program, and activation of the cell survival pathway. 14 We have observed that CYBYT disrupts these processes established by cancer cells, to limit their growth in vitro. The XTT assay showed that CYBYT at different concentrations could inhibit SPC-A-1 cell proliferation in a time- and concentration-dependent manner but had no significant effect on suppressing growth of the normal human IMR-90 fibroblasts, suggesting that CYBYT has selective cytotoxic effects on cancer cells. This selectivity of CYBYT to cancer cells may be related to the different genomic stability between cancer and normal cells. 15
Drugs can damage cells by activating a restriction point, resulting in cell cycle arrest, retarding DNA repair or translesion DNA synthesis. Thus, unrepaired and ineffective translesion DNA synthesis by the cells occur during apoptosis. This type of cell apoptosis often occurs in a cell cycle phase where cells are arrested first. We demonstrated for the first time that CYBYT inhibited cell proliferation, induced apoptosis and inhibited cells at S phase to entering G2/M phase. As shown in Figure 3, CYBYT treatment caused a concentration-dependent increase at S phase, indicating that CYBYT might induce cell cycle arrest before apoptosis. Furthermore, cell cycle assay showed that 5-Fu and CYBYT were almost equally effective in inducing apoptotic rate, but our Annexin V-FITC/PI staining assay revealed that early and total apoptotic rates of CYBYT treatment (50 and 100 µg/mL) were significantly higher than those of the 5-Fu group. This may be because of the fact that the cell cycle assay mainly detected middle and late apoptotic cells, but early apoptosis was mainly revealed by Annexin V-FITC/PI double staining assay. Moreover, Annexin V-FITC/PI staining assay also indicated that the early apoptotic rate increased in a concentration-dependent but not time-dependent manner. This may be much earlier apoptotic cells developed into mid- and late apoptotic cells with the passage of time. It is worth noting that mechanically injured cells at 48 hours of CYBYT treatment were greater than those of 24 hours (c section, Annexin V-/PI+), perhaps because of cell debris generated from a greater number of apoptotic bodies.
The mitochondrial apoptotic pathway has been described as an important signal of apoptotic cell death in mammalian cells.16-18 Following the treatment of SPC-A-1 cells with CYBYT, we observed that CYBYT treatment resulted in a significant increase of bax, cytosolic cytochrome c, and cleaved caspase-3 expression, and a decrease of bcl-2 and mitochondrial cytochrome c, suggesting that changes in the ratio of the proapoptotic and antiapoptotic Bcl-2 family of proteins might contribute to the apoptosis promotion activity of CYBYT. These occurrences of mitochondrial apoptotic events were correlated with the modulation of CYBYT on the Bcl-2 family of proteins. These results confirm that CYBYT induced apoptosis is associated with regulation of the Bcl-2 family of proteins.
Various test methods are required to detect apoptosis because of the varied apoptosis characteristics and the limitations of a single detection method. Membrane blistering and apoptotic bodies can be seen under the inverted light microscope, consistent with previous studies. 19 A major disadvantage in morphological detection of apoptosis is that it is only qualitative. The quantitative analysis of apoptosis mainly relies on flow cytometry with fluorescent markers. Annexin V-FITC/PI double staining, which can detect cell apoptosis, is one of the most sensitive and ideal indicators 20 . CYBYT can inhibit the SPC-A-1 cells cultured in vitro and induce its apoptosis in a concentration- and time-dependent manner. We further confirmed that both CYBYT and 5-Fu could induce cellular apoptosis via a mitochondria-mediated pathway. Furthermore, the apoptotic rate in the CYBYT 100 and 50 µg/mL groups was superior to that in the 5-Fu group. The multiple effects of CYBYT against lung cancer cells underline the importance of therapeutic cocktail formulations in the treatment of cancer. In our clinical studies, how CYBYT could specifically reduce tumor growth without causing systemic imbalance in the normal cellular environment remains unclear.
Conclusions
The findings indicate that CYBYT could significantly inhibit the growth and induce an increase in S phase cells and apoptosis via the mitochondria-mediated pathway of human lung adenocarcinoma cell line SPC-A-1 in vitro. The promotion of the specific apoptosis pathway, key molecular targets that specifically initiate apoptosis of lung cancer cells, the active ingredients, and quality standards of CYBYT should be further explored. Thus, CYBYT would be worth investigating as a novel therapeutic agent for the medical treatment of lung cancer with few side effects.
Footnotes
Appendix
Expression of Caspase-3 Activated Fragments of SPC-A-1 Cells Detected by Western Blot in Each Experimental Group (
| 24 Hours |
48 Hours |
|||
|---|---|---|---|---|
| Groups | Cleaved/Uncleaved Caspase-3 | Cleaved Caspase-3/ β-Actin | Cleaved/Uncleaved Caspase-3 | Cleaved Caspase-3/ β-Actin |
| Untreated group | 0.0094 ± 0.0006 | 0.0048 ± 0.0004 | 0.0149 ± 0.0022 | 0.0055 ± 0.0007 |
| CYBYT 100 µg/mL | 0.7657 ± 0.0584**, ΔΔ | 0.2627 ± 0.0151**, ΔΔ | 1.4642 ± 0.1844**,ΔΔ,## | 0.3574 ± 0.0489**,Δ,## |
| CYBYT 50 µg/mL | 0.6921 ± 0.0476**, ΔΔ | 0.2516 ± 0.1398**, ΔΔ | 1.4271 ± 0.0612**,ΔΔ,## | 0.3552 ± 0.0227**,ΔΔ,## |
| CYBYT 25 µg/mL | 0.4218 ± 0.1759** | 0.1923 ± 0.0202** | 0.6292 ± 0.0608**, ## | 0.2100 ± 0.0167** |
| CYBYT 12.5 µg/mL | 0.2035 ± 0.009**, ΔΔ | 0.0937 ± 0.0045**, ΔΔ | 0.2299 ± 0.0157**,ΔΔ,## | 0.0977 ± 0.0101**, ΔΔ |
| 5-Fu group | 0.4264 ± 0.0435** | 0.1527 ± 0.0150** | 0.5373 ± 0.0416**, # | 0.1962 ± 0.0140**, # |

Comparison at the same time and different concentrations: compared with untreated group, **P < .01; compared with 5-Fu positive group, ΔP < .05, ΔΔP < .01. Comparison at the same concentration and different time: compared with 24-hour group, #P < .05, ##P < .01. 5-Fu concentration was 4.2 and 3 µg/mL for 24 and 48 hours, respectively, in the 5-Fu group.
Declaration of Conflicting Interests
The author(s) declared no potential conflicts of interests with respect to the authorship and/or publication of this article.
Funding
The author(s) disclosed receipt of the following financial support for the research and/or authorship of this article:
This work was supported by a grant from the Administration Bureau of Traditional Chinese Medicine of Zhejiang Province, China (No. 2008CA113) and Program for New Century Excellent Talents in University of China (2007).