
Abstract
Background
The Cancer Genome Atlas (TCGA) molecular classification has advanced risk stratification for endometrial carcinoma but has demonstrated comparable survival outcomes between the microsatellite instability (MSI) and copy-number low (CN-L) subtypes. In this study, we aimed to identify potential autophagy-related molecular signatures to increase the precision of TCGA-based prognostic stratification in early-stage endometrial carcinoma.
Methods
Univariate Cox regression analysis of the TCGA-Uterine Corpus Endometrial Carcinoma cohort was used to identify autophagy-related genes associated with survival outcomes in patients with endometrial carcinoma. The candidates were analyzed by the Kaplan–Meier method. Multivariate Cox regression was used to assess whether PEA15 served as an independent prognostic factor, especially for the MSI and CN-L subtypes. We examined the correlation between PEA15 protein expression and patient survival through immunohistochemical analysis of tissue microarrays from our institutional cohort of stage I endometrial cancer patients.
Results
Univariate analysis revealed that NRG3, PEA15, DNAJB1, BAK1, DRAM1, KLHL24, ATF6, CDKN2A, MBTPS2, and UVRAG were significantly associated with survival outcomes in early-stage endometrial carcinoma patients. Multivariate analysis established PEA15 as an independent prognostic factor. Immunohistochemical analysis of tissue microarrays revealed that elevated PEA15 expression was significantly correlated with poorer overall survival and disease-free survival. Both univariate and multivariate Cox regression confirmed high PEA15 expression as an independent prognostic factor for recurrence in patients with stage I endometrioid adenocarcinoma.
Conclusions
The autophagy-related gene PEA15 is an independent prognostic biomarker in early-stage endometrial carcinoma, improving risk stratification between the MSI and CN-L subtypes. Immunohistochemical detection has clinical potential for molecular classification, offering opportunities for personalized postoperative management strategies.
Introduction
Endometrial carcinoma (EC) is one of the most prevalent gynecologic malignancies globally, accounting for approximately 417,367 new cases and 97,370 deaths globally in 2020. 1 Notably, 75–80% of cases are diagnosed at early stages. 2 Although 85% of early-stage patients achieve favorable outcomes, with 5-year survival rates exceeding 90% following surgical intervention, a clinically significant proportion (7–15%) experience disease recurrence within 3–5 years, resulting in a substantially worse prognosis.2,3 Traditional recurrence risk assessment relies on clinicopathological factors, including tumor grade, depth of myometrial invasion, and lymphovascular space involvement, which are used to stratify patients into risk groups to guide postoperative management.4–6 Recently, the development of The Cancer Genome Atlas (TCGA) classification system has provided a supplementary molecular framework for patient stratification and treatment guidance. 7 This classification identifies four molecular subtypes with distinct clinical behaviors: POLE-ultramutated, microsatellite instability (MSI), copy-number low (CN-L), and copy-number high (CN-H). While the POLE-ultramutated and CN-H subtypes demonstrate clear prognostic extremes, the MSI and CN-L subgroups, which comprise more than 60% of cases, show overlapping survival outcomes (5-year recurrence-free survival: 72% vs. 74%), 8 highlighting the need for additional biomarkers to further optimize risk stratification within these intermediate molecular categories.
Autophagy, an evolutionarily conserved lysosomal degradation pathway, serves as a critical quality control mechanism that maintains cellular homeostasis through the regulated turnover of damaged organelles and protein aggregates. 9 In cancer biology, autophagy plays context-dependent roles: during tumor initiation, it functions as a tumor-suppressive mechanism by preventing genomic instability through the clearance of damaged cellular components; whereas in established malignancies, autophagy supports tumor cell survival by mitigating metabolic stress, hypoxia, and therapeutic challenges. 10 In EC, the AKT‒nuclear factor (NF)κB signaling axis has been shown to activate cancer-promoting autophagy, which facilitates EC cell growth and metastatic dissemination. 11 Furthermore, the inhibition of autophagy potentiates the antitumor effects of β-catenin pathway inhibitors in EC models, suggesting that autophagy mediates therapeutic resistance in this malignancy. 12 Importantly, emerging evidence indicates that autophagy activity varies significantly across molecular subtypes of cancer. In breast cancer, for example, the autophagy regulator BECN1 has subtype-specific expression patterns, with the lowest levels observed in aggressive human epidermal growth factor receptor 2 (HER2)-enriched and basal-like tumors, where it is correlated with TP53 mutations and advanced disease. 13 These observations suggest that systematic evaluation of autophagy-related molecular signatures could yield clinically relevant biomarkers.
By systematically evaluating autophagy-related genes within the TCGA framework and validating findings using clinical specimens and information from our institution, this study identified potential prognostic biomarkers that enhance risk stratification, particularly for distinguishing MSI and CN-L subtypes with overlapping recurrence risks. This integrated approach not only augments the clinical utility of the TCGA classification but also provides novel insights for personalized postoperative management.
Materials and methods
Data acquisition and processing
RNA sequencing profiles and clinical information for early-stage EC (International Federation of Gynecology and Obstetrics (FIGO) stages I and II) samples were obtained from the TCGA database. Molecular classification data for early-stage EC were retrieved from cBioPortal for Cancer Genomics. 14 A total of 222 autophagy-related genes (ARGs) were obtained from the Human Autophagy Database (HADb, https://www.autophagy.lu/v1/index.html), and their associations with EC patient prognosis were analyzed. Samples meeting the following criteria were used for subsequent analysis: (a) complete survival information; and (b) follow-up time > 90 days. To ensure analytical reliability, transcripts with transcripts per million(TPM) values of 0 in more than 50% of the samples were excluded, resulting in 366 retained for subsequent analysis (Supplemental Table 1).
Identification of survival-related autophagy genes
Principal component analysis was used to visualize the expression patterns of early EC and adjacent normal tissues. Univariate Cox regression analysis and Kaplan–Meier analysis were performed to assess the associations of all ARGs with overall survival (OS) and disease-free survival (DFS) in patients with early-stage EC. Multivariate Cox regression analysis was subsequently conducted to identify independent risk factors among the messenger RNAs (mRNAs) significantly associated with outcomes via univariate analysis.
Analyzing the relationship between ARGs and TCGA molecular classification
To understand the basic characteristics of molecular typing in early-stage EC patients, survival outcomes were assessed across all four TCGA molecular subtypes (POLE-ultramutated, MSI, CN-L, and CN-H) in early-stage EC patients using the Kaplan–Meier analysis. We subsequently conducted focused Kaplan–Meier survival analyses to compare recurrence-free survival and OS between patients with high PEA15-expressing tumors and those with low PEA15-expressing tumors exclusively within the MSI and CN-L patient subgroups.
Tissue samples
Ninety-nine early-stage EC samples from patients who did not receive chemotherapy or radiotherapy were collected from surgical resections for immunohistochemistry analysis. These samples were obtained from Union Hospital, Tongji Medical College, Huazhong University of Science and Technology, and written informed consent was obtained prior to surgery between January 2011 and December 2017. All procedures involving clinical samples and patient information were approved by the Medical Ethics Committee, Union Hospital, Tongji Medical College, Huazhong University of Science and Technology. Patients were followed until November 2022. OS was defined as the time from surgery to the last follow-up or death, whereas DFS was measured from surgery to the last follow-up, death, or cancer recurrence confirmed by radiographic and pathological evidence. A tissue microarray from each tumor was constructed by Wuhan Powerful Biology for standardized immunohistochemical analysis.
Immunohistochemistry
A standard immunohistochemistry (IHC) protocol was used to detect the protein level of PEA15. Briefly, formalin-fixed, paraffin-embedded EC tissues were deparaffinized and hydrated by sequential washes with xylene, anhydrous ethanol, 95% ethanol, 75% ethanol, 50% ethanol, and phosphate-buffered saline (PBS). After heat-induced antigen retrieval, a hydrogen peroxide solution was used to inactivate endogenous peroxidases. Non-specific binding sites were subsequently blocked with 10% goat serum. The sections were incubated overnight with anti-PEA15 antibody (1:200 dilution, Proteintech, 21446-1-AP, China) at 4°C. The sections were subsequently incubated with enhanced enzyme-labeled goat anti-rabbit IgG polymer at 37°C for 20 min, followed by 3,3′-diaminobenzidine staining and counterstaining with hematoxylin. The IHC results were scored according to the following formula: staining intensity (none = 0, weak = 1, moderate = 2, strong = 3) and staining area (less than 5% = 0, between 5% and 25% = 1, between 25% and 50% = 2, between 50% and 75%=3, and more than 75% = 4). The final staining score was calculated by multiplying the staining intensity and area scores, with positivity graded as follows: 0 (negative, −), 1–4 (weakly positive, +), 5–8 (positive, ++), and 9–12 (strongly positive, +++).
Statistical analysis
All the statistical analyses were performed using the R environment (version 3.6.3), GraphPad Prism (version 8.3.0), and SPSS (version 23). Survival-associated genes were identified through univariate and multivariate Cox regression analyses. Kaplan–Meier survival curves and log-rank tests were employed for survival analysis, whereas the chi-square test was used to assess correlations between IHC scores and tumor recurrence, as well as between PEA15 expression and clinicopathologic features. A P value < 0.05 was considered statistically significant for all tests.
Results
Screening of ARGs associated with prognosis
The transcriptome of the TCGA-Uterine Corpus Endometrial Carcinoma (UCEC) cohort, which included 366 early-stage EC samples and 14 adjacent endometrial tissue samples, was acquired from the TCGA project (Supplemental Table 1). Principal component analysis revealed distinct expression patterns of ARGs between early-stage EC tissues and adjacent non-cancerous endometrium. As shown in Supplemental Figure 1a, the ARG expression profiles of all early-stage EC samples clearly separated from those of adjacent endometrial tissues, indicating significant differences in autophagy-related transcriptional activity between cancerous and non-cancerous tissues. This separation was further validated in a subset of 14 paired early-stage EC and adjacent endometrial tissues (Supplemental Figure 1b), where the paired samples exhibited consistent clustering patterns, reinforcing the robustness of the observed differences. These findings suggest that the expression of ARGs is systematically altered in early-stage EC, highlighting their potential role in tumor development and progression.
To identify ARGs associated with prognosis, univariate Cox regression analysis was performed for OS and DFS. The analysis revealed that 28 ARGs, including 26 high-risk genes and 2 low-risk genes, were significantly associated with OS (Figure 1(a)). Similarly, 20 ARGs, comprising 18 high-risk genes and 2 low-risk genes, were linked to DFS (Figure 1(b)). Among these, nine ARGs—NRG3, PEA15, DNAJB1, BAK1, KLHL24, ATF6, CDKN2A, MBTPS2, and UVRAG—were identified as high-risk factors for both OS and DFS, whereas DRAM1 was a low-risk factor for both outcomes. To further validate the prognostic significance of the above 10 identified ARGs, the Kaplan–Meier survival analysis was performed for OS (Figure 1(c)) and DFS (Figure 1(d)) using optimal cutoff values. High expression of NRG3, PEA15, DNAJB1, BAK1, ATF6, CDKN2A, MBTPS2 and UVRAG was significantly associated with shorter survival. Conversely, low DRAM1 expression was correlated with poor prognosis, whereas KLHL24 expression was not significantly associated with DFS. These findings suggest that NRG3, PEA15, DNAJB1, BAK1, DRAM1, ATF6, CDKN2A, MBTPS2, and UVRAG could serve as potential biomarkers for indicating the prognosis of early-stage EC patients.
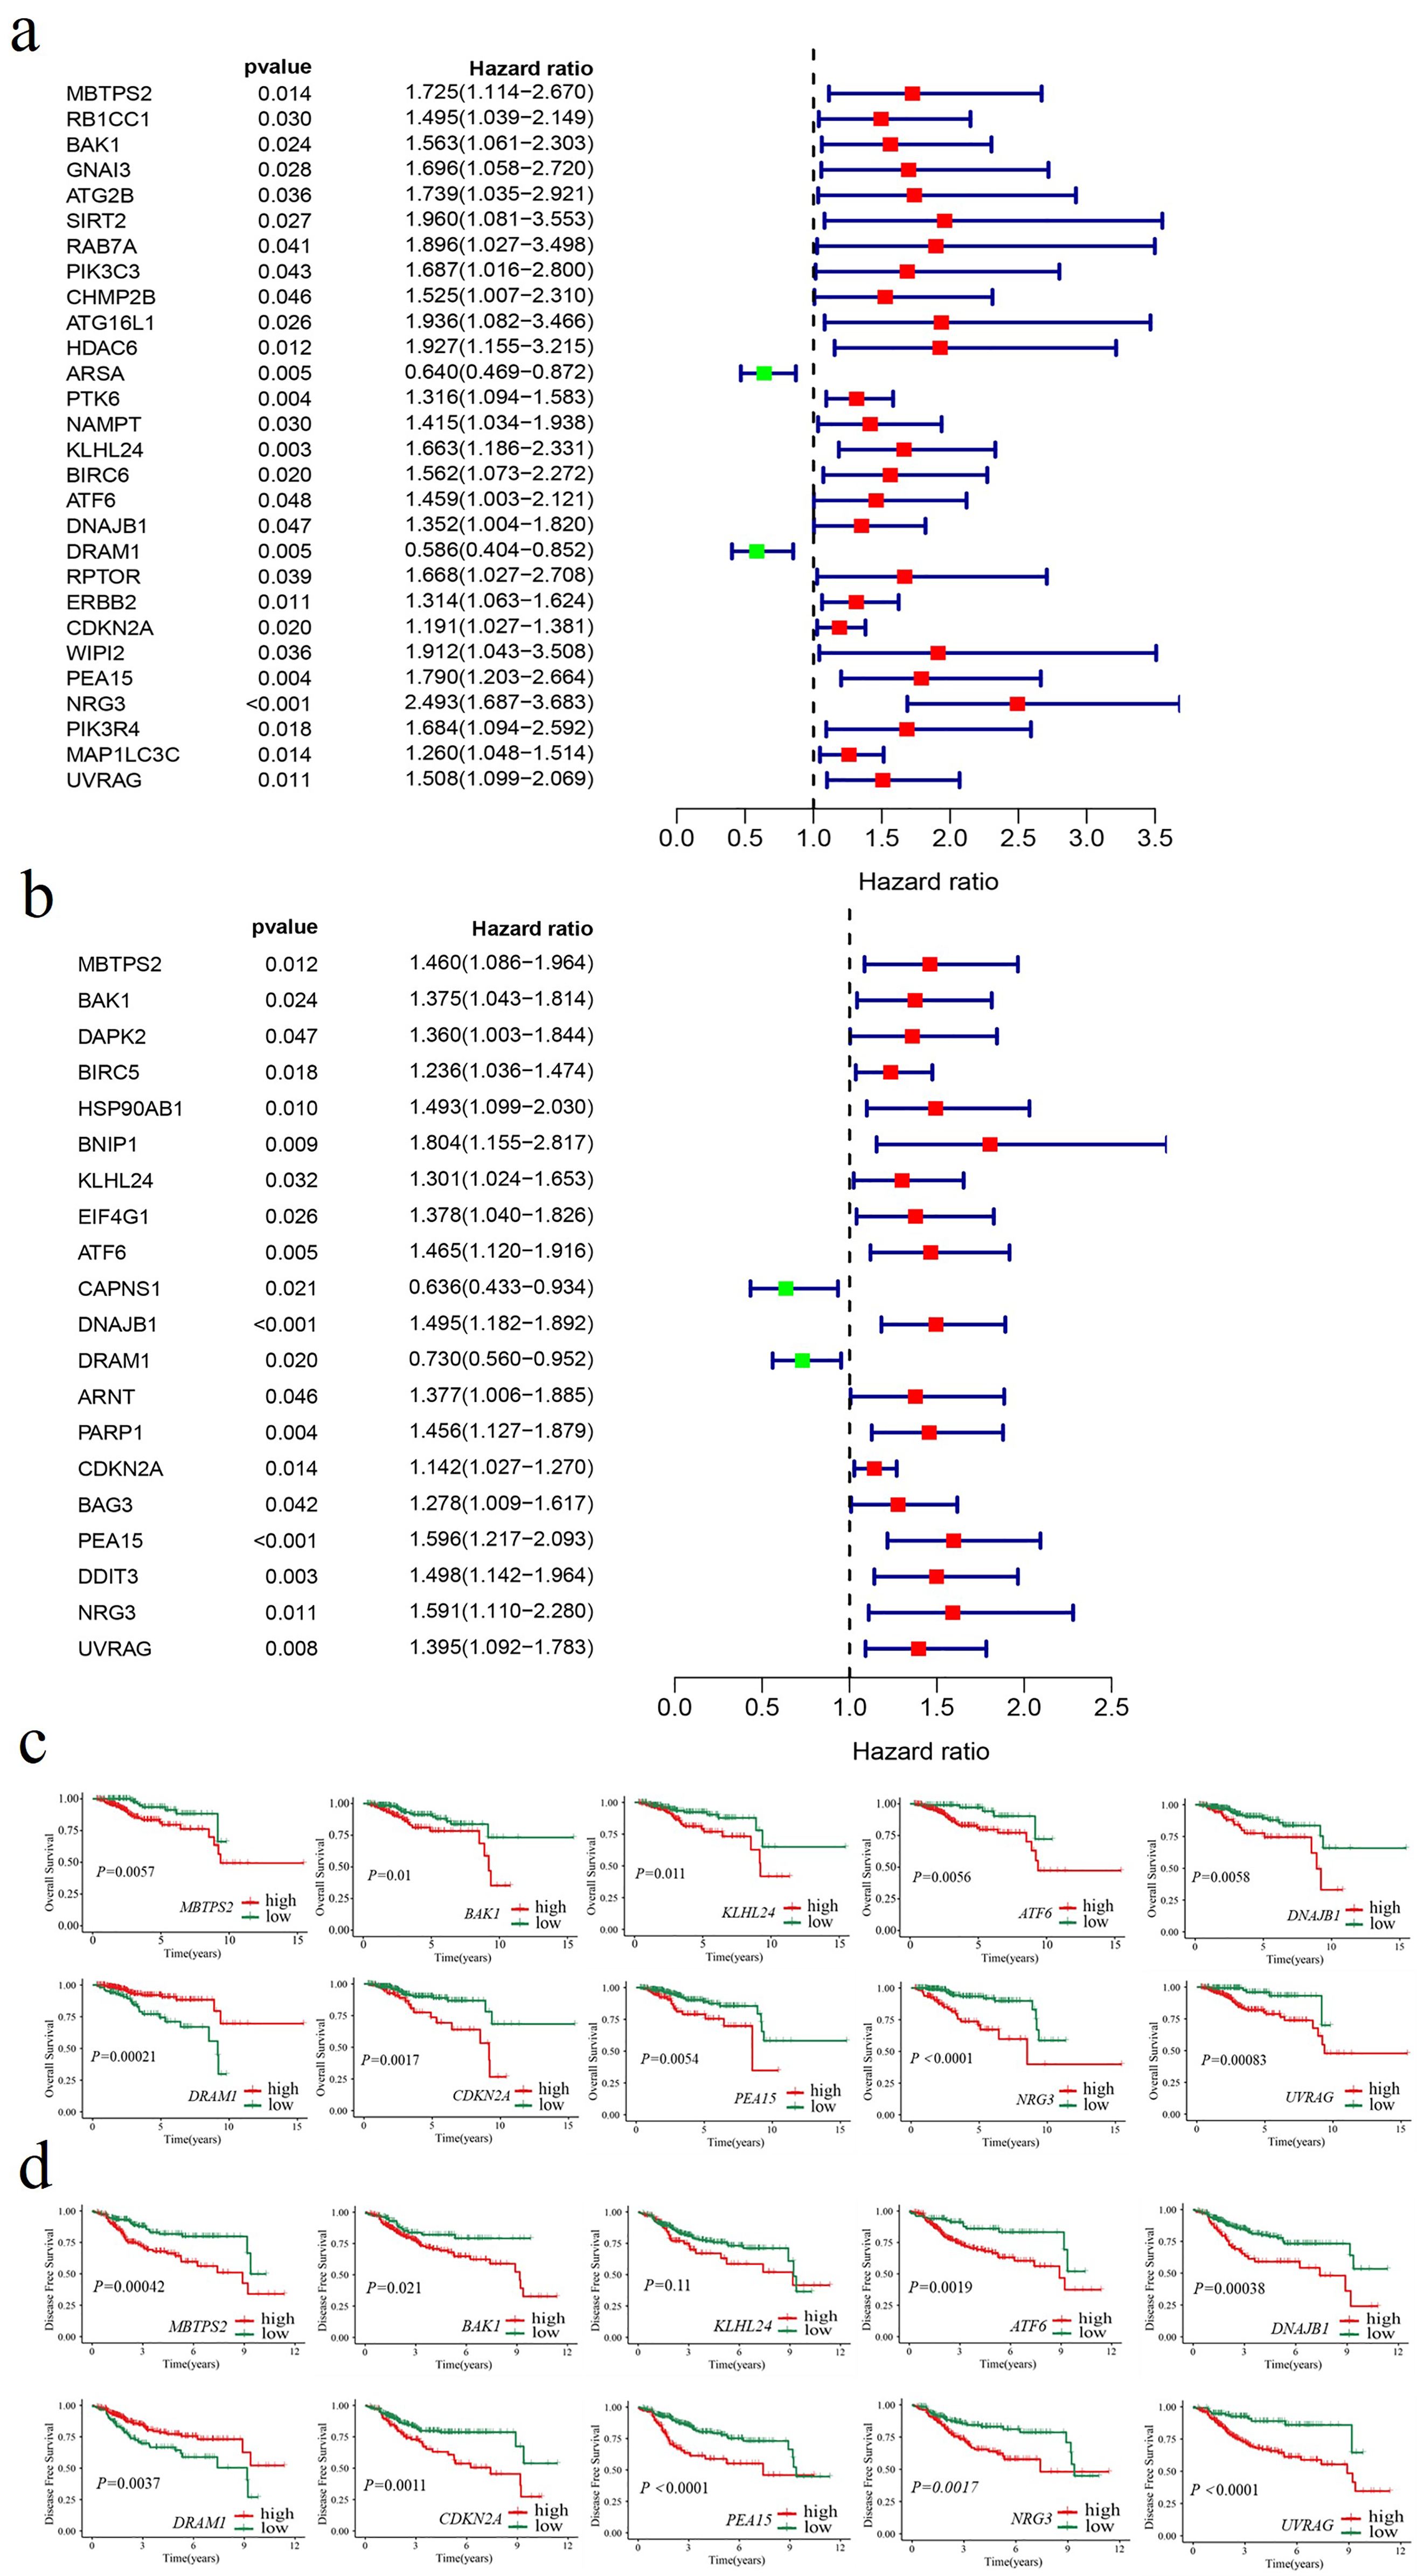
Identification of ARGs associated with survival. (a) Forest plot illustrating ARGs associated with OS based on univariate Cox regression analysis. Red denotes genes with a HR > 1, whereas green represents genes with an HR < 1. (b) Forest plot illustrating ARGs associated with DFS based on univariate Cox regression analysis. Red denotes genes with a HR > 1, whereas green represents genes with an HR < 1. (c) Kaplan–Meier curves showing OS for groups with high and low expression levels of the respective genes. (d) Kaplan–Meier curves showing DFS for groups with high and low expression levels of the respective genes.
Correlation analysis revealed significant co-expression among five genes—BAK1, KLHL24, ATF6, DNAJB1, and UVRAG—indicating potential multicollinearity, which may complicate their utility as independent prognostic indicators. In contrast, DRAM1, CDKN2A, PEA15, and NRG3 exhibited minimal correlations with other genes, suggesting their suitability for further multivariate analysis (Supplemental Figure 2a). Therefore, these four ARGs, along with classic clinicopathological factors—including age (≥ 60 years vs. < 60 years), histological type (endometrioid adenocarcinoma vs. non-endometrioid adenocarcinoma), FIGO stage (II vs. I), and histological grade (G2–3 vs. G1)—were included in the multivariate Cox regression analysis to evaluate their independent prognostic value in early-stage EC. The results revealed that histological grade (hazard ratio (HR) = 4.608, 95% confidence interval (CI): 1.072–19.803, P = 0.04) and NRG3 expression (HR = 1.838, 95% CI: 1.159–2.914, P = 0.01) were independent risk factors for OS (Supplemental Figure 2b). Additionally, PEA15 expression (HR = 1.458, 95% CI: 1.089–1.954, P = 0.011) emerged as an independent risk factor for DFS (Supplemental Figure 2c). These findings highlight the prognostic relevance of NRG3 and PEA15 in early-stage EC.
Combined application of molecular classification of ARGs and TCGA molecular classification
The Kaplan–Meier survival analysis revealed significant differences in OS (Figure 2(a)) and DFS (Figure 2(b)) among the four subtypes based on TCGA molecular classification of early-stage EC patients (all P < 0.05). Patients with POLE mutations had the most favorable outcomes, whereas those with CN-H tumors had the poorest outcomes. No significant differences in OS (P = 0.83) or DFS (P = 0.96) were observed between the MSI subgroup and the CN-L subgroup. To evaluate whether the independent risk factors for mortality and recurrence identified above could further stratify prognosis within these subtypes, Kaplan–Meier analysis was performed for MSI and CN-L patients. The results revealed that patients with high PEA15 expression had significantly shorter OS (Figure 2(c)) and DFS (Figure 2(d)) than did those with low PEA15 expression (all P < 0.05), indicating that PEA15 expression can effectively discriminate prognostic outcomes between the MSI and CN-L subtypes. These findings suggest that PEA15 serves as a valuable biomarker for refining risk stratification in early-stage EC.
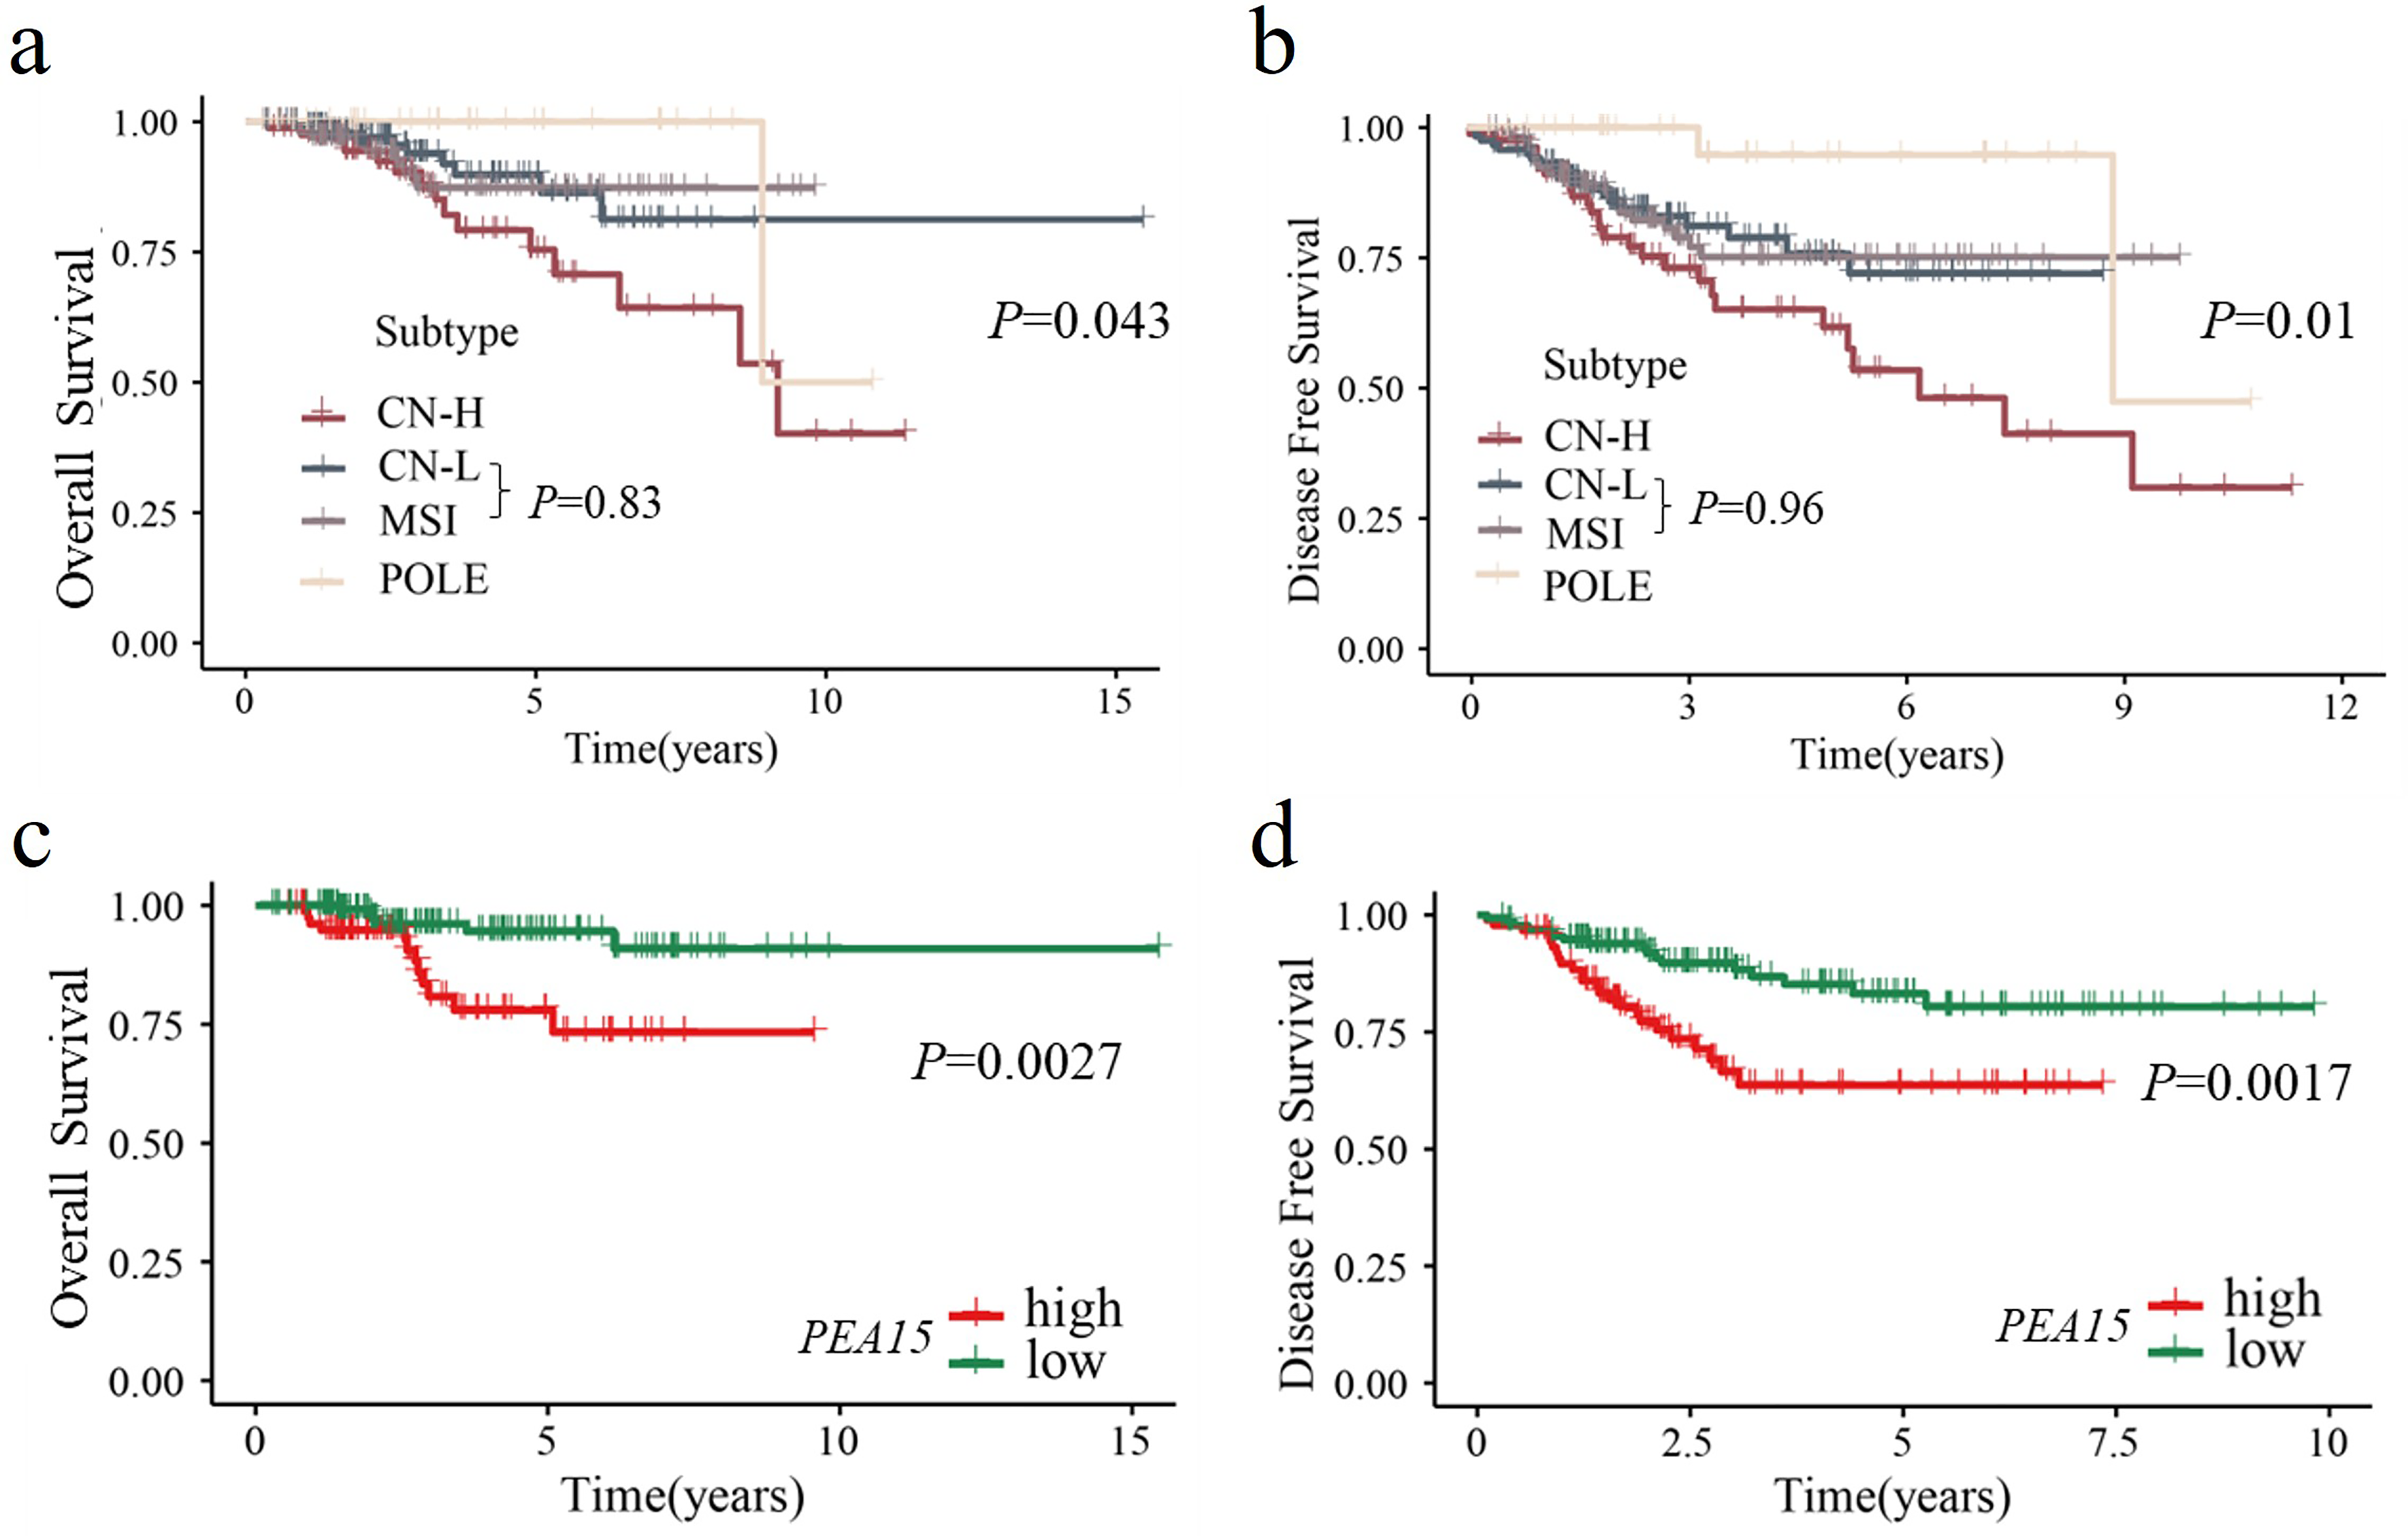
Kaplan–Meier curves of TCGA molecular classification and its correlation with PEA15. (a) Kaplan-Meier curves showing OS for early-stage endometrial cancer patients stratified by TCGA molecular classification: POLE, MSI, CN-L, and CN-H. (b) Kaplan–Meier curves showing the DFS of early-stage endometrial cancer patients stratified by TCGA molecular classification. (c) Kaplan–Meier curves showing OS for groups with high and low expression levels of PEA15 in samples with MSI and CN-L. (d) Kaplan–Meier curves showing DFS for groups with high and low expression levels of PEA15 in samples with MSI and CN-L.
Expression of PEA15 protein and prognosis in early-stage EC
To evaluate the protein expression of PEA15 in early-stage EC, IHC was performed on 99 early-stage EC samples (Supplemental Figure 3). PEA15 exhibited a distinct cell type-specific distribution, with prominent cytoplasmic expression observed in tumor cells and vascular smooth muscle cells. In contrast, other stromal components showed either no detectable expression or only faint, scattered positive expression. Among the tumor cells, PEA15 staining intensity varied across the cohort, ranging from negative (−) to strong (+++). For subsequent analyses, cases were stratified into two groups: low PEA15 expression (negative (−) or weak positive ( + )) and high PEA15 expression (positive (++) or strong positive (+++)).
The associations between PEA15 expression (high vs. low) and clinicopathological features—including age (< 60 years vs. ≥ 60 years), FIGO stage (IA vs. IB vs. II), histological grade (G1 vs. G2 vs. G3), depth of myometrial invasion (inner 1/2 vs. outer 1/2), pathological type (endometrioid adenocarcinoma vs. non-endometrioid adenocarcinoma), and lymphovascular space invasion (LVSI) status (positive vs. negative)—were further examined using the chi-square test. As summarized in Table 1, no significant correlations were observed between PEA15 expression and any of the clinicopathological parameters (all P > 0.05), suggesting that PEA15 expression is an independent factor not influenced by traditional prognostic variables in early-stage EC.
Correlations between PEA15 expression and clinicopathological features in early-stage EC patients.
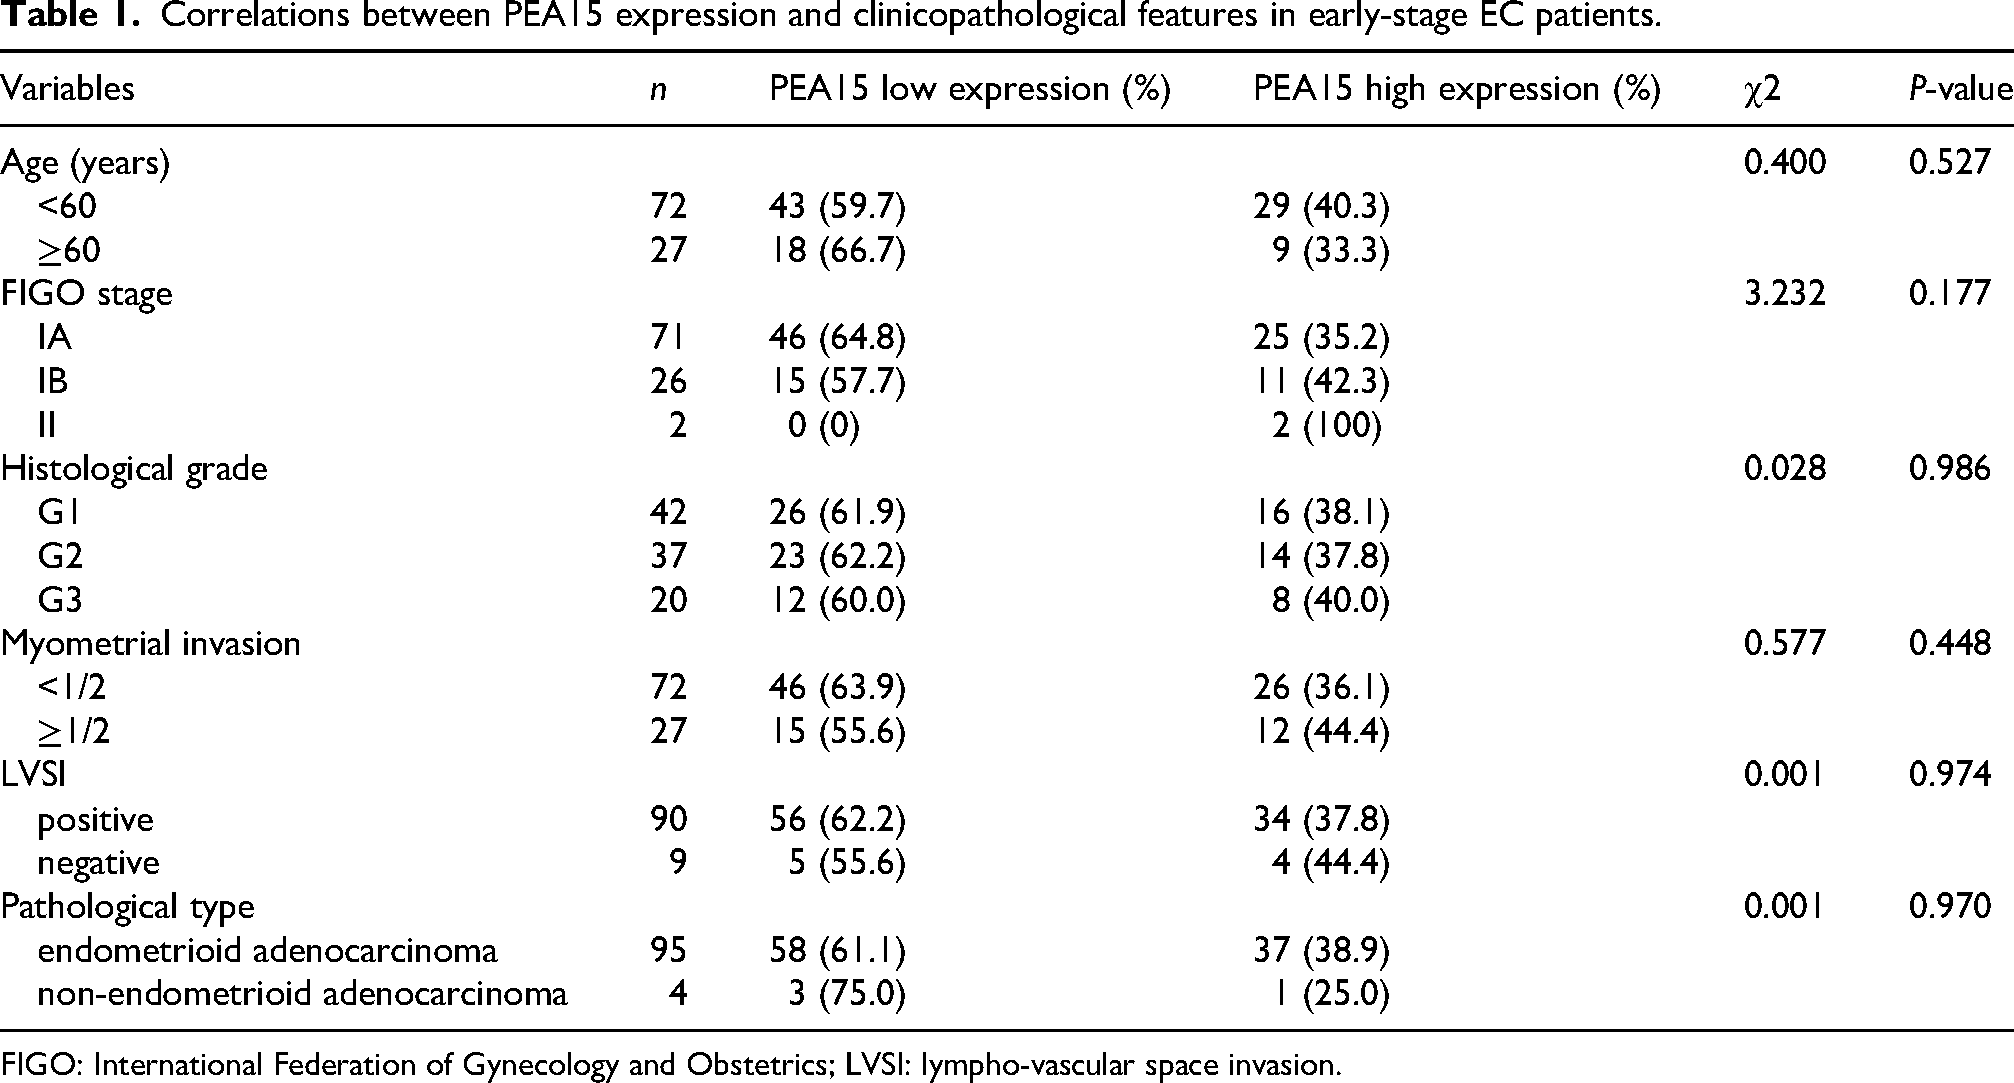
FIGO: International Federation of Gynecology and Obstetrics; LVSI: lympho-vascular space invasion.
Kaplan–Meier survival analysis revealed that patients with high PEA15 expression had significantly shorter OS (P = 0.029, Figure 3(a)) and DFS (P = 0.018, Figure 3(b)) than those with low PEA15 expression. To minimize the impact on statistical power, five patients meeting the criteria for FIGO stage II or non-endometrioid adenocarcinoma were excluded, as the cohort included only two FIGO stage II patients and four non-endometrioid adenocarcinoma patients. Univariate and multivariate Cox regression analyses of DFS were subsequently performed for the remaining 94 patients with stage I endometrioid adenocarcinoma. The results demonstrated that high PEA15 expression was consistently identified as a significant risk factor for recurrence in both univariate (HR: 8.487, 95% CI: 1.018–70.779, P = 0.048) and multivariate analyses (HR: 8.726, 95% CI: 1.023–74.442, P = 0.048), as summarized in Table 2. These findings underscore the prognostic significance of PEA15 as an independent indicator of recurrence in patients with stage I endometrioid adenocarcinoma.
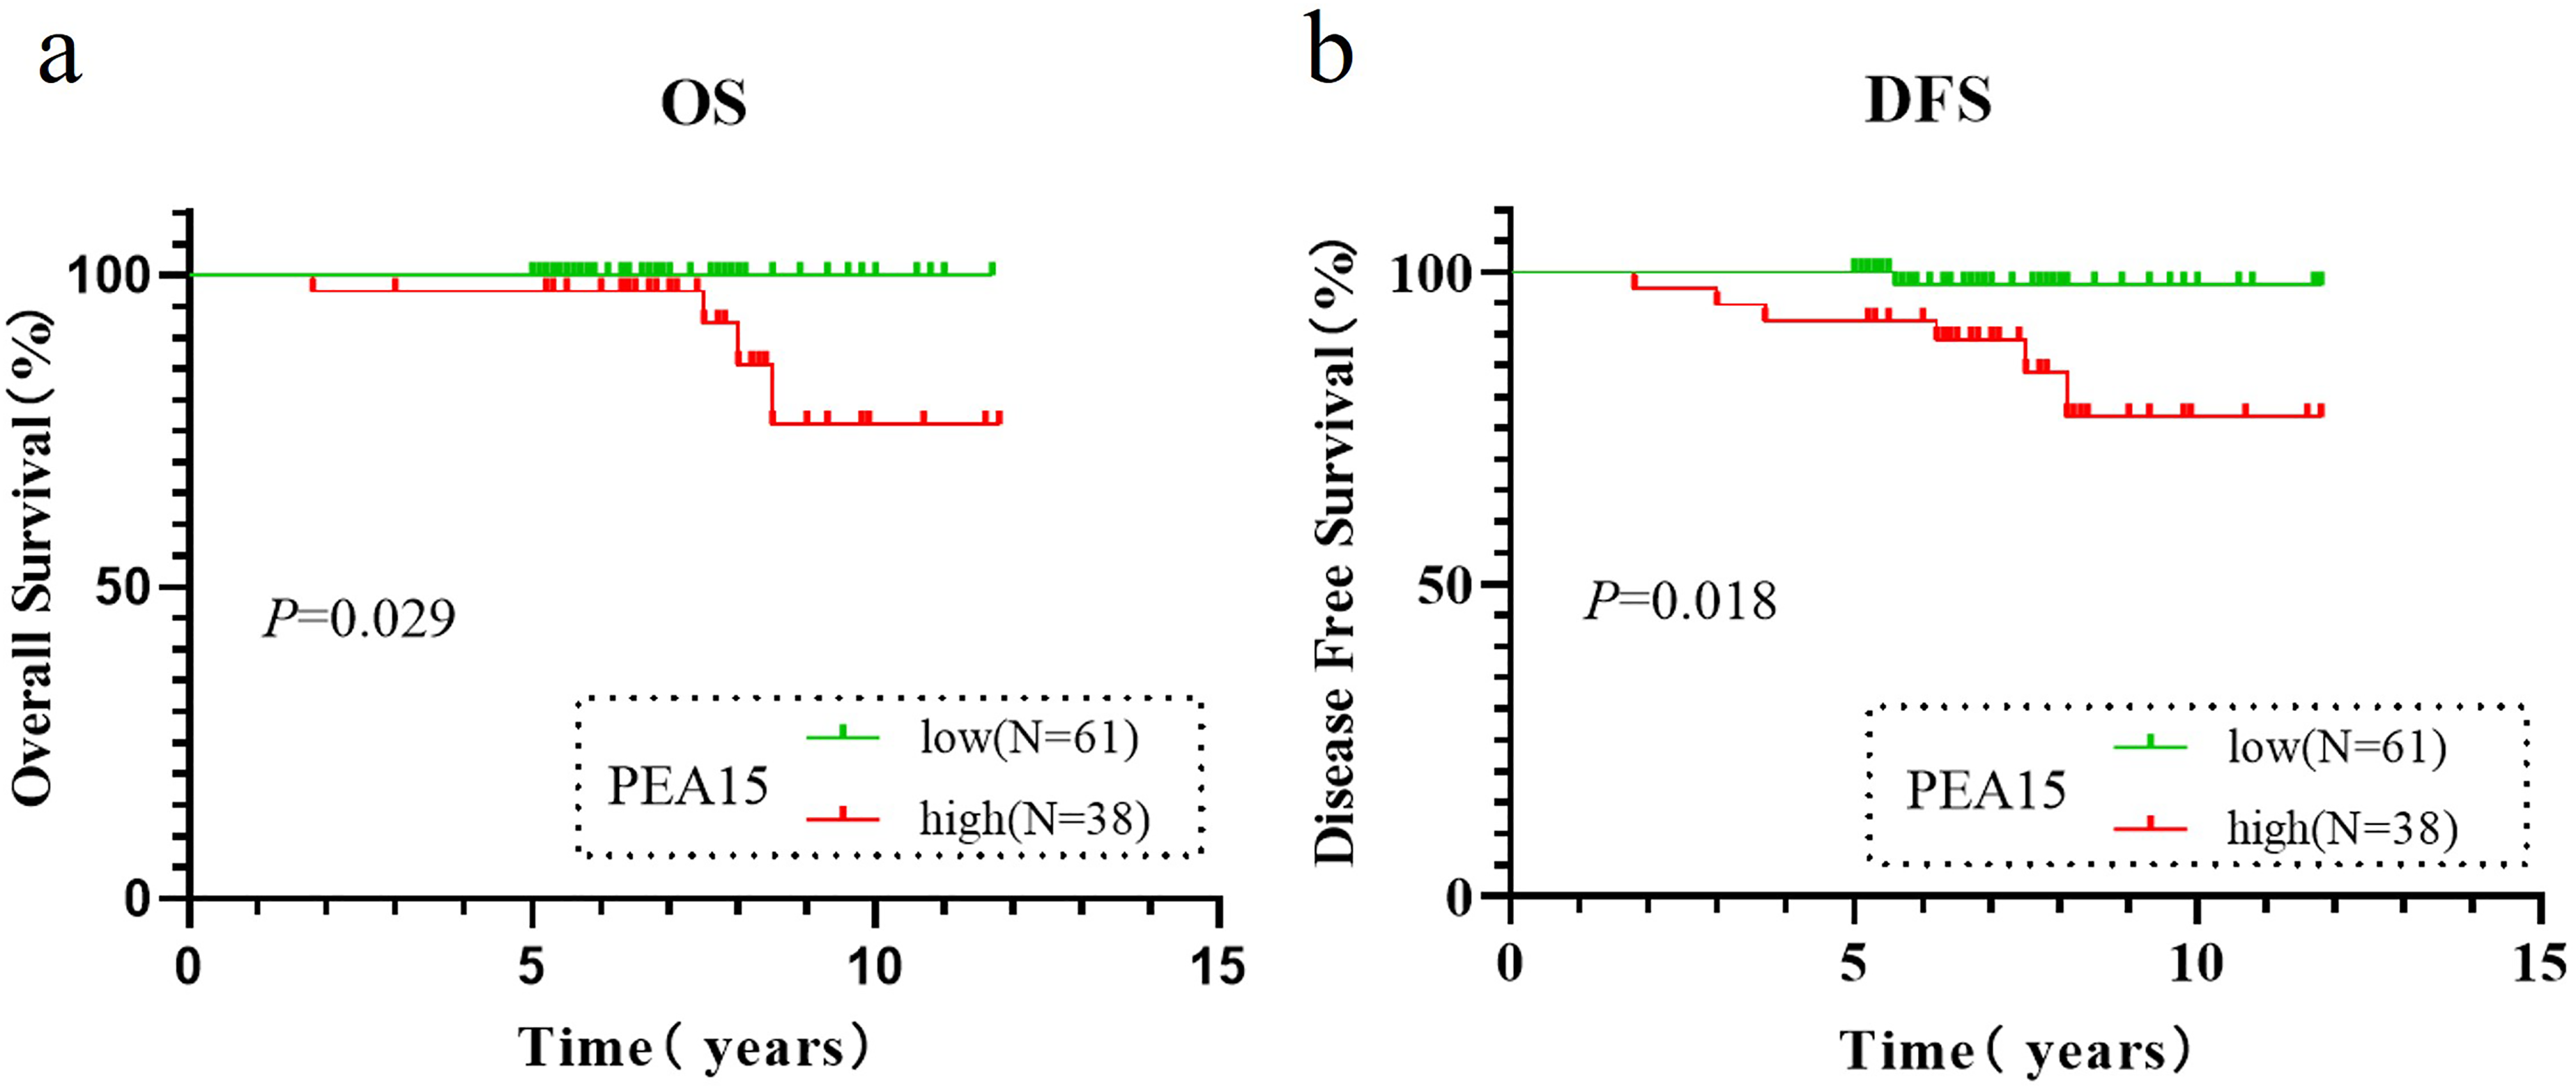
Kaplan–Meier survival analysis of PEA15 expression in early-stage EC patients by IHC. (a) Kaplan–Meier curves showing OS for groups with high and low PEA15 expression levels in patients with early-stage EC at our institution. (b) Kaplan–Meier curves showing DFS for groups with high and low PEA15 expression levels in patients with early-stage EC at our institution.
Univariate and multivariate cox regression analyses of DFS in patients with stage I endometrioid adenocarcinoma (n = 94).
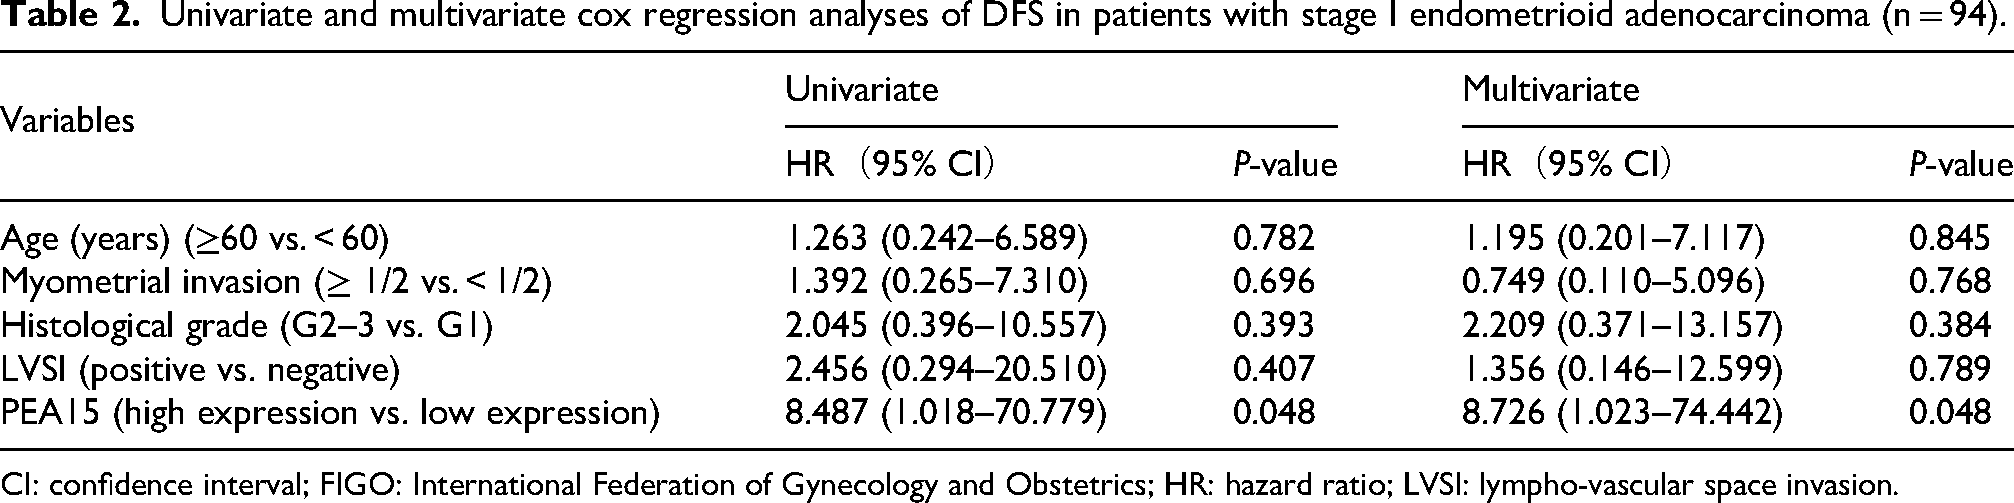
CI: confidence interval; FIGO: International Federation of Gynecology and Obstetrics; HR: hazard ratio; LVSI: lympho-vascular space invasion.
Discussion
The molecular classification of EC proposed by the TCGA has significantly advanced our understanding of the disease by categorizing EC into four subtypes: POLE-mutated, MSI, CN-L, and CN-H. This classification has provided valuable insights into tumor biology and prognosis, guiding clinical decision-making. However, challenges remain, particularly in distinguishing the risk of recurrence between the MSI and CN-L subtypes, which collectively constitute over 60% of the overall patient population and exhibit overlapping survival outcomes despite their distinct molecular profiles. 8 Our study identified PEA15, an autophagy-related gene, as a novel prognostic biomarker that refines the TCGA classification, particularly by improving risk stratification within the MSI and CN-L subgroups. By demonstrating the prognostic value of PEA15, our findings expand the utility of TCGA molecular subtyping and offer a more nuanced approach to assess recurrence in early-stage EC.
The TCGA molecular classification has emerged as a cornerstone in EC research, providing a framework for understanding tumor heterogeneity and guiding personalized treatment strategies. Recent studies have explored new molecular markers to complement TCGA classification. For example, Kommoss et al. identified L1 cell adhesion molecule (L1CAM) protein as a prognostic marker capable of refining the risk assessment of patients with molecular subtypes without specific molecular profiles (namely, the TCGA molecular subtype CN-L). 15 Similarly, Asmerom et al. demonstrated that FGFR2c expression was significantly associated with shorter progression-free survival in mismatch repair-deficient and p53 wild-type patients (namely, TCGA molecular subtypes MSI and CN-L), suggesting that its integration with molecular subtypes could increase prognostic accuracy. 16 These findings underscore the clinical relevance of TCGA subtypes while emphasizing the need for additional biomarkers to address their inherent limitations. Our study aligns with these efforts by identifying PEA15 as an independent risk factor for recurrence in early-stage EC. By integrating autophagy-related genes such as PEA15 into the TCGA framework, we provide a more nuanced molecular subtyping approach to assess prognosis, particularly for the MSI and CN-L subtypes, where traditional risk assessment tools exhibit limited discriminatory power. This approach enhances the clinical utility of the TCGA classification and offers a practical tool to optimize postoperative management. Notably, our study focused on early-stage EC, a population in which postoperative management critically depends on accurate risk stratification. While early-stage EC patients generally exhibit favorable outcomes, a subset remains at risk for recurrence. By addressing this gap, our findings not only refine TCGA subtyping but also provide actionable insights to improve patient outcomes in this clinically relevant population.
The PEA15 gene maps to human chromosome 1q23.2 and contains four exons. This gene encodes an astrocytic phosphoprotein 15 with a molecular weight of 15 kDa, which is predominantly localized to the cytoplasm. PEA15 plays an important role in a variety of physiological and pathological processes, especially cell proliferation and apoptosis.17–19 In the context of autophagy, PEA15 has been shown to modulate autophagic flux by interacting with LC3 and other autophagy-related proteins.,20–22 although its precise role is not fully elucidated. In cancer, PEA15 has been implicated in tumor progression and therapy resistance, with studies reporting its dysregulation in ovarian,22,23 gastric, 24 and colorectal cancer. 25 For example, in ovarian cancer, non-phosphorylated PEA15 overexpression has been reported to increase sensitivity to cisplatin, while the phosphorylation status of PEA15 may serve as a potential biomarker for predicting the response to cisplatin chemotherapy. 26 In gastric cancer, PEA15 is overexpressed in tumor tissues and is associated with tumor stage, differentiation, pathological type, and prognosis, suggesting its role as a prognostic indicator. 24 However, its role in EC has not been extensively studied, which has left a significant gap in our understanding of its prognostic and therapeutic potential. Our study is the first to systematically evaluate PEA15 as a prognostic biomarker in EC, demonstrating its association with recurrence risk and survival outcomes.
Despite these findings, our study has inherent limitations. The retrospective design and lack of TCGA molecular subtyping in our clinical cohort restrict the ability to characterize the prognostic performance of PEA15 across established molecular subtypes fully. Although we observed an association between PEA15 expression and recurrence risk, its biological mechanisms in EC—particularly concerning autophagy regulation—require further investigation. These findings need confirmation through prospective studies incorporating comprehensive molecular profiling.
Conclusions
Our findings identify the autophagy-related gene PEA15 as an independent prognostic biomarker in early-stage endometrial carcinoma. The incorporation of PEA15 expression analysis into the existing TCGA molecular classification framework has the potential to enhance risk stratification, particularly for discriminating clinical outcomes between the MSI and CN-L subtypes. Further validation in larger cohorts is warranted to confirm its clinical utility.
Supplemental Material
sj-docx-1-jbm-10.1177_03936155251383945 - Supplemental material for The autophagy-related gene PEA15 is a potential prognostic biomarker for early-stage endometrial carcinoma
Supplemental material, sj-docx-1-jbm-10.1177_03936155251383945 for The autophagy-related gene PEA15 is a potential prognostic biomarker for early-stage endometrial carcinoma by Qiao Qin, Guoqing Li, Jing Cai, Sha Hu and Liqiong Cai in The International Journal of Biological Markers
Supplemental Material
sj-tar-2-jbm-10.1177_03936155251383945 - Supplemental material for The autophagy-related gene PEA15 is a potential prognostic biomarker for early-stage endometrial carcinoma
Supplemental material, sj-tar-2-jbm-10.1177_03936155251383945 for The autophagy-related gene PEA15 is a potential prognostic biomarker for early-stage endometrial carcinoma by Qiao Qin, Guoqing Li, Jing Cai, Sha Hu and Liqiong Cai in The International Journal of Biological Markers
Footnotes
Acknowledgment
The authors thank the clinical staff who supported this study.
Ethics approval and consent to participate
TCGA-UCEC database(portal.gdc.cancer.gov/projects/TCGA-UCEC), cBioPortal for Cancer Genomics (cBioPortal for Cancer Genomics), and the Human Autophagy Database (HADb: Human Autophagy Database) are freely available to the public, and the patient identities in it are anonymous. This study was approved by the Ethics Committee of Wuhan Union Hospital. The patients/participants provided their written informed consent to participate in this study.
Author contributions
Conception: Qiao Qin, Jing Cai and Liqiong Cai
Interpretation or analysis of data: Qiao Qin and Guoqing Li
Preparation of the manuscript: Qiao Qin and Sha Hu
Revision for important intellectual content: Guoqing Li and Jing Cai
Supervision: Sha Hu and Liqiong Cai
Funding
The authors disclosed receipt of the following financial support for the research, authorship, and/or publication of this article: National Natural Science Foundation of China (grant number 82372932).
Declaration of conflicting interests
The authors declared no potential conflicts of interest with respect to the research, authorship, and/or publication of this article.
Availability of data and materials
The datasets generated during and/or analyzed during the current study are available from the corresponding author upon reasonable request.
Supplemental material
Supplemental material for this article is available online.
References
Supplementary Material
Please find the following supplemental material available below.
For Open Access articles published under a Creative Commons License, all supplemental material carries the same license as the article it is associated with.
For non-Open Access articles published, all supplemental material carries a non-exclusive license, and permission requests for re-use of supplemental material or any part of supplemental material shall be sent directly to the copyright owner as specified in the copyright notice associated with the article.