
Abstract
Aim
To evaluate cytokine and soluble programmed death ligand-1 (sPD-L1) levels in the serum and plasma of cancer patients treated with immunotherapy, and to test different assays.
Methods
Three Luminex xMAP assays and two ELLA microfluidic cartridges were used to screen 28 immune-related biomarkers in 38 paired serum and citrate-theophylline-adenosine-dipyridamole (CTAD) plasma samples collected from 10 advanced melanoma or non-small cell lung cancer (NSCLC) patients at different time points during immunotherapy.
Results
Twenty-three of 28 biomarkers were detected both in serum and plasma by at least one of the assays, including IL-1β, IL-2, IL-4, IL-5, IL-6, IL-8, IL-10, IL-12p70, GM-CSF, IFN-γ, TNF-α, VEGF, IP-10, MCP-1, eotaxin, fractalkine, G-CSF, IFN-α, IL-1RA, IL-13, IL-17A, MIP-1β and sPD-L1. Conversely, FGF-2 and IL-1α were not detected in both matrices; GRO-α factor and EGF were detected only in serum and MIP-1α only in plasma. sPD-L1, MCP-1, IFN-γ, IL-8, MIP-1β and VEGF were, respectively, 1.15-, 1.44-, 1.83-, 2.43-, 2.82-, 6.72-fold higher in serum, whereas IL-10, IL-4, IL-2 and IL-5 were 1.05-, 1.19-, 1.92- and 2.17-fold higher, respectively, in plasma. IP-10 levels were higher in plasma but, as well as for VEGF, the bias serum versus plasma varied depending on the assay used (IP-10: −5.7% to −145%; VEGF: 115% to 165%). No significant differences were found for the remaining nine analyzed cytokines.
Conclusion
The cytokine and sPD-L1 levels may differ between serum and plasma samples collected from cancer patients treated with immunotherapy, and the results obtained can be influenced by the different characteristics of the tested assays. The standardization of pre-analytical and analytical procedures is therefore needed for the future implementation of these circulating biomarkers in clinical practice.
Introduction
The clinical introduction of immune checkpoint inhibitors (ICIs) has revolutionized the treatment of solid neoplasms including melanoma and non-small cell lung cancer (NSCLC). 1 They act through an indirect stimulation of the immune system against neoplastic cells by inducing consistent and, often, durable anti-tumor responses. 1 ICIs act on immune cells within the tumor microenvironment, mainly by recruiting tumor-infiltrating lymphocytes and by modifying the production of inflammatory and immune-related factors. Changes of these molecules into the circulation can reflect treatment response or progression and anticipate immune-related adverse events and tumor hyperprogression.2,3
Changes in cytokine gene and protein expression occur early in patients treated with ICIs, by anticipating the response to treatment with respect to imaging evaluation.4,5 The measurement of circulating cytokines, facilitated by the advancement of immunoassays, has contributed to the knowledge of the relationship between immune response and cancer. However, robust evidence is still lacking to support the clinical utility of circulating cytokines and other soluble proteins measurements to predict immunotherapy response in the real world. 6 This uncertain scenario may not only reflect the complex biology of an inflammation signaling cascade, but also could be due—at least in part—to the unattained standardization of assay methods and inaccurate choice or preparation of biological samples.
The analysis of an expression profile of different cytokines may better reflect the real complexity of the inflammatory and immunological responses, which are highly dynamic and interactive processes involving a cascade of well-defined and distinct cellular and molecular events. 7 In this context, the availability of laboratory methods to simultaneously measure multiple cytokines and other inflammatory markers with high sensitivity and specificity is critical. Recent developments in cytokine quantification technology including Luminex® and ELLA™ offer an appropriate assessment of inflammatory response with a notable saving of costs and samples. However, despite the potential advantages of these new technologies, there is still a need for standardization of pre-analytical phases (including sample choice, collection, processing, and storage) and validation of analytical methods.
Among pre-analytical variables, little is known regarding the most suitable blood-derived matrix for the cytokine measurement in advanced cancer patients. Although circulating free proteins and cytokine levels can be measured using either plasma or serum samples, these matrices are not always interchangeable as their protein compositions/concentrations may be quite different.8–10
In the present study we comprehensively tested the agreement between the levels of 28 immune-related markers measured with different methods in serum and plasma pairs, collected from advanced melanoma and NSCLC patients during immunotherapy. Citrate-theophylline-adenosine-dipyridamole (CTAD) plasma was chosen as the plasma specimen to be tested as it represents the blood portion theoretically free from in vitro platelet activation. The present pre-analytical/analytical study is a preparatory step towards an extensive evaluation of cytokines and soluble programmed death-ligand 1 (sPD-L1) as predictive biomarkers for response and toxicity to immunotherapy in advanced melanoma and NSCLC patients.
Methods
Patients and samples
A total of 38 blood samples were collected at baseline and during immunotherapy from 10 advanced melanoma or NSCLC patients, at different time points, in three Italian cancer centers. Patient and sample characteristics are summarized, respectively, in Supplementary Tables 1 and 2.
Samples were collected from each patient after the protocol approval by the Ethic Committees of all participating centers and the informed consent form signature, in accordance with the current legislation, the Declaration of Helsinki and the Good Clinical Practice.
Whole blood samples were collected using standard venipuncture techniques, into one BD Vacutainer® Serum Separating Tube II Advance Tube (SST) containing micronized silica as clot activator and gel separator (Becton Dickinson, Franklin Lakes, NJ, USA) and two pre-chilled Vacuette® Tubes containing CTAD 0.11 M concentration for plasma (Greiner Bio-One, Kremsmünster, Austria). The serum tube was left at room temperature for 30–45 min for clot formation. The CTAD plasma tubes were left at room temperature for a maximum of 15 min. Samples were then centrifuged at +4°C for 15 min at 2500 g and serum or plasma immediately removed. Aliquots (500 μL) were immediately frozen, stored at −80°C at each site and sent to the IOV Biobank for storage until biomarker measurement. Standard operating procedures (SOPs) used for sample collection and processing are given in the Supplementary Material (Methods Section).
On the day of the analysis, the samples (subjected to only 1 freeze/thaw cycle) were thawed quickly at 37°C in a water bath (thawing modality tested in the present study; Supplementary Figure 1), centrifuged at +4°C for 10 min at 16.000 g and then kept at +4°C until the analysis.
Immunoassays for the measurement of cytokines and sPD-L1
Overall, the levels of 28 immune-related biomarkers, including interleukin (IL)-1α, IL-1β, IL-1 receptor antagonist (IL-1RA), IL-2, IL-4, IL-5, IL-6, IL-8, IL-10, IL-12p70, IL-13, IL-17A, epidermal growth factor (EGF), fibroblast growth factor (FGF)-2, granulocyte-colony stimulating factor (G-CSF), granulocyte macrophage colony stimulating factor (GM-CSF), growth-regulated protein (GRO)-α, interferon (IFN)-α, IFN-γ, interferon-inducible protein (IP)-10, monocyte chemotactic protein (MCP)-1, macrophage inflammatory protein (MIP)-1α, MIP-1β, sPD-L1, tumor necrosis factor (TNF)-α, vascular endothelial growth factor (VEGF), eotaxin and fractalkine were measured in duplicate in serum or CTAD plasma samples. All samples were diluted 1:2 directly in the plate, according to manufacturer's instructions.
Different panels of markers were tested to identify the assay method that allows an adequate determination of a greater number of biomarkers, including:
R&D Luminex Discovery Assay, Human Premixed Multi-Analyte Kit (Luminex xMAP technology; Bio-Techne, San Francisco, CA, USA), for the analysis of 18 analytes in 38 paired serum and plasma samples (total = 76): MCP-1, G-CSF, IFN-α, IFN-γ, IL-1α, IL-1β, IL-2, IL-4, IL-5, IL-6, IL-8, IL-10, IL-13, sPD-L1, IP-10, GM-CSF, IL-17A, TNF-α; R&D Luminex Performance Assay, Human High Sensitivity Cytokine Premixed Kit A (Luminex xMAP technology; Bio-Techne, San Francisco, CA, USA), for the analysis of 12 analytes 19 paired serum and plasma samples (total = 38): IL-1β, IL-2, IL-4, IL-5, IL-6, IL-8, IL-10, IL-12p70, GM-CSF, IFN-γ, TNF-α, VEGF; Millipore Human Cytokine/Chemokine/Growth Factor Panel A Bead Panel, 96-Well Plate Assay (Luminex xMAP technology; Merck EMD Millipore, Billerica, MA, USA) for the analysis of 27 analytes in 16 paired serum and plasma samples (total = 32): EGF, eotaxin, FGF-2, fractalkine, G-CSF, GM-CSF, GRO-α, IFN-α, IFN-γ, IL-1α, IL-1β, IL-1RA, IL-2, IL-4, IL-5, IL-6, IL-8, IL-10, IL-12p70, IL-13, IL-17A, IP-10, MCP-1, MIP-1α, MIP-1β, TNF-α, VEGF; Simple-Plex 16 samples cartridge for the analysis of three analytes in 8 paired serum and plasma samples (total = 16) on ELLA platform: TNF-α, MCP-1, VEGF (Bio-Techne); Simple-Plex 32 samples cartridge for the analysis of four analytes in 16 paired serum and plasma samples (total = 32) on ELLA platform: IL-6, IP-10, sPD-L1 (Bio-Techne).
Additional details about biomarker assessment are given in the Supplementary Material (Methods Section).
Mean intra-assay coefficients of variation in both matrices are presented for each biomarker in the Supplementary Table 3. The analytical sensitivity of each biomarker measured in the tested immunoassays are reported in Supplementary Table 4.
Data elaboration and statistical analysis
In CTAD plasma the proportion of blood to the CTAD solution is 9:1. Therefore, biomarker levels in CTAD plasma were multiplied by a correction factor of 1.1.
The Kolmogorov-Smirnov test was used to test if data fitted a normal distribution. Subsequently, as this did not occur, a non-parametric Friedman test was performed followed by a post-hoc Wilcoxon signed-rank test to compare three or more paired groups. Spearman coefficient of correlation ρ was used to assess correlation between pairs of variables. Passing Bablok and Bland–Altman plot analysis were used to assess agreement between biomarker levels found in the blood matrices. 11 For Bland–Altman analysis, the percentage differences between the two measurements was plotted against the mean of the two measurements obtained by the two blood matrices and showing the limits of agreement (mean difference ± 1.96 SD of the difference) in which approximately 95% of the differences were situated. The mean percentage difference represents the estimated bias, and SD of the differences measures the random fluctuations around the mean. 12 MedCalc Statistical Software version 15.11.4 (MedCalc Software bvba, Ostend, Belgium) and Origin 8.1 software (Origin Lab, Northampton, Massachusetts, USA) were used to perform statistical analyses, with statistical significance defined as P < 0.05.
Results
A screening of measurable molecules in matched serum and plasma samples was carried out to identify the blood matrix that allows the determination of a greater number of biomarkers. Three commercial Luminex assays and two Simple-Plex cartridges, differing in analytical sensitivity, panel of selected cytokines and manufacturing company were evaluated.
Globally, 28 immune-related biomarkers were screened in paired serum and plasma samples. A total of 25 and 24 of 28 biomarkers were detectable in serum and plasma, respectively, (levels above the sensitivity of the assay). As shown in Figure 1, the levels of 23 markers exceeded the fixed arbitrary criterion (at least 30% of detectability) both in serum and CTAD plasma when measured by at least one of the tested assays. These biomarkers included: IL-1β, IL-2, IL-4, IL-5, IL-6, IL-8, IL-10, IL-12p70, GM-CSF, IFN-γ, TNF-α, VEGF, IP-10, sPD-L1, MCP-1, eotaxin, fractalkine, G-CSF, IFN-α, IL-1RA, IL-13, IL-17A, MIP-1β.
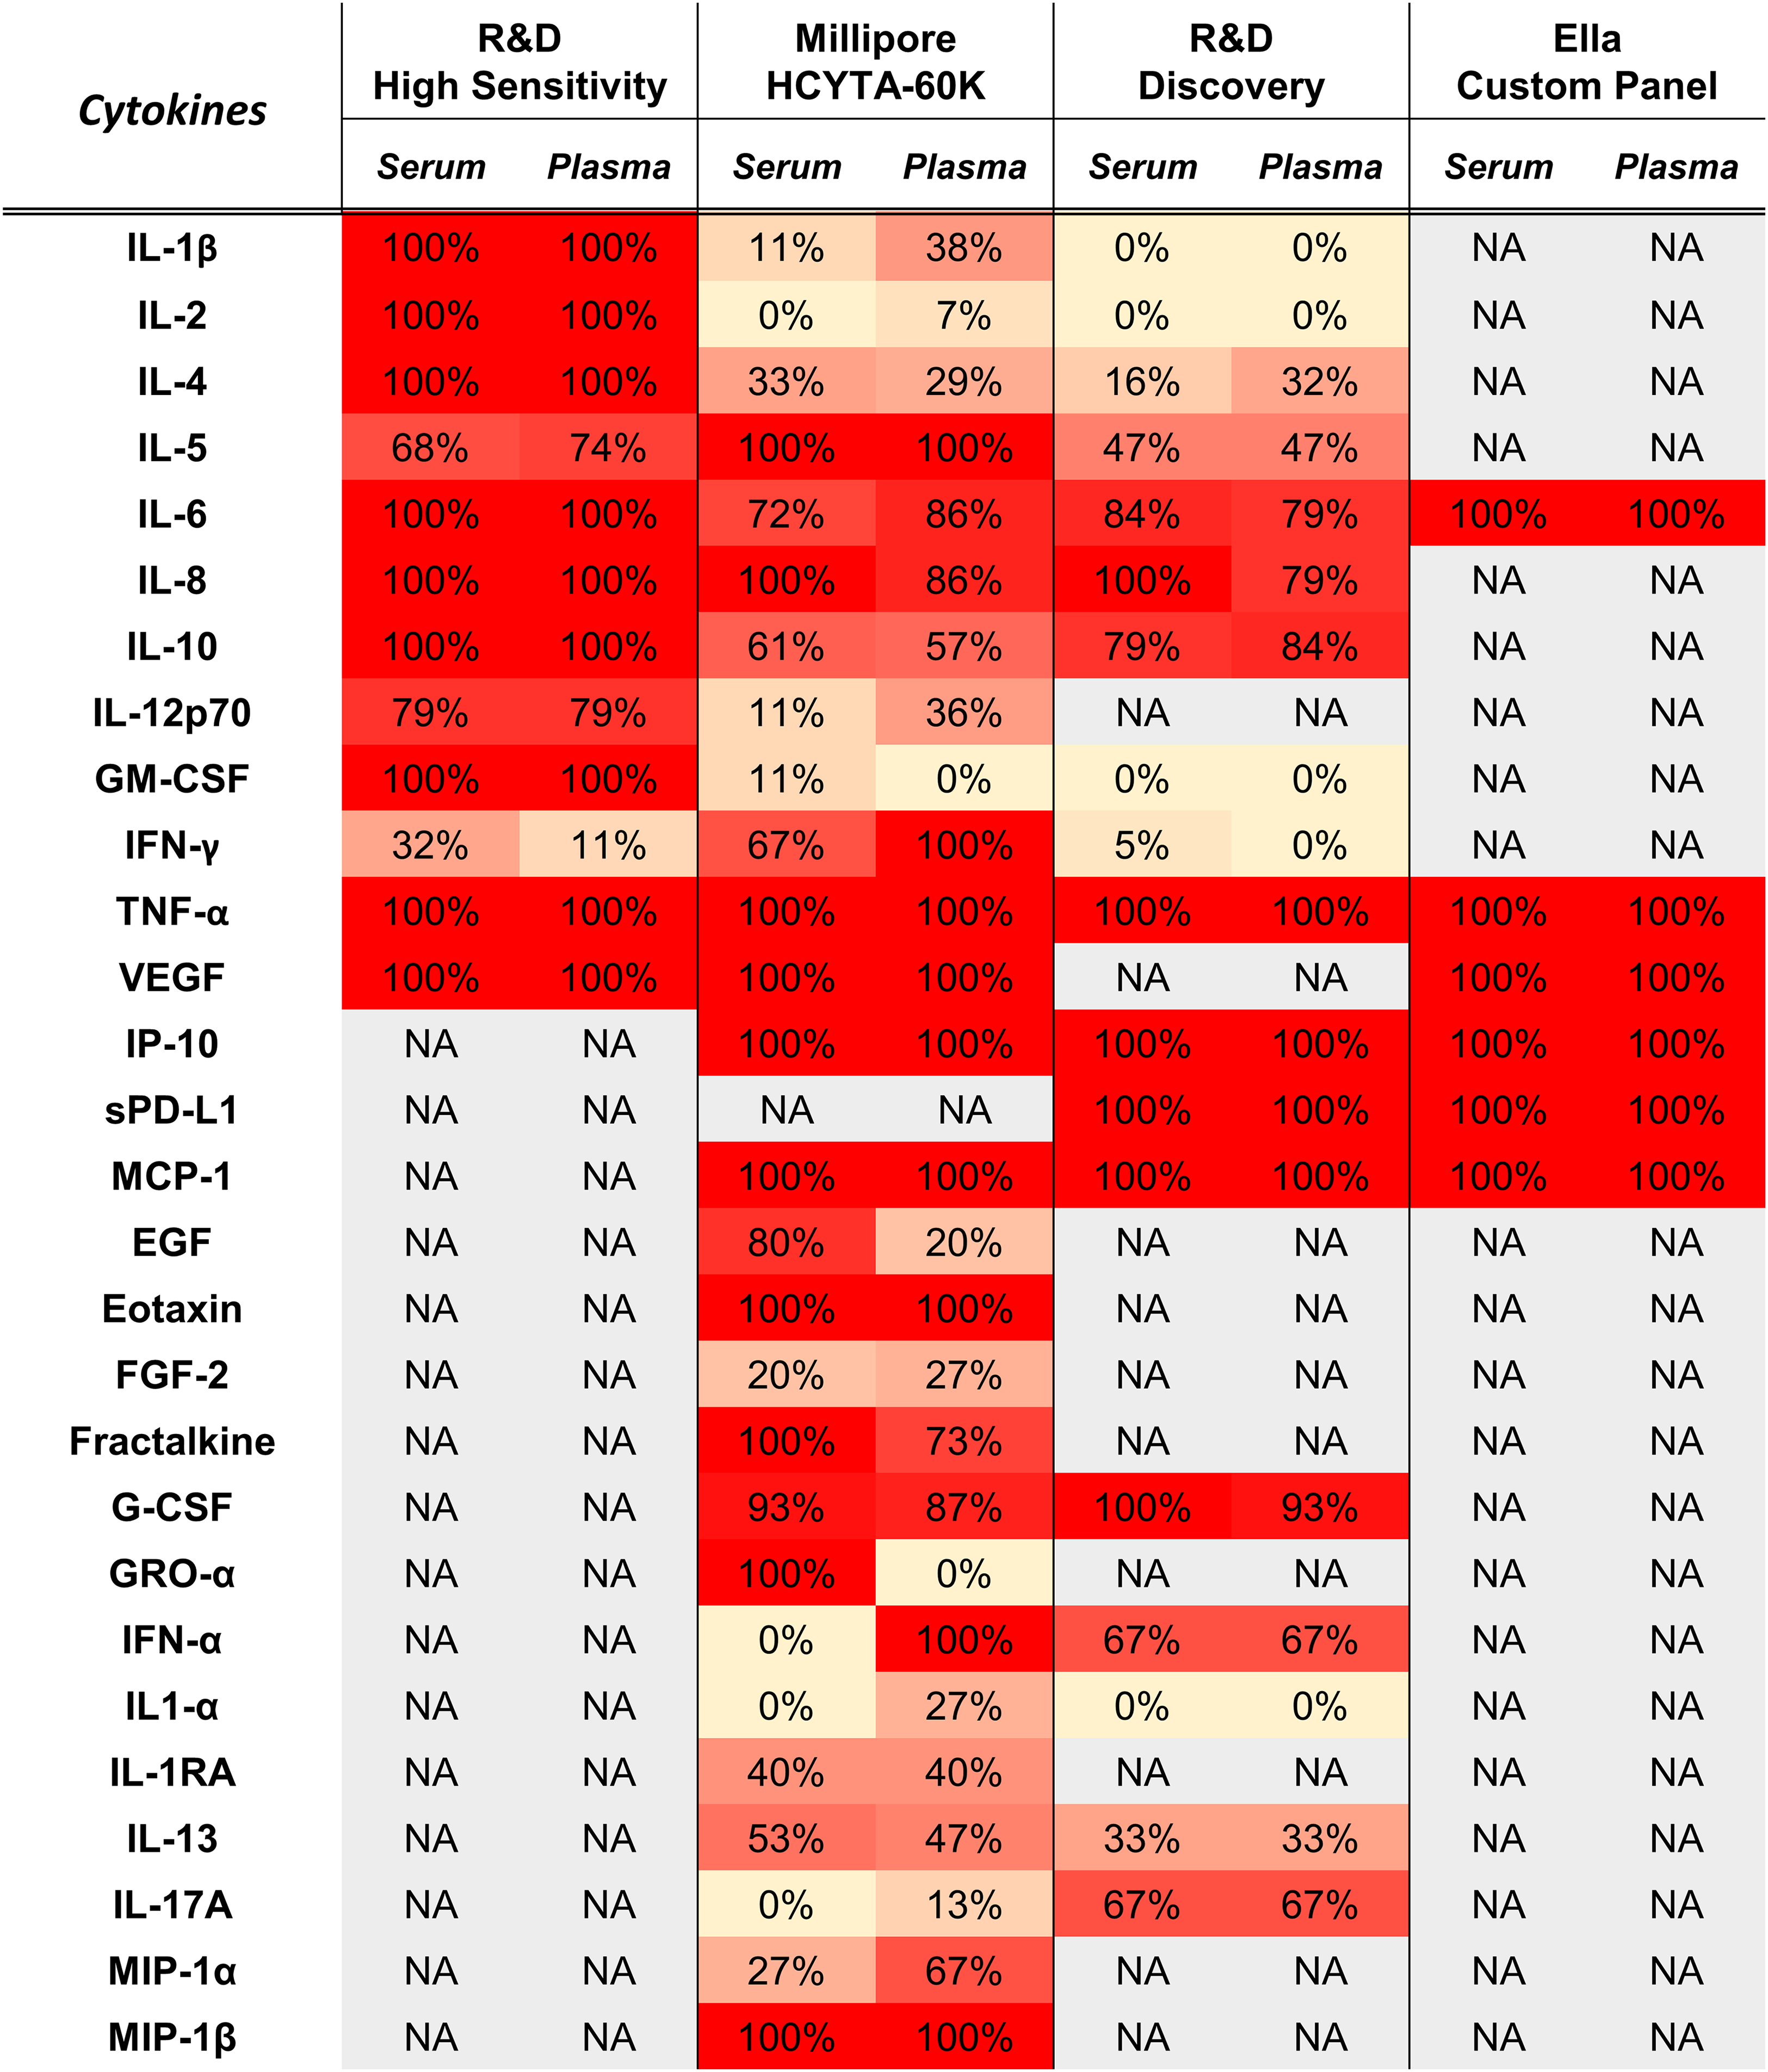
Heatmap representing the percentage of serum or CTAD plasma samples from advanced melanoma and NSCLC patients treated with ICIs whose examined biomarker levels are above the analytical sensitivity of the method declared by the manufacturer.
Conversely, FGF-2 and IL-1α were not detectable in more than 30% of serum or CTAD plasma samples. GRO-α factor and EGF were satisfactorily detected only in serum, whereas MIP-1α only in plasma. IFN-α was also excluded from subsequent analysis as, although its levels were measured by R&D Discovery assay in both matrices, they did not fall within the assay range, being always below the lowest point of the standard curve. To ensure a sufficient sample size for the comparison analysis, serum and CTAD plasma were compared for those biomarkers whose levels exceeded the method sensitivity threshold for at least 50% of the tested samples. IL-1RA and IL-13 did not meet this criterion and were not considered for the comparison analysis. In fact, for IL-1RA measured in serum, only 7 patients from a total of 16 had levels > 1.2 pg/ml, the value declared as the assay sensitivity. Therefore, 20 out of 23 markers detectable both in serum and plasma were evaluated for differences between blood-derived matrices.
In Figure 2 are shown the serum and plasma levels of the nine biomarkers measured by at least two different methods in at least 50% of samples.
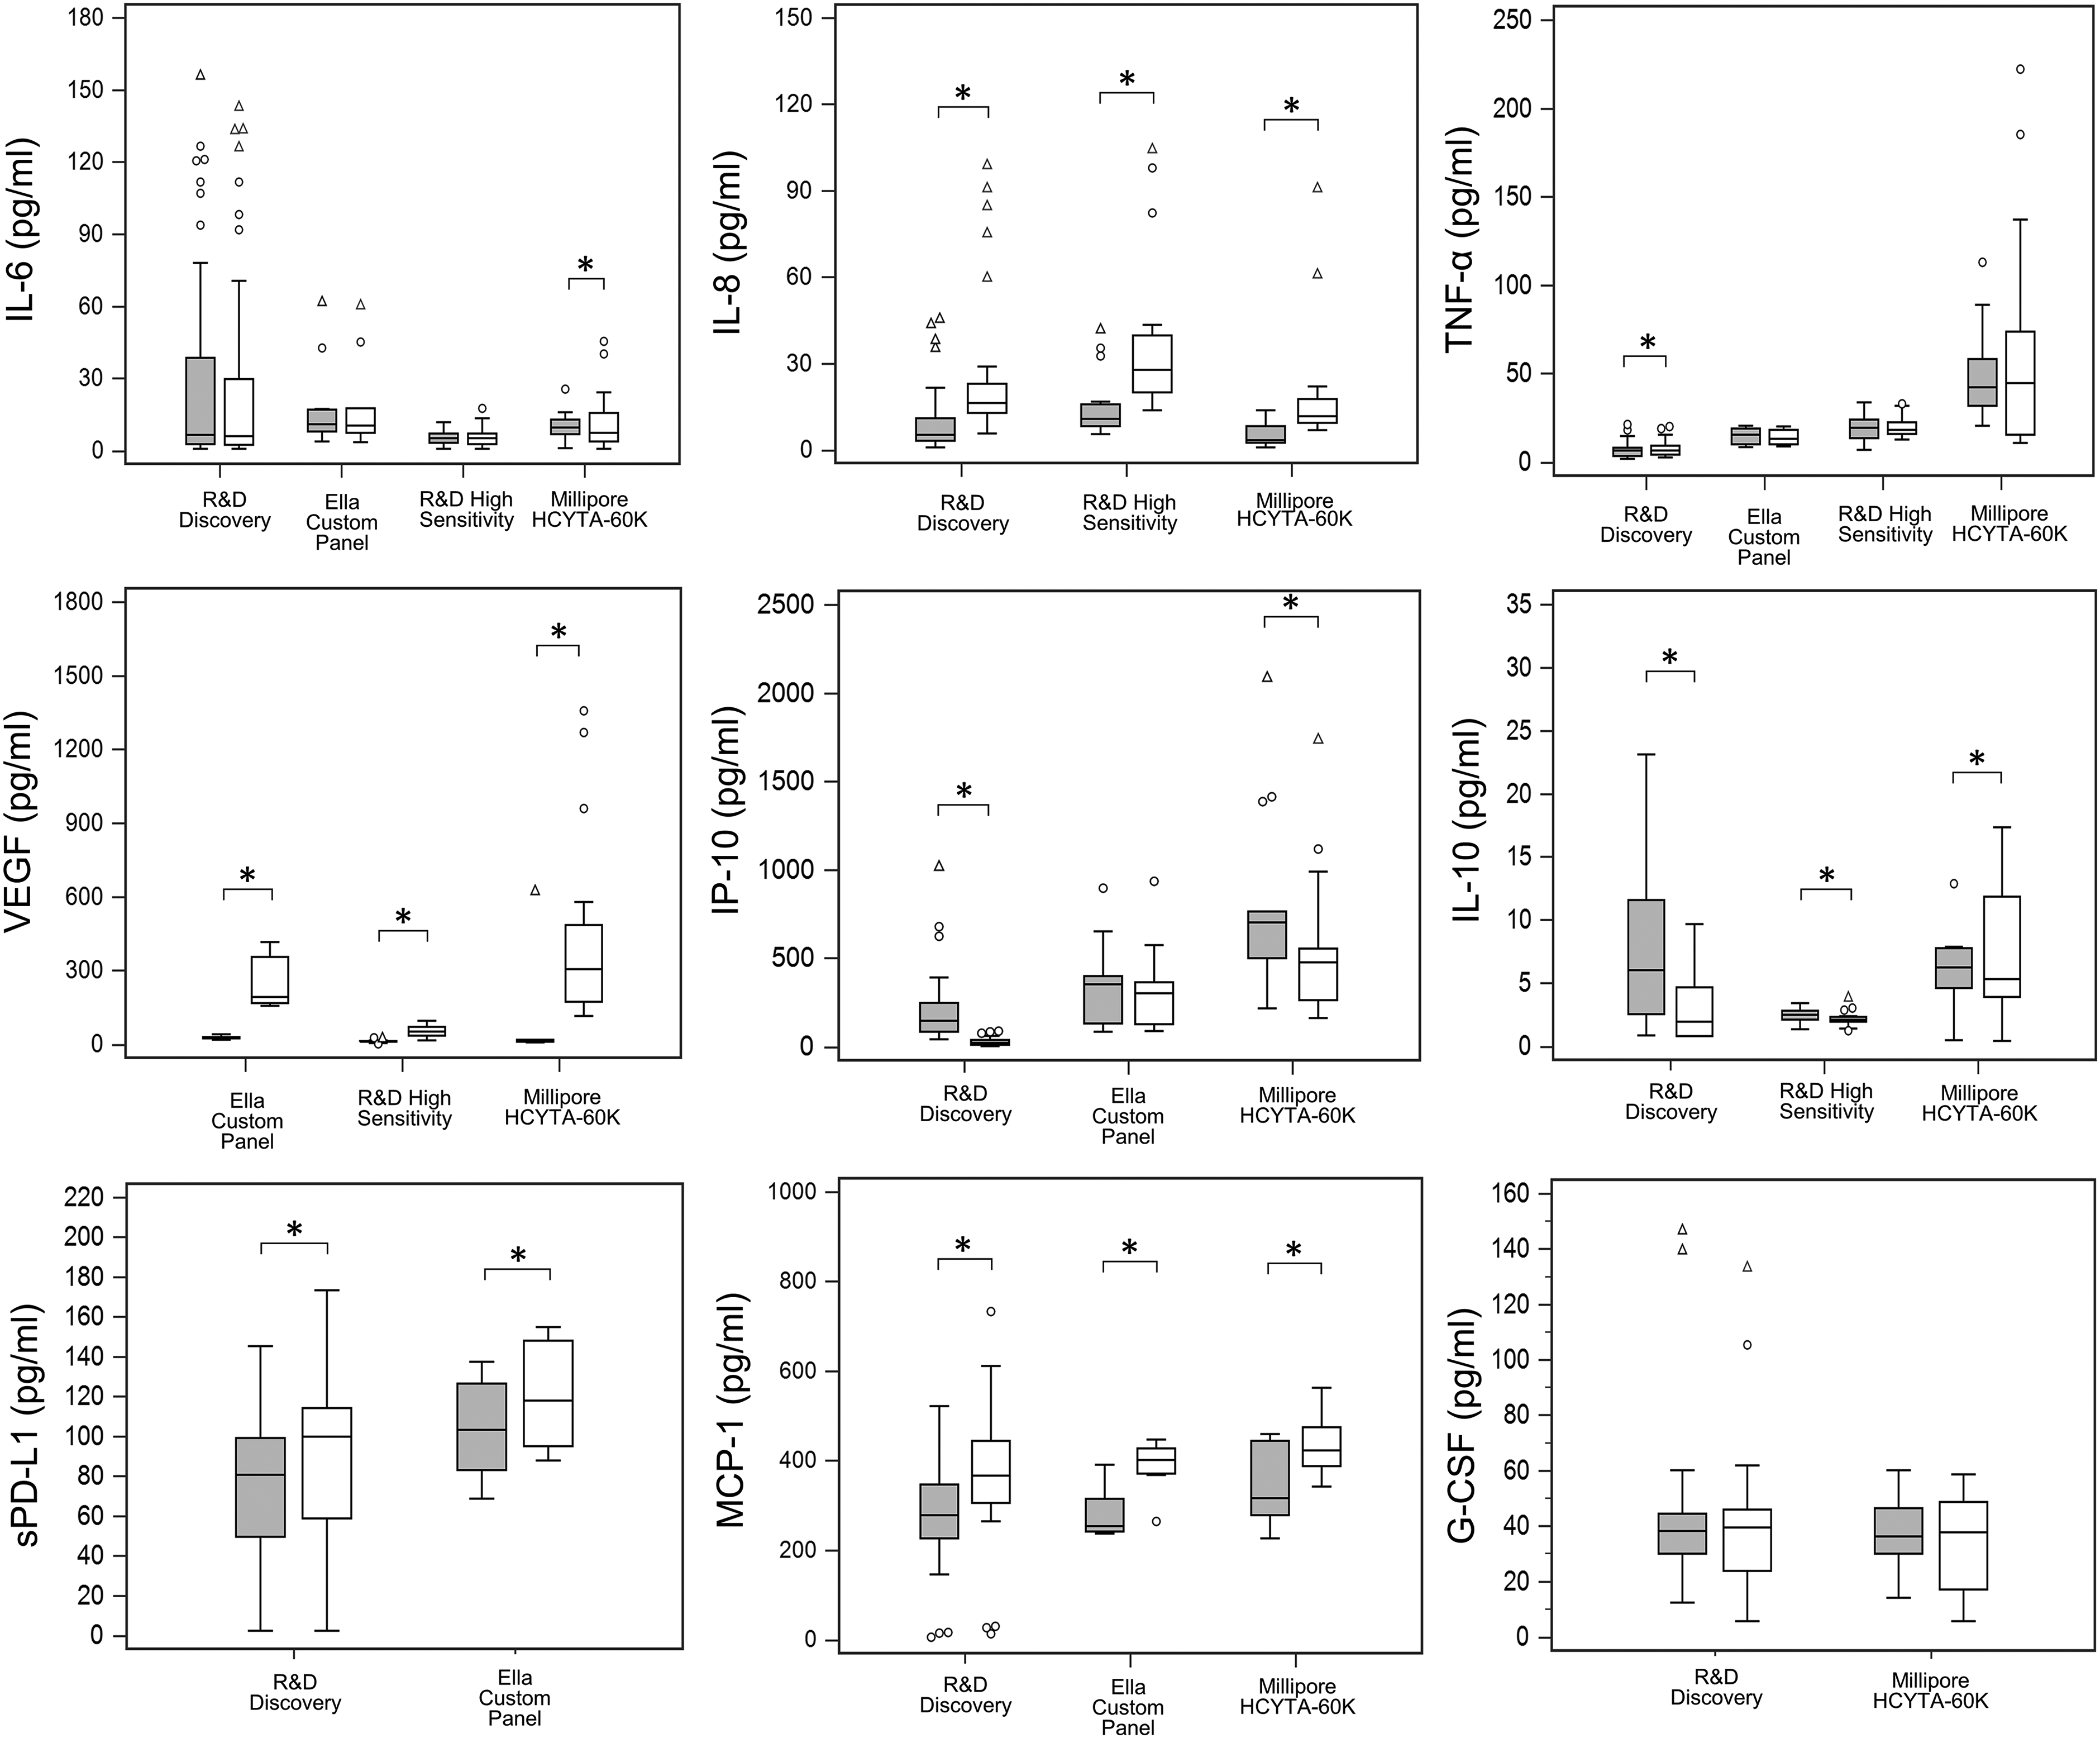
Comparison of measured serum and CTAD plasma levels of IL-6, IL-8, TNF-α, VEGF, IP-10, IL-10, MCP-1, G-CSF, and sPD-L1 using different assays. Box-plots describing the distribution profile of different immune-related biomarker levels measured by different assays in CTAD plasma (grey boxes) and in serum (blank boxes) samples collected from advanced melanoma or NSCLC patients treated with ICIs. The central lines represent the median values; inferior and superior lines in the box indicate 25% and 75% percentile, respectively; and the 10% and 90% percentiles are displayed at the whiskers.
A heatmap was generated to visually exemplify shared cytokine analyte measurements by serum and plasma (Figure 3). As illustrated, the cytokines more abundant in the analyzed samples were VEGF, IP-10, MCP-1, eotaxin, fractalkine, IL-13, and sPD-L1, which presented median levels superior or around 100 pg/mL.

Immune-related biomarker profiles in serum and CTAD plasma samples from advanced melanoma and NSCLC patients treated with ICIs. Concentration values are reported in logarithmic scale. (a) Box-plot describing the distribution profile of different immune-related biomarker levels in serum and CTAD plasma samples. The central lines represent the median values; inferior and superior lines in the box indicate 25% and 75% percentile, respectively; and the 10% and 90% percentiles are displayed at the whiskers. (b) and (c) Heatmap generated to visually exemplify biomarker levels in serum (panel (b)) and CTAD plasma (panel (c)). A histogram showing the color key used to designate sample concentrations is provided on the right of the main images. Each cell represents a single analyte in a single sample. Red cells indicate higher measured biomarker levels for that sample, and yellow cells indicate lower biomarker levels, with color intensity indicating magnitude of difference. Gray cells mean that data on biomarker levels for those specific samples is not available.
For the comparative evaluation of the biomarker expression profile between serum and CTAD plasma, a dedicated assay was selected and fixed for an in-depth analysis considering three parameters: number of samples analyzed, sensitivity of the method, and detectability (proportion of measured samples whose biomarker levels fall within the dynamic range of the curve).
In Figure 4 are represented the results obtained for biomarkers measured by a single assay or by those for which no apparent method-related differences were found. The box-plot distribution, Bland–Altman plots, and Passing-Bablok regression analysis are shown exclusively for those markers for which differences between levels in serum and CTAD plasma samples were found.

Comparative analysis of levels differently expressed in serum versus CTAD plasma samples from advanced cancer patients during therapy with ICIs for biomarkers in which no apparent method-related differences were found. (a) Biomarkers higher in serum. (b) Biomarkers higher in plasma. Left panels: Biomarkers presenting a statistically significant difference between CTAD plasma and serum level distributions (non-parametric Wilcoxon test for paired samples, *P < 0.05). Middle panel: Passing-Bablok regression analyses for biomarker levels in serum versus CTAD plasma and Spearman correlation results (criterion used for Spearman's rho interpretation: 0–0.19: no correlation, 0.2–0.39: low correlation, 0.40–0.59: moderate correlation, 0.60–0.79: moderately high correlation, ≥ 0.80: high correlation). Right panel: Bland-Altman analysis. The percentage differences between biomarker levels in the two matrices are shown on the Y-axis, and provide a visual assessment of estimated systematic differences in measurement between matrices when the mean value deviates from 0. A positive shift in the mean indicates that the biomarker is higher in serum and a negative shift indicates that the biomarker is higher in plasma. Mean analyte levels (in pg/mL) are shown on the X-axis. The ±1.96 SD lines represent the 95% limits of agreement.
For 11 markers (IL-8, sPD-L1, MCP-1, IL-4, IL-10, IP-10, IL-1β, IL-6, GM-CSF, TNF-ɑ, G-CSF) positive moderately high or high correlations were found between biomarker levels in the two matrices as can be noted from values of correlation coefficients-Spearman’s rho higher than 0.7 (Figure 4, Figure 5, Supplementary Figure 2; middle panels).

Comparative analysis of levels in serum versus CTAD plasma samples from advanced cancer patients during treatment with ICIs of (a) IP-10 and (b) VEGF for which apparent method-related differences were found. Left panels: Biomarkers presenting statistically significant differences between CTAD plasma and serum level distributions (non-parametric Wilcoxon test for paired samples, *P < 0.05), but discordant among tested methods. Middle panel: Passing-Bablok regression analyses for biomarker levels in serum versus CTAD plasma and Spearman correlation results (criterion used for Spearman's rho interpretation: 0–0.19: no correlation, 0.2–0.39: low correlation, 0.40–0.59: moderate correlation, 0.60–0.79: moderately high correlation, ≥ 0.80: high correlation). Passing Bablok regression analysis was not possible to perform for VEGF measured by Millipore and ELLA assays as VEGF levels in serum an CTAD plasma were not positively correlated, which is an assumption for the proper application of this analysis for method comparison. In these cases, the relationship between VEGF levels in serum an CTAD plasma was assessed using a scatter plot and Spearman's rho correlation. Right panel: Bland-Altman analysis. The percentage differences between biomarker levels in the two matrices are shown on the Y-axis, and provide a visual assessment of estimated systematic differences in measurement between matrices when the mean value deviates from 0. A positive shift in the mean indicates that the biomarker is higher in serum and a negative one indicates that the biomarker is higher in plasma. Mean analyte levels (in pg/mL) are shown on the X-axis. The ±1.96 SD lines represent the 95% limits of agreement.
No significant differences were found between the distribution levels in serum and plasma for nine cytokines: IL-1β, IL-6, IL-12p70, IL-17A, GM-CSF, G-CSF, TNF-α, eotaxin, fractalkine. For these cytokines, in Bland–Altman analysis, the mean ratio was close to 0 (Supplementary Figure 2).
Nonetheless, five cytokines and sPD-L1 were significantly more abundant in serum than plasma (Figure 4(a)). In fact, sPD-L1, MCP-1, IFN-γ, IL-8, MIP-1β, and VEGF were 1.15-, 1.44-, 1.83-, 2.43-, 2.82-, 6.72-fold higher, respectively, in serum than plasma. A proportional relationship between serum and plasma levels in sPD-L1, MCP-1, IL-8, MIP-1β, and VEGF (only when measured with R&D high sensitivity) was obtained. Proportional difference for IFN-γ was not confirmed but the number of samples evaluated is too low (<10) to make an unambiguous interpretation (Supplementary Table 5).
For these six analytes, also the mean reported in Bland–Altman analysis is shifted to a positive value, indicating that biomarker levels are higher in serum than in plasma.
From the observation of the slope from the equation in Passing Bablok regression, IL-10, IL-4, IL-2, and IL-5 were, 1.05-, 1.19-, 1.92-, 2.17-fold higher, respectively, in plasma than serum (Figure 4(b)). However, 95% CI of regression equation slopes confirmed a proportional relationship between serum and plasma levels only for IL-2 (slope 0.52; 95% confidence interval (CI) −0.59, 0.91).
From the Passing Bablok results, IP-10 was 1.23- and 10-fold higher in plasma than serum when measured with Millipore and R&D Discovery assays, respectively (Figure 5(a)). However, no significant proportional bias was observed for IP-10 levels measured by ELLA. IP-10 levels were significantly higher in plasma but the bias between serum versus plasma levels varies depending on the assay used (−145%, R&D high sensitivity; −25.7%, Millipore; −5.7%, ELLA; Bland–Altman analysis; Figure 5(a)). VEGF levels, which are higher in serum than plasma, also present bias differences depending on the assay used: a bias of 115% was shown for R&D assay, whereas for Millipore and ELLA assay the calculated bias was 165% and 158%, respectively (Bland–Altman analysis; Figure 5(b)).
Contrasting results were obtained for IL-6 and TNF-α measured by R&D high sensitivity assay and to eotaxin measured by Millipore assay. Although no significant differences between the two matrices were found with the Wilcoxon analysis (Supplementary Figure 2), results from Passing Bablok analysis (slope of regression equation and its 95% CI Supplementary Figure 2; Supplementary Table 5) indicate that serum and plasma are non-interchangeable, with IL-6 and eotaxin levels higher in serum and TNF-α higher in plasma. Moreover, IL-6 and TNF-α levels measured with different assays (Millipore and R&D Discovery, respectively) resulted to be significantly different between serum and plasma (Wilcoxon analysis; Figure 2).
Discussion
The present study was developed as a propedeutic phase of a real-world clinical study designed to test whether sex-related inflammatory cytokines and sPD-L1 could have a predictive role in the response and toxicity to ICIs, administered according to the clinical practice in advanced melanoma and NSCLC. The results of the present study illustrate the circulating cytokines and sPD-L1 profile of expression in two blood-derived matrices collected from advanced cancer patients during immunotherapy.
Globally, 28 immune-related biomarkers, selected by literature analysis,5,14–20 and generally classified as “fragile markers” because they were unstable and easily degraded, 13 were screened in 38 samples from 10 patients affected by advanced melanoma and NSCLC during the treatment with ICIs. Cytokines GRO-α factor, EGF, and MIP-1α were only satisfactorily detected in a single matrix, whereas FGF-2, IL-1α, IFN-α, IL-1RA, and IL-13 did not meet limits of detectability simultaneously in both matrices, and these markers therefore were not considered for the comparison analysis. IL-1β, IL-2, IL-4, IL-5, IL-6, IL-8, IL-10, GM-CSF, TNF-α, IFN-γ, IP-10, VEGF, MCP-1, G-CSF, IL12p70, fractalkine, IL-17A, MIP-1β, sPD-L1 and eotaxin were detectable in both serum and plasma and were subjected to agreement analysis.
Generally, the median levels of nine analyzed immune-related markers (IL-1β, IL-6, IL-12p70, IL-17A, GM-CSF, G-CSF, TNF-α, eotaxin, fractalkine) were similar in serum and CTAD plasma. On the other hand, sPD-L1, MCP-1, IL-8, MIP-1β, and VEGF were significantly higher in serum and IL-2 and IP-10 significantly higher in CTAD plasma. Moreover, when comparing these cytokine levels measured in serum and plasma by the tested assays, we found generally poor absolute agreements across all comparisons.
Our results are consistent with several studies in healthy subjects showing levels of different markers including IL-8, sPD-L1, and MIP-1β higher in serum than plasma.21–23
These differences between the two matrices were not surprising considering previous evidence that different levels of some cytokines can be found between serum and plasma samples collected from the same subjects at the same time.24–27 Serum preparation includes the formation of a cross-linked fibrin clot, which causes removal of circulating proteins (e.g., fibrinogen, prothrombin, thrombin, and coagulation factors). In addition, the coagulation process can stimulate the release of inflammatory mediators from platelets and other cellular components.8,28
An association between VEGF levels and blood-derived preparation procedures was shown before by our group, indicating that CTAD is preventive for VEGF release from platelets in vitro. 29 Moreover, the influence of platelets was shown also for thrombospondin-1 protein in healthy subjects, which was avoided by using CTAD as an anticoagulant. 30 Also in the present study, the CTAD plasma was the matrix with the lowest measurable level of VEGF, reinforcing the evidence for the efficacy of CTAD in preventing platelet activation through different mechanisms.31–35
Other cytokines seem to be influenced by the presence of platelets. Quach et al. 36 showed that levels of IL-1β, IL-1RA, IL-6, IL-8, IP-10, MIP-1α, and MIP-1β are significantly reduced in platelet-depleted blood compared to whole blood, but recovered in the presence of platelets. Specifically, the release of IL-8 was mediated by the leukocytes, mainly monocytes, but potentiated via the thrombin-dependent activation of platelets.
A separate consideration must be made for IL-6, TNF-α (R&D high sensitivity), and eotaxin (Millipore) to which contrasting results were found when data were analyzed by Wilcoxon or Passing Bablok regression—the latter analysis indicating the matrices as non-interchangeable. For IL-6 and TNF-α, the Wilcoxon test is not able to detect significant differences for the measurements in the low and/or high range, which can instead be detected by linear Passing-Bablok regression.11,37 Interestingly, Biancotto et al. 27 also found no significant difference in IL-6 levels measured between the serum and plasma of healthy subjects using only Wilcoxon analysis. For eotaxin, there appears to be a deviation from a linear relationship between the two methods, which is an essential condition for the application of the Passing Bablok analysis. The comparison from serum and plasma levels should be further investigated for these three biomarkers, and a higher number of samples with better continuous distribution should be considered.
Discrepant data were obtained for IP-10 levels measured with two different assays produced by different manufacturers; that is, R&D Discovery and Millipore. This discrepancy seems to be attributable to the unsatisfactory detection of IP-10 in serum by the R&D assay. 27 For this reason, the determination of this biomarker using the alternative automatized ELLA method was subsequently carried out. The bias and the dispersion of values obtained in Bland–Altman analysis expressed elevated values when examining each assay singularly. Our results are consistent with evidence showing that cytokine levels can significantly vary depending on the types of immunoassay used. 38
The present study has some limitations. The data presented here constitute the preliminary analysis on a limited number of serum and plasma samples collected from advanced cancer patients treated with immunotherapy. However, this number was found to be sufficient to detect differences in cytokine profile expression between serum and plasma. Moreover, Luminex technology (chosen for the screening of the most promising cytokines in predicting the response to treatment with ICIs) is complex and time expending, requiring several practical steps and operator knowledge and training, which makes it more suited to the research context rather than to an immediate application in clinical practice. For clinical purposes, an easy, sensitive, and reproducible method for cytokine monitoring is desirable. Therefore, the agreement between Luminex and ELLA technologies for cytokine measurement in the present clinical context was also explored; this aspect will be further investigated by our group in a successive methodological study with a higher number of cases. Moreover, the levels of 8 markers (EGF, Eotaxin, FGF-2, fractalkine, GRO-alpha, IL-1RA, MIP-1alpha, MIP-1beta) were analyzed with just one commercial assay, not allowing for the comparison with the other methodologies. Thus, it was not possible for example to define whether the levels of IL-1RA evaluated in the present study are lower than those demonstrated by others in melanoma39,40 or lung cancer 41,42 patients due to any methodological artefact or to intrinsic characteristics of advanced cancer patients here studied.
Our study also has its strengths. First, high-quality specimens were obtained with the use of stringent pre-analytical SOPs to sample collection, processing and storage. Particular attention was paid to immediately start separating the plasma or serum (post clotting) from the cellular elements to avoid spurious cytokine release or degradation. Standardized pre-analytical methods used here, including a tested modality to thaw stored frozen samples, allowed for the detection in serum and/or plasma of over 93% (26/28) of the screened markers. Second, considering that each statistical method has limitations, 43 multiple statistical approaches were used to assess the agreement between serum and plasma, in contrast to other studies wherein the agreement between samples was measured using only a single statistical method, typically a correlation coefficient. Third, as discussed above, we were able to test two different technologies, ELLA and Luminex, for assessing multiple cytokines and from a comparison between the intra-assay CV% of the measured cytokine levels, ELLA showed a greater precision of the measurements. The present study was a propedeutic step towards an extensive evaluation of the cytokines and sPD-L1 as predictive biomarkers of response and toxicity to immunotherapy in 165 advanced melanoma and NSCLC patients in which biomarkers were measured in serum samples with R&D high sensitivity or ELLA methods at different time points of treatment. 44
Conclusions
The circulating levels of cytokines and sPD-L1 in cancer patients treated with immunotherapy may differ between serum and plasma samples. Particular attention should be given to the method chosen for cytokine analysis, since both the blood-derived matrices used and the assay characteristics can interfere with the results. Differences caused by sample preparation and biomarker analysis can be one of the possible explanations for conflicting results in clinical studies. Careful standardization of pre-analytical and analytical phases is necessary when analyzing circulating cytokines and sPD-L1 to enable high inter-laboratory reproducibility and transferability of the results.
Supplemental Material
sj-docx-1-jbm-10.1177_03936155231226234 - Supplemental material for Cytokine and soluble programmed death-ligand 1 levels in serum and plasma of cancer patients treated with immunotherapy: Preanalytical and analytical considerations
Supplemental material, sj-docx-1-jbm-10.1177_03936155231226234 for Cytokine and soluble programmed death-ligand 1 levels in serum and plasma of cancer patients treated with immunotherapy: Preanalytical and analytical considerations by Elia Cappelletto, Laura Tiozzo Fasiolo, Valentina Salizzato, Luisa Piccin, Alessio Fabozzi, Anna Contato, Paola Del Bianco, Giulia Pasello, Vanna Chiarion-Sileni, Massimo Gion and Aline S. C. Fabricio in The International Journal of Biological Markers
Footnotes
Abbreviations
Acknowledgments
The authors are grateful to Dr. Antonette E. Leon for English editing, Mrs. Ornella Scattolin for administrative support, and the research nurses and technicians of all the participating centers for the technical assistance in sample collections and processing. They also thank the IOV-IRCCS Biobank for collaboration in sample storage and management.
Author contributions
Elia Cappelletto and Laura Tiozzo Fasiolo are co-first-authors. Massimo Gion and Aline S.C. Fabricio are co-last-authors.
Data Availability
The datasets for this study are available at https://doi.org/10.5281/zenodo.10219235.
Declaration of conflicting interests
VCS has advisory roles for Pierre-Fabre, Immuncore and Merck Sharp & Dohme and she received support for attending meetings and travel from Pierre Fabre and Sanofi. GP has advisory board membership, honoraria, speakers’ fees, consultant roles for Amgen, AstraZeneca, BMS, Eli Lilly, Jansenn, MSD, Novartis, Roche and she received unconditioned research support from AstraZeneca, Roche, MSD. LP received speaker’s fees from Novartis, MSD, BMS. AF received speaker’s fees from BMS, MSD, Novartis, SUN Pharma. All the other authors (EC, LTF, VS, AC, PDB, MG and ASCF) declare that they have no competing interests.
Funding
This work was supported by Veneto Institute of Oncology IOV-IRCCS “5 × 1000 anno di riferimento 2015 - Genomica dei tumori e immunoterapia nell'era dei big data, fase 2” (5 × 1000 BIGID219SILE) to VCS and by Ricerca Finalizzata Ministero della Salute, Grant n. RF-2018-12367604 to VCS. A research fellowship to Anna Contato was provided by AVAPO Venezia Onlus Ricerca Oncologica “Biomarcatori”, Venice, Italy.
Supplemental material
Supplemental material for this article is available online.
References
Supplementary Material
Please find the following supplemental material available below.
For Open Access articles published under a Creative Commons License, all supplemental material carries the same license as the article it is associated with.
For non-Open Access articles published, all supplemental material carries a non-exclusive license, and permission requests for re-use of supplemental material or any part of supplemental material shall be sent directly to the copyright owner as specified in the copyright notice associated with the article.