
Abstract
Background
Hepatocellular carcinoma carries a poor prognosis and poses a serious threat to global health. Currently, there are few potential prognostic biomarkers available for the prognosis of hepatocellular carcinoma.
Methods
This pilot study used 4D label-free quantitative proteomics to compare the proteomes of hepatocellular carcinoma and adjacent non-tumor tissue. A total of 66,075 peptides, 6363 identified proteins, and 772 differentially expressed proteins were identified in specimens from three hepatocellular carcinoma patients. Through functional enrichment analysis of differentially expressed proteins by Gene Ontology, KEGG pathway, and protein domain, we identified proteins with similar functions.
Results
Twelve differentially expressed proteins (RPL17, RPL27, RPL27A, RPS5, RPS16, RSL1D1, DDX18, RRP12, TARS2, YARS2, MARS2, and NARS1) were selected for identification and validation by parallel reaction monitoring. Subsequent Western blotting confirmed overexpression of RPL27, RPS16, and TARS2 in hepatocellular carcinoma compared to non-tumor tissue in 16 pairs of clinical samples. Analysis of The Cancer Genome Atlas datasets associated the increased expression of these proteins with poor prognosis. Tissue microarray revealed a negative association between high expression of RPL27 and TARS2 and the prognosis of hepatocellular carcinoma patients, although RPS16 was not significant.
Conclusions
These data suggest that RPL27 and TARS2 play an important role in hepatocellular carcinoma progression and may be potential prognostic biomarkers of overall survival in hepatocellular carcinoma patients.
Keywords
Introduction
Liver cancer poses a major threat to human health and is the fourth most prevalent malignancy.1,2 Hepatocellular carcinoma (HCC), as the predominant histologic type of primary hepatic malignancies, is the leading cause of death in most patients with primary liver cancers.3,4 Most patients with HCC are diagnosed at advanced stages and are consequently past the optimal time window for surgical cure. Non-operative treatment of advanced HCC includes chemotherapy, radiofrequency ablation, selective internal radiotherapy, transarterial chemoembolization, immunotherapy and immune checkpoint inhibition, and traditional Chinese medicine; however, the efficacy of these modalities is still limited. 5 Consequently, we proposed to study the oncogenesis of early HCC to provide a theoretical basis for early diagnosis and treatment, which are essential to improve clinical outcomes. 6 Many institutions have conducted extensive studies on the pathogenesis of HCC, but proteomic studies to select liver-cancer-specific biomarkers are lacking.7–9
Proteomics is a powerful tool that can identify potential biomarkers and therapeutic targets.10–12 We employed this high-throughput technique to identify differentially expressed proteins (DEPs) in liver tumor and adjacent non-tumor tissues from patients with HCC. Bioinformatics analysis implicated several molecular functions of ribosomal proteins in the tumorigenesis of HCC.
Patients and methods
Paired tissue of liver cancer and non-tumor tissue were taken from three patients with primary HCC. The surgical tissue samples were promptly frozen in liquid nitrogen and kept at 80°C until protein extraction. This study was approved by the Ethics Committee of the Second Hospital of Dalian Medical University (2022166) on Dec 30, 2022. Patients gave written informed consent before inclusion. This research was conducted ethically in accordance with the World Medical Association Declaration of Helsinki. The diagnosis of HCC was confirmed by histopathologic examination after surgical resection. None of the patients had received previous anti-tumor therapy.
4D label-free quantitative proteomics and database search
Protein extraction
Take tissue samples from − 80°C, weigh 100 mg of each sample, grind them into powder with liquid nitrogen, and add 1 mL of RIPA buffer (Keygentec, Jiangsu, China) containing 1% protease inhibitor. All samples and lysis buffer were mixed in a ratio of (100 mg tissue/1 mL RIPA) to maintain consistency in the homogenate concentration and underwent ultrasonic lysis. The were centrifuged at 4°C and 12,000 g for 10 min, cell fragments were removed, the supernatant was transferred to a new centrifuge tube, and the BCA reagent kit (Beyotime, China) was used for protein concentration determination.
Trypsin digestion
There was 300 μg protein taken from each protein sample, and the protein concentration of 2 μg/μL was unified using the RIPA buffer. The final volume of all groups was 150 μL for performing enzymatic hydrolysis. Slowly, 20% TCA was added at the final concentration, mixed well in a vortex, and precipitated at 4°C for 2 h. A total of 4500 g was centrifuged for 5 min, the supernatant was discarded, and the precipitate was washed 2–3 times with pre-cooled acetone. After drying the precipitate, TEAB with a final concentration of 200 mM was added, and the precipitate was dispersed by ultrasound. Dithiothreitol was added to achieve a final concentration of 5 mM and reduced at 56°C for 30 min. Afterwards, iodoacetamide was added to achieve a final concentration of 11 mM and then incubated at room temperature in the dark for 15 min. Trypsin (3 μg/μL) was added in a 1:50 ratio (protease: protein, w/w) and hydrolyzed overnight. The peptide segments after enzymatic hydrolysis were desalinated using C18 SPE column (Phenomenex, Strata Polymeric SPE, 8B-S100-EBJ, Torrance, CA, USA) (Supplementary Materials 1). At last, peptide segments were vacuum dried through a centrifugation concentrator (Eppendorf Concentrator plus, Hamburg, Germany) for mass spectrometry.
4D mass spectrometry
Fragments were dissolved in buffer A (0.1% formic acid, and 2% acetonitrile/water) and loaded onto a reverse phase analysis column. On the NanoElute UHPLC system (Bruker Daltonics, Billerica, MA, USA), peptides were separated from 6% to 24% buffer B (0.1% formic acid in acetonitrile) by gradient at a constant flow rate of 450 nL/min over 70 min. A range of 24–35% was separated in 14 min, and rose to 80% in 3 min, and then remained at 80% during the last 3 min. The peptide segments were separated by an ultra-high performance liquid phase system and injected into a capillary ion source for ionization, which was then analyzed by timsTOF Pro (Bruker Daltonics) mass spectrometry. A 1.75 kV electric spray voltage was applied. Precursors and fragments were analyzed on a TOF detector with MS/MS scans ranging from 100 to 1700 m/z. The timsTOF Pro was operated in Parallel Accumulation Serial Fragment (PASEF) mode. Precursors with a charge state of 0 to 5 were selected for crushing, and 10 PASEF-MS/MS scans were collected per cycle. Dynamic exclusion was set to 30 s.
Database search
Secondary ion mass spectrometry data were retrieved using MaxQuant (v1.6.15.0). Search parameter settings: database for Homo_sapiens_9606_SP_20220107 (20,376 sequences). The reverse library was added to calculate the false discovery rate (FDR) due to random matching, and the common contaminated library was added to the database for eliminating the effect of contaminating proteins in the identification results. The final data used for quantification is LFQ (Data 1). The digestion mode was set to Trypsin/P; the number of missed cut sites was set to 2; the minimum peptide length was set to 7 amino acid residues; the maximum number of peptide modifications was set to 5; the mass tolerance for precursor ion was set as 20 ppm and 20 ppm in the First search and the Main search; and the mass tolerance for fragment ion was set to 20 ppm. The Cys are carbamidomethylated with iodoacetamide, the carbamyl methylation of Cys was set as a fixed modification, and the N-terminal acetylation of protein and the oxidation of Met were designated as variable modifications. FDR was adjusted to <1%.
Bioinformatics analysis
Proteins were functionally annotated based on Gene Ontology (GO) classification, subcellular localization, and COG/KOG categories using the UniProt-GOA and InterPro, Wolfpsort, and COG/KOG databases. Specific GO terms, KEGG pathways, and protein domains were assessed for DEP enrichment using GO annotation,13,14 KEGG,15,16 and InterPro databases, respectively, using a two-tailed Fisher's exact test with P < 0.05 as the significance threshold. A protein–protein interaction (PPI) network containing the identified DEPs was built using the STRING database (https://string-db.org), using a score >0.4 as the significance threshold for identified interactions.
Parallel reaction monitoring
Protein separation and trypsinization were conducted as described above, and then parallel reaction monitoring (PRM) mass spectrometry was performed through MS/MS, Q Executive Plus (Thermo Fisher Scientific, Waltham, MA, USA). The detailed process is shown in Supplementary Materials 1.
Western blot
The method for obtaining tissue proteins was described above. Protein lysates were separated by 12.5% sodium dodecyl sulfate-polyacrylamide gel electrophoresis and transferred to a transfer membrane and then incubated with an appropriate primary antibody. Membranes were washed three times with TBS-T before scanning and visualization of immunoreactions using the ECL Western blot substrate. Anti-rabbit immunoglobulin-G conjugated to horseradish peroxidase was used as the secondary antibody (1: 10,000) for detection using an ECL kit.
The Cancer Genome Atlas database analysis
RNA-sequencing data of HCC and corresponding clinical information were obtained from The Cancer Genome Atlas (TCGA) database (https://portal.gdc.com). For Kaplan–Meier curves, P-values and hazard ratio (HR) with 95% confidence intervals (CI) were derived by Log-rank test and univariate Cox regression. Then using the GEPIA2 (http://gepia2.cancer-pku.cn) confirmed that RPL27, RPS16, and TARS2 overexpression predicted reduced overall survival in HCC patients. P values <0.05 were considered statistically significant.
Tissue microarray
To validate the clinical significance of the candidate genes, the Ethics Committee of the Second Hospital of Dalian Medical University approved the use of these specimens for tissue microarray analysis and retrospective analyses. Tissue cylindrical cores at 1.0 mm diameter were transferred from the donor paraffin blocks to the recipient block at defined array positions through the tissue microarray instrument (Beecher Instruments, Silver Spring, MD, USA), and 88 cylindrical tissue specimens were constructed.
Immunohistochemistry
The expressions of RPL27, RPS16, and TARS2 in tissue samples were examined by immunohistochemistry (IHC). Briefly, tissue microarray sections (3 µm) were deparaffinized, and heat-induced antigen retrieval was performed with 10 mM citric acid buffer at 100°C for 20 min. Tissue microarray sections were incubated with 3% hydrogen peroxide for 10 min, then with primary antibodies for RPL27 (1: 200, Proteintech, Wuhan, China), RPS16 (1: 100, Proteintech), and TARS2 (1: 100, Proteintech) at 4°C overnight. Tissue sections were reacted with secondary antibody for 30 min, and lastly with 3,3′-diaminobenzidine (DAB) for 5 min. Tissue sections were counterstained with hematoxylin for 30 s and fixed with xylene. Two independent pathologists evaluated the immunostaining and established the percentage of stained cells. The expression intensity: 0 = negative, 1 = weak, 2 = positive, 3 = strong. The percentage of cells stained: 0 = <5%, 1 = 5–30%, 2 = 31–60%, 3 = >60% of staining. The product of the two parameters is the total scores. A total score of < 4 was referred to as a low expression, whereas ≥ 4 was a high expression.
Statistical analysis
For continuous variables, data were expressed as means ± SD. The Student's t-test was used to compare protein levels between tumor and non-tumor tissues. The association between the proteins and the clinical features was analyzed using the chi-square test. Survival analysis was performed by the Kaplan–Meier method and the survival rates were performed by log-rank test. A P-value < 0.05 was considered statistically significant. All experiments were repeated at least three times.
Results
Proteomics identified potential diagnostic candidates
Proteins with a fold change > 1.5 and P < 0.05 were identified as DEPs. Finally, we identified 66,075 peptides and 6363 identified proteins from three HCC patients through a 4D label-free quantitative proteomics analysis.
The PCA distribution of QC samples showed good differentiation in the proteomics data (Figure 1(a)). Using ratio folds (T/N) > 1.5 as the screening criteria to identify the differential proteins in the HCC group, we found 523 upregulated proteins were found and 249 downregulated proteins compared to non-tumor tissue (Figure 1(b) and (c)). Subcellular localizations of these DEPs (Figure 1(d)) were predicted using wolf sort and were primarily in the cytoplasm (31.48%), nucleus (21.76%), and mitochondria (16.45%).
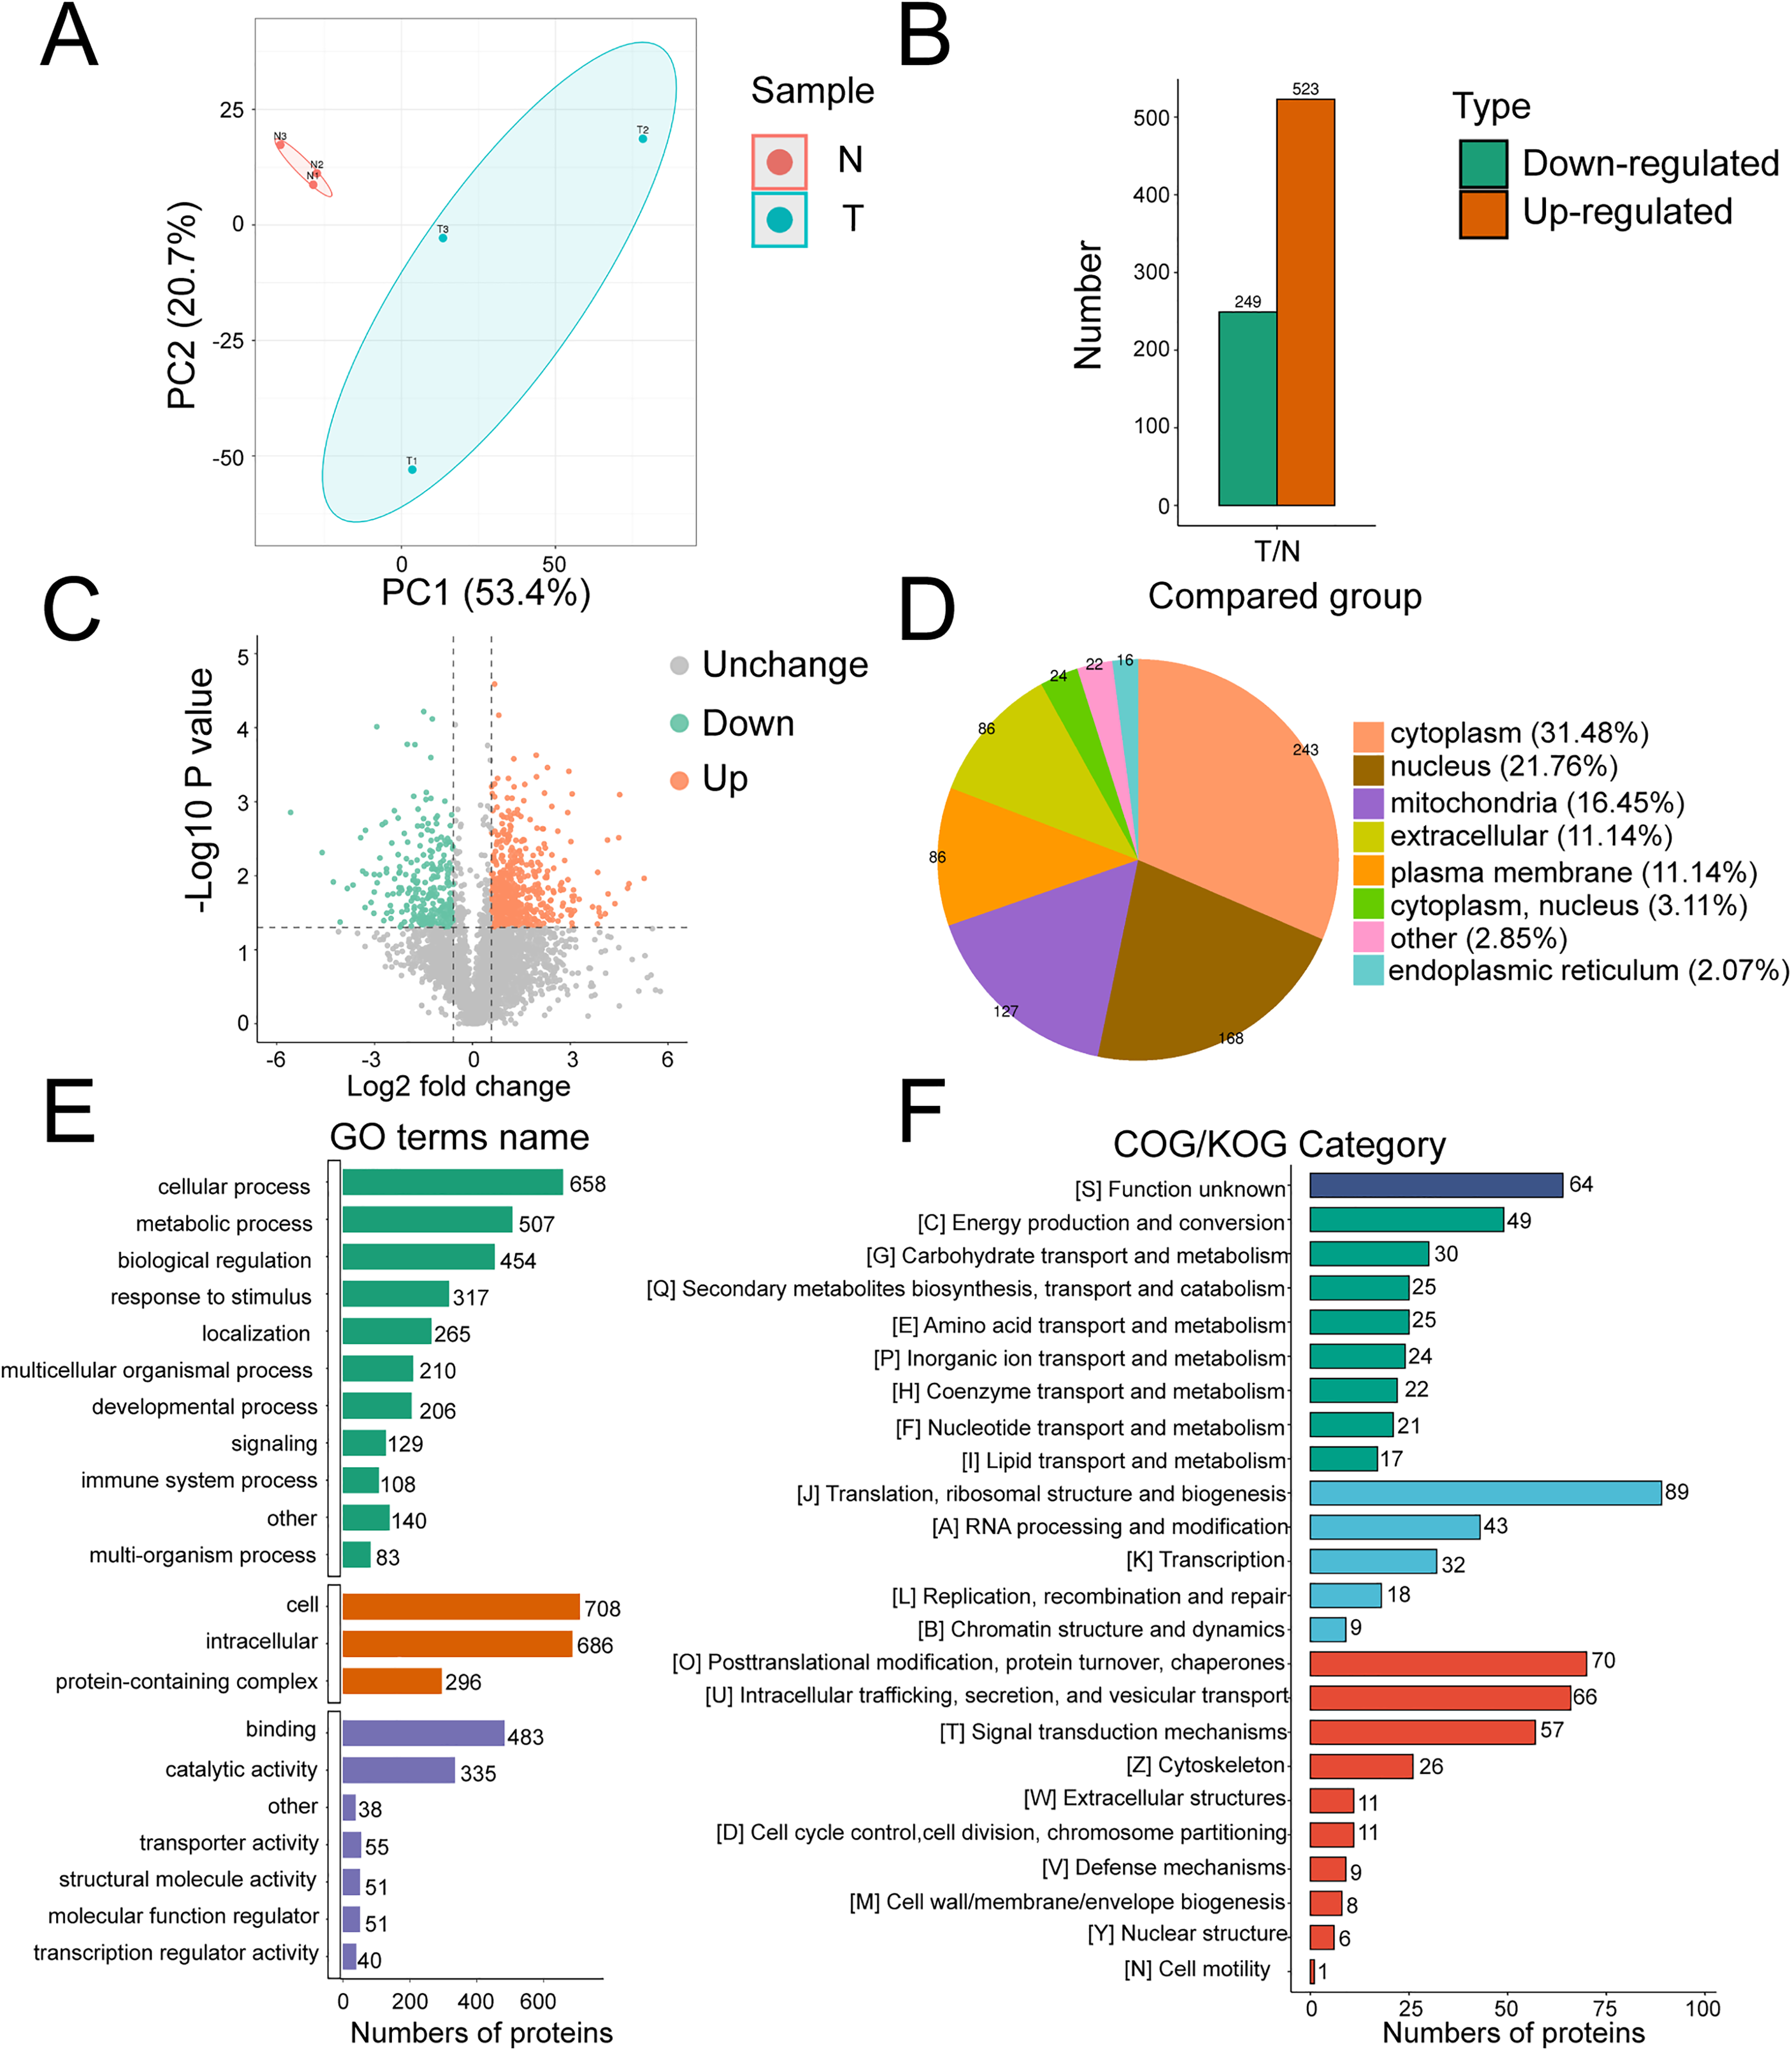
Proteomics statistics, classification, and functional annotations of differentially expressed proteins (DEPs). (a) Principal component analysis (PCA). (b) Statistics of DEPs. (c) Volcano map of DEPs. (d) Subcellular location of DEPs. (e) Gene Ontology (GO) analysis of DEPs. (f) COG/KOG categories of DEPs.
DEPs were classified according to their enrichment in specific GO biological process (BP), molecular function (MF), and cellular component (CC) terms. DEPs were involved in cellular processes (658 proteins), biological regulation (507 proteins), and metabolic processes (454 proteins) in BP. DEPs were enriched primarily in cellular (708 proteins), intracellular (686 proteins), and protein-containing complexes (296 proteins) in CC. DEPs were involved mostly in binding (483 proteins) and catalytic activity (335 proteins) in MF (Figure 1(e)). COG/KOG functional analysis assigned these DEPs to 23 functional KOG classifications: translation, ribosome structure, and biogenesis (89 proteins); posttranslational modifications, protein turnover, and chaperones (70 proteins); and intracellular trafficking, secretion, and vesicular trafficking (66 proteins) (Figure 1(f)).
We performed functional enrichment analysis of DEPs based on GO, KEGG pathway, and protein domain analyses (Figure 2(a)). GO terms: In BP, DEPs were enriched in the cellular amino acid metabolic process, carboxylic acid metabolic process, and ribosome biogenesis. In CC, DEPs were enriched in the cytosolic ribosome, mitochondrial matrix, and cytosolic small ribosomal subunit. In MF, DEPs were enriched in the RNA binding, catalytic activity, acting on a transfer RNA (tRNA), and a structural constituent of ribosome. KEGG pathway enrichment analyses revealed these DEPs to be enriched in ribosome, aminoacyl-tRNA biosynthesis, and RNA degradation pathways. Protein domain enrichment analyses revealed these DEPs to be enriched in the anticodon-binding domain of tRNA and the 2OG-Fe (II) oxygenase superfamily.
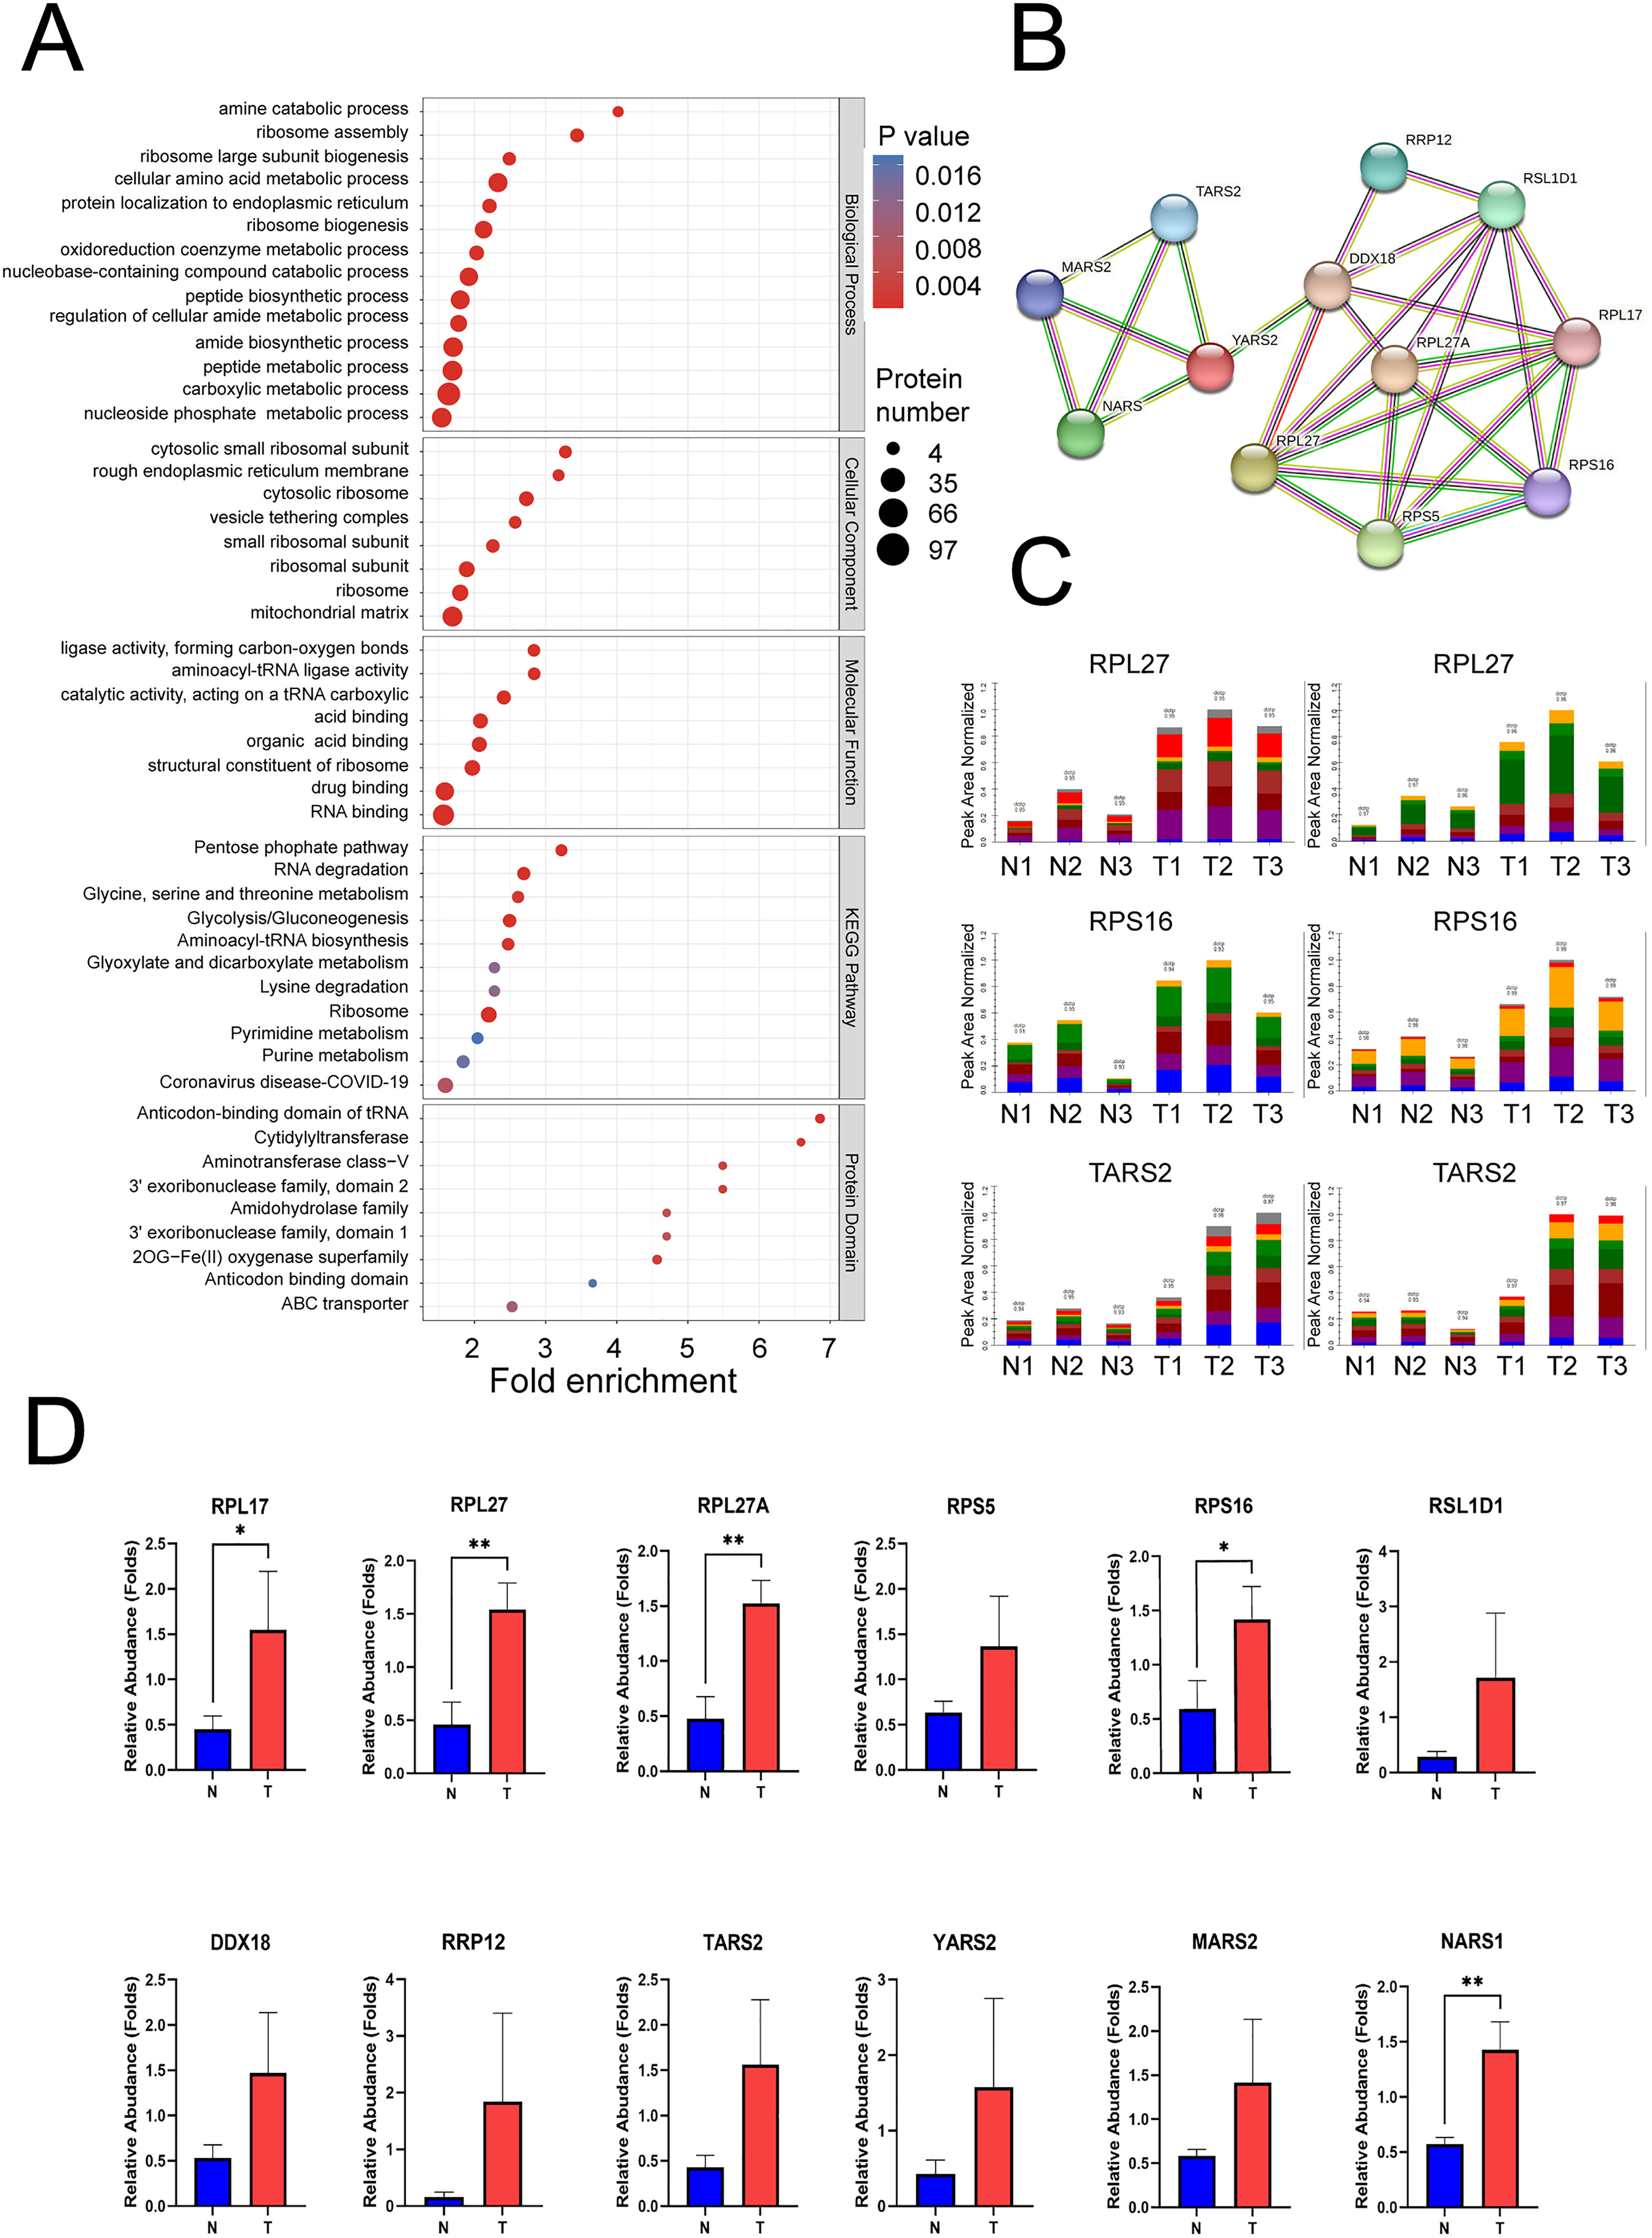
Functional enrichment analysis of differentially expressed proteins (DEPs). (a) GO enrichment analysis of DEPs, including biological process, cell component, and molecular function. KEGG pathway enrichment analysis of the DEPs. Protein domain enrichment analysis of DEPs. (b) PPI network of validated proteins. Validation of candidate proteins involved in HCC progression. Parallel reaction monitoring (PRM) of 12 upregulated proteins. (c) Distribution of fragment ion peak areas of RPL27, RPS16, and TARS2. (d) Statistical analysis of RPL17, RPL27, RPL27A, RPS5, RPS16, RSL1D1, DDX18, RRP12, TARS2, YARS2, MARS2, and NARS1. All data are displayed as mean ± SD, * P < 0.05, ** P < 0.01.
PPI network analysis
Bioinformatics analysis suggested significant upregulation of involved proteins (RPL17, RPL27, RPL27A, RPS5, RPS16, RSL1D1, DDX18, RRP12, TARS2, YARS2, MARS2, and NARS1). Subsequently, we constructed a PPI network incorporating these DEPs from our PRM validation analysis (Figure 2(b)).
PRM validation
For PRM, the sum of the secondary ion areas of the characteristic peptide segments was used to identify the target protein. Next, after conducting PPI network analysis and literature review, we ultimately selected 12 DEPs for PRM validation and added a flowchart (Figure S1). A total of 12 proteins were quantitatively identified (Figure 2(c) and (d)). These proteins were selected for their functional significance indicated by proteome analysis, and the ratio of protein abundance varied over a wide range. Four proteins (TARS2, YARS2, MARS2, and NARS1) were involved in tRNA biosynthesis, of which YARS2 exhibited the highest differential expression, with a T/N ratio of 3.67. Five proteins (RPL17, RPL27, RPL27A, RPS5, and RPS16) were involved in ribosome biogenesis, of which RPL27 displayed the highest differential expression, with a T/N ratio of 3.38. Three proteins (RSL1D1, DDX18, and RRP12) were involved in the amino acid metabolic process, of which RRP12 had the highest differential expression, with a T/N ratio of 11.28. PRM analysis of 12 candidate protein expressions are listed in Table 1.
PRM analysis of 12 candidate protein expressions.
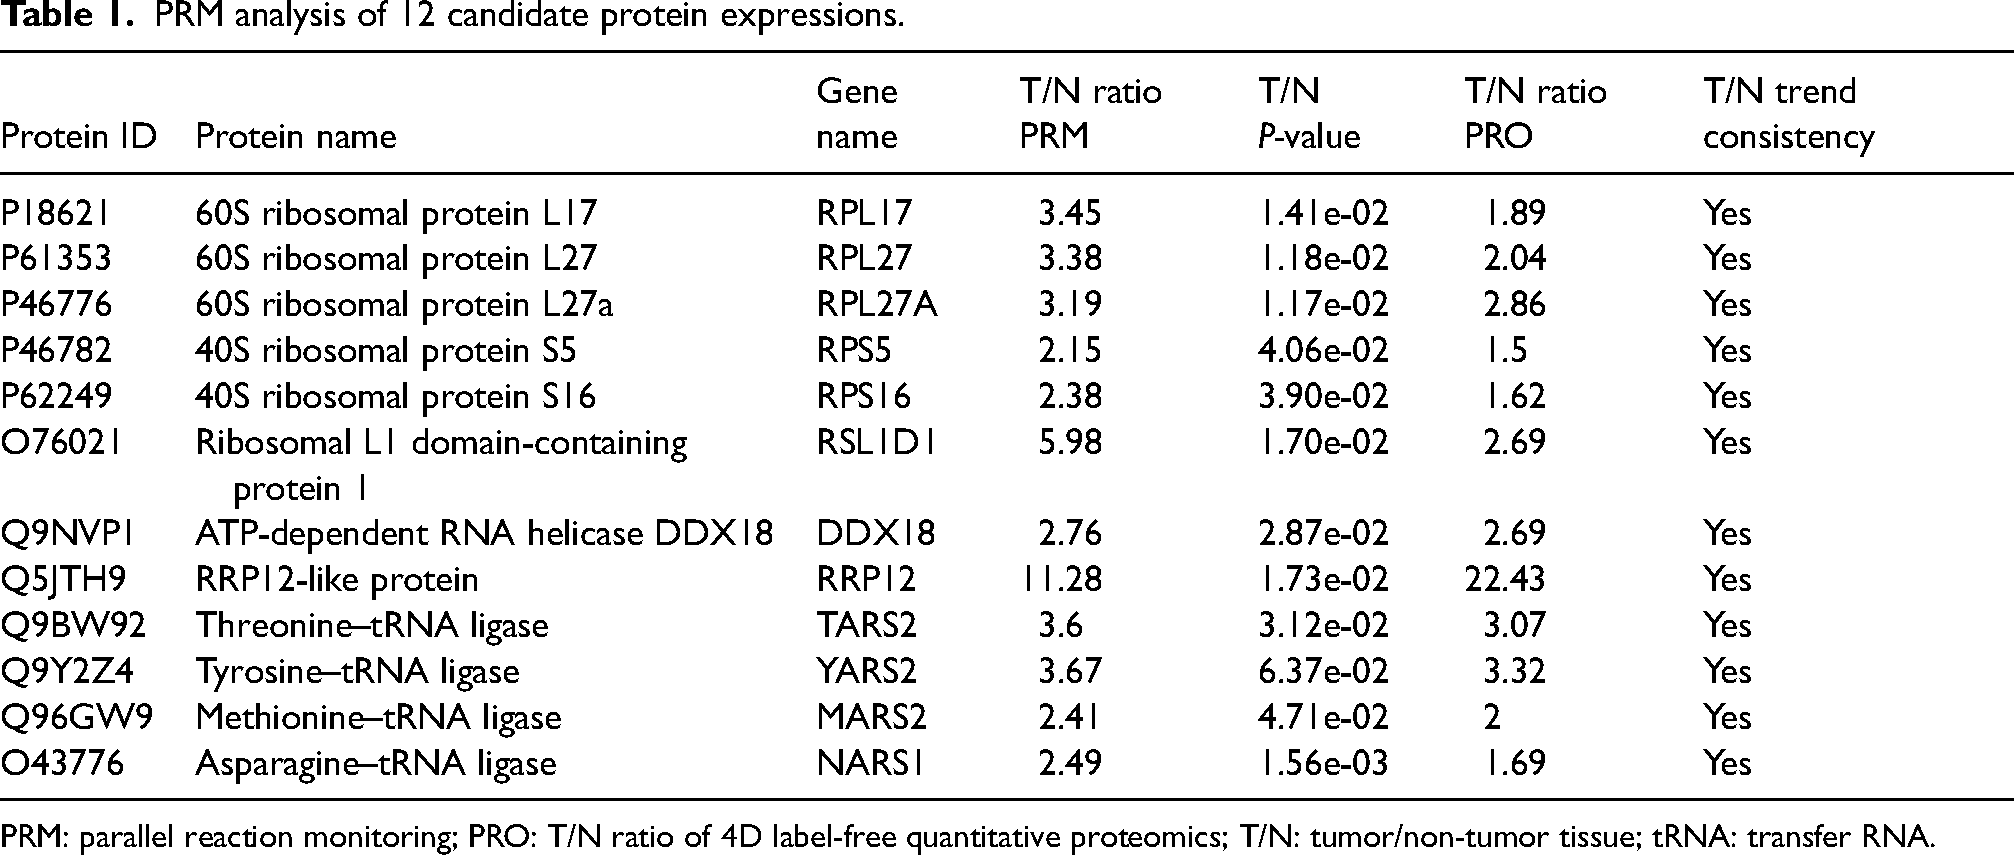
PRM: parallel reaction monitoring; PRO: T/N ratio of 4D label-free quantitative proteomics; T/N: tumor/non-tumor tissue; tRNA: transfer RNA.
Expressions of RPL27, RPS16, and TARS2 in HCC
Western blot was used to verify the above proteins in the tissue of a small cohort of clinical samples (16 pairs of tumor and non-tumor tissues of HCC patients).
After conducting PRM, we further identified three proteins (RPL27, RPS16, and TARS2) that may be closely related to HCC based on the results of 4D label-free quantitative proteomics analysis. Therefore, we performed Western blot for secondary verification. Western blot analyses confirmed that the expressions of RPL27, RPS16, and TARS2 were higher in tumor tissue than in the non-tumor tissue, which is consistent with the quantitative proteomic analysis results (Figure 3(a) and (b)).
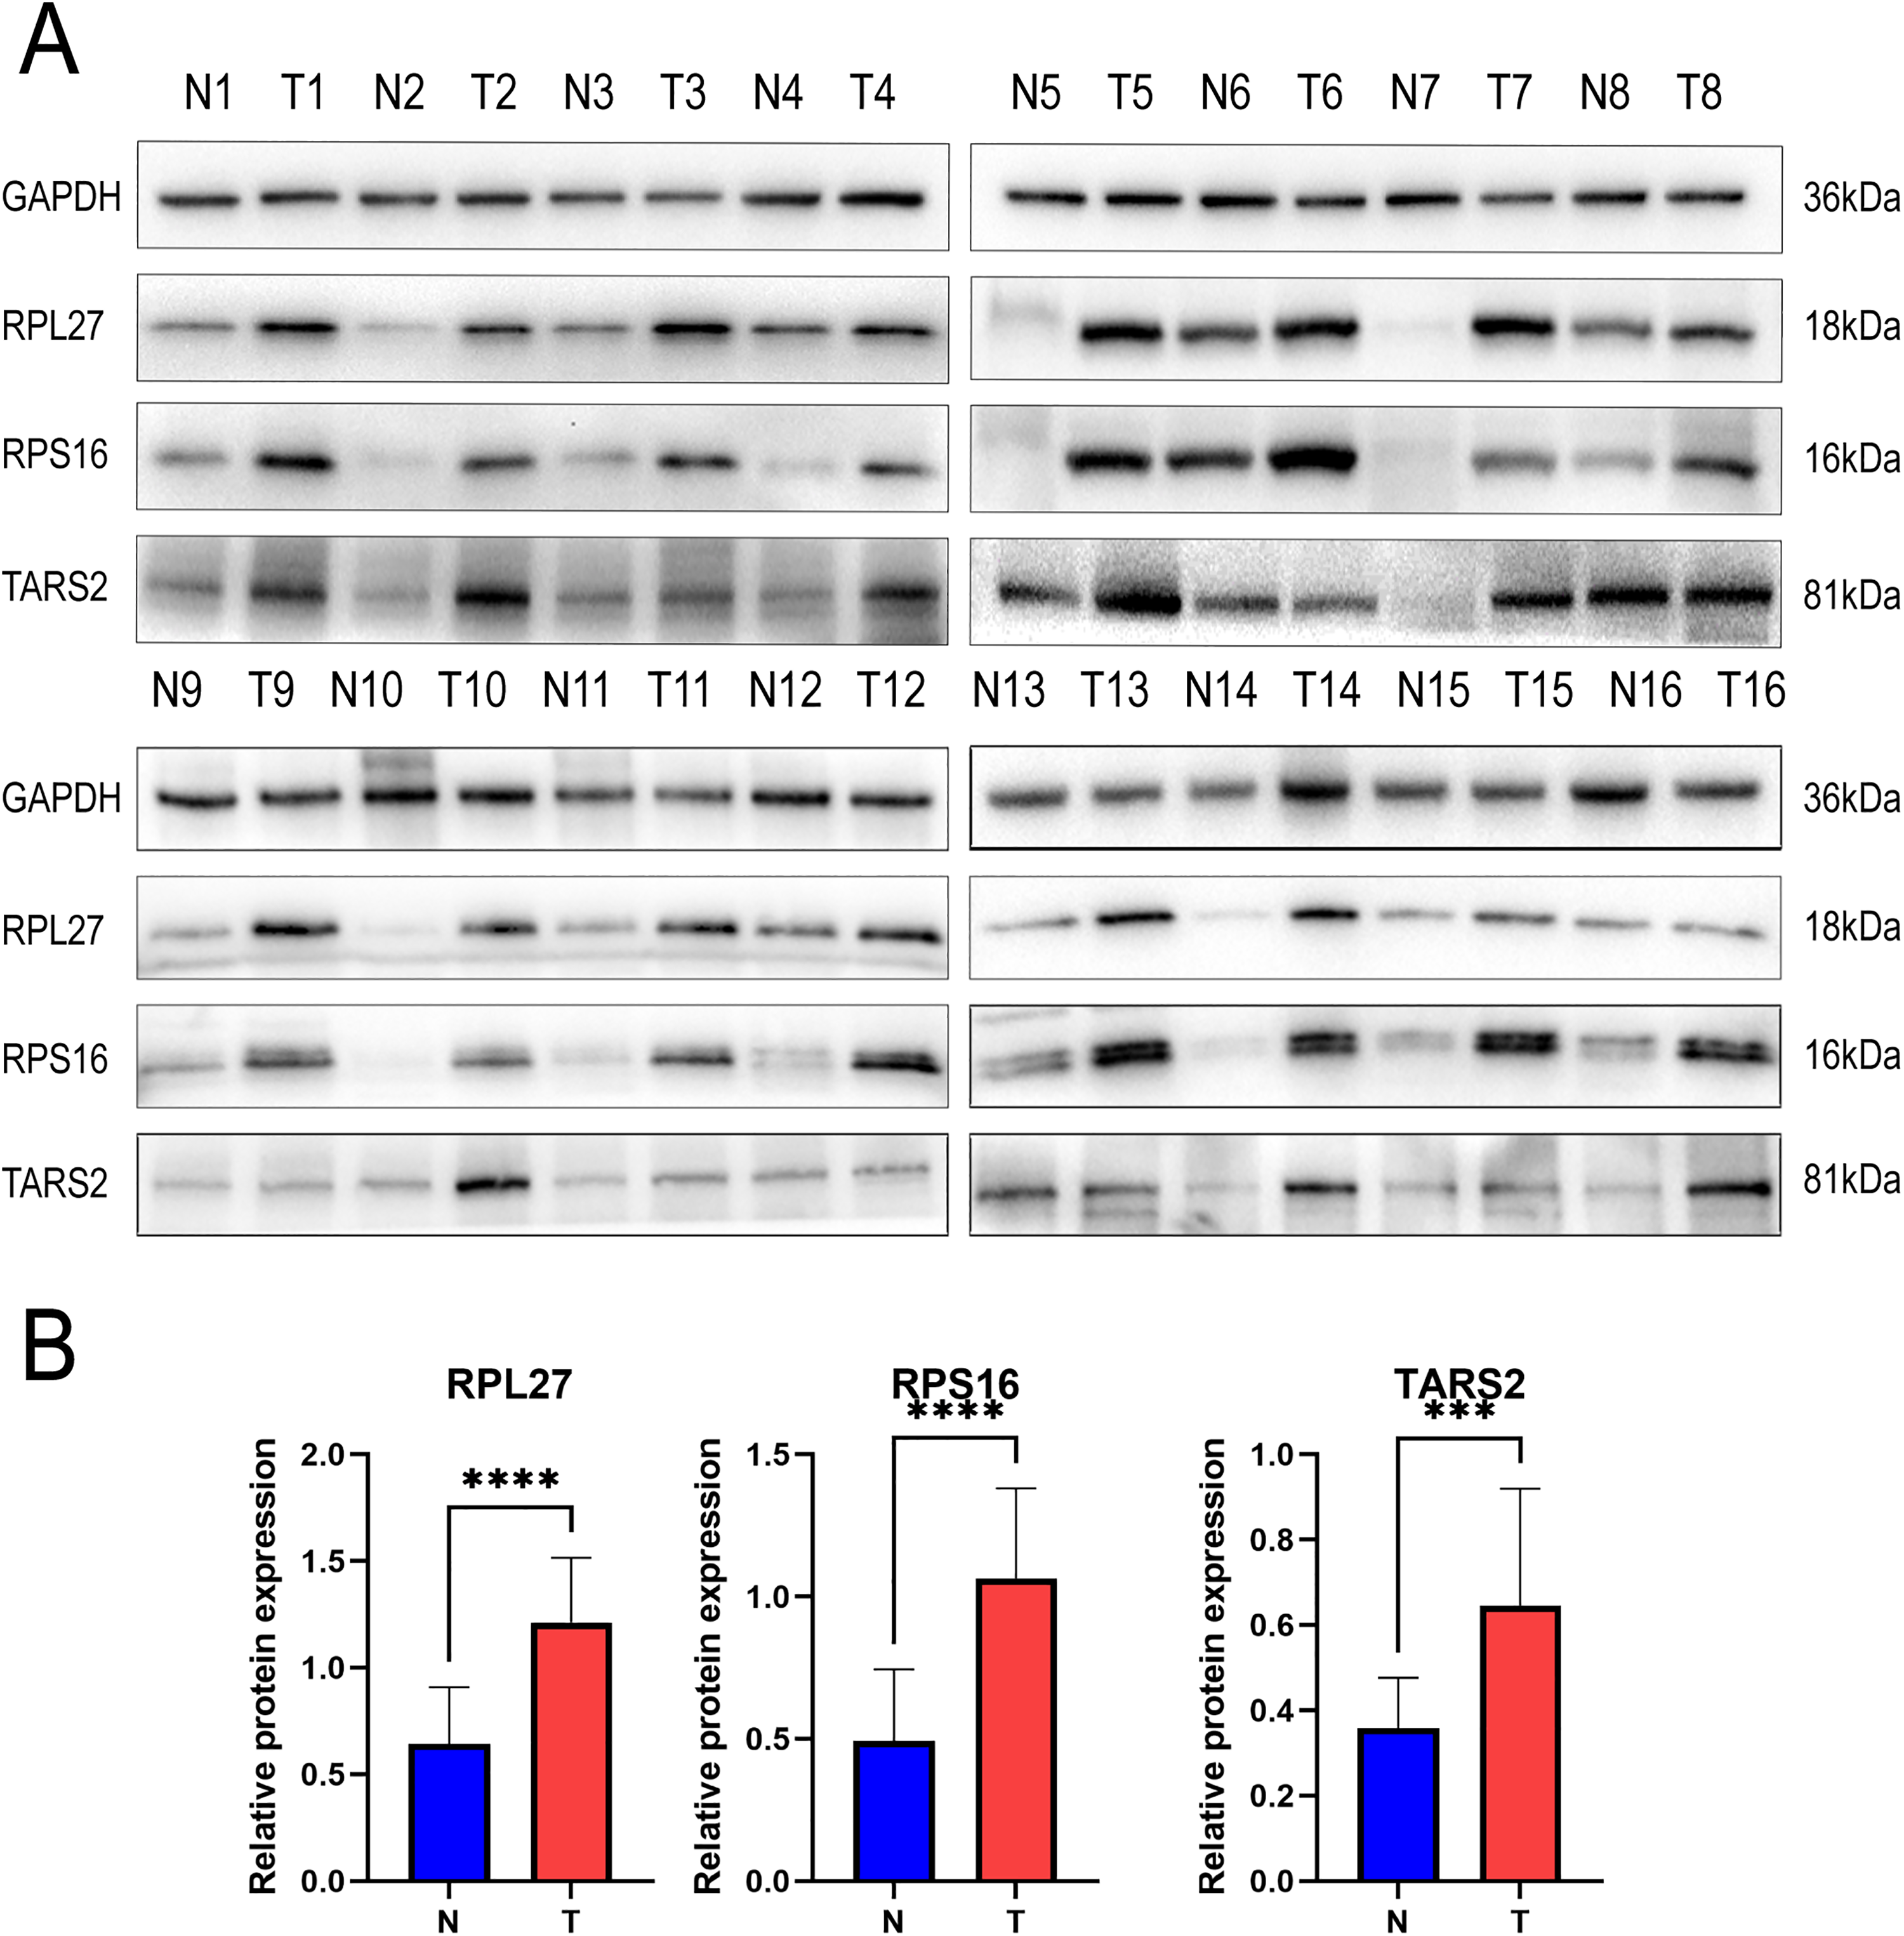
RPL27, RPS16, and TARS2 validation by Western blot. (a) Levels of RPL27, RPS16, and TARS2 were significantly higher in the HCC than in non-tumor tissue. (b) Results of quantitative analysis of RPL27, RPS16, and TARS2 protein levels are shown. All data are displayed as means ± SD, *** P < 0.001, **** P < 0.0001.
Validation on tissue microarray and overall survival
TCGA data analysis confirmed that RPL27, RPS16, and TARS2 overexpression predicted reduced overall survival in HCC patients (P < 0.05, Figure 4(a) to (c)). Tissue microarray showed that the expressions of RPL27 and TARS2 in liver cancer were significantly higher than that in non-tumor tissues, but there was no significant difference in RPS16 (Figure 4(d) to (f)) (Figure S2). We analyzed the correlation between protein expression in liver cancer and the clinical features. The results demonstrated that the expression of RPL27 and TARS2 were correlated with tumor node metastasis stage, but not with age, gender, or tumor differentiation (Table S1). We also investigated the protein expression and the prognosis of patients by survival analysis log-rank test. The median survival time of patients with high RPL27 and TARS2 expression had lower overall survival, while the RPS16 had no relationship with overall survival (Figure 4(g) to (i)).
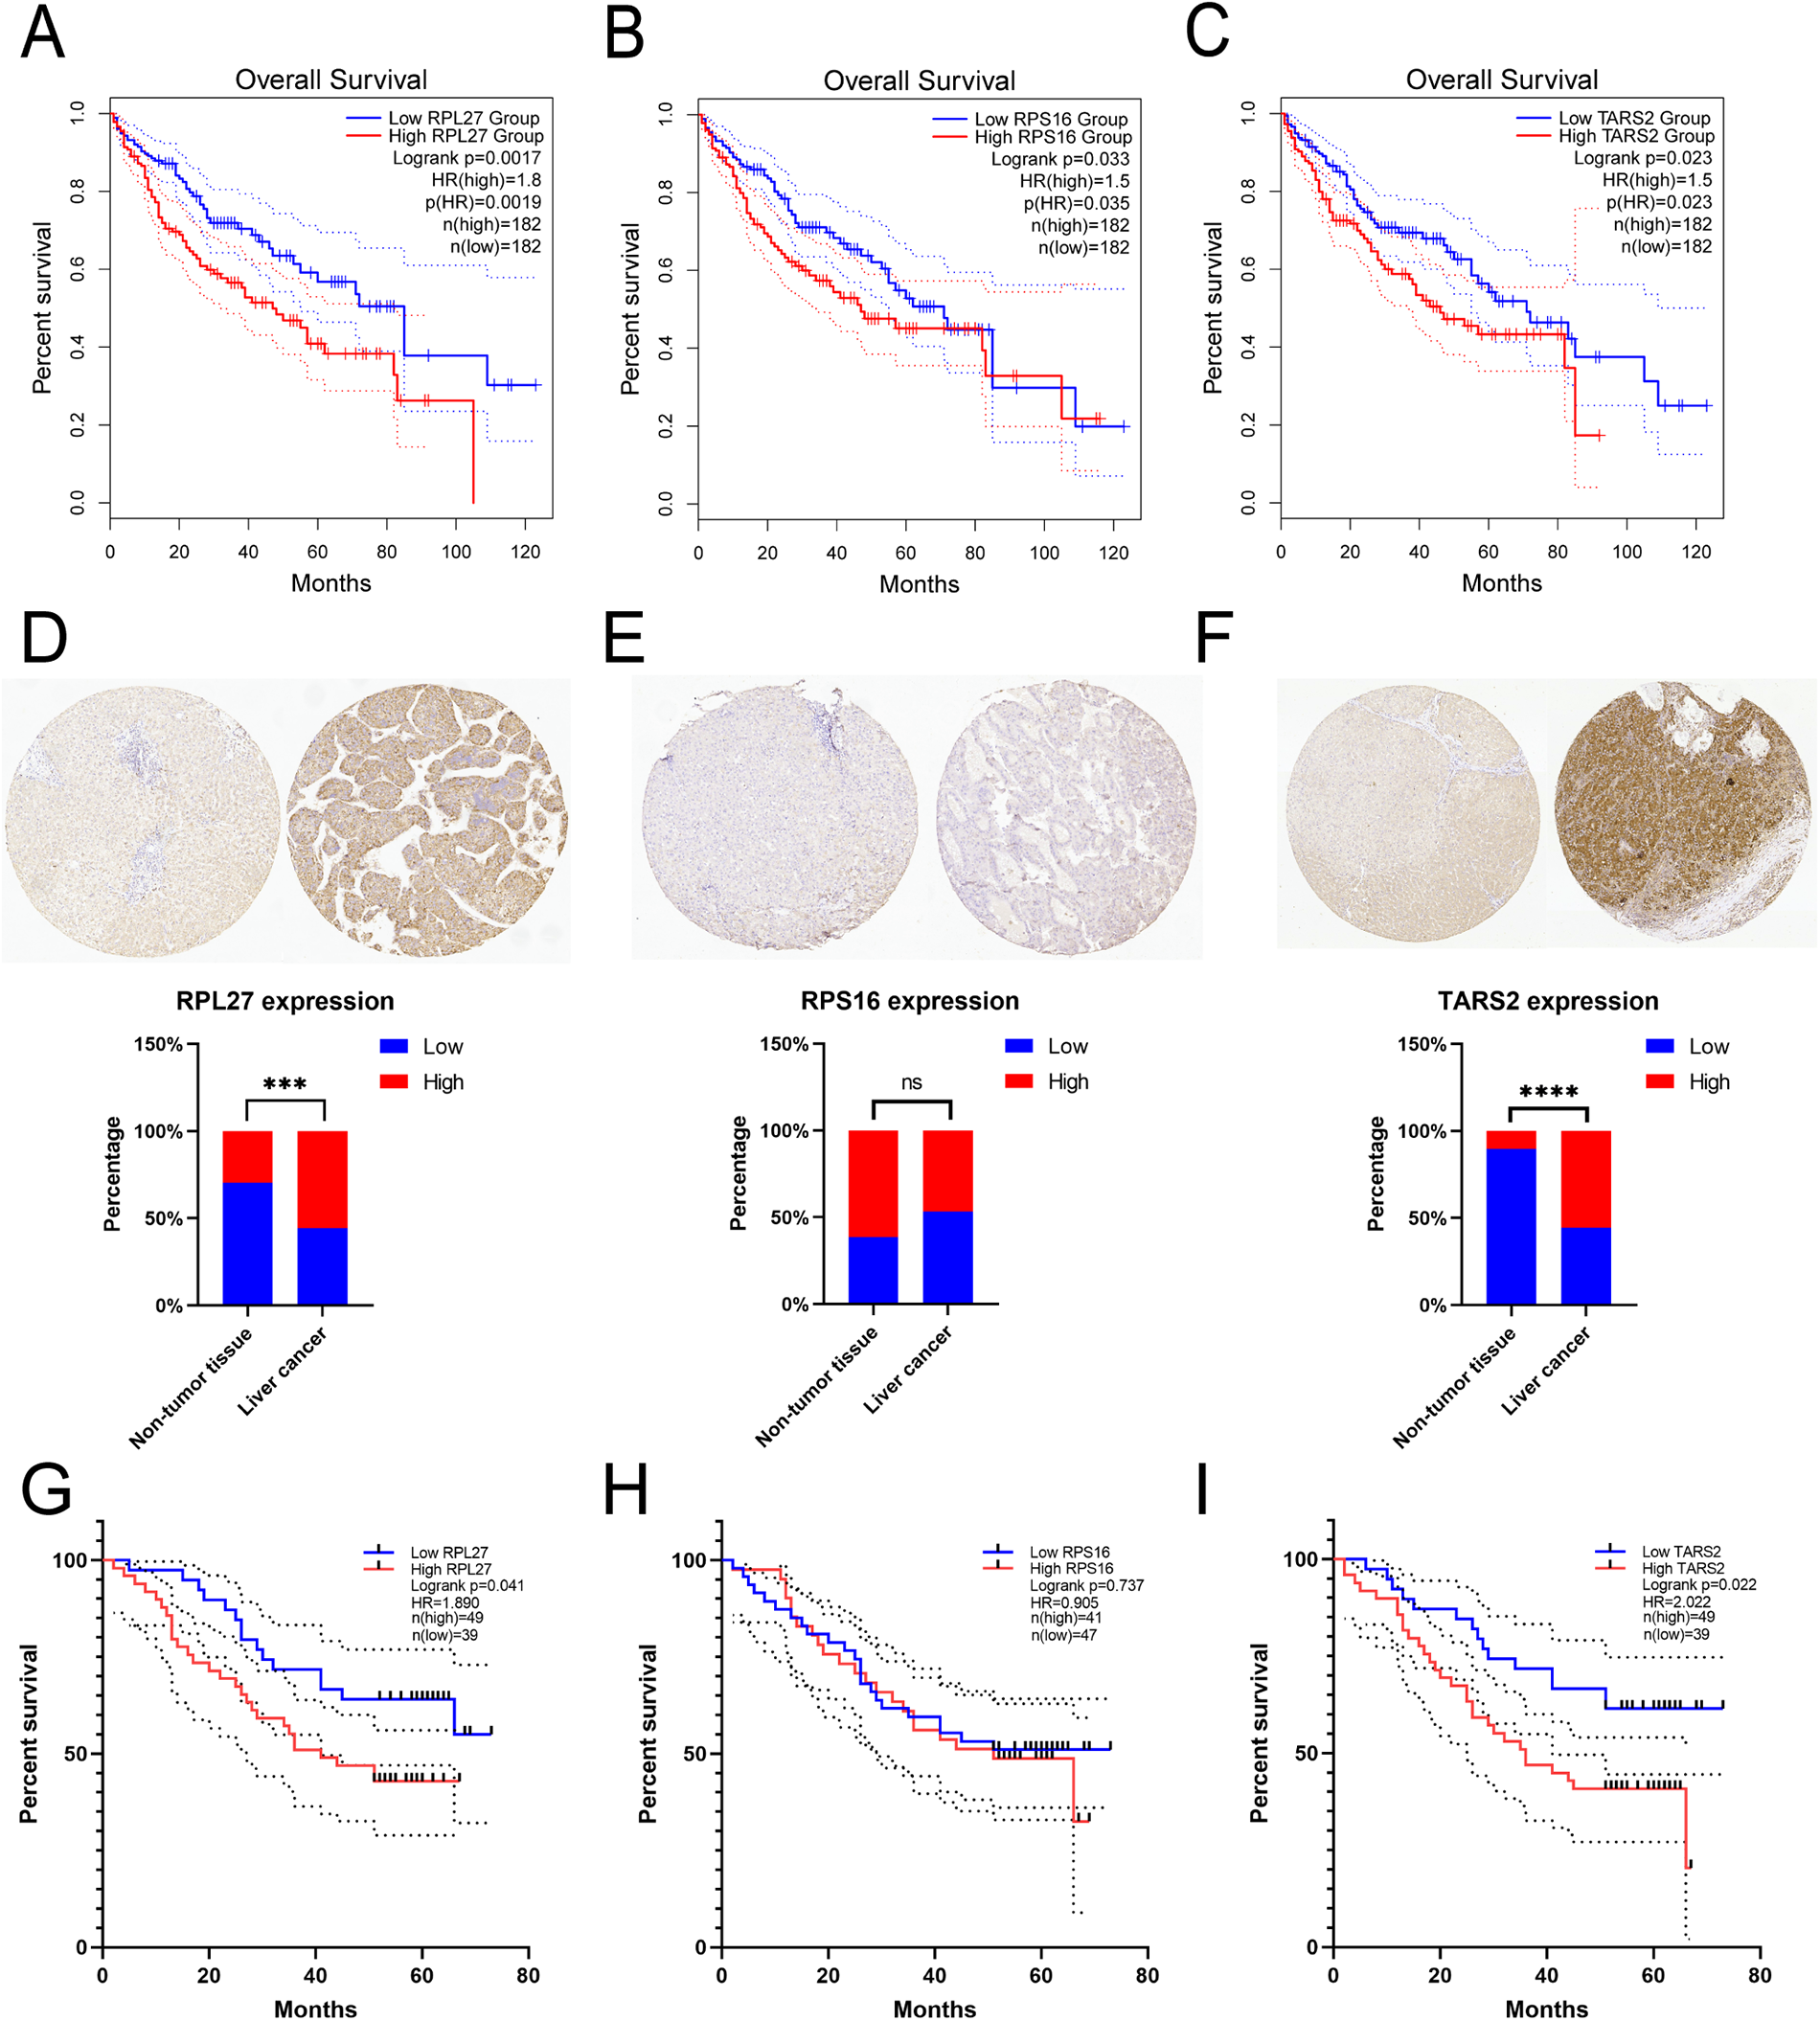
The expression of RPL27, RPS16, and TARS2 in liver cancer correlated with overall survival. TCGA data analysis confirmed that RPL27 (a), RPS16 (b), and TARS2 (c) overexpression predicted reduced overall survival. Immunohistochemical analysis of RPL27 (d), RPS16 (e), and TARS2 (f) on a liver cancer tissue microarray. Representative pictures and statistical charts were shown. Kaplan–Meier curves indicated the validation of biomarkers in overall survival analysis of RPL27 (g), RPS16 (h), and TARS2 (i). *** P < 0.001, **** P < 0.0001.
Discussion
The ribosomal protein family can control the cell cycle and apoptosis, promote angiogenesis, and regulate biological behaviors such as tumor proliferation, invasion, and metastasis by regulating the expressions of oncogenes and tumor suppressor genes.17,18 Ribosomal proteins are involved in the tumorigenesis of multiple neoplasms that include hepatic, prostate, and head and neck cancers. Our proteomics analysis revealed overexpression of ribosomal proteins RPL17, RPL27, RPL27A, RPS5, and RPS16 in HCC. The RPL17 gene encodes a member of the L22p ribosomal protein family that is a component of the 60s subunit. This cytoplasmic protein shares amino acid identity with ribosomal protein L23. RPL17 promotes colorectal cancer proliferation and stemness via the ERK and NEK2/β-catenin signaling axis, 19 and was overexpressed in breast-cancer-associated brain metastases. 20
RPL27, also known as 60S ribosomal protein L27, is a 136 amino acid protein that contains a KOW domain and belongs to the ribosomal protein L27e family. The function of RPL27 is unknown, but may be related to protein translation, rheumatoid arthritis, 21 gastric cancer, 22 and nasopharyngeal carcinoma. 23 RPL27a plays a critical role in maintaining nucleolar integrity and ribosome synthesis/maturation, and may also promote myeloproliferative capacity. Meanwhile, RPL27a expression was significantly upregulated in primary and metastatic triple-negative breast cancer cells. 24
RPS5, a nucleotide-binding leucine-rich repeat protein, is associated with malignant glioma progression, colon cancer metastasis, 25 and erythroid differentiation. 26 RPS16, a 40S cytoplasmic protein that belongs to the s9p ribosomal protein family, participates in rRNA processing; and translation elongation, initiation, and termination through its RNA binding activity. The stability of RPS16 may drive the growth and metastasis of HCC cells. 27 Ribosomal L1 domain containing 1 (RSL1D1), a UL1 ribosomal protein, plays an important role in autophagy and progression of colorectal cancer.28–30 However, the role of RSL1D1 in cancer remains elusive. RSL1D1 promotes proliferation, invasion, and metastasis of colorectal cancer cells by inhibiting autophagy. Whether RSL1D1 promotes HCC development and progression through the same mechanism is questionable.
Aminoacyl tRNA synthetases, a class of key enzymes involved in protein synthesis, recognize particular side chains of amino acids and tRNAs, and catalyze the conjugation of specific tRNAs to their cognate amino acids so that the genetic information of mRNA is accurately and unambiguously transmitted in the consequent amino acid sequences. 31 Aminoacyl tRNA synthetases also function in the regulation of gene expression and signaling pathways, and may potentially serve as biomarkers to enable early diagnosis and to monitor therapeutic response. 32 Mitochondrial threonyl-tRNA synthetase 2 (TARS2) may promote oncogenesis; its knockdown inhibited proliferation and promoted apoptosis of lung adenocarcinoma cells. 33 In addition, the TARS2 gene may promote the growth and metastasis of prostate cancer. 34 YARS2, Tyrosyl-tRNA Synthetase 2 (YARS2) supports mitochondrial protein synthesis and tRNA metabolism. YARS2 has been associated with myopathy, 35 lactic acidosis, 36 deafness, 37 and cancer.38,39 Elevated YARS2 mRNA expression was identified in colorectal cancer tissue, and its knockdown inhibited proliferation and migration. Single-nucleotide polymorphisms of the gene that encodes methionyl-tRNA synthetase 2 (MARS2) have been associated with developmental delay, poor growth, and sensorineural hearing loss. 40 MARS2 has also been suggested as a biomarker of gastric cancer. MARS2 expression following mir-4661-5p-mediated kdm5d downregulation correlated with the malignant behavior of gastric cancer cells. 41 Asparaginyl tRNA synthetase 1 (NARS1) is a cytoplasmic class IIa tRNA synthetase that is essential to translation and radial glial cell proliferation; its deficiency may lead to microcephaly. 42
DEAD-box RNA helicase (DDX18) is a nucleolar protein ubiquitously expressed in tumor cells, and expressed more abundantly in proliferating cells. DDX18 not only promotes gastric cancer cell migration and invasion, but also promotes in vitro and in vivo gastric cancer cell proliferation through the PTEN-Akt signaling pathway. 43 DDX18 is overexpressed in chronic kidney disease, 44 breast cancer,45–47 and esophageal squamous cell carcinoma. 48 RRP12 is an RNA-binding protein that participates in nucleolar protein maturation and trafficking of eukaryotic ribosomal subunits. RRP12 has been associated with the occurrence and progression of a variety of cancers, and could serve as a potential independent prognostic indicator for patients with HCC. Furthermore, because its knockdown can inhibit proliferation, invasion, and metastasis of HCC cells, it may represent a novel therapeutic target. 49 In-depth quantitative proteomic analysis suggests that RRP12 plays an important role in the oncogenesis of colorectal cancer. 50 RRP12 also represses p53 stability osteosarcoma cells during cytotoxic stress.
Our study first proposed 4D proteomics combined with PRM to screen and validate biomarkers for HCC. We have completed the dual biological validation of PRM and Western blot to propose that ribosomal proteins and tRNA synthetases may be associated with liver cancer. Meanwhile, the TCGA database confirmed that RPL27, RPS16, and TARS2 overexpression predicted reduced overall survival in HCC patients. To further confirm the putative prognostic biomarkers, a tissue microarray was used, which demonstrated that RPL27 and TARS2 expression was higher in liver cancer tissues than in non-tumor tissues and was negatively associated with the prognosis of HCC patients. This corresponded to the trend of the TCGA database results. However, no significant difference in RPS16 expression was found between cancer and non-tumor tissues, and there was no association with prognosis. This conclusion could be explained by the fact that our study was hampered by its small sample size. Our findings should be verified by proteome-wide studies in larger cohorts.
Conclusions
Our 4D label-free quantitative proteomics approach identified DEPs associated with hepatocarcinogenesis, which were bioinformatically associated primarily with ribosomal proteins and tRNA synthetases and validated by PRM. In addition, we further validated RPL27, RPS16, and TARS2 in liver cancer tissue by Western blot. Tissue microarray indicated that RPL27 and TARS2 can be used as prognostic biomarkers to track therapy response.
Highlights
Our study first used 4D label-free quantitative proteomics to compare the proteomes of hepatocellular carcinoma and adjacent non-tumor tissue.
Twelve differentially expressed proteins were selected for identification and validation by Western blotting and parallel reaction monitoring.
We proved that RPL27, RPS16, and TARS2 may be biomarkers of hepatocellular carcinoma patients through The Cancer Genome Atlas datasets.
Supplemental Material
sj-docx-1-jbm-10.1177_03936155231212925 - Supplemental material for Potential prognostic biomarkers of hepatocellular carcinoma based on 4D label-free quantitative proteomics analysis pilot investigation
Supplemental material, sj-docx-1-jbm-10.1177_03936155231212925 for Potential prognostic biomarkers of hepatocellular carcinoma based on 4D label-free quantitative proteomics analysis pilot investigation by Lida Suo, Xiangnan Liang, Weibin Zhang, Mingwei Gao, Taiheng Ma, Daosheng Hu, Yilin Song and Zhenming Gao in The International Journal of Biological Markers
Supplemental Material
sj-tif-2-jbm-10.1177_03936155231212925 - Supplemental material for Potential prognostic biomarkers of hepatocellular carcinoma based on 4D label-free quantitative proteomics analysis pilot investigation
Supplemental material, sj-tif-2-jbm-10.1177_03936155231212925 for Potential prognostic biomarkers of hepatocellular carcinoma based on 4D label-free quantitative proteomics analysis pilot investigation by Lida Suo, Xiangnan Liang, Weibin Zhang, Mingwei Gao, Taiheng Ma, Daosheng Hu, Yilin Song and Zhenming Gao in The International Journal of Biological Markers
Supplemental Material
sj-tif-3-jbm-10.1177_03936155231212925 - Supplemental material for Potential prognostic biomarkers of hepatocellular carcinoma based on 4D label-free quantitative proteomics analysis pilot investigation
Supplemental material, sj-tif-3-jbm-10.1177_03936155231212925 for Potential prognostic biomarkers of hepatocellular carcinoma based on 4D label-free quantitative proteomics analysis pilot investigation by Lida Suo, Xiangnan Liang, Weibin Zhang, Mingwei Gao, Taiheng Ma, Daosheng Hu, Yilin Song and Zhenming Gao in The International Journal of Biological Markers
Supplemental Material
sj-docx-4-jbm-10.1177_03936155231212925 - Supplemental material for Potential prognostic biomarkers of hepatocellular carcinoma based on 4D label-free quantitative proteomics analysis pilot investigation
Supplemental material, sj-docx-4-jbm-10.1177_03936155231212925 for Potential prognostic biomarkers of hepatocellular carcinoma based on 4D label-free quantitative proteomics analysis pilot investigation by Lida Suo, Xiangnan Liang, Weibin Zhang, Mingwei Gao, Taiheng Ma, Daosheng Hu, Yilin Song and Zhenming Gao in The International Journal of Biological Markers
Supplemental Material
sj-docx-5-jbm-10.1177_03936155231212925 - Supplemental material for Potential prognostic biomarkers of hepatocellular carcinoma based on 4D label-free quantitative proteomics analysis pilot investigation
Supplemental material, sj-docx-5-jbm-10.1177_03936155231212925 for Potential prognostic biomarkers of hepatocellular carcinoma based on 4D label-free quantitative proteomics analysis pilot investigation by Lida Suo, Xiangnan Liang, Weibin Zhang, Mingwei Gao, Taiheng Ma, Daosheng Hu, Yilin Song and Zhenming Gao in The International Journal of Biological Markers
Supplemental Material
sj-rar-6-jbm-10.1177_03936155231212925 - Supplemental material for Potential prognostic biomarkers of hepatocellular carcinoma based on 4D label-free quantitative proteomics analysis pilot investigation
Supplemental material, sj-rar-6-jbm-10.1177_03936155231212925 for Potential prognostic biomarkers of hepatocellular carcinoma based on 4D label-free quantitative proteomics analysis pilot investigation by Lida Suo, Xiangnan Liang, Weibin Zhang, Mingwei Gao, Taiheng Ma, Daosheng Hu, Yilin Song and Zhenming Gao in The International Journal of Biological Markers
Footnotes
Author contributions
LS and ZG designed the study. LS supervised the proteomics part, and drafted the manuscript. TM and WZ collected and analyzed the data. MG and XL performed the experiment. DH and YS performed the analysis with constructive discussions. ZG checked the manuscript.
Data availability statement
Declaration of conflicting interests
The author(s) declared no potential conflicts of interest with respect to the research, authorship, and/or publication of this article.
Funding
The author(s) disclosed receipt of the following financial support for the research, authorship, and/or publication of this article: This research is supported by the Basic Scientific Research Projects of the Second Hospital of Dalian Medical University (2022LCJSZD01).
Supplemental material
Supplemental material for this article is available online.
References
Supplementary Material
Please find the following supplemental material available below.
For Open Access articles published under a Creative Commons License, all supplemental material carries the same license as the article it is associated with.
For non-Open Access articles published, all supplemental material carries a non-exclusive license, and permission requests for re-use of supplemental material or any part of supplemental material shall be sent directly to the copyright owner as specified in the copyright notice associated with the article.