
Abstract
Background
To evaluate the diagnostic value of combinations of tumor markers carcinoembryonic antigen (CEA), carbohydrate antigen (CA) 125, CA153, and CA19-9 in identifying malignant pleural effusion (MPE) from non-malignant pleural effusion (non-MPE) using machine learning, and compare the performance of popular machine learning methods.
Methods
A total of 319 samples were collected from patients with pleural effusion in Beijing and Wuhan, China, from January 2018 to June 2020. Five machine learning methods including Logistic regression, extreme gradient boosting (XGBoost), Bayesian additive regression tree, random forest, and support vector machine were applied to evaluate the diagnostic performance. Sensitivity, specificity, Youden's index, and the area under the receiver operating characteristic curve (AUC) were used to evaluate the performance of different diagnostic models.
Results
For diagnostic models with a single tumor marker, the model using CEA, constructed by XGBoost, performed best (AUC = 0.895, sensitivity = 0.80), and the model with CA153, also by XGBoost, showed the largest specificity 0.98. Among all combinations of tumor markers, the combination of CEA and CA153 achieved the best performance (AUC = 0.921, sensitivity = 0.85) in identifying MPE under the diagnostic model constructed by XGBoost.
Conclusions
Diagnostic models for MPE with a combination of multiple tumor markers outperformed the models with a single tumor marker, particularly in sensitivity. Using machine learning methods, especially XGBoost, could comprehensively improve the diagnostic accuracy of MPE.
Keywords
Introduction
Malignant pleural effusion (MPE) refers to an abnormal accumulation of fluid and malignant cells or tumor issues in the pleural space. MPE is mainly caused by primary cancers such as lung cancer, breast cancer, lymphomas, or secondary cancer that has metastasized to the pleura.1,2 The median survival time after diagnosis of MPE ranges from 4 to 7 months, which means that MPE is significantly associated with high mortality and poor prognosis.3,4 Early diagnosis of the nature of pleural effusion is critical for doctors and patients as it could affect both treatment options and patient outcomes. 5
The accuracy of traditional methods for diagnosing MPE varies widely. For instance, pleural effusion cytology was the simplest diagnostic method, with accuracy ranging widely from 62% to 90%. 6 As an alternative to pleural effusion cytology, analysis of pleural effusion tumor markers was considered a less invasive method. 7 In particular, carcinoembryonic antigen (CEA), carbohydrate antigen (CA)199, CA125, and CA153 are frequently used clinical tumor markers and have shown suggestive significance in MPE diagnosis.8–11 For this approach, using cut-off values of tumor marker concentrations to make diagnostic decisions has been the most common way. However, it may not perform well in practice when there are complex associations between tumor markers.
Machine learning is a class of learning methods using flexible models and efficient algorithms. Machine learning methods usually make weak assumptions on the data, and can be used to deal with complex associations among tumor markers. Exiting literature has shown that machine learning methods have good performances in medical diagnoses. Specifically, Ren et al. 12 used four learning methods: logistic regression (LR), k-nearest neighbors (KNN), random forest (RF), and support vector machine (SVM), to establish a diagnostic model for tuberculous pleural effusion. Recently, Li et al. 13 used a deep learning method and five machine learning methods to identify MPE, and obtained a maximum area under the curve (AUC) value of 0.916 in a test set. Bianconi et al. 14 and Palumbo et al. 15 used SVM and a tree-based method to differentiate between benign and malignant lung lesions. In another paper, Wang et al. 16 first used LR to screen variables and created a novel nomogram-based scoring system to distinguish MPE. However, these studies mainly considered single tumor markers, such as CEA, in their diagnostic models. None of these studies investigated the performance of a combination of multiple tumor markers, such as CA19-9, CA153, and CA125, in the diagnosis of MPE. Lin et al. 17 used a decision tree model to identify different types of pleural effusions using 11 biomarkers in serum and pleural effusion. However, the decision tree method they applied is known to be inaccurate and can be further improved using ensemble learning methods such as RF.
In this study, diagnostic models were developed using five learning methods: extreme gradient boost (XGBoost), LR, Bayesian additive regression tree (BART), RF, and SVM, aiming to evaluate the diagnostic value of tumor marker combinations (CEA, CA19-9, CA125, and CA153) in identifying MPE.
Materials and methods
Study population and diagnostic criteria
A total of 319 cases with pleural effusion were collected from January 2018 to June 2020, including 174 patients admitted to the Department of Respiratory and Critical Care Medicine, Beijing Chaoyang Hospital, Capital Medical University, and 145 admitted to a hospital in Wuhan. We distinguished between exudative pleural effusion or leakage pleural effusion based on the light standard. The diagnostic criteria for malignant pleural effusion were pathological diagnosis that is, the presence of malignant tumor cells found in pleural effusion and/or pleural biopsy specimens.
Pleural effusion has a wide differential diagnosis, including various non-malignant etiologies such as tuberculous pleural effusion, pneumonia, congestive heart failure, and so on. The diagnostic criteria for tuberculous pleural effusion were positive pleural effusion, sputum, or pleural biopsy specimens stained by Ziehl-Neelsen or Lowenstein-Jensen culture, or tuberculosis granuloma found in parietal pleural biopsy; pleural effusion associated with bacterial pneumonia, lung abscess, and bronchiectasis infection disappeared after anti-infective treatment compared with clinical symptom and NT-proBNP; heart failure that eventually transformed into pleural effusion was judged by cardiac color Doppler ultrasound, imaging examinations, and other relevant diagnostic criteria. Patients with pleural effusion were classified according to the etiology, with 111 patients in the malignant pleural effusion group and 208 in the benign pleural effusion group.
Specimen collection and measurement
Pleural fluid was collected from all patients before receiving any treatment. Samples were centrifuged on the same day (below 4°C, 1500 rpm, 10 min). The supernatant was taken and frozen at −80°C, and the chemiluminescence method was used to detect CEA (Abbott Ireland Diagnostics Division, Sligo, Ireland), CA125, CA153, and CA19-9 (Abott Laboratories, Malvern, PA, USA) tumors.
Statistical analysis
Concentrations of tumor markers were first standardized and then included in the diagnostic model as dependent variables. In addition to tumor markers, we also considered other baseline covariates into the model, such as patients’ age, gender, and region. The response variable (Y) was a dichotomous variable, with Y = 1 indicating malignant pleural effusion, and Y = 0 for non-malignant pleural effusion. Tumor marker concentrations and patient age were continuous numerical variables, while gender and region were categorical variables. Five learning methods—XGBoost, LR, BART, RF, and SVM—were applied to construct diagnostic models and explore which tumor-marker combination model could achieve the best diagnostc accuracy for MPE. The R software (version R-4.0.3) together with packages XGBoost, Bayes tree, random forest, and e1071 were utilized to implement model training, variable selection, and model evaluations.
We adopted a three-fold cross-validation strategy for model training and validation. The observed data were randomly divided into three equal-sized groups, then two of the groups were selected as a training data set at each time, and the remaining one group as a test set. An average of prediction accuracy at each test set was calculated as the final estimation of the diagnostic accuracy to reduce the numerical fluctuations caused by random splitting. Finally, we calculated the corresponding sensitivity, specificity, and Youden's index, and plotted the receiver operating characteristic (ROC) curve to determine the area under the ROC curve (AUC) to evaluate the performance of different diagnostic models. Youden's index = sensitivity + specificity-1, which was used to comprehensively compare sensitivity and specificity. A higher value indicates better authenticity of the model. A P-value <0.05 was considered statistically significant.
Results
Patients and clinical characteristics
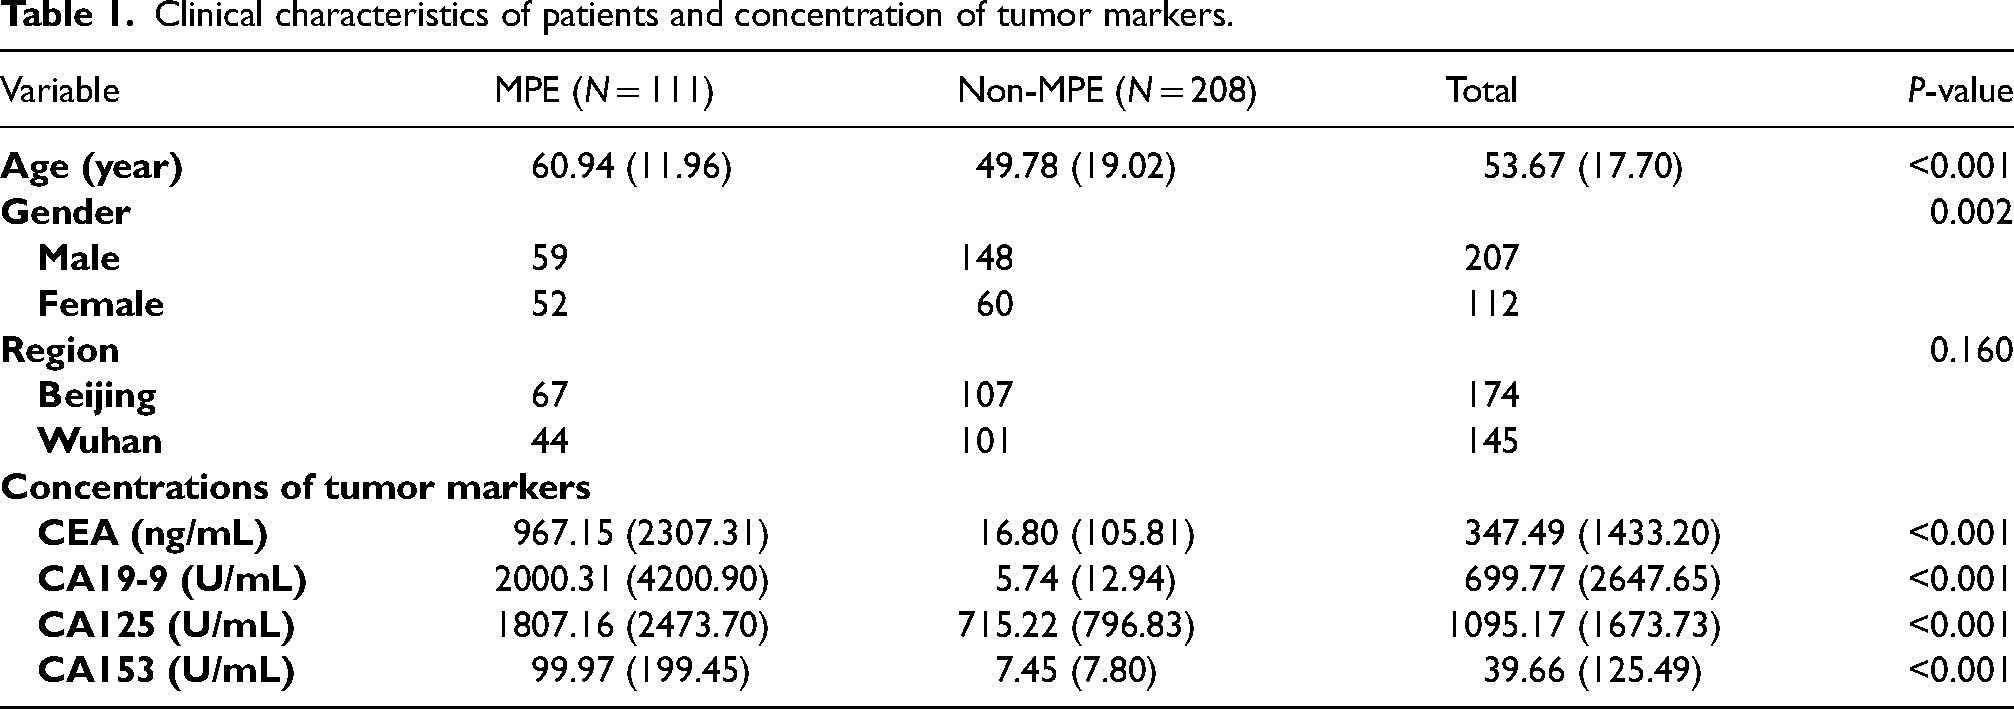
The characteristics of the included patients are summarized in Table 1. The results showed that the concentrations of CEA, CA19-9, CA125, and CA153 in MPE patients were all significantly higher than those in non-MPE patients (all P-values < 0.001).
Clinical characteristics of patients and concentration of tumor markers.
Performance of diagnostic models with different tumor markers
The results of single tumor marker diagnostic models are summarized in Table S1. The single tumor marker diagnostic model with CEA constructed by XGBoost performed best in diagnosis, with a Youden's index 0.72 and corresponding AUC, sensitivity, and specificity of 0.895 (95% CI 0.828, 0.963), 0.80 (95% CI 0.68, 0.93), and 0.92 (95% CI 0.85 0.98), respectively. Figure 1 shows that among all single tumor marker models, the XGBoost model with CEA obtained the largest AUC (0.895) and the largest sensitivity (0.80), and the XGBoost model with CA153 reached the largest specificity (0.98).
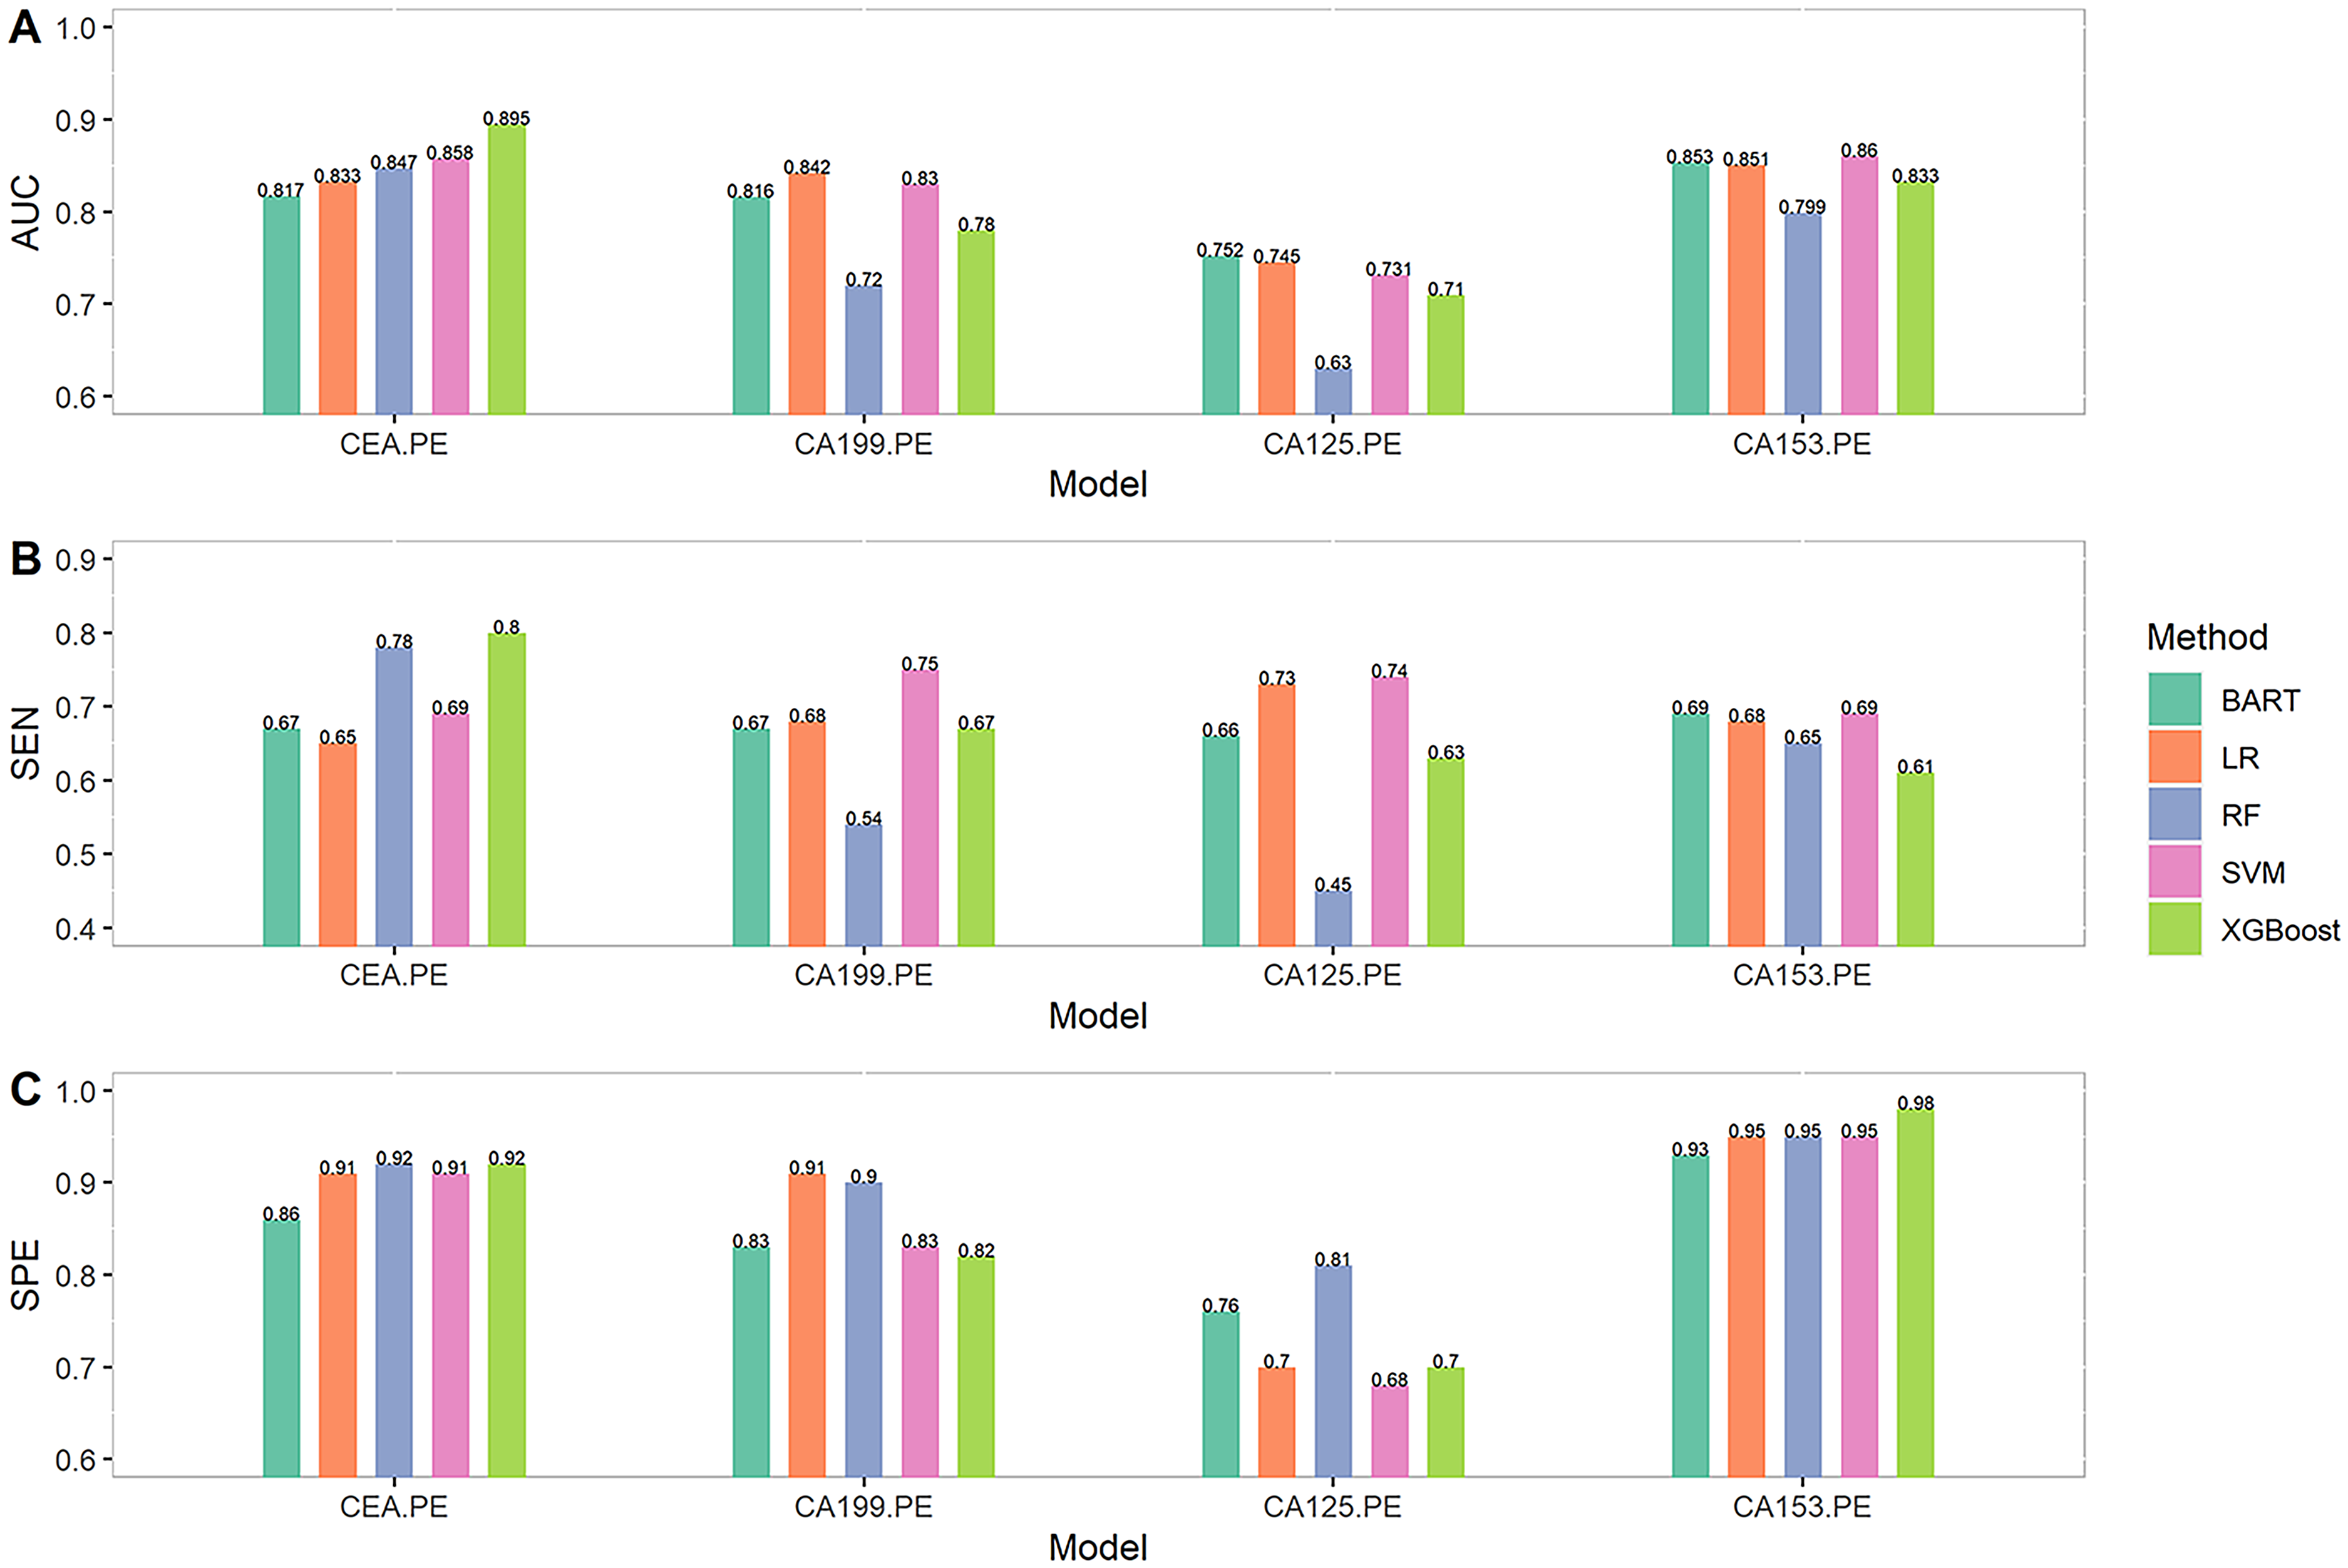
Results of single tumor marker diagnostic models.
The diagnostic model results of different combinations of CEA, CA199, CA125, and CA153 are summarized in Table S2. Among all diagnostic models, the XGBoost model with the combination of CEA + CA153 achieved the largest AUC (0.921; 95% CI 0.862, 0.979) and the largest sensitivity (0.85; 95% CI 0.73, 0.96). Both the XGBoost model with CA125 + CA153 and the LR model with CEA + CA153 + CA19-9 achieved the largest specificity (0.97).
Compared with single tumor marker models, the best XGBoost model with combination of CEA + CA153 increased AUC by 2.8∼30% and sensitivity by 6.2∼39.3%. The best LR model with combination of CEA + CA153 + CA125 increased AUC by 5.5%∼20% and sensitivity by 4.1%∼16.9%. The best BART model with the combination of CEA + CA153 + CA125 + CA19-9 increased AUC by 4.2%∼18.2% and sensitivity by 14.5%∼19.7%. The best RF model with CEA + CA153 + CA125 increased AUC by 4.5%∼40.5% and sensitivity by 5.1%∼82.2%. The best SVM model with CEA + CA19-9 increased AUC by 4.9%∼23.4% and sensitivity by 10.7%∼20.3%.
Performance of different machine learning methods
The results of diagnostic models constructed using five machine learning methods are summarized in Table S2. Regarding the XGBoost method, the model in combination with CEA + CA153 obtained the largest AUC (0.921), and the model with CEA + CA153 + CA125 or CEA + CA125 + CA153 + CA19-9 had the largest Youden’s index of 0.77. AUC, sensitivity, and specificity of the XGBoost model with CEA + CA153 + CA125 were 0.902 (95% CI 0.833, 0.971), 0.83 (95% CI 0.71, 0.95), and 0.94 (95% CI 0.89, 1.00), respectively. For the LR method, the diagnostic model with CEA + CA153 + CA19-9 achieved the best performance. The corresponding AUC, sensitivity, and specificity were 0.898 (95% CI 0.826, 0.969), 0.76 (95% CI 0.63, 0.90), and 0.97 (95% CI 0.92, 1.00), respectively. When using BART, CEA + CA125 + CA153 + CA19-9 was the best combination for MPE diagnosis, whose AUC was 0.889 (95% CI 0.815, 0.962), sensitivity 0.79 (95% CI 0.66, 0.92), specificity 0.92 (95% CI 0.87, 0.97), and Youden's index 0.71. For the RF method, the best performance model was the CEA + CA153 + CA125 combination, which achieved the largest Youden's index 0.77, AUC 0.885 (95% CI 0.816, 0.953), sensitivity 0.82 (95% CI 0.69, 0.94), and specificity 0.95 (95% CI 0.90, 1.00). For the SVM method, the diagnostic model CEA + CA19-9 with AUC 0.902 (95% CI 0.837, 0.965), sensitivity 0.83 (95% CI 0.71, 0.95), specificity 0.89 (95% CI 0.81, 0.96) and Youden's index 0.72, achieved the best performance in diagnosis. The values of AUC, sensitivity, and specificity of all diagnostic models constructed using five machine learning methods are shown in Figure 2. The ROC curves of the optimal diagnostic models using XGBoost, LR, BART, RF, and SVM are shown in Figure 3, which indicates that the diagnostic models using XGBoost perform best overall.
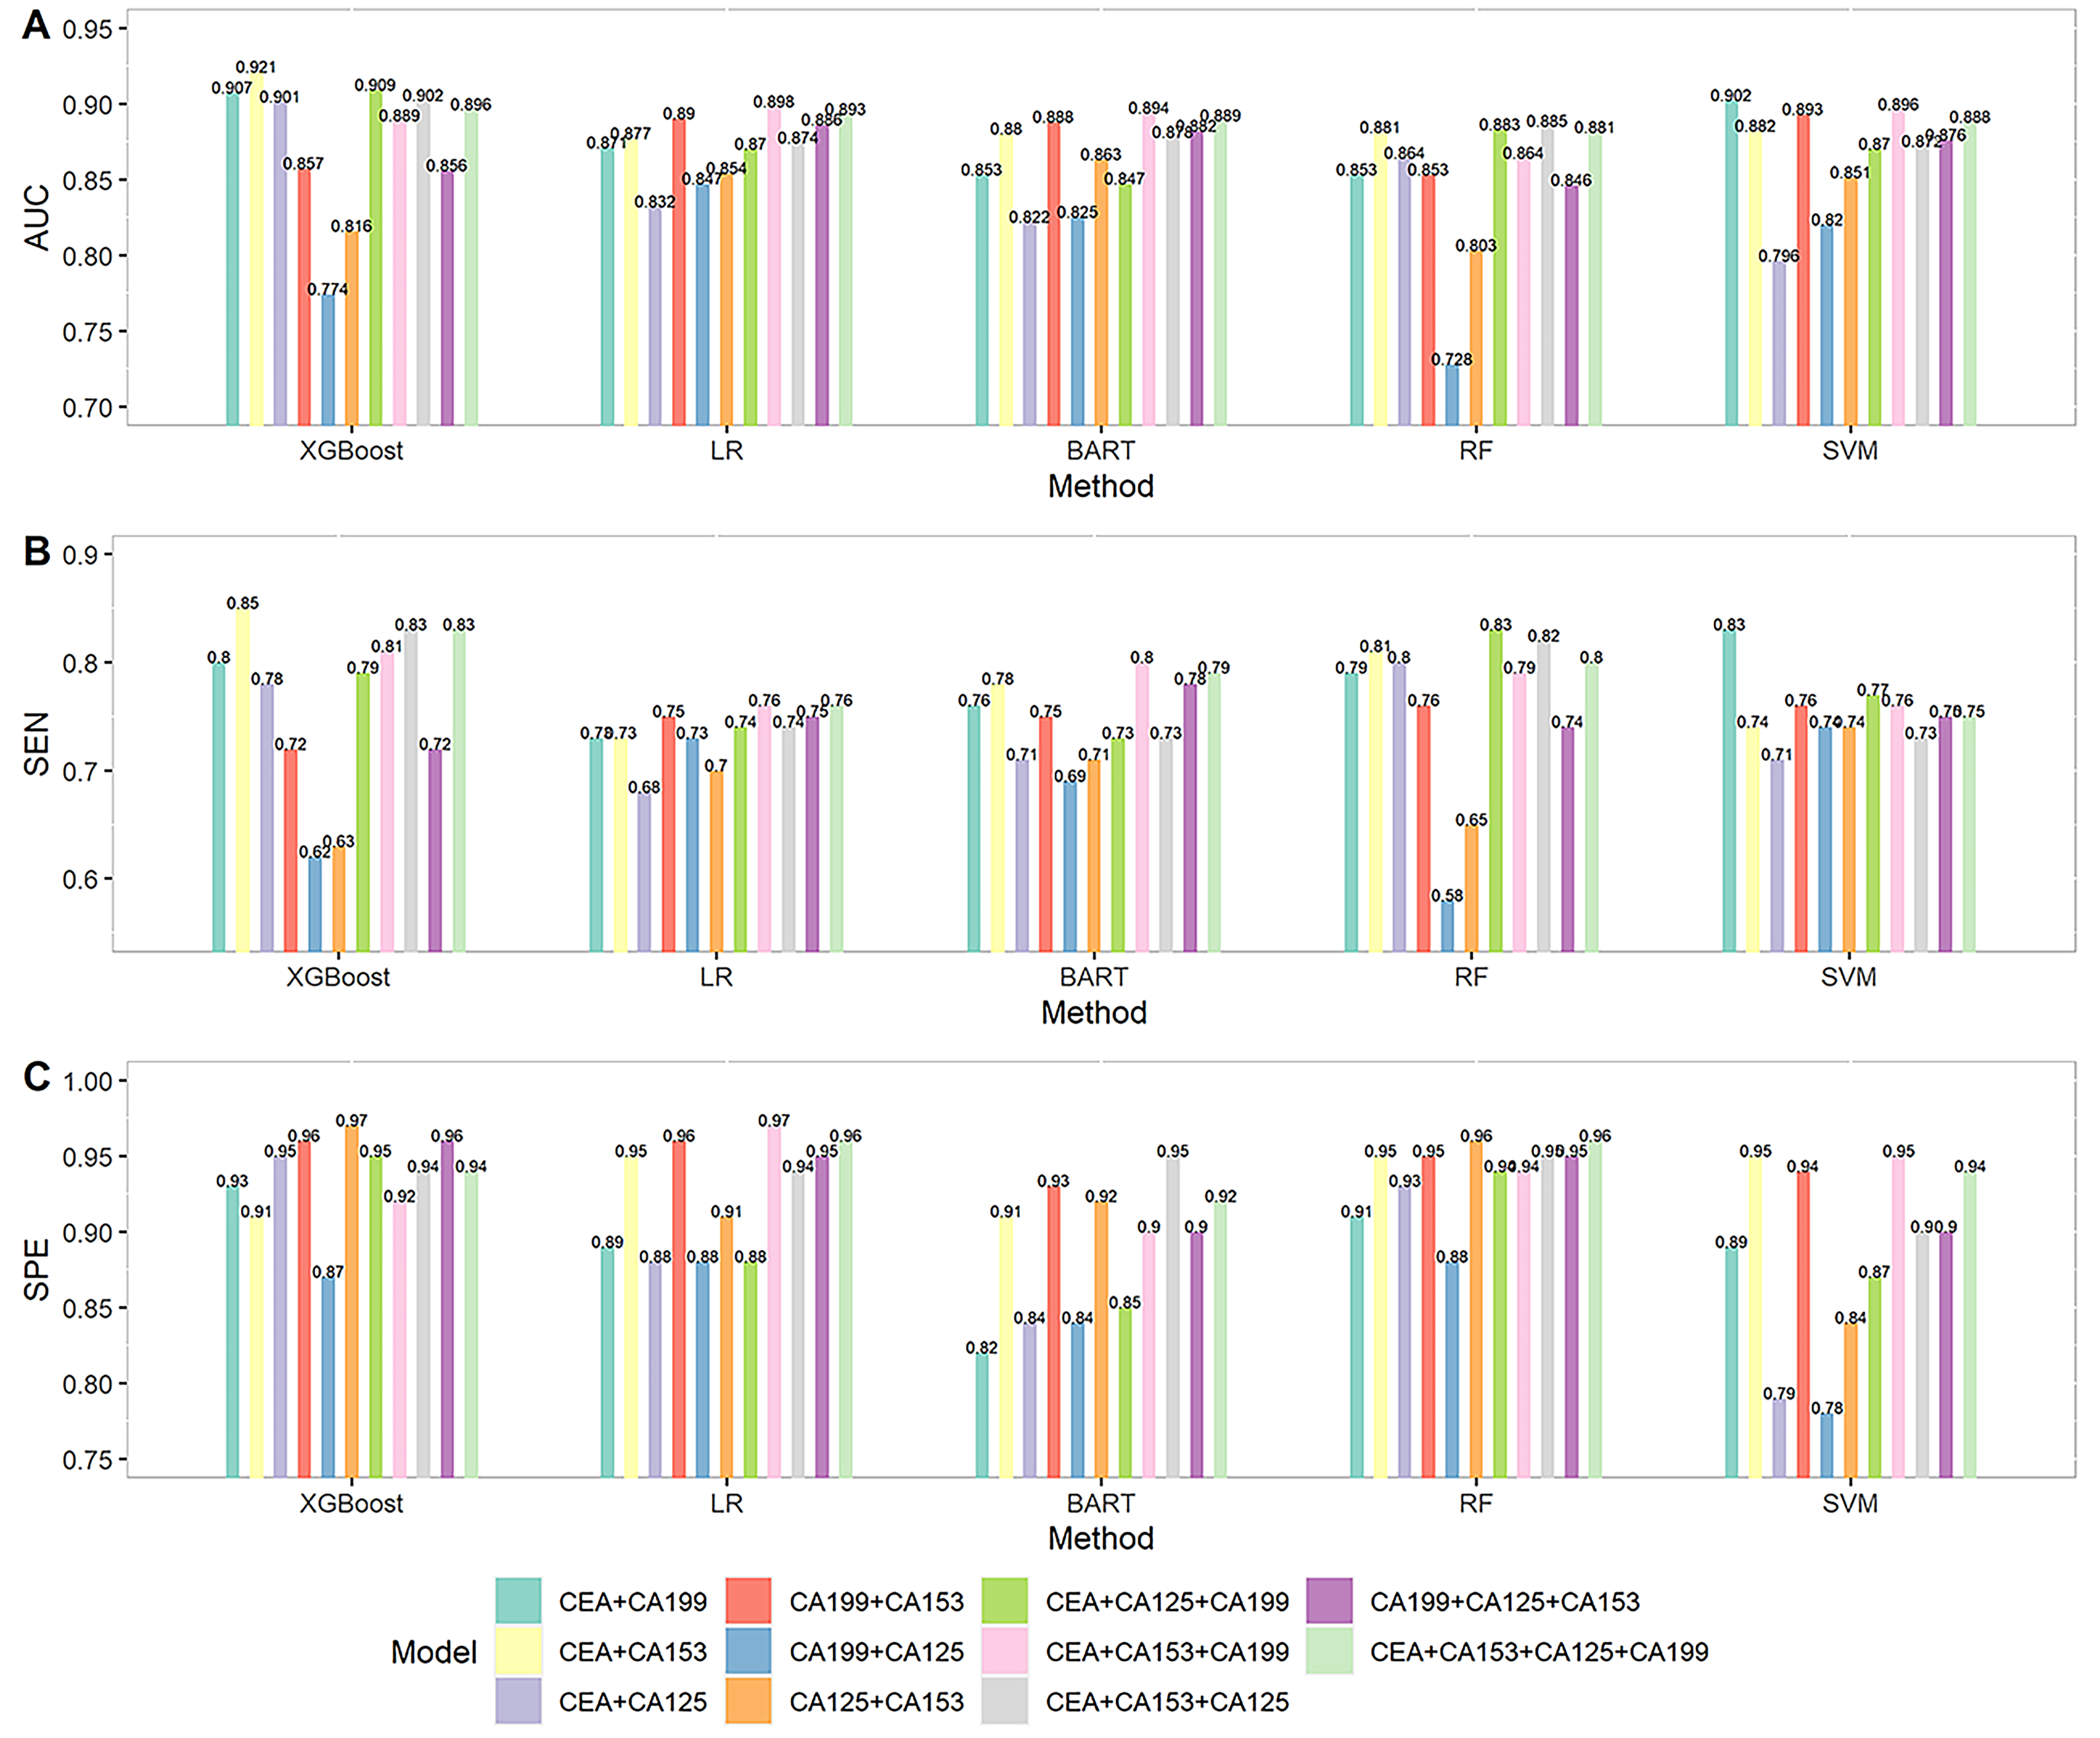
AUC, sensitivity, and specificity of combined tumor marker diagnostic models.
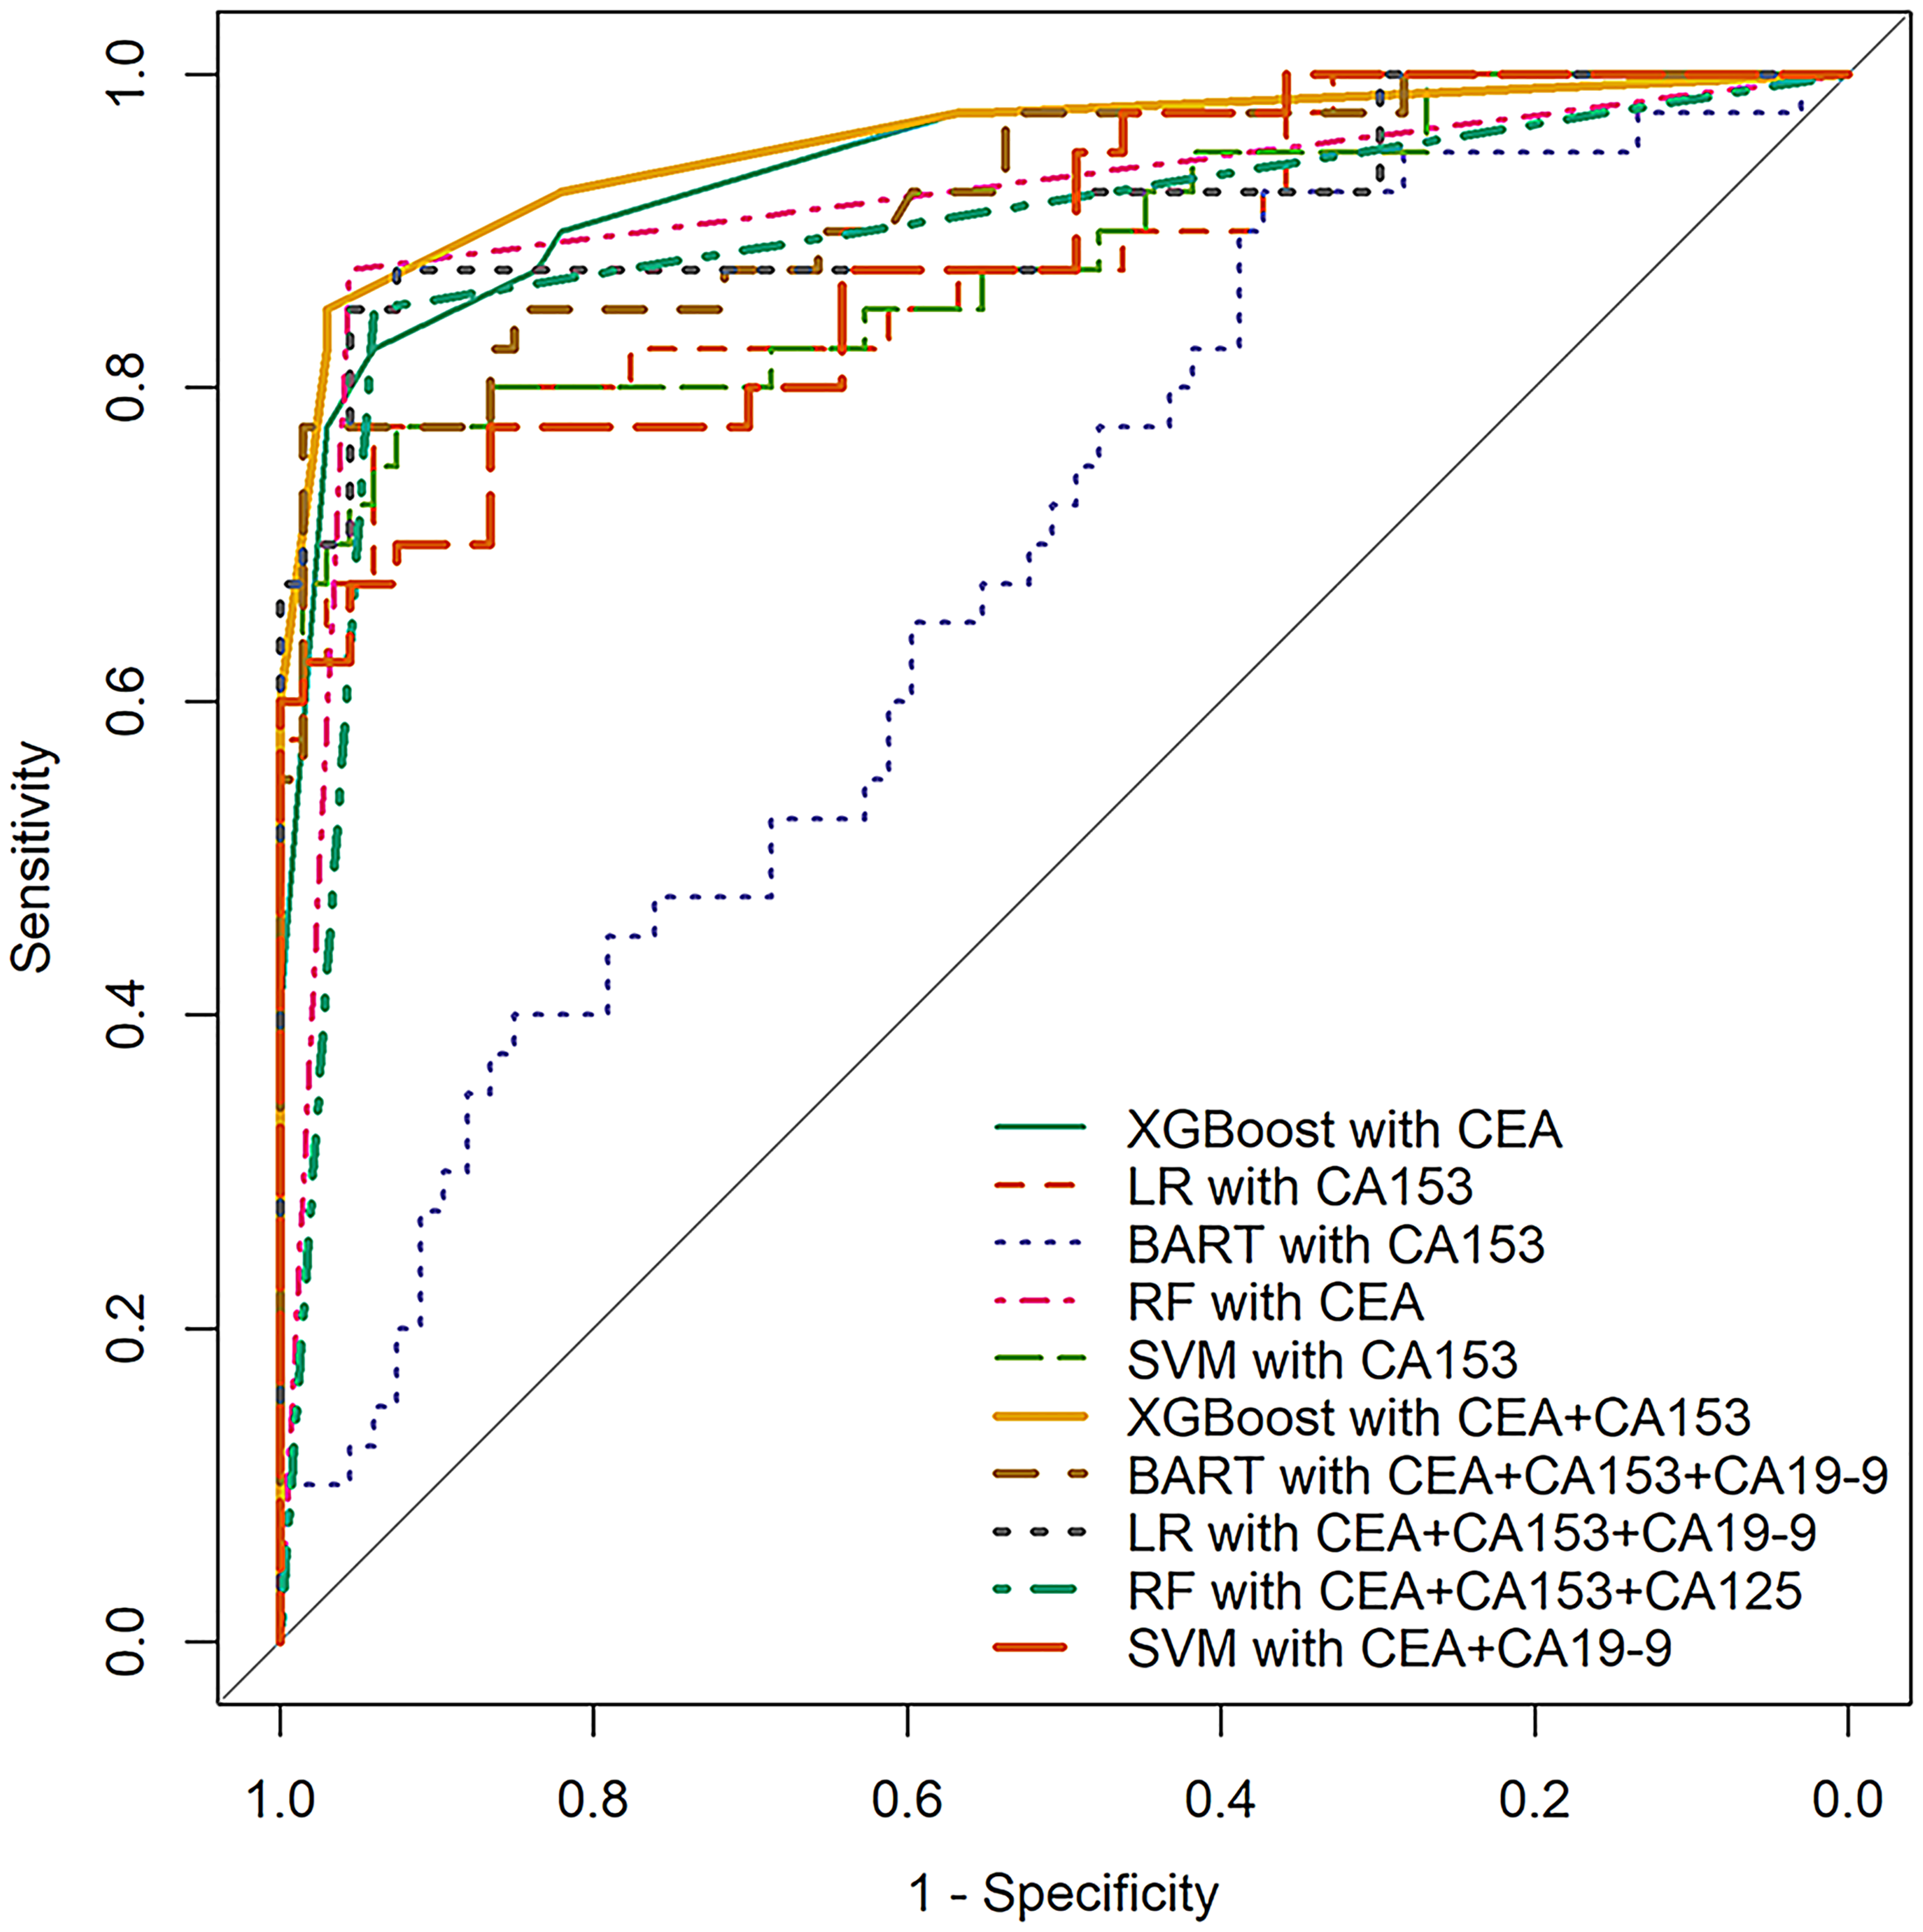
ROC curves of the optimal single and combined diagnostic models using XGBoost, LR, BART, RF and SVM.
For all single tumor marker and combined tumor marker models, the largest AUCs obtained by XGBoost, SVM, LR, BART, and RF were 0.921, 0.902, 0.898, 0.894, and 0.885, respectively, and largest sensitivities were 0.85, 0.83, 0.83, 0.80, and 0.76, respectively. The largest specificities of XGBoost, LR, RF, SVM, and BART were 0.98, 0.97, 0.96, 0.95, and 0.95, respectively. As shown in Figure 4, models using XGBoost achieve the maximum values in AUC, sensitivity, and specificity, indicating that XGBoost is superior to LR, RF, SVM, and BART in this application. Figure 4 also reveals that a major drawback of LR is its low sensitivity in the diagnosis of MPE.
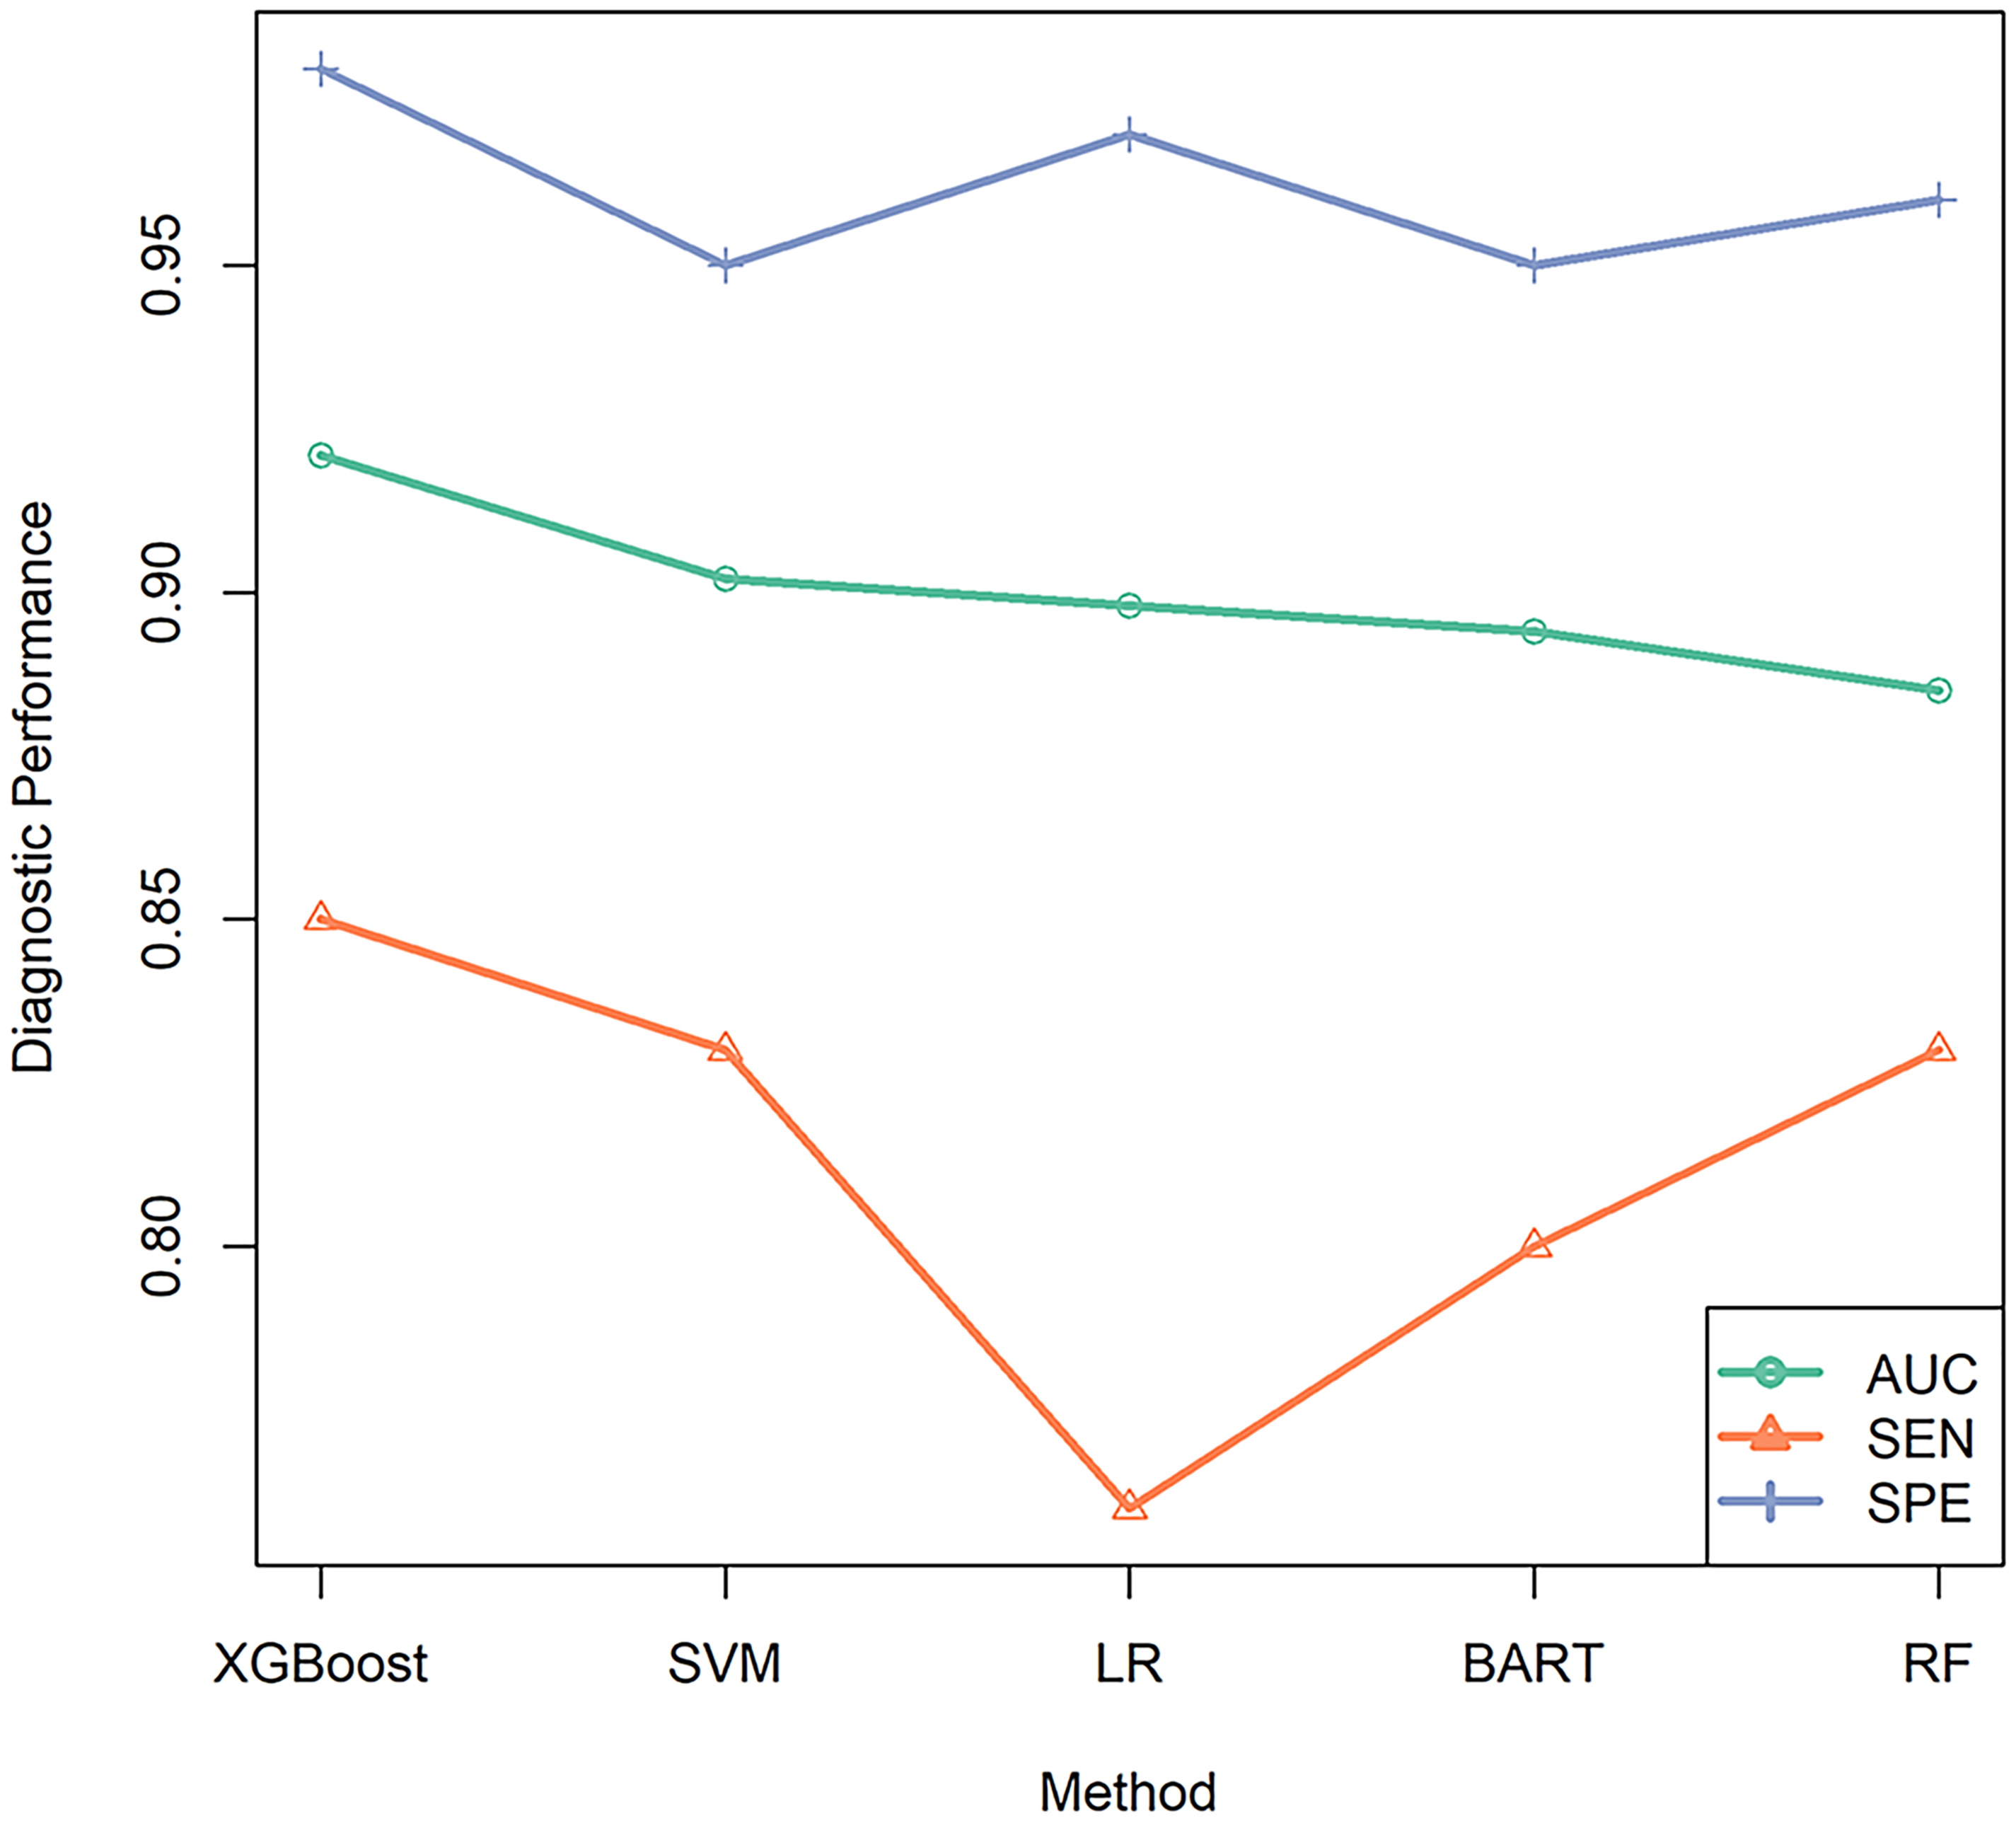
The line chart of best AUC, sensitivity, and specificity values for all diagnostic models using XGBoost, SVM, LR, BART and RF, respectively.
The commonly used LR method can be selected as a benchmark method for comparison. Compared to the best performance of the LR model when in combination with CEA + CA153 + CA19-9, the XGBoost model with CEA + CA153 improved the sensitivity by 7.6% but decreased the specificity by 6.6%. However, the best BART model with CEA + CA125 + CA153 + CA19-9 failed to improve the sensitivity and specificity. The best RF model with CEA + CA153 + CA125 did not improve AUC, but improved sensitivity by 2.5%. The best SVM model with CEA + CA19-9 resulted in a 3.4% increase in sensitivity but a 3.3% decrease in specificity.
Discussion
In the literature to date, the concentration of a single tumor marker was commonly used to differentiate MPE based on traditional logistic regression. 18 In this study, we applied machine learning approaches that allowed us to examine more complex relationships among variables to enable the construction of diagnostic models in combination with tumor markers for MPE diagnosis. For each diagnostic model, we calculated AUC, sensitivity, specificity, and Youden's index based on a 3-fold cross-validation to evaluate the diagnostic accuracy. To investigate the over-fitting problem, we also tried 5-fold and 10-fold cross-validations, and found that the results obtained were generally consistent with those of the 3-fold cross-validation.
In this study, the best tumor marker for MPE diagnosis was CEA, with a sensitivity of 0.80 and specificity of 0.92 when using XGBoost. In comparison, a recent descriptive review reported that the model with CEA based on LR had a high specificity (around 0.9) but a relatively low sensitivity (around 0.5) in diagnosis. 19 A meta-analysis by Nguyen et al. 10 reported that the diagnostic sensitivity using CEA was 0.549, while another meta-analysis by Feng et al. 8 reported a diagnostic sensitivity of 0.75 from existing studies., Numerically, our diagnostic model using XGBoost increased sensitivity by about 30% compared to previous studies. Besides XGBoost, SVM also showed a specific good performance in improving sensitivity.
Most of the previous studies utilized two tumor markers at most for MPE diagnosis; notably, many only considered CEA in the diagnostic model. 11 Few studies have considered combinations of three or more tumor markers, such as CA153, CA19-9, and CA125.12,13,20 In this study, we comprehensively evaluated a variety of diagnostic models with different combinations of four tumor markers, and the results showed that the diagnostic model in combination with CEA + CA153 performed best, which is consistent with the existing literature. For instance, a meta-analysis by Yang et al. 11 also reported a best diagnosis model in combination with CEA and CA153, where the specificity was 0.98, which is similar to our results, but the sensitivity was only 0.64. In general, the results of this study validated that compared to diagnostic models using a single tumor marker, using the proper combination of tumor markers could improve the performance of MPE diagnosis, especially in sensitivity.
This study also verified that, in general, machine learning methods can enhance the diagnostic accuracy of MPE diagnosis. In particular, the performance of XGBoost was shown to be comprehensively superior to BART, LR, RF, and SVM, and the diagnostic model using XGBoost in combination with tumor marker CEA and CA125 achieved the best performance. It is also interesting to notice that the best diagnostic model using LR and RF included three tumor markers, and the best model using BART had to make use of all four tumor markers. In contrast, the optimum models using XGBoost or SVM only included two tumor markers but achieved higher prediction accuracy. However, since the overall performance of the XGBoost model with the single tumor marker, CEA, was close to the best model combining multiple tumor markers, we do not recommend using combinations of tumor markers CEA, CA125, CA153, and CA19-9 for MPE diagnosis in clinical practice due to the limited increments of diagnostic accuracy, the consumption of clinical resources, and the economic burden on patients.
There are some potential limitations in this study. First, the sample size is relatively small; machine learning methods usually require a large data set for model training, and this small sample size may lead to incomplete model training and thus reduce the prediction accuracy. Second, models based on machine learning methods usually lack interpretability, which limits the further interpretation of the relationships between the tumor markers we used. Finally, other tumor markers, such as CYFRA 21-1 or biochemical indicators for differentiating benign and malignant pleural effusion, were not considered in this study but are worthy of further investigation. For instance, Xue et al. 21 explored the combination of CEA and Apo-E for MPE diagnosis, and showed a good sensitivity of 0.879 and specificity of 0.956. Other researchers have investigated the combination of cytokeratin fragment 19 (CYFRA 21-1), neuron-specific enolase, and the cancer ratio for MPE diagnosis.22–24 Recently, new technologies, such as methylated DNA marker detection and single cell sequencing, are also used to diagnose malignant pleural effusion.25,26 In addition, Bianconi et al. 27 and Palumbo et al. 15 used machine learning methods based on medical imaging, such as computed tomography (CT), which is a completely non-invasive testing method, to identify benign and malignant pulmonary nodules resulting in a good performance. In a future study, we could combine the data from both the CT image and the tumor markers to improve the diagnostic accuracy of MPE.
Supplemental Material
sj-docx-1-jbm-10.1177_03936155231158125 - Supplemental material for Diagnosis of malignant pleural effusion with combinations of multiple tumor markers: A comparison study of five machine learning models
Supplemental material, sj-docx-1-jbm-10.1177_03936155231158125 for Diagnosis of malignant pleural effusion with combinations of multiple tumor markers: A comparison study of five machine learning models by Yixi Zhang, Jingyuan Wang, Baosheng Liang and Hanyu Wu, Yangyu Chen in The International Journal of Biological Markers
Footnotes
Author contributions
BL was the guarantor and takes responsibility for the manuscript, including the data and analysis. BL and YC conceived and designed the study. YC and HW collected the data. YZ and JW analyzed the data and conducted the programing. YZ, JW, and BL drafted the manuscript. All authors approved the final version for submission.
Declaration of conflicting interests
The author(s) declared no potential conflicts of interest with respect to the research, authorship, and/or publication of this article.
Funding
The author(s) disclosed receipt of the following financial support for the research, authorship, and/or publication of this article: This work was supported by the National Natural Science Foundation of China, the PKU-Baidu Fund, the Fundamental Research Funds for the Central Universities, Beijing Natural Science Foundation, (grant number nos.11901013, 2020BD029, BMU2021RCZX023, no. 1204031)
Supplemental material
Supplemental material for this article is available online.
References
Supplementary Material
Please find the following supplemental material available below.
For Open Access articles published under a Creative Commons License, all supplemental material carries the same license as the article it is associated with.
For non-Open Access articles published, all supplemental material carries a non-exclusive license, and permission requests for re-use of supplemental material or any part of supplemental material shall be sent directly to the copyright owner as specified in the copyright notice associated with the article.