
Abstract
Introduction
In this paper, an analytical pipeline designed for untargeted lipidomic profiling in human plasma is proposed. The analytical pipeline was developed for case-control studies nested in prospective cohorts.
Methods
The procedure consisted of isopropanol protein precipitation followed by reverse phase liquid chromatography coupled to high resolution mass spectrometry and software-assisted data processing. The compounds are putatively annotated by matching experimental mass spectrometry data with spectral library data using LipidSearch software. The lipid profile of a pool of plasma samples from 10 healthy volunteers was detected in both positive and negative polarity modes. The impact of the chosen polarity on the number and quality of the lipid identification has been evaluated.
Results
More than 1000 lipids from 12 different classes were detected, 1150 in positive mode and 273 in negative mode. Nearly half of them were unambiguously identified by the software in positive mode, and about one-third in negative mode. The method repeatability was assessed on the plasma pool samples by means of variance components analysis. The intra- and inter-assay precision was measured for 10 lipids chosen among the most abundant found within the different lipid classes. The intra-assay coefficients of variation ranged from 2.56% to 4.56% while intra- and inter-day coefficients of variance never exceeded the 15% benchmark adopted. The lipidomic profiles of the 10 healthy volunteers were also investigated.
Discussion
This method detects a wide range of lipids and reports their degree of identification. It is particularly fit and well-designed for large case-control epidemiologic studies.
Keywords
Introduction
There is increasing evidence showing that lipids are not only fundamental constituents of cell membranes or energy storage, but also play an important role in cellular signaling mechanisms involved in the wide spread of diseases. 1 Several lipid profiles are linked to increased risks of cardiovascular diseases, type 2 diabetes, Alzheimer's disease, and cancer.2–6 The lipidomic approach was employed for the first time in 2003 as part of a metabolomic study aiming at characterizing quantitative and qualitative profiling of lipid components in serum, plasma, cells, tissues, and organisms.7,8 Since then, multiple studies have shown the value of acquiring lipidomic profiles to understand molecular mechanisms and identify biomarkers of disease9–12. The lipidome is composed of thousands of different molecular entities. Although lipids are based on few building blocks (for instance glycerol, sphingoid base, etc.), a vast variety of moieties, such as fatty acids, can be attached to them leading to challenging identification processes. 13 Discriminating within groups of isobaric and isomeric compounds is crucial in order to correctly identify each lipid molecule. Technological advances in high resolution mass spectrometry (HRMS) and the development of specific software capable of processing a large amount of high-resolution data are allowing effective lipidomic analyses. 14 Thus, this increased ability to interrogate the lipidome, has seen a steady increase in the number and type of applications employing lipid analysis for human health. However, analytical workflows must be standardized as much as possible to make the results of different studies reliably comparable. 15 In particular, data processing steps in untargeted analysis still require further development, as different data analysis tools and software settings can detect different amounts of features identified with different grades.9,16
Here we propose an analytical pipeline consisting of protein precipitation followed by reverse phase liquid chromatography (RPLC) coupled with HRMS, and software-assisted data processing. The procedure was developed for untargeted lipidomic plasma profile of large case-control studies and aimed to be well-designed and able to reveal an explicit degree of identification of lipids.
Material and methods
Reagents and materials
Ultrapure water (H2O, purity of 18.2 MΩ cm-1) was obtained by PURELAB Ultra Purification System (ELGA LabWater, ON, Canada). Liquid chromatography-mass spectrometry (LC-MS) grade 2-propanol (IPA) and acetonitrile (ACN) were supplied by Fisher Scientific (Pittsburgh, PA, USA), LC-MS grade formic acid (FA) by Carlo Erba (Carlo Erba Reagents S.r.l., Milano, Italy) and ammonium formate for LC-MS by Honeywell International Inc. (Morris Plains, NJ, USA).
Sample preparation
Plasma samples were obtained from 10 healthy volunteers with expressed written consent for its use. Individual plasma samples and their pool were aliquoted, stored at −20°C, and analyzed within 5 days. At the time of analysis, a predetermined number of aliquots were thawed at room temperature, and 200 µL of each aliquot were sampled and mixed with 800 µL of IPA. The samples were stored overnight at −20°C in order to facilitate the precipitation of the proteins. On the following day, samples were centrifuged (13,000 g, 10 min at 4°C). The supernatant was transferred into a polypropylene tube and then dried under nitrogen flow. Finally, the dried extracts were reconstituted with 100 µL of a mixture of H2O:IPA (1:4 v/v). Blank samples consisted in H2O:IPA (1:4 v/v). The injected volume in the chromatographic system of both plasma samples and blank samples was 2 µL.
Reverse-phase liquid chromatography setup
Lipids separation was performed using the Ultimate 3000 RSLC (Thermo Fisher Scientific, Waltham, MA). The selected column was a XBridge BEH C18 2.5 µm, 150 × 2.1 mm (Waters Corporation, Milford, MA) with a guard-column with equal stationary phase (2.5 µm, 5 × 2.1 mm) (Waters Corporation). The column temperature was set to 50°C. Two mobile phases were prepared. Phase A: 10 mM ammonium formate and 0.1% v/v FA in ACN:H2O 60:40 (v/v) and phase B: 10 mM ammonium formate and 0.1% v/v FA in IPA:ACN 90:10 (v/v). A constant flow rate of 280 µL/min was applied for the whole duration of the analysis. The mobile phase B was set at 30% and kept constant for 0.5 min. It was raised to 50% in 4 min, to 75% in 16 min, and finally to 100% in 9 min. After 7 min, initial conditions (30% mobile phase B) were re-established within 2 min and kept constant for 6 more minutes. The total run time for analysis was 44.5 minutes. Enhanced washing cycles of the injection system were set to reduce carry-over effects.
Electrospray ionization source-mass spectrometry analysis
The mass spectrometry analyses were performed with a heated electrospray ionization source (H-ESI) coupled to Thermo LTQ Orbitrap Elite. Data were acquired with Xcalibur 2.2 (Thermo Fisher Scientific). The vaporizer temperature was set to 300°C, while the ion transfer tube was set at 330°C. Sheath, aux, and sweep gases were set to 38, 11 and 0 arbitrary units, respectively. Mass spectra were acquired in full scan mode (MS) and data-dependent top 15 analysis (MS/MS). This mode was triggered by the presence of ions more intense than the selected threshold of 5000 counts. Only single-charge state ions were selected for MS/MS. Since Thermo Orbitrap Elite does not allow a fast polarity switch, positive and negative ionization modes were applied to distinct runs for each sample.
Instrument setup for positive mode
ESI spray voltage was set to 3.5 kV. The full width half maximum (FWHM) resolution for the MS mode was 120,000 at m/z 400 in the 250–1200 m/z range. The 30,000 FWHM resolution was applied to the MS/MS and spectra were acquired in the 150–1200 m/z range. The top 15 m/z signals were fragmented in higher-energy collisional dissociation (HCD), with a normalized collision energy (NCE) value of 25%. The ion injection time for the MS mode was 200 ms, the automatic gain control (AGC) target was set to 106. MS/MS ion injection time was 50 ms, while AGC target value was 105.
Instrument setup for negative mode
ESI spray voltage was set to 2.8 kV. Resolution and m/z ranges were the same of the positive polarity mode, while the HCD NCE was set to 30%. The ion injection time for the MS mode was 200 ms, the AGC target was 106. The MS/MS ion injection time was set to 50 ms and the AGC target value was 105.
Analytical procedure
Prior to each analysis, at least two blank samples were run. In order to avoid fragmentation of background ions, the 100 most intense peaks detected in the blanks were added to the exclusion list for the data-dependent analysis method. Blank samples were run every three plasma samples to keep the chromatographic system clean and to monitor and prevent carry-over effects.
Each detected peak is associated to its area.
Software-assisted lipid identification
The software LipidSearch 4.2 (Thermo Fischer Scientific) performed the putative identification of lipid molecules in a data processing pipeline involving two steps. The first step consisted of a feature search in which candidate MS peaks were matched to the software lipid database and assigned to a lipid ion. The second consisted of an alignment step in which the annotated lipid ions from each sample were matched by retention time, providing a lipid molecular feature list. The search mode function of the software sought for matches of parent peaks (full scan MS) and product peaks (fragments, MS/MS) with the lipid database entries. The database contains more than 200,000 theoretical m/z values for lipid ions, and the values of their theoretical fragment ions. The threshold for precursor and product mass tolerance was set to 5 ppm. The software assigns four grades of identification of decreasing quality (A–D) to each feature. Grade A indicates that both lipid class and all fatty acid chains belonging to a given lipid were completely identified; grade B indicates full identification of lipid class and partial identification of fatty acid chains; grade C indicates that lipid class specific ion or fatty-acid-derived product ions were detected; and grade D indicates that the software was unable to identify the lipid structure.
In positive polarity, the search parameters included the chromatographic range from 2 to 30 min of the gradient; + H, + Na, + NH4, + H-H2O and + H-2H2O adducts; product intensity threshold of 0.01% of the parent intensity and the m-score threshold of 5.0. In negative polarity, the search parameters were identical except for the selection of adducts, which were −H, + HCOO, + Cl, −2H and −CH3. All isomer peaks detected in the software search mode were selected in order to ease the alignment step. The retention-time tolerance of the software alignment mode was set to 0.1 min.
Reliability of the method
Retention times and peak areas of 10 lipids were manually obtained from raw files with Thermo Xcalibur software. These lipids were chosen among the most abundant found within the different lipid classes. Seven lipids were selected as representative in positive polarity mode: 18:1 for lysophosphatidylcholines (LPC), 16:0/16:0 and 18:0_20:5 for phosphatidylcholines (PC); 16:0_22:6 and 18:0_20:4 for phosphatidylethanolamines (PE); d34:1 for sphingomyelins (SM); and 16:0_18:2_18:2 for triacylglycerols (TG). Three lipids were selected as representative in negative polarity mode: d42:3 for ceramides (Cer); 16:0_22:6 for PC; and d32:1 for SM.
The performance of the method was validated by estimating intra- and inter-assay precision on the pool of plasma samples. Three aliquots of the pool were processed on 3 separate days, and each extracted sample was analyzed in triplicate by LC-MS on the day of preparation, thus obtaining a total of 27 replicate analyses. For each of the 10 selected lipids, variance components analysis was applied to estimate total peak areas variability associated with the day of sampling (inter-day), the extraction step within each day (intra-day), and the replication over each sample (intra-assay). For each of the three sources of variation, variability was then scaled on the overall mean of the corresponding lipid, in order to obtain a coefficient of variation (CV). Variance component analysis was carried out by means of the PROC GLM procedure of SAS®, version 9.4.
Finally, the plasma lipidomic profile of the 10 healthy volunteers was investigated. Three replicates per sample were analyzed in positive polarity and the raw data were processed with LipidSearch software.
Results
Figure 1 reports the total ion current chromatogram of a plasma pool sample by positive (top) and negative (bottom) polarity mode RPLC-HRMS analysis. In positive mode a greater number of peaks were detected in a wide chromatographic range when compared to negative mode. As reported in Table 1, a large number of lipid molecules belonging to 12 lipid classes were putatively identified, more in positive mode (n = 1150) than in negative mode (n = 273). The fragmentations details of 10 selected lipids are reported in supplementary material (Supplemental Figure 1).
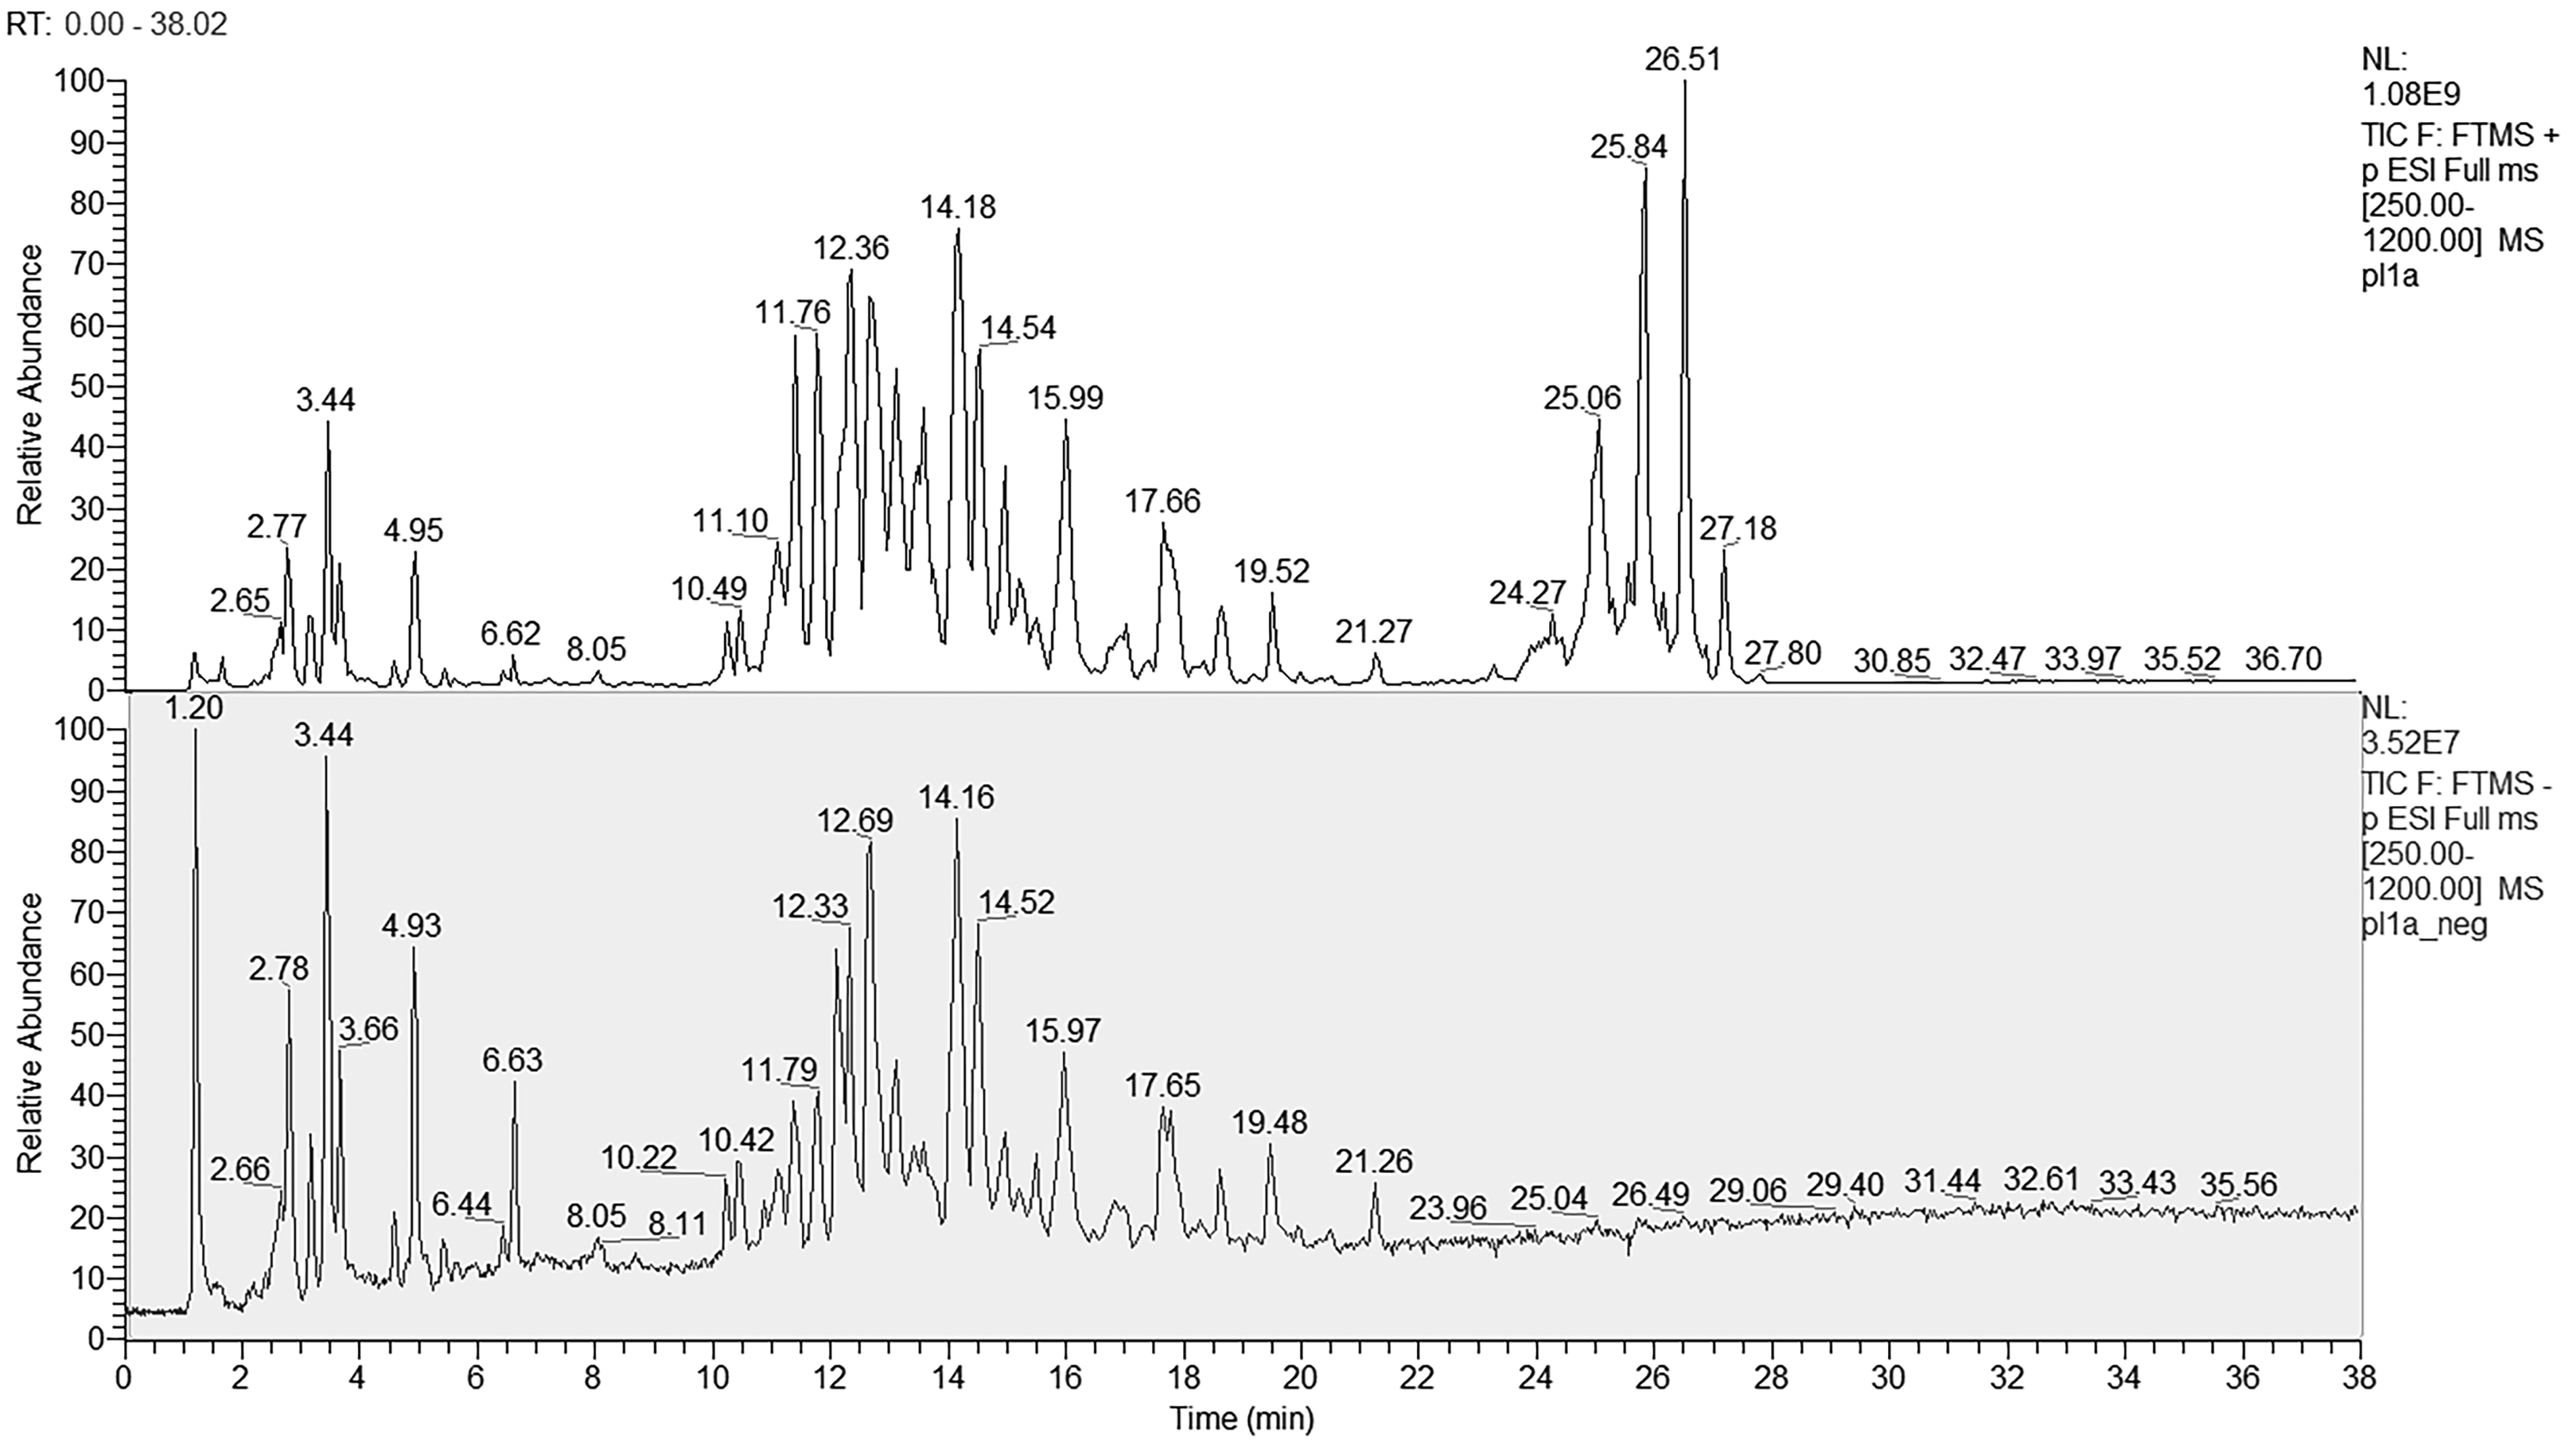
Total ion current chromatogram of a plasma pool sample in positive (top) and negative (bottom) polarity mode RPLC-HRMS analysis. Total ion current chromatogram of a plasma pool sample in positive (top) and negative (bottom) polarity mode RPLC-HRMS analysis.
Lipids identified in positive and negative polarity in 27 replicates of plasma pool samples divided by lipid class and identification grade.
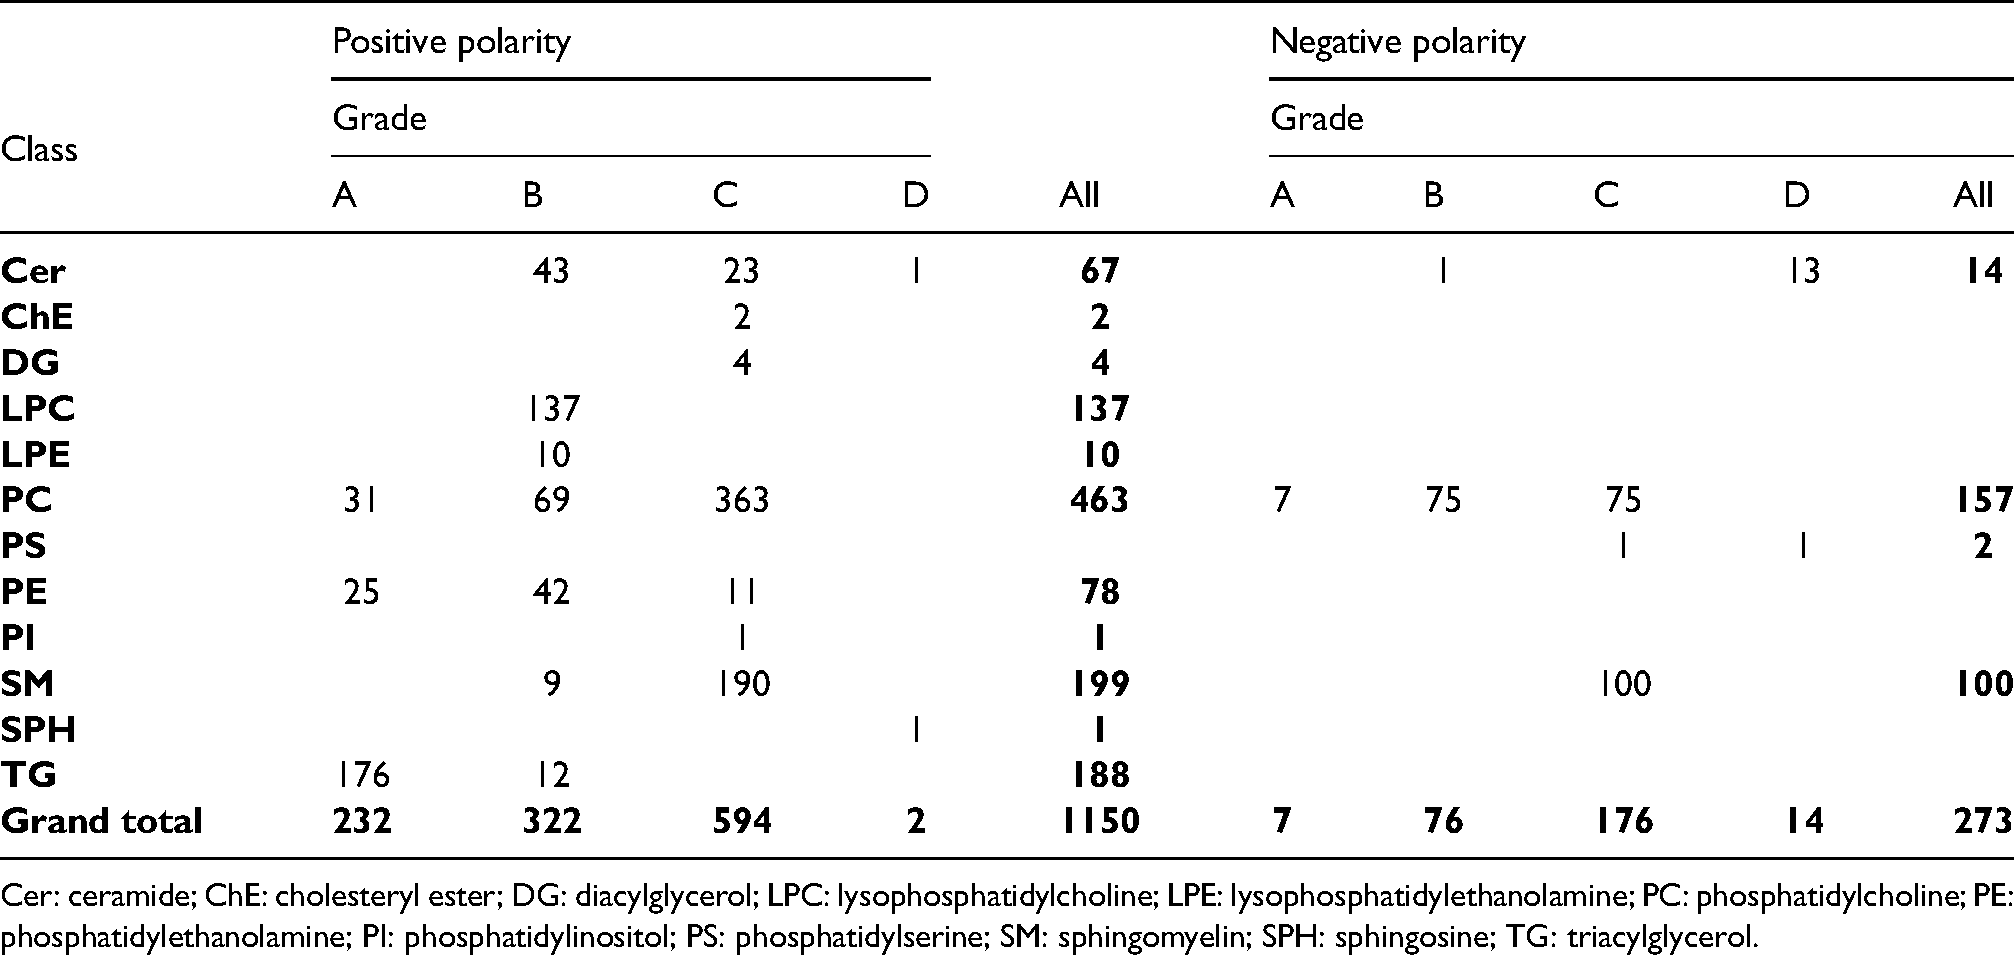
Cer: ceramide; ChE: cholesteryl ester; DG: diacylglycerol; LPC: lysophosphatidylcholine; LPE: lysophosphatidylethanolamine; PC: phosphatidylcholine; PE: phosphatidylethanolamine; PI: phosphatidylinositol; PS: phosphatidylserine; SM: sphingomyelin; SPH: sphingosine; TG: triacylglycerol.
In positive mode, the most frequently detected lipid classes were PC, SM, TG, followed by LPC. TGs were mostly identified with grade A, while most of the other lipid classes were identified in grade B and C. Lipids from only three classes (Cer, PC, and SM) were detected in both polarities. For all the 12 Cer detected in both polarities, LipidSearch provided a better identification grade in positive mode. A total of 40 out of 79 PC got a better grade in negative mode, while 89 out of 94 SM received the same grade (Table S1 and Table S2). Most of the lipids were detected in positive mode. PC was the only class in which a consistent number of lipids (78) were uniquely detected in negative polarity (Figure S2). However, just 6 are detected in grade B while most of them (72) are detected in grade C. The 2 Cer uniquely detected in negative mode were identified with grade B and D, while all 6 SM were identified in grade C.
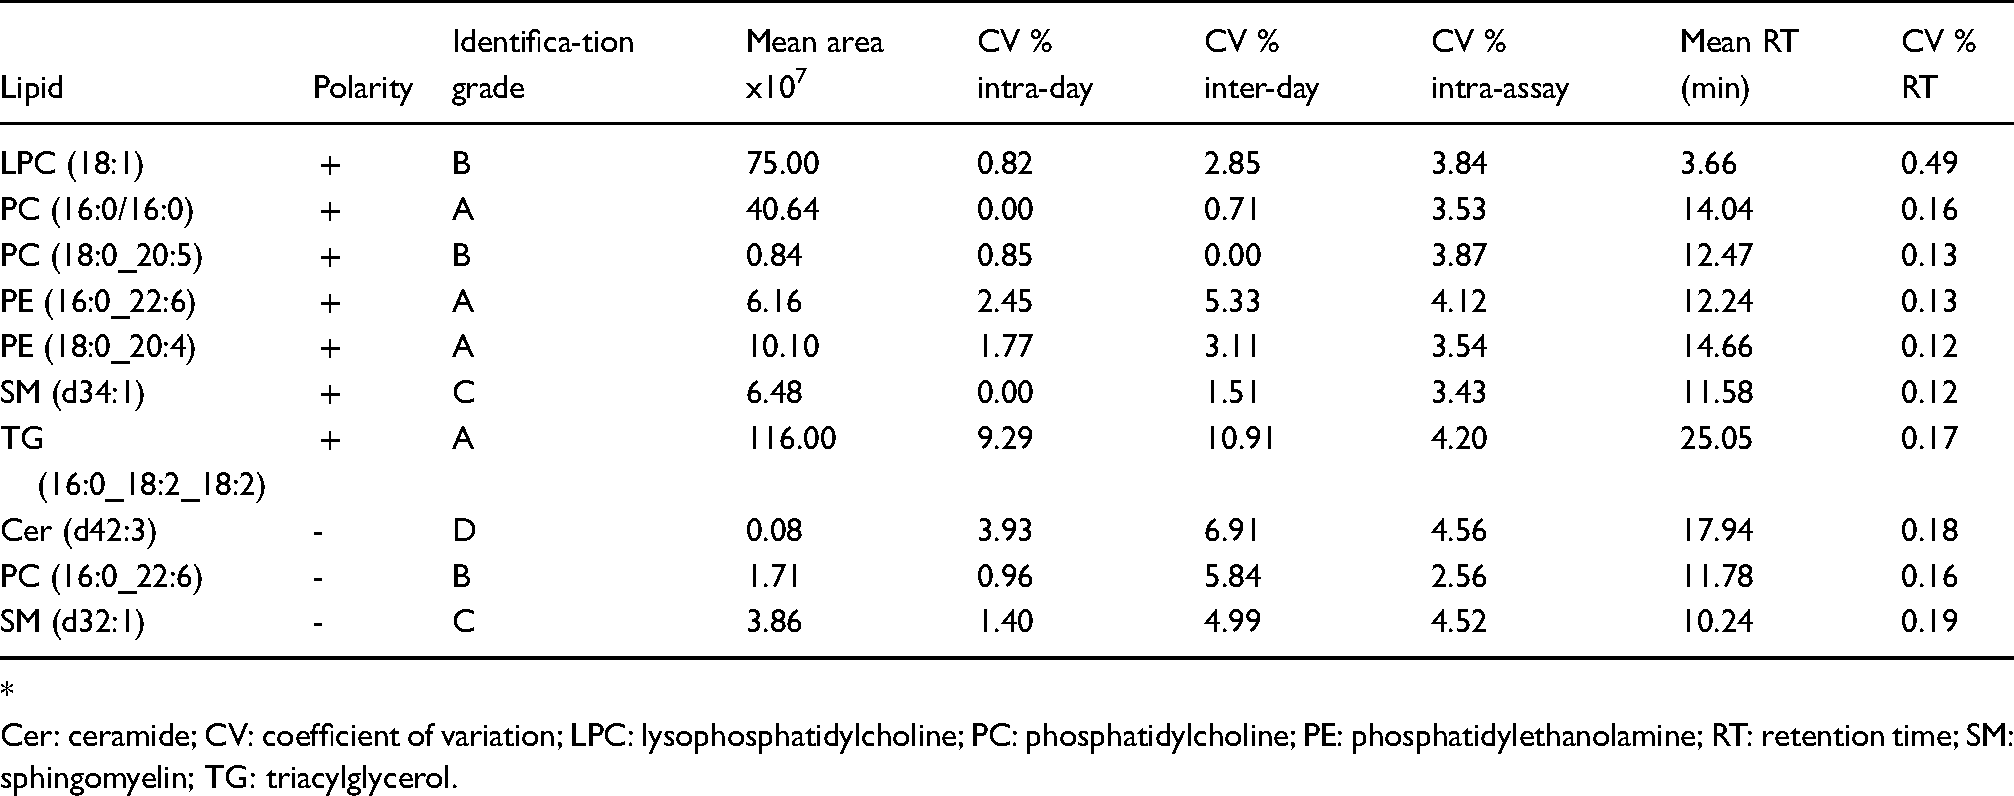
The method showed a good repeatability in the detection of each lipid class in the pooled plasma within the 3 days of analysis in both polarities as depicted in Figure 2. Results of variance components analysis for the 10 selected lipids are shown in Table 2. Retention time CVs for the 10 selected lipids were below 0.5%. Intra-assay peak areas for CV were stable across distinct lipids, varying between a minimum of 2.56% for PC (16:0_22:6) and a maximum of 4.56% for Cer (d42:3). Intra-day CV was generally very small, except for TG (16:0_18:2_18:2), whose CV (9.29%) was nevertheless lower than the 15% benchmark. Inter-day CVs were comparable in size to intra-assay CVs, and therefore relatively small. The highest value (10.9%) obtained for TG (16:0_18:2_18:2) was lower than the 15% benchmark. Identification details and MS/MS spectra of the 10 lipids are available in the supporting information.
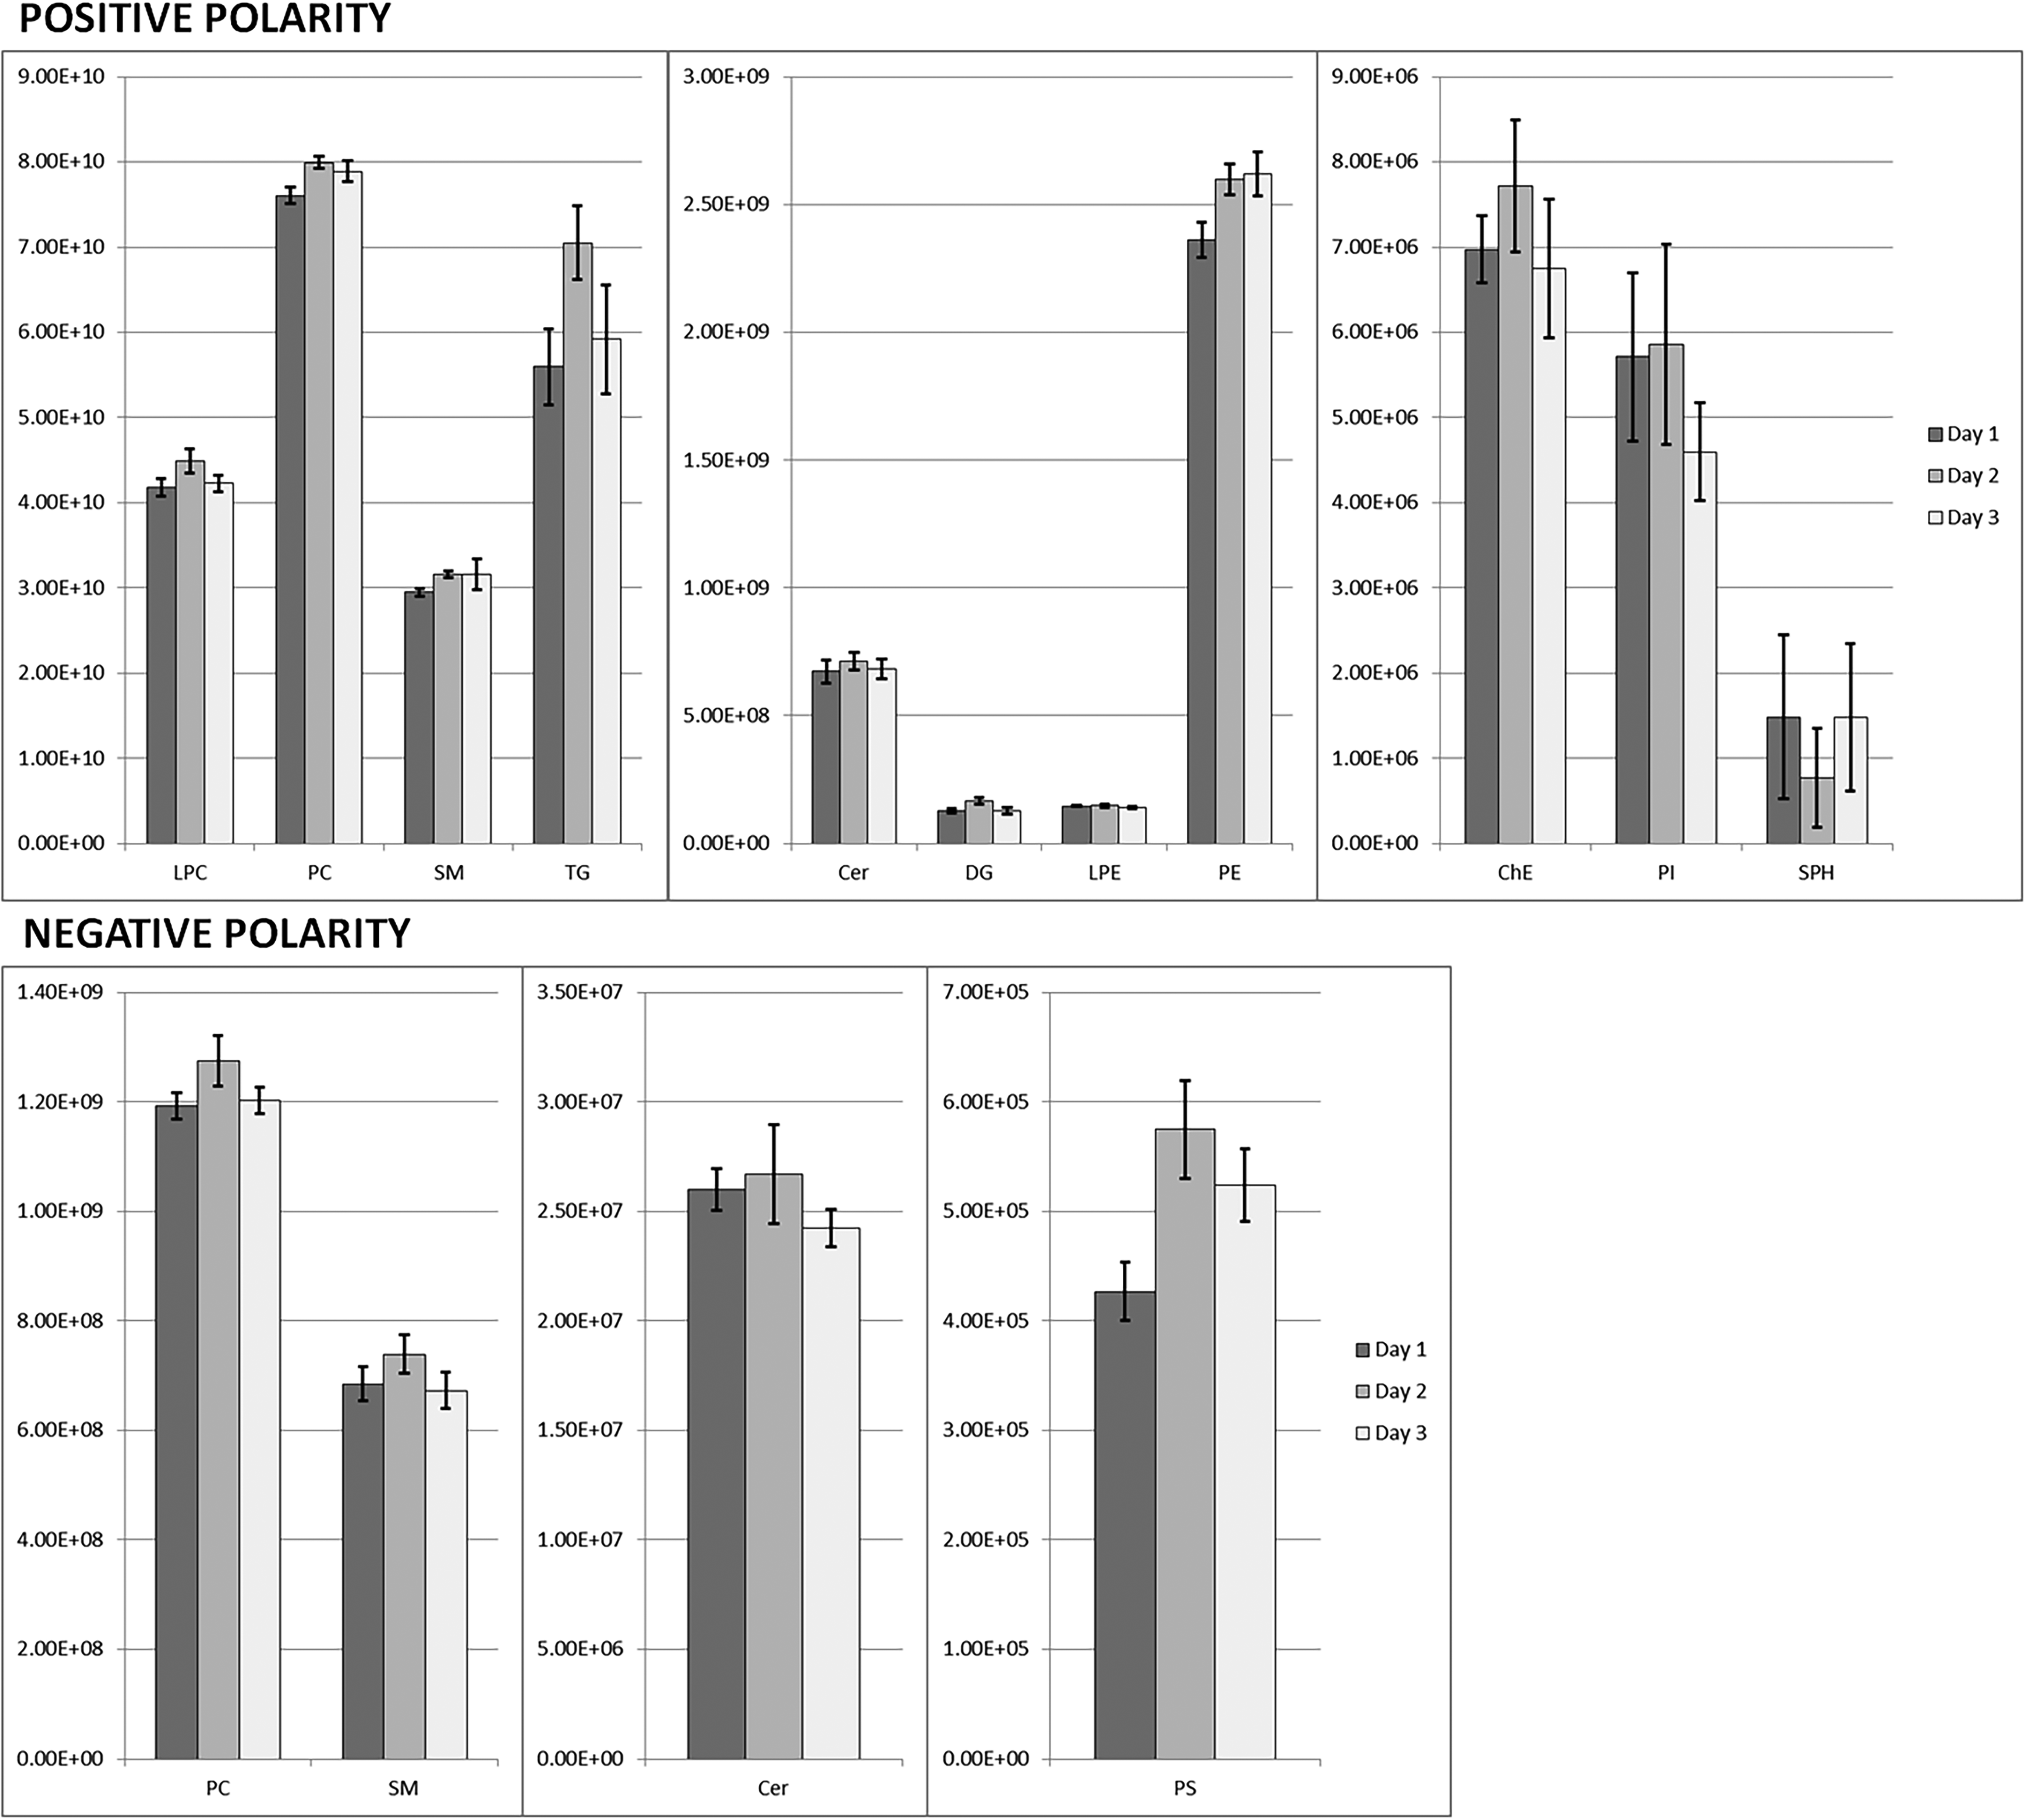
LipidSearch alignment output for the comparison of day 1, 2, and 3 in positive polarity (top) and negative polarity (bottom) MS analysis. Each bar represents the average sum of lipid areas grouped by class.
Estimated variance components of the method expressed in coefficient of variation (CV%) for the 10 selected lipids according to days and extraction.
*
Cer: ceramide; CV: coefficient of variation; LPC: lysophosphatidylcholine; PC: phosphatidylcholine; PE: phosphatidylethanolamine; RT: retention time; SM: sphingomyelin; TG: triacylglycerol.
Individual lipidomic analyses of 10 healthy volunteers’ samples are performed in triplicate. The class profiling is reported in Figure 3.
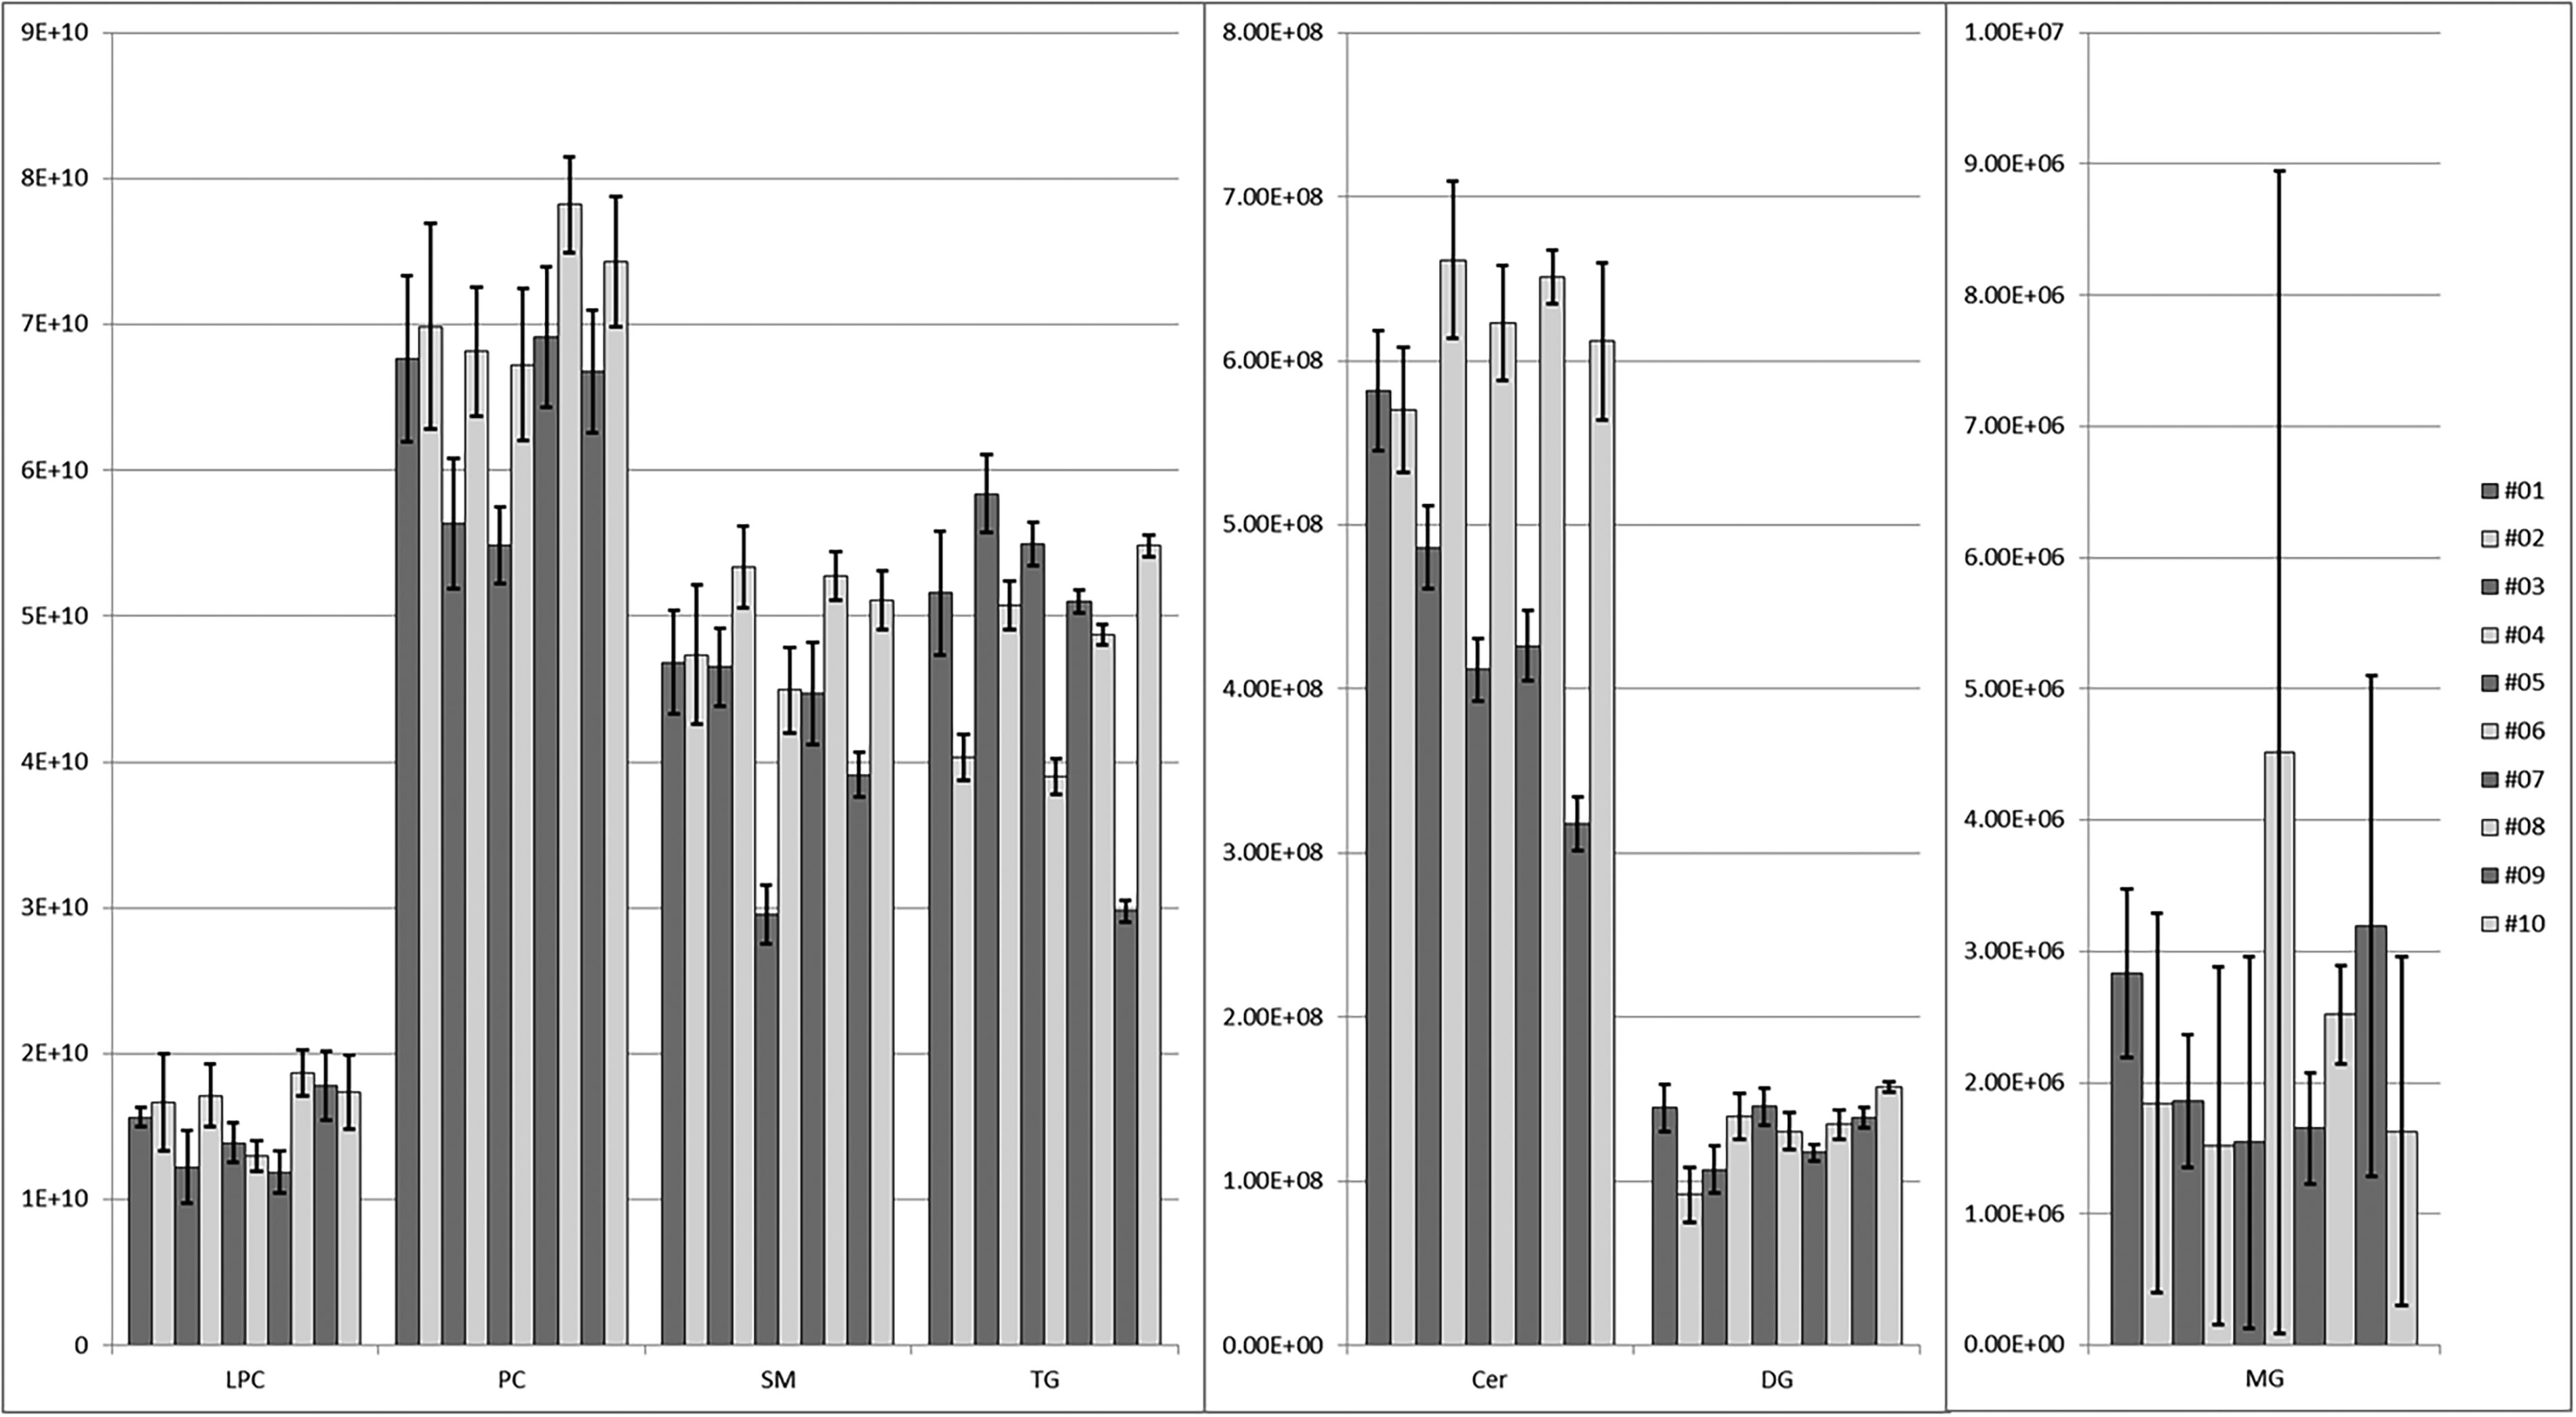
LipidSearch alignment output for the comparison of plasma samples of 10 healthy volunteers. Each bar represents the average sum of lipid areas grouped by class.
CVs of the sum of the lipid areas grouped by class were below 15% (Table S3). Monoacylglycerols (MG) were the exception as detected areas were far lower than the other classes. CVs of diacylglycerol and LPC areas for the volunteers 2 and 3 were around 20%.
Discussion
In this paper we describe an analytical platform fit for untargeted lipidomic profiling of human plasma. Although it is composed of known processes, its novelty resides in the selection of the most adequate techniques to perform plasma lipidomic profiling in large case-control studies nested in prospective cohorts. The particular attention paid to the description of the degree of identification obtained by the software-assisted data analysis allows a clear evaluation of the software effectiveness in characterizing the different lipid species and facilitates the comparison with other studies.
According to Sarafian and coworkers, 17 we found the precipitation method with isopropanol (IPA) added to 200 μL of plasma more effective for untargeted lipidomic profiling than the typical and established methods for lipid extraction. The IPA extraction indeed is appropriate for good lipid class coverage (12 lipid classes detected) and fits well for a simple and prompt preparation of several samples.
The chromatographic conditions have been developed by harmonizing already existing methods.18,19 Particularly, according to Basit work, we adopted a BEH column capable of enhancing the separation of compounds with a wide range of polarity. 19 Longer gradients were preferred to maximize the number of detected features as described by Breitkopf and coworkers. 18 Moreover, enhanced cleaning procedures of the injection system and a long gradient prevented carryover effects due to the retention of TG in the chromatographic system.9,19 The retention time CVs for the 10 selected lipids showed that no chromatographic drift was observed.
As Orbitrap Elite does not allow high-resolution fast-polarity switch, lipidome was investigated in distinct runs for positive and negative modes. The number of lipids and their degree of identification for each mode was compared. This method can be advantageously applied in solely positive mode. Analytical times were halved by renouncing the detection of a minor part of lipids.
There are several types of software that can be employed for lipidomic data analysis. LipidSearch 20 and MS-DIAL 21 offer the most user-friendly interfaces and include the simulated fragment intensities in the database. LipidMatch 22 and LipidSearch provide multiple hits in the final report, which can reduce doubtful lipid name assignments. High-resolution data analysis with LipidSearch and Greezy 23 require shorter computational time than solution based on R software, such as LipidMatch, which are more customizable.9,22 LipidSearch software provided fundamental help in the lipidome profiling by automatically performing annotation, peak picking, and alignment processes. However, the identification process can be challenging especially for isomers annotated as the same lipid molecule by the software, but which have different double bond positions and cis/trans configurations. 24 Furthermore, lipids detected by the LC-MS system, and which were not present in the database, were not annotated. Nevertheless, a valid data interpretation requires that the grade of identification of each detected feature is clearly stated. The identification grades provided by LipidSearch correspond to “putatively annotated compounds” based upon spectral similarity with a commercial spectral library, which is the level 2 identification according to the metabolite identification guidelines proposed by the Chemical Analysis Working Group of the Metabolomics Standards Initiative. 25 In accordance with Schymanski et al., 26 the level of identification of lipids detected with our platform may have varied from 2, which involved matching literature or library spectrum data to 3, “tentative candidate,” as evidence exists for possible structures, but insufficient information for one exact structure only (e.g., positional isomers). 27 Indeed, the software output does not provide information on stereochemistry and double bond position in fatty acids and their stereospecific numbering. Although the highest identification grades are not available for all the detected lipids, the software-assisted data analysis eases data interpretation especially by dealing with the pre-processing step, which is automated. Indeed, subsequent data analysis can be performed starting from the list of putatively identified lipid molecules with the relative identification grade instead of a list of unknown compounds. In this method, each detected lipid is accompanied by its software identification grade, providing a transparent way to evaluate and compare lipid profiles.
By our current knowledge, most of the papers regarding lipidomic profiling of human plasma report from a few hundred to more than 1000 detected lipid species. 18 Our findings are in accordance with the latter.
The intra- and inter-day CVs denote a good inter-assay performance for the 10 selected lipids. The CVs were under the 15% benchmark. The residual variability ascribed to the intra-assay CV was stable across the 10 lipids and below 5%.
The variability of triplicate analyses on individual plasma samples has been tested. Generally, CVs below 15% were obtained for all lipid classes except for the least abundant class detected (MG).
Considering the broad spectrum of polarity in which the lipids tested fall, we found that the method was globally performing and reliable.
A possible limitation of this study is the lack of Internal Standards (IS). Indeed, ISs or Standard Reference Material (SRM), such as the National Institute of Standards and Technology SRM 1950 plasma, 28 are routinely used in the lipidomics community. However, this approach can be onerous as many standard molecules are required to cover the great diversity of lipid species. 29 Although the use of a lipid standard for each class could facilitate the process when assuming its chemical–physical behavior as homogeneous within the same lipid class, the addition of internal standards is not mandatory when lipidomic analyses are applied on epidemiological case-control studies. Even though these results are not strictly quantitative, they can be sufficiently accurate for comparison between cases and paired controls since the two groups are analyzed in the same analytical batch. 30 Another possible limitation of this method is that we used 200 μL of samples as in Sarafian work. 17 Such a volume may be considered large for epidemiological cohorts. We believe that smaller amounts of sample may be used as shown in other works19,30; however, we did not test the method performance with smaller amounts of sample.
In conclusion, the method proposed is suitable for agnostic lipidomic profiling of human plasma samples as it allows the potential identification of over 1000 lipid molecules from 12 different lipid classes. The method was found to be easy to handle and particularly suitable for large case-control studies nested in cohorts where several samples are typically analyzed.
Supplemental Material
sj-pptx-1-jbm-10.1177_03936155221132291 - Supplemental material for A software-assisted untargeted liquid chromatography–mass spectrometry method for lipidomic profiling of human plasma samples
Supplemental material, sj-pptx-1-jbm-10.1177_03936155221132291 for A software-assisted untargeted liquid chromatography–mass spectrometry method for lipidomic profiling of human plasma samples by Francesco Segrado, Adalberto Cavalleri, Alice Cantalupi, Luigi Mariani, Sonia Dagnino, Vittorio Krogh, Elisabetta Venturelli and Claudia Agnoli in The International Journal of Biological Markers
Supplemental Material
sj-docx-2-jbm-10.1177_03936155221132291 - Supplemental material for A software-assisted untargeted liquid chromatography–mass spectrometry method for lipidomic profiling of human plasma samples
Supplemental material, sj-docx-2-jbm-10.1177_03936155221132291 for A software-assisted untargeted liquid chromatography–mass spectrometry method for lipidomic profiling of human plasma samples by Francesco Segrado, Adalberto Cavalleri, Alice Cantalupi, Luigi Mariani, Sonia Dagnino, Vittorio Krogh, Elisabetta Venturelli and Claudia Agnoli in The International Journal of Biological Markers
Supplemental Material
sj-docx-3-jbm-10.1177_03936155221132291 - Supplemental material for A software-assisted untargeted liquid chromatography–mass spectrometry method for lipidomic profiling of human plasma samples
Supplemental material, sj-docx-3-jbm-10.1177_03936155221132291 for A software-assisted untargeted liquid chromatography–mass spectrometry method for lipidomic profiling of human plasma samples by Francesco Segrado, Adalberto Cavalleri, Alice Cantalupi, Luigi Mariani, Sonia Dagnino, Vittorio Krogh, Elisabetta Venturelli and Claudia Agnoli in The International Journal of Biological Markers
Supplemental Material
sj-docx-4-jbm-10.1177_03936155221132291 - Supplemental material for A software-assisted untargeted liquid chromatography–mass spectrometry method for lipidomic profiling of human plasma samples
Supplemental material, sj-docx-4-jbm-10.1177_03936155221132291 for A software-assisted untargeted liquid chromatography–mass spectrometry method for lipidomic profiling of human plasma samples by Francesco Segrado, Adalberto Cavalleri, Alice Cantalupi, Luigi Mariani, Sonia Dagnino, Vittorio Krogh, Elisabetta Venturelli and Claudia Agnoli in The International Journal of Biological Markers
Supplemental Material
sj-pdf-5-jbm-10.1177_03936155221132291 - Supplemental material for A software-assisted untargeted liquid chromatography–mass spectrometry method for lipidomic profiling of human plasma samples
Supplemental material, sj-pdf-5-jbm-10.1177_03936155221132291 for A software-assisted untargeted liquid chromatography–mass spectrometry method for lipidomic profiling of human plasma samples by Francesco Segrado, Adalberto Cavalleri, Alice Cantalupi, Luigi Mariani, Sonia Dagnino, Vittorio Krogh, Elisabetta Venturelli and Claudia Agnoli in The International Journal of Biological Markers
Footnotes
Author contributions
Elisabetta Venturelli, MSc and Claudia Agnoli, MSc are co-last authors.
Declaration of conflicting interests
The author(s) declared no potential conflicts of interest with respect to the research, authorship, and/or publication of this article.
Funding
The author(s) disclosed receipt of the following financial support for the research, authorship, and/or publication of this article: This work was supported by 5 × 1000 Funds – Italian Ministry of Health (MoH) – Institutional grant from Fondazione IRCCS Istituto Nazionale dei Tumori di Milano
SD acknowledges the Horizon 2020 Marie Skłodowska-Curie fellowship EXACT [Grant number 708392] and the pump-priming award from the MRC-PHE Centre for Environment and Health [MR/L019744/1]. This research was partially funded by Italian Ministry of Health “Ricerca Corrente” funds.
Supplemental material
Supplemental material for this article is available online.
References
Supplementary Material
Please find the following supplemental material available below.
For Open Access articles published under a Creative Commons License, all supplemental material carries the same license as the article it is associated with.
For non-Open Access articles published, all supplemental material carries a non-exclusive license, and permission requests for re-use of supplemental material or any part of supplemental material shall be sent directly to the copyright owner as specified in the copyright notice associated with the article.