
Abstract
Background:
Chad suffers from protracted hunger, facing high food insecurity (Integrated Food Security Phase Classification 3 and above), and acute malnutrition levels that surpass the emergency threshold (15% global acute malnutrition) yearly. The Food Security Sector, with European Union support, leads an inclusive effort to increase synergy between humanitarian, development, and peace-building actors to understand and address drivers of hunger.
Objective:
To understand the spatial distribution of child wasting and household food insecurity and systemic drivers (conflict, livelihoods, vegetation, cultural norms) as well as better understand the relationship between child wasting and household food insecurity in Kanem and Bahr el Ghazal (BeG) region, Chad, with the goal of improving nexus programming and targeting.
Methods:
A cross-sectional randomized cluster survey was conducted in August 2021 in Kanem and BeG across 86 villages, reaching 7002 households and 6136 children. Data were collected on child anthropometry, household food security, and livelihoods. Using mixed methods, primary data were triangulated with secondary geospatial data on vegetation index and conflicts as well as qualitative interviews with local actors. Analysis was conducted using comparison tests, linear and logistic crude, and adjusted models, as well as looking at the design effect as a measure of clustering of outcomes at the community level.
Results:
The geospatial distribution of hunger indicators shows child wasting and food insecurity are highly clustered. However, communities with a high prevalence of child wasting were not those with the highest levels of food insecurity, indicating different pathways. Clustering of food insecurity and child wasting is due to basic drivers of conflict, health, and seasonal access to natural resources.
Conclusions:
The high levels of food insecurity and child wasting are each concentrated in specific survey clusters and are not necessarily connected. They result from different causal pathways at the community level linked to the systemic drivers of the rule of access to natural resources, environmental seasonality, and livelihoods. This suggests a greater need for an integrated humanitarian, development, and peace-building interventions to address the persistent high prevalence of food insecurity and child wasting. It also suggests that these community-level and systemic drivers require greater consideration from the start in research design and data collection.
Plain language title
Understanding Linkages Between Household Food Insecurity, Child Malnutrition, and Their Respective Clustered Drivers in Chad
Plain language summary
Chad experiences emergency levels of household food insecurity and child malnutrition. To address this issue, the United Nations Food and Agricultural Organization has undertaken a collaborative effort to enhance cooperation among humanitarian, development, and peace-building actors. The objective of this study was to examine how child malnutrition, food insecurity, and their drivers cluster across communities in Kanem and Bahr El Ghazal to improve response planning and targeting. The study collected data in August 2021 on malnutrition, food security, livelihoods, vegetation, and conflict and carried out interviews with local informants. In total, the research covers 86 villages, 7,002 households, and 6,136 children. The research shows that the 2 measures of hunger, child malnutrition and food insecurity, are highly clustered, affecting some communities more than others. However, villages with a high prevalence of child acute malnutrition did not have the highest levels of food insecurity, suggesting different community-level drivers. The clustering of food insecurity and malnutrition at the village level was linked to the diversity of livelihoods, the experience of conflict, health, and seasonal limitations in accessing natural resources. These findings are crucial for informing the targeting and design of integrated humanitarian, development, and peace programs. Taking a systemic approach and fostering strong coordination across interventions to address the drivers of food insecurity and malnutrition holds great potential for tackling hunger in Chad.
Introduction
Agropastoral communities from the Sahelian belt in Chad suffer from protracted hunger, including high levels of food insecurity (Integrated Food Security Phase Classification 3 or above) and persistent global acute malnutrition (GAM) at levels that surpass the emergency threshold (15% GAM) on a yearly basis. 1 This dire situation is ongoing despite long-term investments by government, humanitarian, development, and peace actors. This dire situation call for an urgent need to explore and understand the drivers of and relationship between wasting and food insecurity to inform programming, research, and policy response to tackle the deepening problem of hunger in Chad and the Sahel region.
The world’s major humanitarian donors and aid organizations committed to the Grand Bargain during the World Humanitarian Summit in May 2016. 2 The agreement aims to improve the way humanitarian aid is delivered by making it more effective and efficient. Despite the Grand Bargain and ongoing collective efforts toward localization with prioritization of local and context-specific knowledge, data are frequently aggregated across time and space. However, significant opportunity exists with more geospatial granularity and disaggregation across existing heterogeneous communities and livelihoods systems. 3 In Chad, there exist multiple, joint diagnostic tools that are regularly used for the analysis of food insecurity and malnutrition, such as the Cadre Harmonisé and other national food systems diagnostics. Nonetheless, there remain evidence gaps in the understanding of the complexity of drivers of malnutrition, food insecurity 3 and how the 2 are linked which could be unpacked through more granular spatial, as opposed to region-wide, analysis. 4 This study follows a larger trend in nutrition and food security literature, as recent studies from India, 5 Afghanistan, 6 Philippines, 7 South Africa, 8 and Ethiopia 9 have highlighted the geographical clustering of food insecurity and malnutrition at lower administrative levels.
More recently, initiatives have recognized the importance of multisectoral and systemic interventions to address high levels of GAM and food insecurity. However, a “food-first bias” approach persists, 10 where food insecurity is assumed to be the main driver of malnutrition, with less attention to the links between public health and acute malnutrition. While interlinked, food insecurity and malnutrition might not have the same drivers or peak at the same time of year. Recent studies on seasonality in Chad and the Sahel more broadly found that food insecurity and undernutrition indicators might have a more complex relationship and not move in tandem during all seasons. 11 For example, research in Chad, Sudan, and South Sudan shows that acute malnutrition is highest at the end of the dry season/start of the rains, with a much smaller secondary peak before the harvest when food insecurity is at its highest, indicating the role of different drivers at different times of the year. 12,13 The double peak phenomenon was observed in Chad across both pastoralist and farming communities. 14 Addressing siloed underlying and intermediate drivers of hunger is often prioritized by donors to the detriment of more sustainable approaches that target basic and systemic drivers. The recent Nutrition in Africa’s Drylands framework 15 as well as the food systems approach 16,17 both highlight the crucial role of considering basic, more systemic drivers of acute malnutrition and food insecurity to address and prevent hunger with a focus on conflict and climate, but also on cultural practices that might translate, for example, to gendered child feeding. 18
The 2030 Agenda for Sustainable Development highlights the need for more coordination between sectors and the humanitarian–development–peace (HDP) nexus to address the root causes of hunger. Several promising initiatives are advocating for an integrated or nexus approach to multistakeholder partnerships to increase synergies and impact. In this context, the Food Security Sector and partners in Chad, with the support of the Global Food Security Cluster, Global Network Against Food Crisis, and European Union, are engaged in an inclusive effort to pilot and scale up initiatives that increase synergies within the HDP nexus. One such initiative, and the source of the data for this paper, is a 3-year program with the aim of strengthening the resilience of food systems (P2RSA) in 2 regions in Chad that persistently suffer from emergency levels of acute malnutrition: Bahr el Ghazal (BeG) and Kanem.
The objective of this study is to understand the relationship between more systematic community-level drivers—livelihoods, vegetation, conflict, cultural practice around child feeding—in relation to hunger, defined as both child wasting and household food insecurity, in Kanem and BeG region in Chad. In addition, we aim to show that not only are the drivers for these 2 outcomes different, but measures of undernutrition and food security are themselves not necessarily related. A better understanding of the drivers of food security and undernutrition on the community level will allow for more appropriate programming and community targeting for the implementation of integrated programs with the goal of reducing hunger.
Methods
This study uses a mixed-methods approach combining qualitative and quantitative data with a geographic information system (GIS) enabling triangulation of the findings through comparison across multiple sources.
Study Setting
The data for this article come from 2 regions in Chad: Kanem and BeG. Both regions suffer from high rates of food insecurity and acute malnutrition. Indicators of maternal and child health and malnutrition in BeG and Kanem have steadily worsened over the past 20 years and now rank among the lowest in Chad, a country that already rates fourth on the Global Hunger Index. 19,20 These regions are also experiencing the effects of climate change with recurrent shocks (flooding and drought) that increase the pressure on already limited resources and exacerbate a high level of poverty, chronic food insecurity, and malnutrition. The latest national standardised monitoring and assessment of relief and transitions (SMART) survey data, representative at the regional level, from October 2021 indicate that Kanem and BeG surpass the emergency threshold of 15% GAM in children younger than 5 years. 21 Furthermore, since 2016, tensions between youths and the Government of Chad have been on the rise in BeG and Kanem, fueled by the economic slowdown. The tensions are often marked by serious incidents that have affected the livelihoods and well-being of the population. 22 The predominant livelihoods in Kanem and BeG regions have been documented as transhumance in the north and agropastoralism in the south. More than half of the population (60% in Kanem and 86% in BeG) live in the transhumance zone, and about half are classified either as poor or extremely poor. Livestock, especially cattle, remains the main source of livelihood with limited cultivation. Unlike nomadic pastoralism, only some members of the household periodically migrate with livestock in search of pasture and water. 23
Quantitative Survey
The objective of the survey was to understand what was associated with hunger, defined as both undernutrition and food insecurity, and inform a joint targeting strategy. To meet this objective, the United Nations Food and Agricultural Organization (FAO) and its partners conducted a cross-sectional survey in August 2021 in Kanem and BeG regions. The study used a 2-stage randomized cluster design, by first randomly selecting 86 villages across the 2 regions and then carrying out an exhaustive census in each community with information on 7002 households (Table 1). The 86 communities were randomly selected from a list of all villages in Kanem and BeG using a probability proportional to size approach based on data from the Enquete Nationale de Securite Alimentaire, March 2021. All households in the 86 communities were interviewed about their food security; livelihoods specialization; animal ownership; asset ownership; access to a market garden, access to safe water; as well as basic household demographics including marital status, age of the household head, and household size. The survey collected data on child anthropometry (weight, height, mid-upper arm circumference [MUAC], and the presence of edema) from all children 6 to 59 months (6458 children) in the selected households. In addition, the Child Dietary Diversity Score and current breastfeeding practices were collected from all children 0 to 23 months (2463 children). Not all households in the sample had children younger than 59 months. Finally, we also collected MUAC of female caretakers (4809 women) between the ages of 15 to 49 years. GPS data were collected from all the households.
Sample Size of Participants.
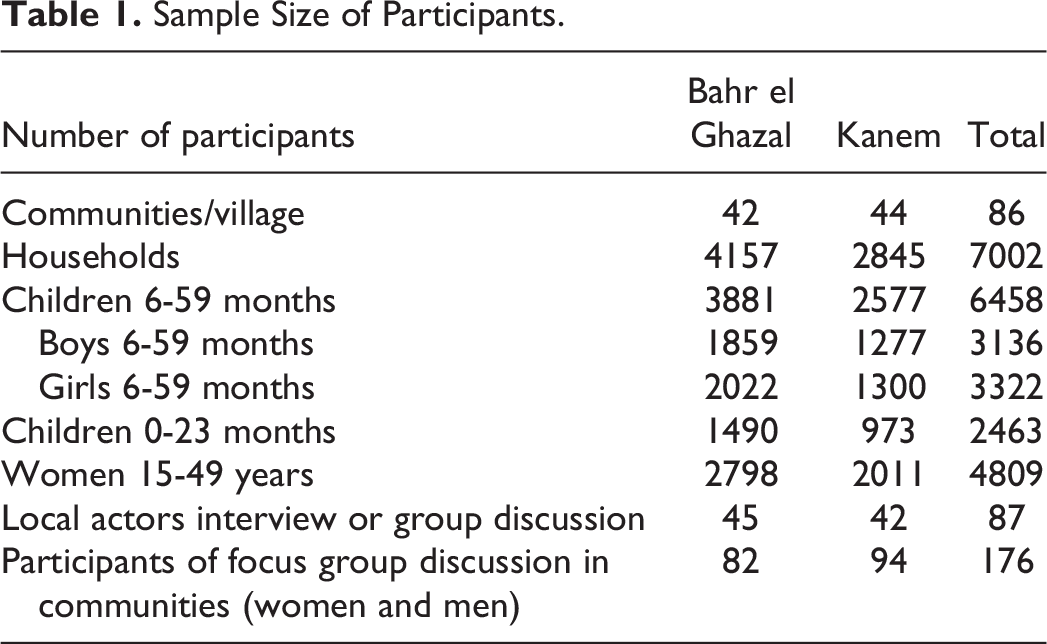
Data collection was conducted with the Food and Nutrition Technical Assistance (FANTA) standardized tools and methods. Two teams of 30 people per region, each composed of 27 data collectors and 3 supervisors. KoboCollect with in-built restrictions for quality assurance was utilized. Teams were trained for 5 days with a focus on the methodology and tools for data collection.
The primary outcome of this study was hunger, which is defined as both undernutrition and food insecurity. For undernutrition, the primary outcome was child wasting (defined as weight-for-height z-scores [WHZ] < −2 for children 2 years and older and weight-for-length z-score < −2 for children younger than 2 years using recumbent length) given the humanitarian context. 24 While we measured edema, there was no presence of edema in our sample. For food insecurity, the primary outcome was the Food Consumption Score (FCS). The Food Consumption Score aggregates household-level data on the diversity and frequency of food groups consumed over the previous 7 days, which is then weighted according to the relative nutritional value of the consumed food groups. A household’s food consumption status is based on the following thresholds of the FCS standard indicator: 0 to 21: poor; 21.5 to 35: borderline; >35: acceptable. For both variables, we use the continuous form (WHZ and FCS) and the binary form: wasting and FCS.
For categorical and dichotomous outcomes, chi-square tests were performed to assess statistical significance, while t test were used to compare means. Crude model regression analysis was used to identify the independent contributors to food insecurity and child nutritional status, and multivariate models were used to control for potential confounding factors. A p value of less than .05 was considered statistically significant. We ran linear regression for continuous and normally distributed variables (such as z-scores, FCS) and a logit regression for binary outcomes (such as wasting or classification of food insecurity). We ran these models both on the individual (child or female caretaker nutrition outcome) and household (food insecurity) and aggregated on the community level (mean community wasting, mean community FCS, etc.). In most of the tables, we report on either the sample mean or sample prevalence for a certain indicator as well as the 95% confidence interval (CI) and the design effect. The design effect allows us to understand inter- and intracommunity variability or clustering of the outcome of interest on the community level. To better understand determinants of heterogeneity among villages, we used principal component analysis (PCA) and hierarchical ascendant classification using proxy variables for livelihoods specialization (household’s main sources of incomes, size of herds and livestock species owned, cultivated surface, practices of market gardening, types of crops cultivated, etc.). The multivariate analysis involved linear and logistic regressions relating food security and nutrition indicators to their explanatory factors, and PCA and hierarchical ascending clustering to group villages along the agropastoral spectrum.
Qualitative Inquiry
An inclusive consultation process with communities and stakeholders was conducted to contextualize the indicators collected in routine surveys or used for targeting and the community perceptions of vulnerability proxies. This process also allowed consensus building on the approach among HDP and sectoral partners.
While the quantitative analysis responded to the “what and how many” questions, qualitative techniques allowed us to capture information on the “how and why.” Key informant interviews of local actors and community representatives from Kanem and BeG as well as focus group discussions with women and men from the villages sampled by the quantitative survey were conducted before and after the quantitative survey in March 2021 and 2022 using purposive sampling (Table 1). This qualitative inquiry focused on the consequences of conflicts reported in Kanem and related coping strategies; zoonotic outbreaks and animal diseases; migration of animals and people at the time of data collection; gendered care and feeding practices; social heterogeneity of communities, with consideration for gender and ethnicity; history of livelihood systems; seasonality and access to natural resources.
Secondary GIS Data
Primary data analyses were corroborated with secondary data on reported conflicts (source Armed Conflict Location & Event Data Project [ACLED]—covering a 6-month period before data collection), vegetation (normalized difference vegetation index at the time of data collection), presence of permanent rivers, and administrative boundaries. To merge the secondary spatial data with our quantitative data, we used the GPS data collected as part of the household survey. Using Euclidian distance, we created a central GPS point to identify the village/community location. Geospatial analysis using ArcGIS Desktop with Spatial Analysis extension permitted visualization of the spatial distribution of food insecurity and child wasting and identification of pockets of high prevalence as well as relationships with conflict, vegetation, and proximity to water sources, among others. Quantum GIS was used for the processing of remote sensing data.
Ethical Considerations
As part of the approval of the P2RSA, the Chadian Government has granted the ethical approval to conduct this study before the fieldwork. The Ministry of Agriculture (SISAAP) and the Ministry of Health (DNTA) with the support of FAO undertook the data collection. Participation in the study was voluntary and no incentives were provided. Verbal informed consent was sought from all the study participants before the commencement of any interview. While some subjects could be considered sensitive, such as food insecurity, the collection of the household data as well as child anthropometry posed no risk and was noninvasive. All children’s anthropometric measures were collected with the agreement of the caretaker. Study participants were free to withdraw from the study at any time without any penalty. Data collection tools and methods have been designed to respect the local culture. Confidentiality and data protection were ensured for all participants. The data collection was part of routine surveys conducted under the leadership of the Chadian government. Children identified as acutely malnourished and households identified in acute food insecurity were referred to existing programs in the area.
Results
Description of Undernutrition and Food Insecurity and Their Relationship
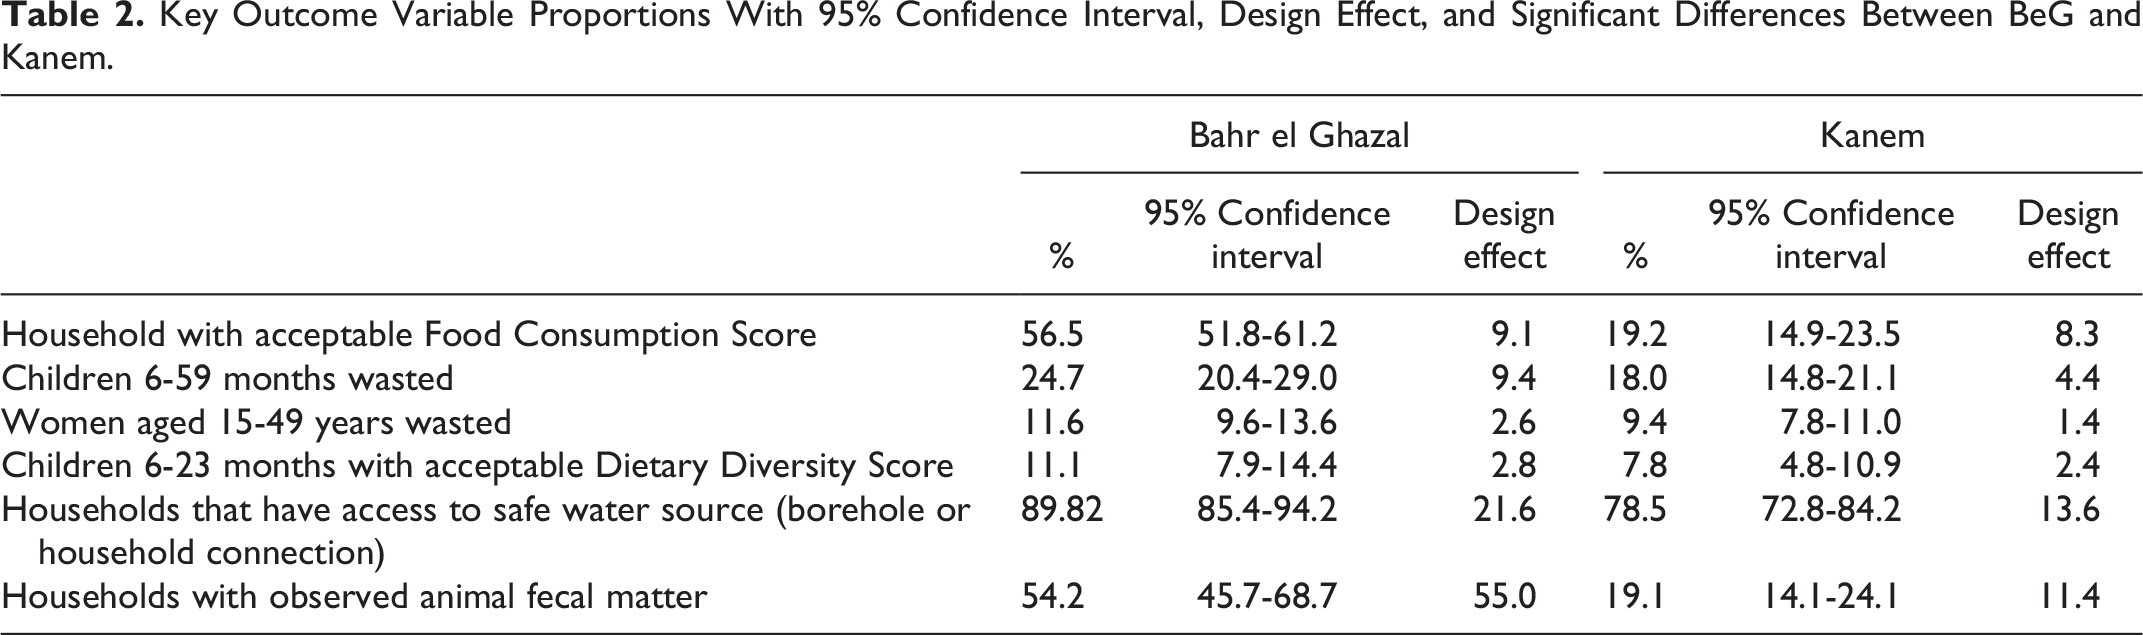
Similarly to SMART survey results conducted in October 2021 by the government among the same provinces but different communities, the prevalence of GAM is very high in both regions with 24.7% of all children wasted in BeG and 18.0% of children wasted in Kanem. Wasting was significantly higher in BeG (p < .05). On the other hand, the proportion of households with acceptable food consumption is significantly higher (p value < .05) in BeG (54.9%) compared to Kanem (19.8%; Table 2). The mean reduced Coping Strategy Index (rCSI) also reflects greater vulnerability to food insecurity in Kanem (15.4) than in BeG (12.5). The minimum Dietary Diversity Score (MDDS, standard indicator form FANTA) of children aged 6 to 23 months and the percentage of children aged 6 to 23 months with the MDDS (who consumed at least 5 food groups) were significantly different for the 2 regions, with a lower rate in Kanem of children having consumed at least 5 food groups (7.79%) compared to children from BeG (11.11%; p value < .05). Thus, on the regional level, we see that wasting is worse in BeG, while food insecurity is worse in Kanem.
Key Outcome Variable Proportions With 95% Confidence Interval, Design Effect, and Significant Differences Between BeG and Kanem.
The correlation matrix using the Pearson correlation coefficient allows us to explore relationships between food security and nutrition indicators with a correlation coefficient of 1 or 1 indicating a perfect positive or negative linear relationship, respectively, and a correlation coefficient of 0 indicating no relationship (Figure 1). Overall, the study finds weak associations between food security and nutrition indicators in the 2 regions, with a Pearson correlation coefficient of less than the absolute value of 0.282. While a higher FCS is associated with lower levels of rCSI, HHS, and LCIS, greater food security is barely associated with nutrition outcomes for children or women.
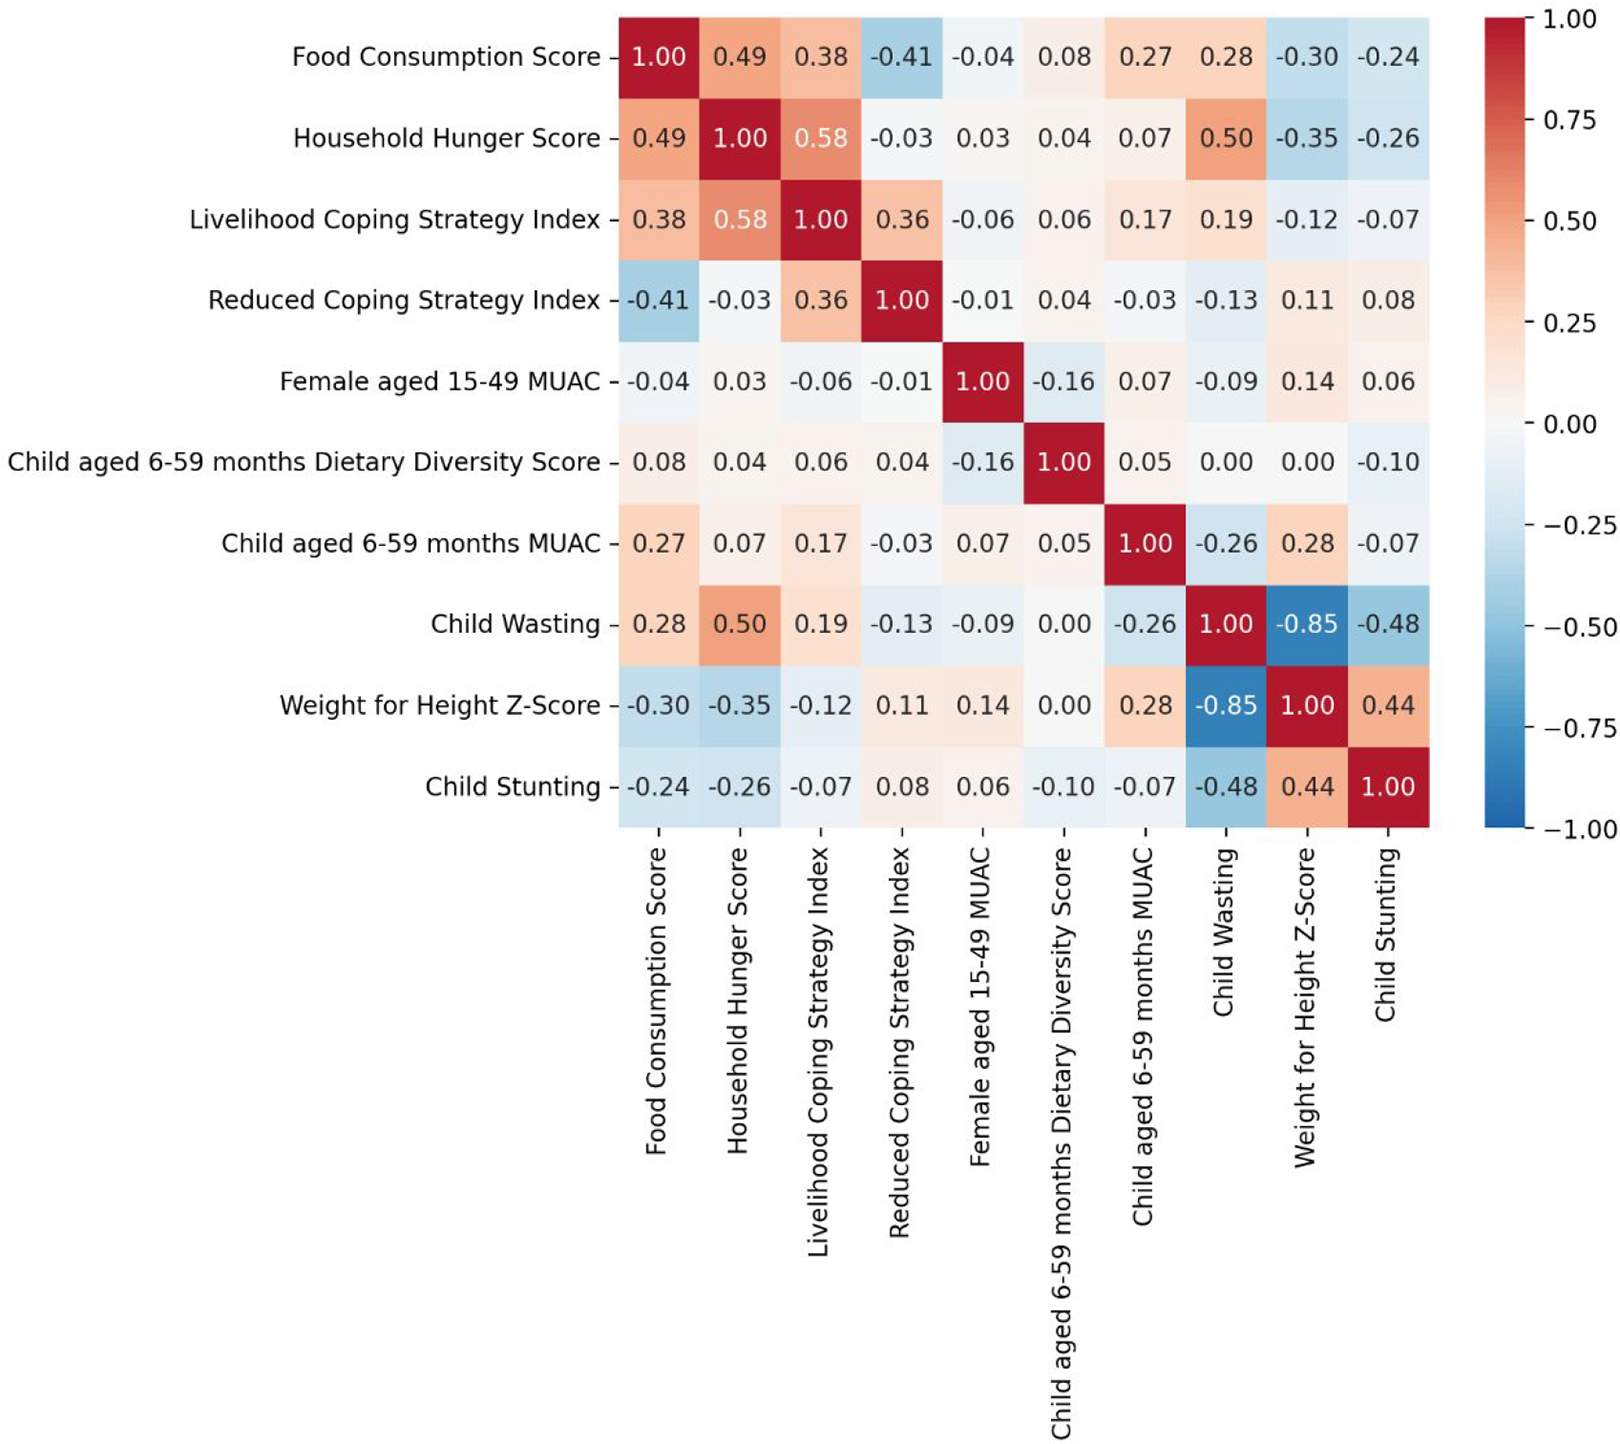
Heatmap of the Pearson correlations coefficient with respect to food security (Food Consumption Score, Livelihood Coping Strategy Index, Household Hunger Scale, reduced Coping Strategy Index, child 6-23 months Dietary Diversity Score) and nutrition indicators (wasting, stunting, child 6-59 months MUAC, female aged 15-49 MUAC).
In line with results from previous SMART surveys in Chad, 25,26 analysis of the design effects, which we use as a proxy for clustering, shows a high heterogeneity in the distribution of food insecurity and child wasting and possible contributors among selected communities (Table 2). The large design effects suggest wasting and food insecurity might be concentrated in specific clusters (but not necessarily together) and indicate that community-level drivers could have a major influence on food insecurity and child wasting outcomes. While looking at the risk of wasting (MUAC < 230 mm) for women aged 15 to 49, we did not observe clustering nor strong intercommunity variability, indicating a greater role of household- and individual-level drivers.
Geospatial of Child Wasting, Household Food Insecurity, and Hypothesized Drivers
We used GIS mapping to better understand the spatial distribution and clustering of food-insecure households and acutely malnourished children. The geospatial mapping using community median FCS and median wasting (22%) shows that food-insecure communities have the lowest prevalence of child wasting (Figure 2).
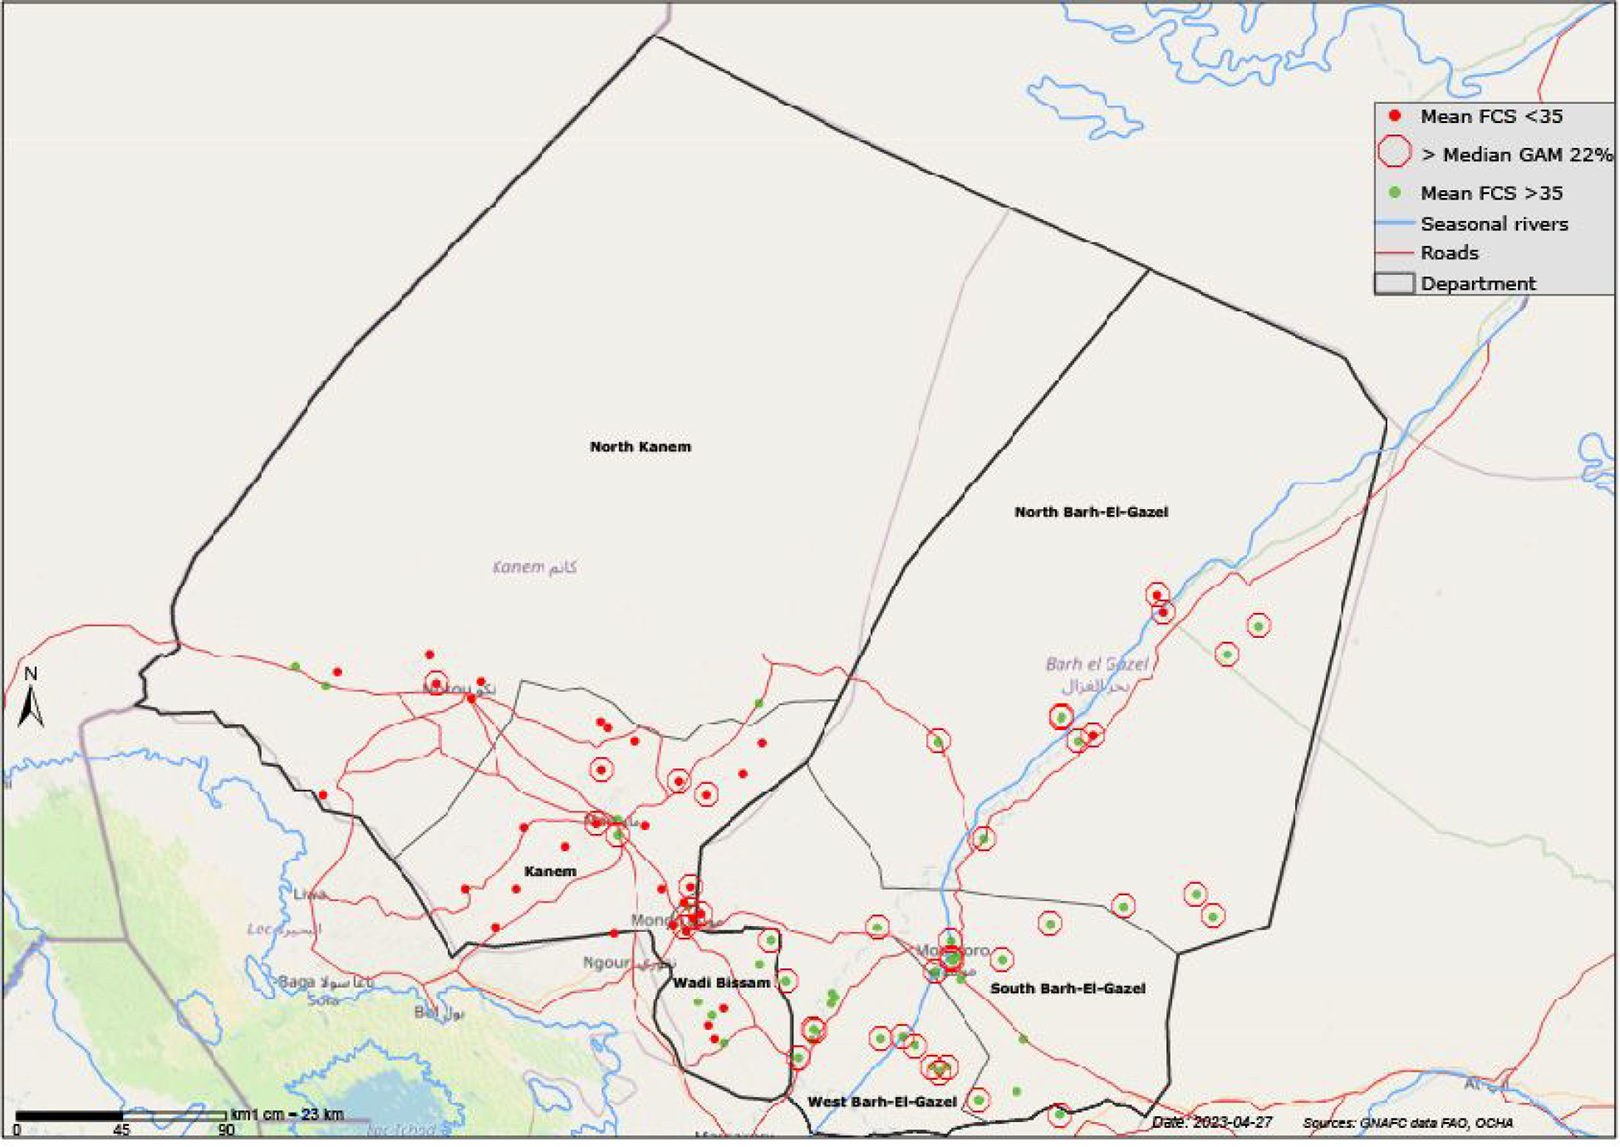
Map of community-level clustering of poor and acceptable Food Consumption Score (FCS < 35) and child wasting. Note: Community’s median prevalence of wasting was used as a threshold for the geospatial analysis.
While 89.8% of households reported using a safe water source (borehole or household connection), qualitative information suggested households might use multiple water sources over the course of a day. The geospatial analysis shows that communities where respondents reported using multiple water sources the previous day (Figure 3) were mostly around seasonal rivers. Using a chi-square z test and 2 mean t test, respectively, we observed a significant association between surface water consumption with higher wasting (p < .001) and lower WHZ (p < .001).
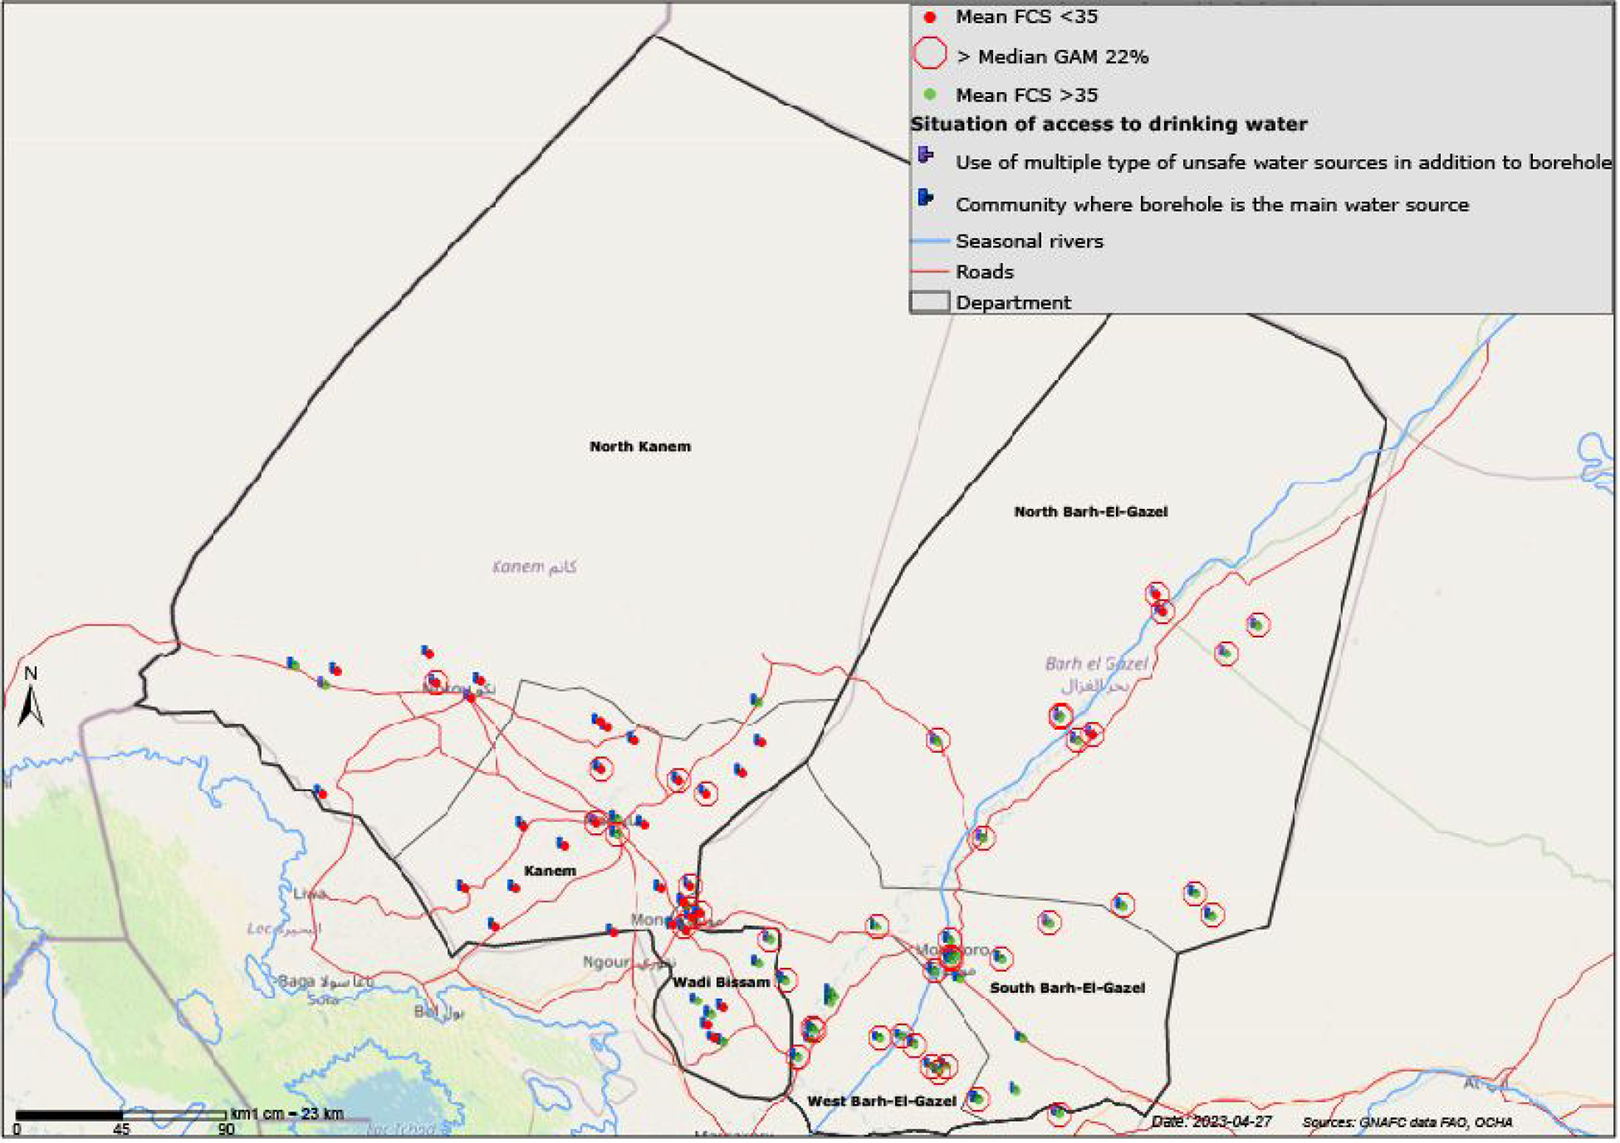
Map of community-level clustering of child wasting and household food insecurity (using FCS) with respect to access to and diversity of drinking water.
Community livestock ownership was also associated with a higher risk of child wasting (Figure 4), lower WHZ, and better household food consumption (FCS; p < .001). While children’s diets and household food security are positively associated with livestock ownership (p < .001) and milk consumption (p < .001), counterintuitively, higher livestock ownership was associated with higher risks of children (p = .040) and women wasting (P = .044). Child wasting was significantly associated with a higher number of cattle (p = .049), camels (p < .001), and goats (p = .044) but not with the number of poultry owned (p = .829). Enumerators also collected information on the presence of animal fecal matter around the household. Observation of fecal matter around the household compound and at the community level was associated with a higher risk of child wasting (p = .040) but with better food security (p < .001). These results reflect the fact that the presence of animals and fecal matter can be a potential source of zoonotic and other diseases, but also a proxy for income/wealth and hence better access to food.
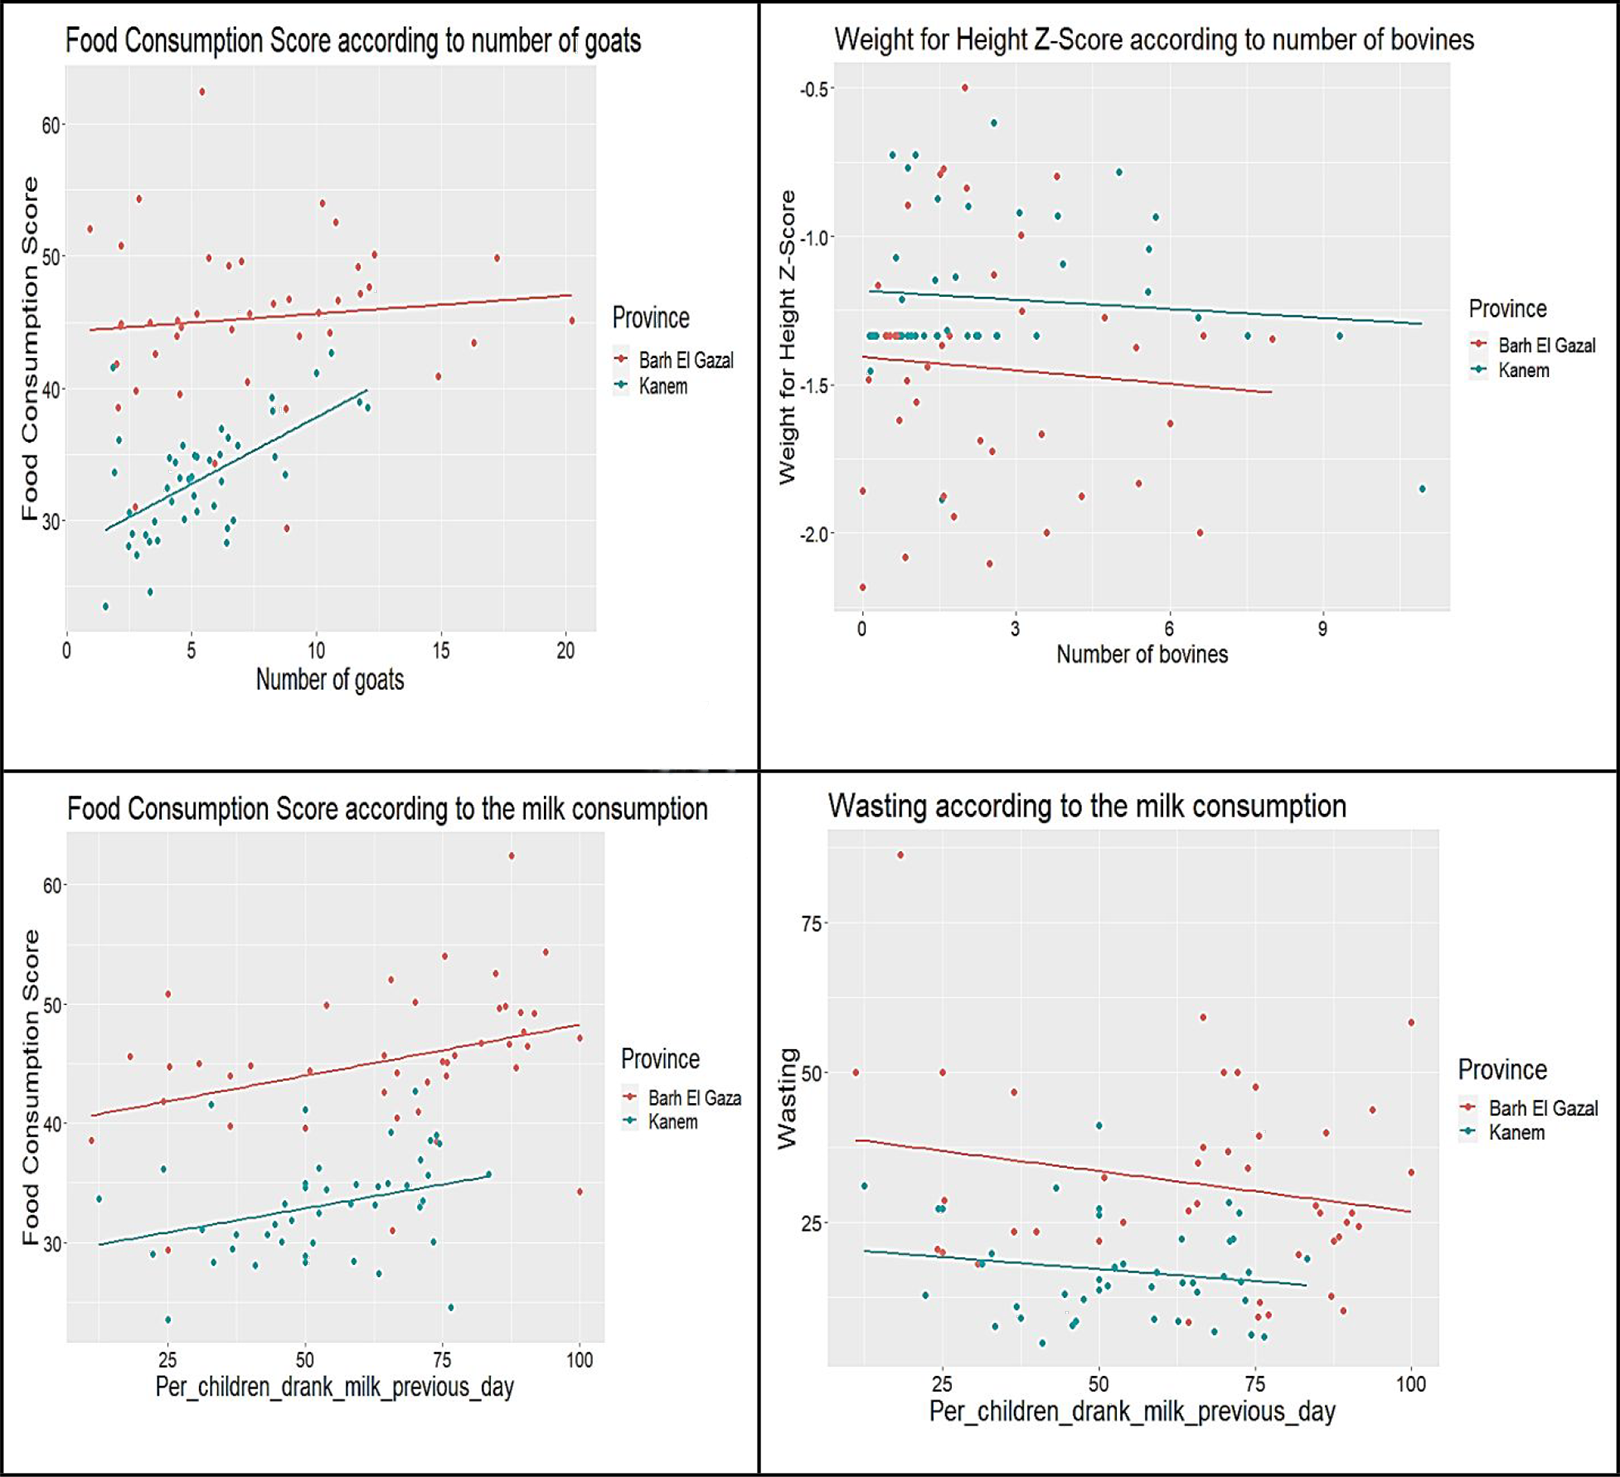
Linear relationship between community-level mean household food security and child wasting with livestock and access to milk.
On the other hand, the significant factors associated with a poor FCS are marital status (polygamous; p < .001), older age of the household head (p < .001), bigger household size (p = .007), the average surface of rainfed agriculture (p = .018), the level of multidimensional poverty (p < .001) and the main source of income of households (p < .001), using the ANOVA test to compare FCS versus source of incomes. Households whose main source of income is trade, wages, or sale of animals or livestock products have lower levels of food insecurity (p < .001), while households living mainly on food assistance, gifts or begging, agricultural and nonagricultural work have lower levels of food consumption (p < .001). Individual factors associated with women’s malnutrition were being pregnant or breastfeeding (p < .008) and polygamous marital status (p < .015). Women who practiced market gardening were less likely to be malnourished (p < .003), while the number of camels (p < .001) owned by households was negatively correlated with women’s undernutrition.
The predominant livelihoods in Kanem and BeG regions have been documented as transhumance in the north and agropastoralism in the south. The study finds that rather than being a distinct group, the agropastoral system is a continuum that consists of varying combinations of crop-farming and livestock-herding activities, with the dominance of each at opposite ends of a multidimensional continuum. Principal component analysis using variables such as number and species of livestock, surface cultivated, market gardening, and main income source identified 8 livelihood specializations along this continuum (Figure 5). The study identifies 8 subgroups along this continuum, with one extreme characterized by more farming, market gardening, and less livestock (group 1) and the other by more livestock leaning with negligible crop farming (group 8). On a third dimension of the analysis, we might oppose groups 7 and 3, further underscoring the heterogeneity within communities (Figure 5). While groups 7 and 8 seem clustered in North BeG, group 2 seems to be concentrated in Kanem. Group 3 seems to be near the main towns of Mao and Moussoro, while group 4 seems equally shared in the south of both regions.
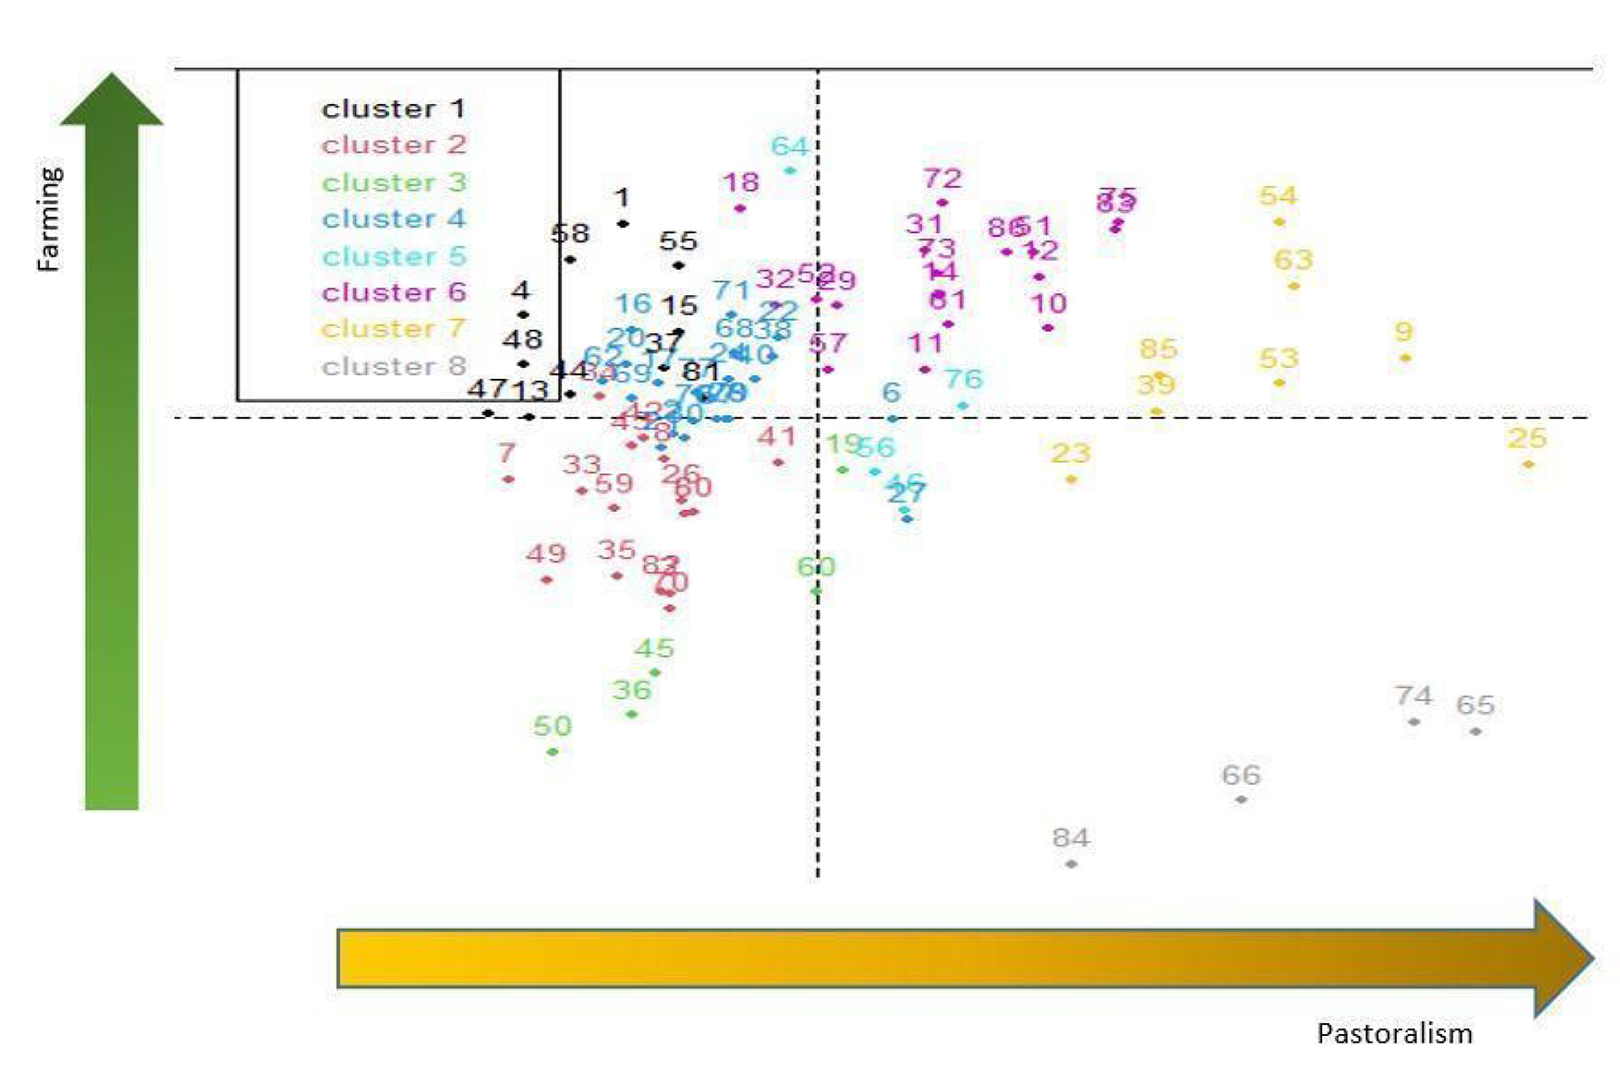
Factor map of a 2-dimensional (farming vs pastoralism) representation community-level livelihood profile (groups 1-8).
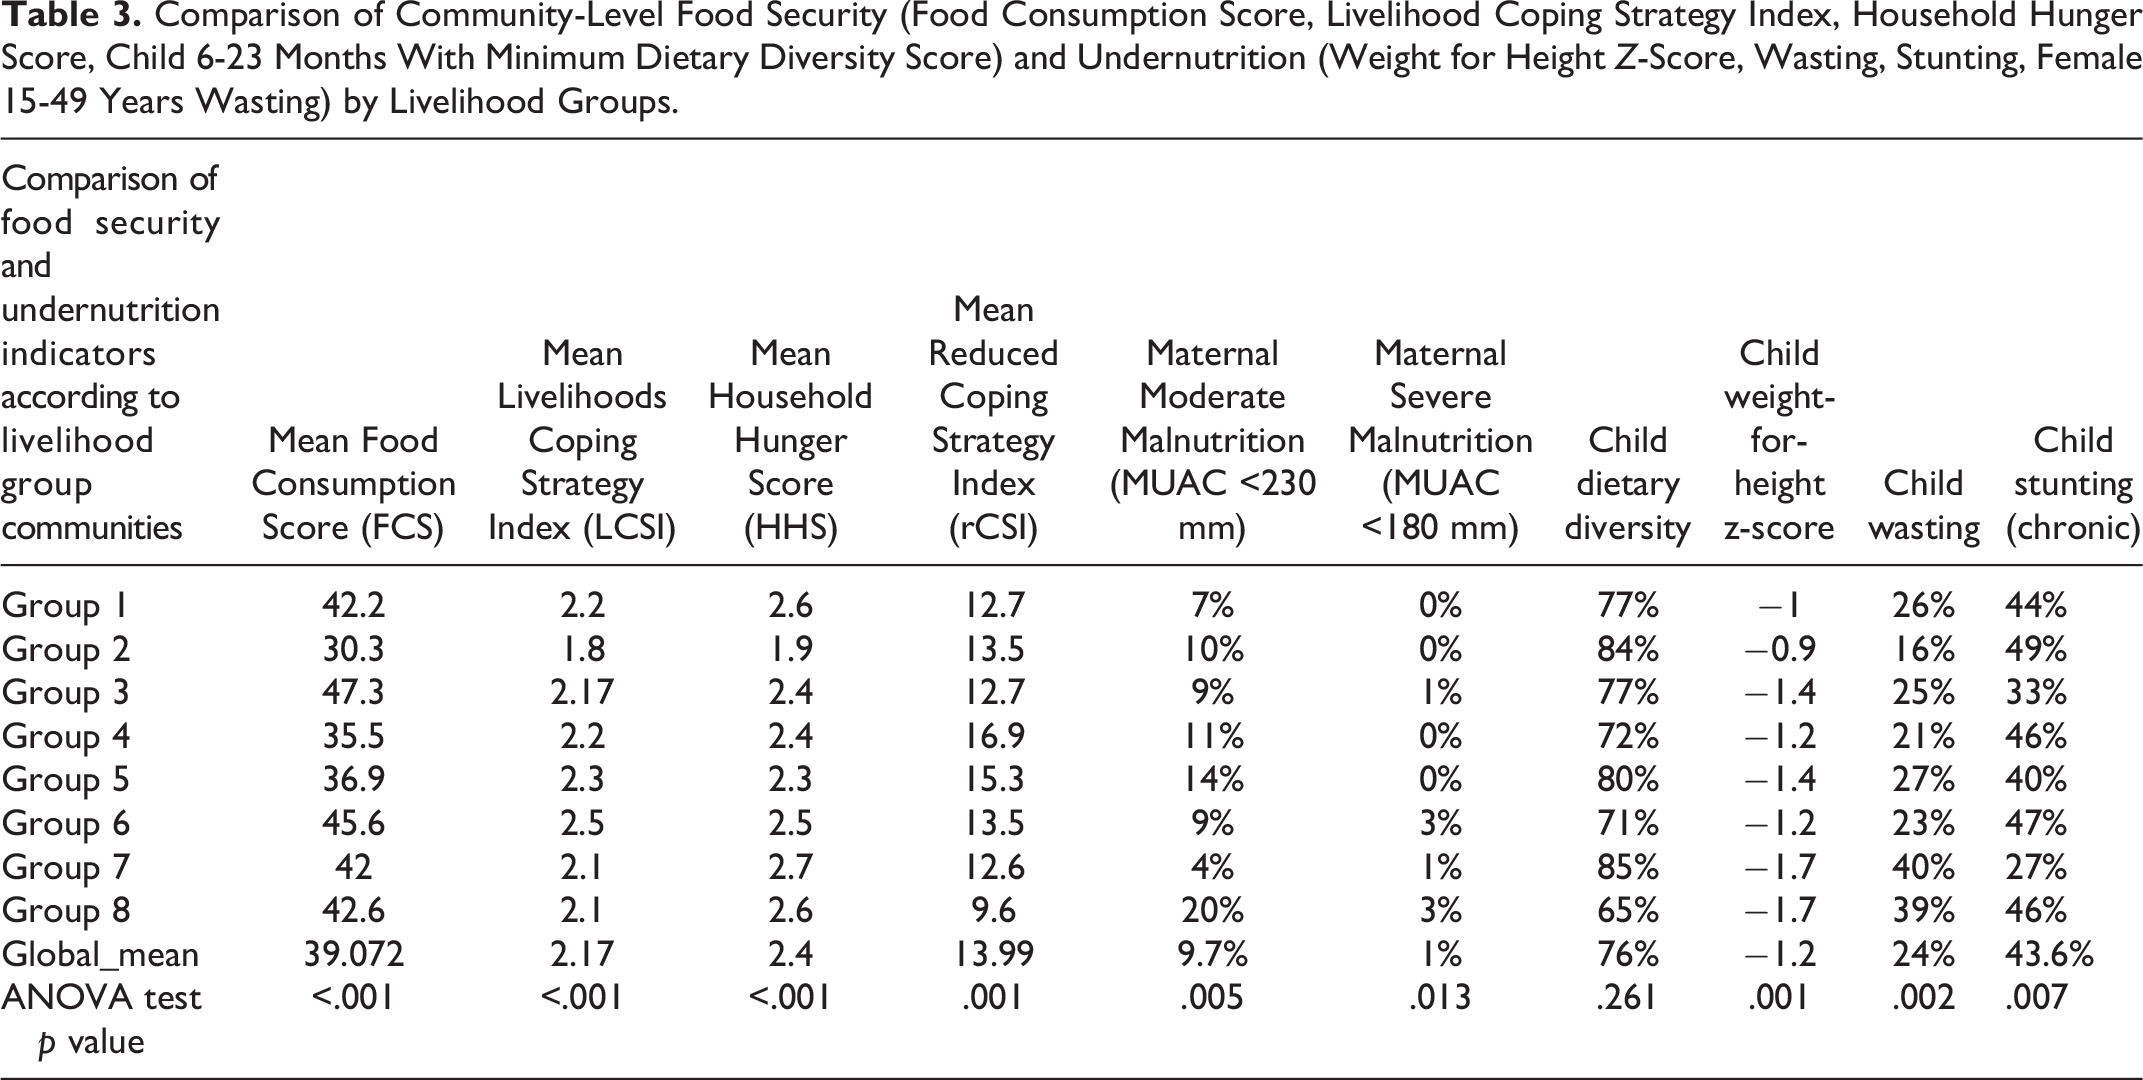
There is a significant association between these subgroups, food insecurity and undernutrition (Table 3), further underscoring the heterogeneity within communities. Most pastoralist groups, who own a high number of camels and bovines (groups 7 and 8), have a higher prevalence of wasting despite high FCSs. Group 6, more specialized in crop farming, poultry, and small ruminants, has a lower prevalence of wasting than those of groups 7 and 8. Groups 4 and 5 have intermediate rates of food insecurity and wasting, but they show the highest rates of wasting among women aged 15 to 49. Group 5 has the particularity of having the highest rate of households whose main source of income is begging and gifts. Groups 1, 2, and 3 practice more rainfed agriculture and own less livestock. Among these 3 groups, groups 1 and 2 have low rates of undernutrition. Group 1 is also characterized by a strong practice of market gardening. On the other hand, group 2 is characterized by low food consumption and high stunting. However, it has a low prevalence of wasting. The stunting that prevails in group 2 could be linked to low structural food consumption, and the low food consumption could also be linked to recent conflicts that have affected this area, which includes a high proportion of daily agricultural workers.
Comparison of Community-Level Food Security (Food Consumption Score, Livelihood Coping Strategy Index, Household Hunger Score, Child 6-23 Months With Minimum Dietary Diversity Score) and Undernutrition (Weight for Height Z-Score, Wasting, Stunting, Female 15-49 Years Wasting) by Livelihood Groups.
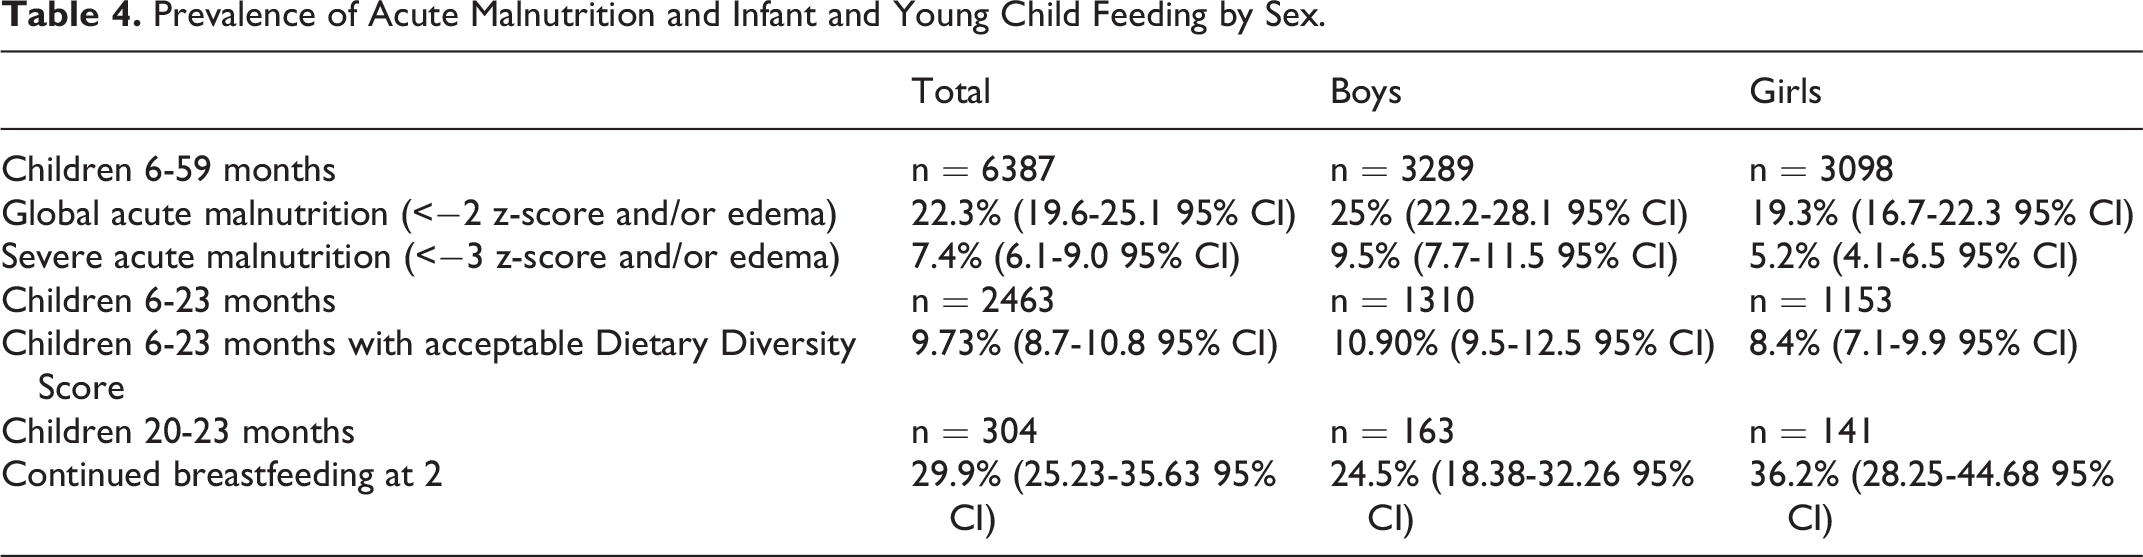
Child dietary diversity is not linked to livelihood specialization but to gendered social norms. The study found that boys in both regions were more likely to suffer wasting compared to girls (25.0% vs 19.3%; Table 4). Using the individual dietary diversity score among children 6 to 23 months of age, the study found that while boys are more malnourished than girls, they have a significantly better dietary diversity; 10.9%, compared to girls, 8.4% (p < .0316), meet the minimum dietary diversity threshold. However, boys are weaned significantly earlier than girls (p < .0332). Other infant and young child feeding (IYCF) indicators 27 were not significantly associated with the sex of the child. Qualitative information from focus group discussions and key informant interviews provided explanations on social norms related to gendered care and feeding practices observed statistically: that boys need to be strong and independent, and they should learn early how to be men with their brothers, away from their mother.
Prevalence of Acute Malnutrition and Infant and Young Child Feeding by Sex.
Conflict, Vegetation, and Seasonality Are Associated With Both Food Insecurity and Child Undernutrition
The 2021 rainy season has been characterized by very poor rainfall, in particular in the Western Sahel area of Chad. Normalized Difference Vegetation Index spatial analysis as well as early warning systems published reports 20,28 have associated the irregularity of rainfall to the reduction of food production in Kanem and BeG. (A drought episode was reported in August 2021.) In addition to rainfall, the difference in clustering of food insecurity and child wasting across Kanem and BeG might be in part due to the conflict dynamics in the 2 regions and how they directly affect the presence of livestock herds and access to natural resources. In August 2021, battles and insecurity were reported in Kanem. Chad’s army battled with Libya-based rebels from the Front for Change and Concord in Chad (FACT) in Kanem. Local actors explained that insecurity in Kanem (battles, landmines, close borders of Niger, and Libya) resulted in limiting their ability to carry out rainfed cultivation, with animal migrations deflected to BeG, where more water and pasture were available at that time. Due to conflict and the distribution of vegetation/rainfall, animals were clustered in south BeG around available grazing land and surface water sources (Figure 6). Thus, communities from Kanem were forced to be at a greater distance from their animals and animal milk, potentially contributing to food insecurity, while communities around the south of BeG had increased pressure on surface water points, possibly contributing to the spread of zoonoses and environmental contamination related to child malnutrition. Reported animal diseases in the area at the time of the study include Cryptosporidium parvum (a zoonotic pathogen found in cattle), charbon/anthrax, pasteurellosis, foot and mouth disease, plague of small ruminants, and brucellosis. 28
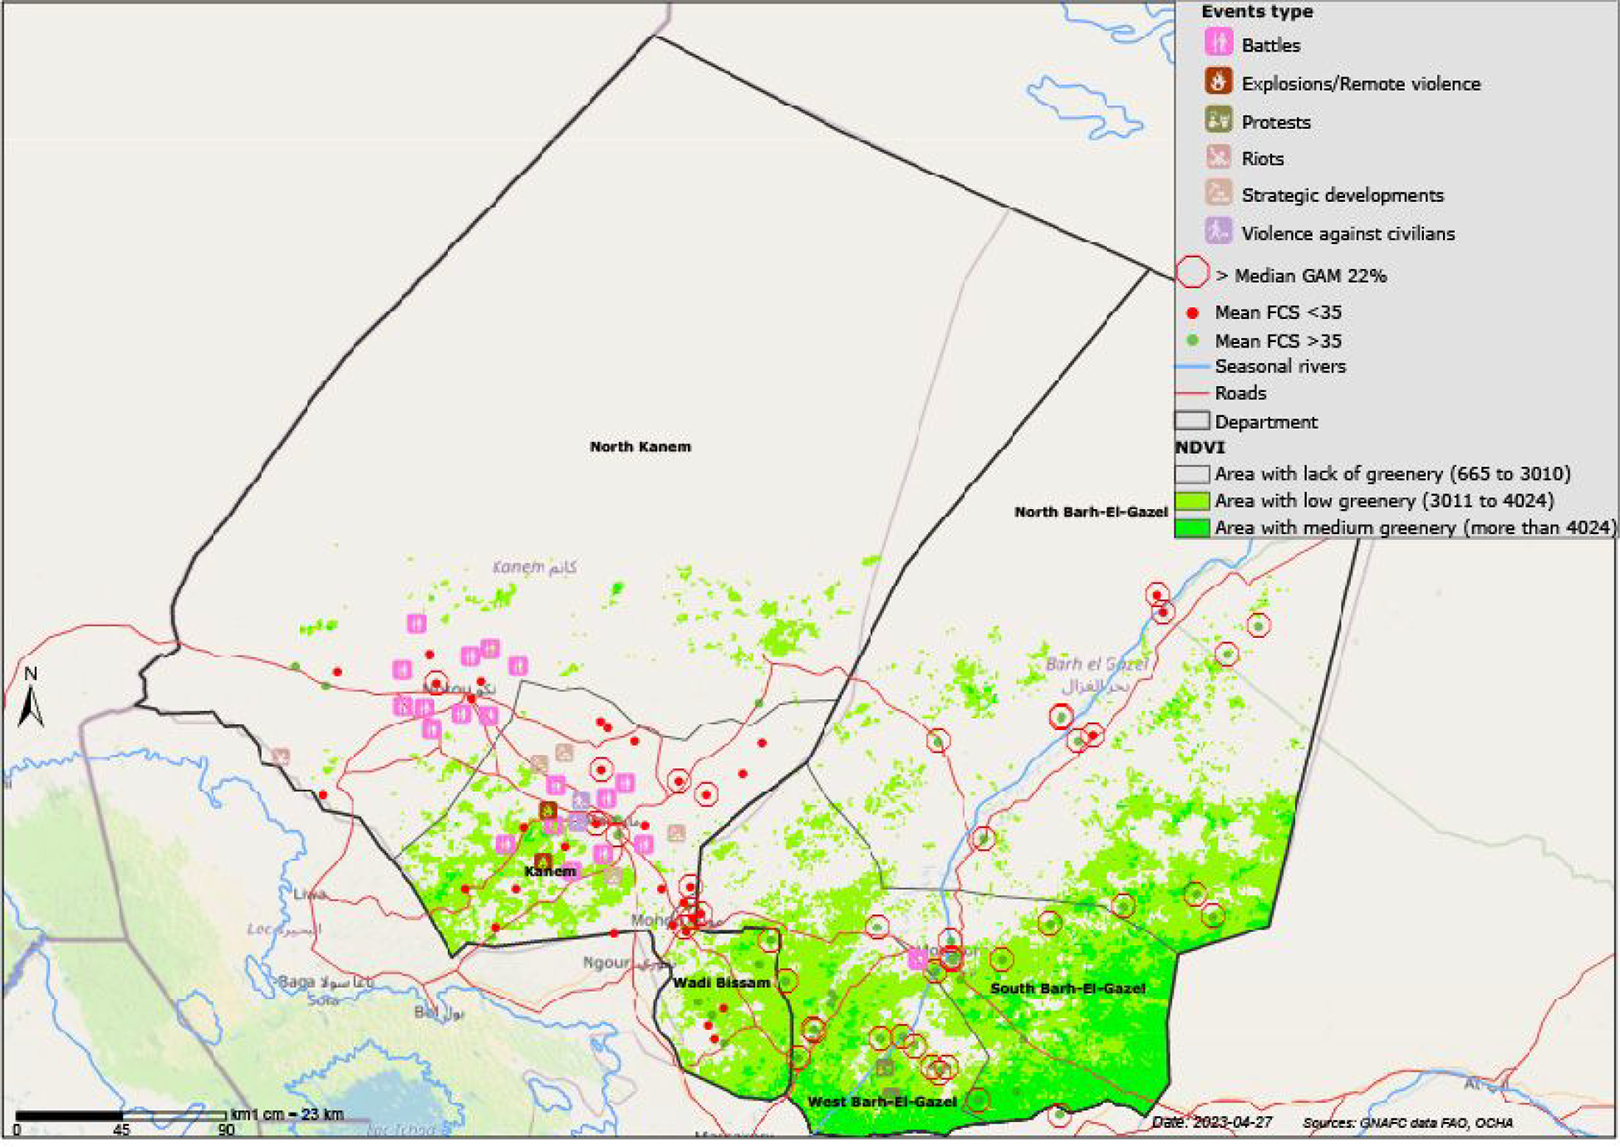
Map of Normalized Difference Vegetation Index (NDVI), conflict, Food Consumption Score (FCS), and child wasting (GAM).
Discussion
This article explores a novel approach to understanding the drivers of and relationship between wasting and food insecurity using a combination of qualitative inquiries, a quantitative survey, and geospatial analysis across 2 regions in Chad with above emergency levels of acute malnutrition on a yearly basis. The analysis indicates not only that different communities are affected by food insecurity versus malnutrition but, importantly given the high level of clustering of these outcomes, that many of the drivers likely operate on the community level. We further unpack the drivers of food insecurity and child wasting, indicating mostly different pathways, with the exception of conflict and natural resources, which are associated with both of our categories of outcomes. Our findings have direct implications for ongoing programs, overall policy, and research design not only in Chad but throughout the Sahel where similar dynamics have been identified.
Our data show a complex relationship between wasting and food insecurity across individuals, households, and communities, indicating a set of different drivers. We find that on the household level, measures of food insecurity and undernutrition are weakly correlated. When reviewing the data on the community level, the data show that communities affected by the highest rates of food insecurity were not the same communities that experienced high levels of undernutrition. Similar contradictions are also apparent on the individual level. While boys have better dietary diversity, they are more vulnerable to wasting; on the other hand, girls have significantly better nutritional status compared to boys despite significantly worse dietary diversity. These differences between boys and girls are likely associated with different gender norms as identified by the qualitative research. Thus, these findings directly contradict the existing “food-first bias” and indicate that programs and policies that aim to address food insecurity might not be the most appropriate for addressing child undernutrition, and vice versa. 10
Using geospatial analysis as well as the design effect—as an outcome as opposed to simply a correction in the analysis—allows us to dig more deeply into the degree to which community-level factors, as opposed to household or individual, might play a role in food insecurity and nutrition outcomes. The analysis of the design effect and geospatial distribution of the main outcomes and key characteristics of communities shows that undernutrition and food insecurity are highly clustered. The clear clustering of the outcome indicators likely indicates that major drivers of food insecurity and undernutrition are prominent and distinctive at the community level as well as operating at the household or individual level. However, few studies, particularly few quantitative studies, analyze food insecurity or malnutrition on the community level, given the focus in both the design and data collection on individual and household characteristics, potentially missing key community drivers but also more basic causes of these outcomes. However, more recently, particularly with the use of geospatial analysis, more research has identified that nutrition and food insecurity outcomes are highly clustered, and thus community-level and basic drivers require greater consideration from the start of the research. 5 -9
Given the lack of correlation between food insecurity and child wasting, as well as the clustering of these outcomes across different communities, it is not surprising that the drivers of these 2 outcomes also varied in the regression and geospatial analysis. The drivers of food insecurity are linked with poverty and shocks (surface cultivated, sources of income, multidimensional poverty, conflict, and rainfall). Drivers of undernutrition, on the other hand, in our data are linked with greater livestock ownership on the community level and proximity to seasonal rivers, with no relationship to food insecurity. The latter could potentially indicate greater household use of non-potable water (given community preference and use of seasonal rivers) as well as increased sharing between animals and humans, given the use of these water sources for animal water consumption as well. Multiple recent evaluations and research studies have identified water, sanitation, and hygiene (WASH) related drivers as critical in preventing or shortening recovery time from wasting in Chad, including improving household hygiene practices, 29 adding a WASH package to outpatient therapeutic feeding programs, 30 and including considerations for cattle and humans sharing the same water source. 31 In terms of the latter, research from N’djamena, Chad, found that severely acutely malnourished (SAM) children who had C. parvum in their stool had a 72% greater risk of death compared to SAM children without the pathogen. 32 The findings in Chad are in line with more global research that highlights the need to better address possible water and soil contamination from animal fecal matter 33,34 as well as environmental enteropathy. 35
However, we do find that basic drivers such as conflict and access to natural resources play a role in determining both food insecurity and child wasting. This study highlights the critical importance of having a systemic approach and considering basic drivers 18 in understanding and addressing undernutrition, food insecurity, and their clustering. Seasonal livestock management, livelihood systems, gendered social norms, environmental health, access to water and land, and conflicts are likely to be major drivers of both food insecurity and undernutrition but operate differently to affect them. In Kanem and BeG regions, where both water and pasture resources are scarce, transhumance is both a predominant source of livelihood and a driver of conflict as communities compete over these resources for their well-being. However, it is important to recognize that standard quantitative surveys and study designs are rarely equipped to explore systemic drivers that affect specific communities or heterogeneous areas. Thus, it is important to incorporate geospatial analysis alongside more qualitative inquiries, as well as to consider things such as the design effect, when designing research studies and analyzing findings. For example, if data on conflict or gender norms are not incorporated or explored in the research, these basic drivers will not be identified, leading to programs that are conflict blind.
Our findings can inform the operationalization of coordinated HDP nexus approaches to maximize the positive impact of programs in dryland contexts. A programmatic consideration of gender social norms, zoonotic diseases, environmental contamination, and conflicts around access to natural resources has a higher potential for being successful in sustainably addressing hunger, not only in Kanem and BeG but also in other countries with similar challenges. Deliberate efforts to build the evidence on conflicts and modification of programs to make them conflict-sensitive is a prerequisite for HDP nexus interventions.
The findings from this study challenge some aspects of how the humanitarian and development community views the causes of food insecurity and malnutrition, and these findings also put to light inadequacies in the design and funding mechanism of interventions. The study shows that beyond the need to have nuanced interventions that respond to differentiated needs in complex settings such as in Chad, programming needs to go a step further to refine standard intervention packages that are often applied as is. For instance, nutrition-specific and nutrition-sensitive interventions may be significantly more effective if enhanced with one-health principles to address health risks faced by the population or taking into account local norms and habits. Interventions implemented through the HDP nexus approach should therefore be built, rather than retrofitted, for the purpose. In Kanem and BeG, integrated livestock management intervention could play a crucial role in addressing food insecurity and child undernutrition by increasing household income and food diversity while also improving child nutrition, livestock, and environmental health.
It is also critical to have a participatory process that involves communities, not only via complaint and feedback mechanisms but all along the project cycle, to make sure activities are context sensitive. Funding mechanisms need to take into account the following recommendations needed for sustainable and sequenced investments to respond to protracted crises.
Targeting is a program-, population-, and context-specific process that is part of the program cycle. The purpose of any targeting process is to ensure reaching the right people with the right assistance. Identifying the right people entails identifying the program-specific vulnerability framework, then profiling the population of interest against the framework to define a set of verifiable features as targeting criteria. Whereas it was envisaged to have a one-for-all targeting model based on the assumption of similarity in context, the observed spatial heterogeneity of the food security and nutrition outcomes both between and within the target regions points to the need to adapt this strategy. This strategy will need to be informed by a revision of the programmatic objectives that will now need to be tailored as a function of the outcomes clustering at the community level but underpinned by HDP nexus principles. Based on the study findings, the targeting models will necessarily differentiate between communities where improvements in food insecurity versus nutrition outcomes are of primary interest. Consequently, households in the different clusters of communities would have different goals for sustainable graduation. Hence, “one solution fits all” is not the best approach to target populations with different programs. Household economic capacity, livelihood profile, access to services, gendered care practices, women’s workload, exposure risk to zoonotic diseases, and conflict events are important aspects to explore in addition to food insecurity and undernutrition.
To be useful for practitioners and communities, data and evidence need to be sufficiently detailed to understand the complexity of drivers of hunger and include a joint monitoring of multisectoral indicators to strengthen early warning and anticipatory action systems to capture the early stage of potential crisis. Existing evidence often suffers from either a lack of geospatial granularity when evidence is only available at the national or subregional level or on the opposite side of the spectrum, when data are only analyzed on the household and individual level. Future research and evaluation need to collect and make data available on the granular level across both time (seasonality) and space, while making sure that analysis is done on the individual, household, community, and subregional level. The use of geospatial analysis, analyzing community-level clustering and design effect in the quantitative survey, and using qualitative inquiry to better understand more basic drivers such as gender norms is critical if we are to have a full and nuanced understanding of why some areas experience persistent levels of food insecurity and child wasting despite decades of humanitarian and development investment.
Study Limitations
We collected quantitative data in the villages over 40 days in August and September 2021, and while we control for the date of data collection in the analysis, specific survey timing can affect the comparability of data across villages given the seasonal dynamics and heterogeneities of the area. The findings of the quantitative and qualitative data are reflective only of the period for which data collection took place and thus cannot necessarily be extrapolated to other seasons. While we used community mobilization techniques through local leaders and institutions, we cannot guarantee an exhaustive data collection on all households, women, or children living in the 86 sampled villages. As the data collection took place in August 2021, we might have missed some households or individuals that migrated for agricultural or pastoral purposes. Another limitation lay in the reality that most households did not have childbirth certificates, and thus enumerators had to use seasonal calendars to estimate the age of the child, likely leading to some discrepancies. The methodology used does not aim to attribute causality but rather triangulate evidence that might contextualize and help understand observed outcomes. Finally, carrying out this study under the banner of the key HDP actors (government technical agencies, nongovernmental organizations, and United Nations agencies) that intervene in the area may have influenced some of the testimonies and survey responses.
Footnotes
Author Contributions
GL coordinated the team and oversaw the study with inputs from KS, AB, EW, and AC. MK oversaw field operations and data collection, performed the geospatial visualization and participated in the statistical analysis with the help of EW. FH led the multivariate analysis with inputs from KS and EW. AM and AMO supervised the paper and study. All authors contributed to the review and drafting of the paper.
Declaration of Conflicting Interests
The authors declared no potential conflicts of interest with respect to the research, authorship, and/or publication of this article.
Funding
The authors received no financial support for the research, authorship, and/or publication of this article.