
Abstract
Background:
The Infants and Young Children Dietary Diversity Score (IYC-DDS-7) has been validated to assess dietary quality in children. However, its applicability to predict the adequacy of micronutrient intake remains a challenge in all contexts.
Design and Methods:
A 24-hour dietary recall assessment was conducted on a sample of 628 children aged 6 to 23 months in the plenty season (PS) as well as in the lean season (LS). The IYC-DDS-7 was calculated based on 7 food groups, whereas the mean micronutrient density adequacy (MMDA) for 11 micronutrients. The β regression models were used to assess the relationship between IYC-DDS and MMDA and differences in nutrient intake between the 2 seasons. A receiver-operating characteristic curve analysis was also performed to determine IYC-DDS-7 cutoff levels that maximized sensitivity and specificity in assessing dietary quality and predicting MMDA below- or above-selected cutoff levels.
Results:
Participating children’s MMDA was 56.9% ± 12.8% versus 61.9% ± 8.6% and IYC-DDS-7 was 3.43 ± 1.5 versus 3.77 ± 1.0 in the PS and LS. The IYC-DDS-7 had a positive correlation with MMDA, irrespective of the season. For a 1-unit increase in IYC-DDS-7, MMDA increased by a mean of 10.7% (CI, 8.3%-13.1%; P < .001). The minimum threshold of the 4 food groups corresponded to a sensitivity of 76% and 61% and a specificity of 75% and 70% for the prediction of inadequate diet in the PS and LS, respectively.
Conclusions:
The IYC-DDS-7 predicted MMDA, regardless of seasons for infants and young children. The IYC-DDS-7 cutoff of 4 groups performed well in classifying children with low-diet quality.
Introduction
Micronutrient deficiencies continue to be widespread among children younger than 5 years in low- and middle-income countries (LMICs), despite the existence of several effective prevention strategies. 1 Even mild-to-moderate deficiencies of micronutrients lead to undesirable short- and long-term effects, including physical, developmental, and cognitive impairment; increased susceptibility to infections; higher morbidity and mortality; and decreased productivity later in life. 2 Benin, an LMIC, is not an exception, as the average intakes of energy, fiber, and several key micronutrients such as vitamins and iron (Fe) were below the recommended levels. 3,4 Among several causes of micronutrient deficiencies, insufficient intake and poor bioavailability of micronutrients are the key concerns. 5 The imbalanced macronutrient and inadequate micronutrient intakes are common in children because of their generally monotonous complementary feeding and diets, which are predominantly based on plants or cereals and lack micronutrient-dense foods such as vegetables, fruits, and animal-source foods. 6
However, the assessment of food and nutrient intakes has been limited because of the cost, burden, and complexity of dietary assessments. 7 As a result, the Infants and Young Children Dietary Diversity Score (IYC-DDS) has emerged as an alternative approach to quantify nutrient intakes. 8 The IYC-DDS is a simple indicator of dietary diversity based on measuring the number of food groups consumed over a given reference period. Higher dietary diversity is associated with an adequate intake of essential micronutrients 9 -11 in breastfed and nonbreastfed children. In addition, the score has been associated with nutrient density 12,13 and nutrient adequacy. 14,15 This means that children who received 4 or more food groups out of 7 during the previous day were more likely to have an adequate diet than those who consumed food items from less than 4 food groups.
Nevertheless, studies have shown that the cutoff of at least 4 food groups recommended for this indicator is not always suitable for predicting children’s diet quality for all contexts. 16,12 Furthermore, as the seasonal influence on dietary intake and nutrient density of local foods was demonstrated to be substantial, seasonal differences can be expected to affect the validity of simple dietary indices to predict dietary quality. 17,18 However, in Benin, studies that focused on seasonal variation found conflicting results in the trends of dietary intakes. 19 -23 To the best of our knowledge, only one study has assessed the validity of DDS among breastfed children aged 6 to 12 months in 2 distinct seasons: harvest and preharvest seasons. 16 Therefore, this study aimed to (1) compare the adequacy of micronutrient intakes between plenty season (PS) and lean season (LS), (2) assess the predictive ability and seasonal stability of IYC-DDS-7 to indicate dietary quality, and (3) assess how well the IYC-DDS-7 cutoff of 4 groups performed in infants and children in rural southern Benin.
Methods and Participants
Study Setting
This cross-sectional study was conducted in Houéyogbé and Bopa communes of southern Benin. According to INSAE’s RGPH-4 2013 report, there were 101°893 inhabitants in Houéyogbé and 96 281 residents in Bopa in 2013. Both communes are located in 2 agroecological zones (AEZs): AEZ 6 and AEZ 8 (southern Benin). Specifically, AEZ 6 (Houéyogbé) and AEZ 8 (Bopa) were selected because of their potential agricultural biodiversity for food and nutrition, 24 despite the high rates of malnutrition in these areas. Indeed, Houéyogbé (34%) and Bopa (40%) have the highest rates of food insecurity since 2014, 25 and stunting prevalence was around 29%. 26 Farming and raising livestock were the primary sources of income for the community. In addition, food crops such as corn, groundnuts, beans, and cassava were commonly grown. However, based on the differences in food availability between seasons, the food consumption patterns of the population were expected to vary.
Sampling and Design
The sample selected in this study was a subsample of another larger study, the details of which were as follows. Using the Schwartz formula, 27 the theoretical sample size calculated was 1182 children aged 6 to 23 months, which was extended to 1300 by a 10% increase to consider potential dropout cases. The number of children to be selected in each commune was obtained proportionally to the population of children aged 6 to 23 months in the 2 communes. The proportions were 47% for Bopa and 53% for Houéyogbé. 25 This yielded 611 and 689 children aged 6 to 23 months in Bopa and Houéyogbé, respectively. For statistical analysis efficiency, we set a minimum of 35 children to be sampled from each age group: 6 to 11 and 12 to 23 months, in each village. With a small margin, this meant 80 children aged 6 to 23 months to be sampled per village. Hence, 17 villages (8 in Bopa and 9 in Houéyogbé) were randomly selected. In the PS, after accounting for dropouts and field realities, 1263 children were randomly interviewed in the 2 communities proportionally to the number of children counted in each of the 17 selected villages. This was well over the 1182 children from the theoretical sample size calculation. In the LS, 1300 children were randomly selected proportionally to the number of children counted in the same villages after 6 months from the PS, without intervention. Among the 1263 and 1300 randomly selected children aged 6 to 23 months in 17 villages in the communes of Houéyogbé (AEZ 6) and Bopa (AEZ 8), during the PS and LS, respectively, 628 same children were interviewed in both seasons and their diet was analyzed in this study.
Ethical clearance for this study was obtained from the National Ethics Committee for Scientific Research (N°45/MS/DC/SGM/DFR/CNERS/SA). Study objectives as well as the confidentiality of data to be collected were clearly explained to the participants, and they were allowed to ask questions for clarification. Written informed consent was obtained from the primary caregivers (usually mothers) willing to participate, under the agreement of the child’s father.
Data Collection
Data on socioeconomic and demographic characteristics and infant feeding practices were collected using pretested interviewer-administered questionnaires. The questions were adapted from the Demographic and Health Survey Questionnaires 6 and the World Health Organization (WHO) guideline for assessing infant and young child feeding habits. 28 In addition, we collected dietary intake data using a multiple-pass 24-hour recall questionnaire adapted for commonly consumed foods in the study area. 29 Dietary intake data were collected twice per child and per season on 2 nonconsecutive days. Data collectors were fluent in local languages (Sahouè and Kotafon) and received 1 day of intensive training from the principal investigator.
Dietary intake assessment
Two nonconsecutive 24-hour recalls of the children’s diet were conducted each season using Conway et al 30 and Gibson and Ferguson 29 methodologies as interactive 24-hour recalls were less expensive and burdensome for respondents than weighed record methods. During the interview, mothers were asked to describe all food their children had eaten in the last 24 h, including the time, name, state of consumption (raw or boiled), cooking mode, ingredients, sources of ingredients, unit of measurement, the portion served, and remaining portion. The portion consumed was calculated by subtracting the remaining portion from that served. Ingested quantities (g) were estimated using standard recipes. Missing nutrient values were imputed using the formula of Gibson and Ferguson. 29 The Lucille software was used to generate the contributions in grams (g) of each ingredient from the recipe ingested and their micronutrient intake. Due to the lack of a national food composition table (FCT) in Benin, the Mali 31 and West African FCTs were used. Finally, the retention factors (RFs) proposed by Food and Agricultural Organization (FAO) 32 were considered.
Dietary diversity score and micronutrient density adequacy
We calculated the IYC-DDS-7 using the second day of recall of the 2-day recall to represent the usual diet. Indeed, on the first day, we suspected a change in eating habits due to the interviewer’s presence to learn about the children’s eating habits. During the 24-hour recall, the interviewer asked the respondent to list all the child’s foods the day before, that is, waking to bedtime. The interviewer insisted on food consumed outside households, fruit, or juice. Using the list of foods consumed, we categorized each into the 7 food groups recommended by WHO. 28 The 7 food groups are as follows: (1) grains, roots, and tubers; (2) legumes and nuts; (3) dairy products; (4) flesh foods; (5) eggs; (6) vitamin A–rich fruits and vegetables (> 130 retinol equivalents per 100 g); and (7) other fruits and vegetables 28 If a child consumed a group of foods, a score of 1 was assigned; otherwise, a score of 0 was assigned. The sum of the scores for the different food groups determined the child’s overall DDS, ranging from 0 to 7. By the WHO infant and young child feeding practices guideline, 28 fats and oils were not used in the analyses.
The Lucille software (http://www.foodscience.ugent.be/nutriFOODchem/foodintake) was used to generate the nutrient intakes from the different ingredients of recipes children consumed on 2 nonconsecutive days. From these nutrient intakes, usual intakes were estimated using the Multiple Source Method (MSM) software (https://msm.dife.de/), which considered some variables susceptible to influence food consumption, such as the day of recall, the enumerators’ bias, and the special day.
Dietary quality was defined based on the micronutrient density, which is defined by the amounts of micronutrients per 100 kcal of all foods and fluids other than breast milk. For each micronutrient, the individual nutrient density adequacy was calculated as the percentage of the desired nutrient density for that age and breastfeeding status. The overall dietary quality score, or mean micronutrient density adequacy (MMDA), was calculated as the mean of all 11 individual micronutrient (vitamin A, thiamin, riboflavin, niacin, vitamin B6, vitamin B12, folate, vitamin C, iron, zinc, and calcium) density adequacies, with each capped at 100%. Thus, the maximum possible MMDA was 100%. For these analyses, 2 cutoffs for MMDA were used: cutoff MMDA < 50%, which is considered low micronutrient density, and cutoff MMDA ≥ 75%, which is considered “better” micronutrient density. 33 We used the recommended nutrient densities of complementary foods per 100 kcal proposed by Dewey and Brown. 34
Data Analysis
Our sample size varied with the type of analysis. The description of the sample included all children surveyed, with 1263 and 1300 children during PS and LS, respectively. For the analysis of energy and nutrient intakes across seasons, samples prepared for this purpose were used, with 1183 and 1186 children in the PS and LS, respectively. Finally, for the mixed-effects model to explore correlations between MMDA and IYC-DDS-7, 628 children who were found during both the PS and LS and from the same households were considered.
Descriptive analyses were conducted for sociodemographic data and the percentage of the study population consuming each food group relative to dietary diversity stratified by season. In addition, means and standard deviations (SDs) were reported for continuous data that were normally distributed. Due to the skewness of most nutrient intake data, median intakes and interquartile ranges by season were presented for descriptive purposes. Then, we used a generalized linear model based on the gamma distribution to compare the mean energy and nutrient intakes across seasons. Differences in means were statistically tested using a Student t test, while a chi-square test was used to compare categorical variables.
To investigate the relationship between MMDA and IYC-DDS-7 by season, and due to the skewed distribution of nutrient intakes, a log-linked mixed-effects β regression model was fitted to MMDA using the GAMLSS package. 35 To better control the effect of the covariate, we included the interaction between IYC-DDS-7, season, age, sex, breastfeeding status of children, and energy intake as covariates. The mixed-effects model was used to control correlations between data from the 2 seasons for the same child. First, all interactions between 2 covariates were included in the model and then a stepwise selection procedure was used to select only significant interactions between covariates. Second, the fit validity was evaluated with a chi-square test on the residual deviance of the model, and the pseudo-coefficient of determination (R 2) of Nagelkerke 36 was calculated to assess the model’s explanatory power. The adjusted mean of MMDA was determined using the package emmeans 37 to illustrate the seasonal variation of MMDA.
The performance of the cutoff of 4 food groups to predict diet quality per season (MMDA < 50%) or (MMDA ≥ 75%) was evaluated by calculating the area under the curve (AUC) from the receptor efficiency function with the pROC package. 38 An AUC value above 0.5 indicated that the minimum threshold of 4 food groups predicted dietary adequacy, and the closer the AUC value was to 1, the better the prediction. These analyses were conducted globally for the data set and then by AEZ. The AUC values were compared between AEZs using nonparametric test of DeLong. 39 To investigate the possibility of improving the predictive power of the indicator of the minimum number of food groups for an adequate diet, sensitivity (the proportion of children correctly identified as having a high MMDA value) and specificity (the proportion of children correctly identified as having a low MMDA value) were determined for each of the possible IYC-DDS-7 values per season.
Results
Description of the Subsample at the First Contact
As can be seen in Table 1, there were practically as many boys as girls (48%), and the average age of the children surveyed was 12 months, with the 12- to 23-month-old representing in greater proportion (44%). Almost all the children were breastfed (98%). The average age of mothers was about 28 years. Most mothers were illiterate with no education (66%), and only 13% and less than 1% were with high school and university levels, respectively. The number of children younger than 5 years living in the households was approximately 2.
Characteristics of the Subsample at the First Contact.
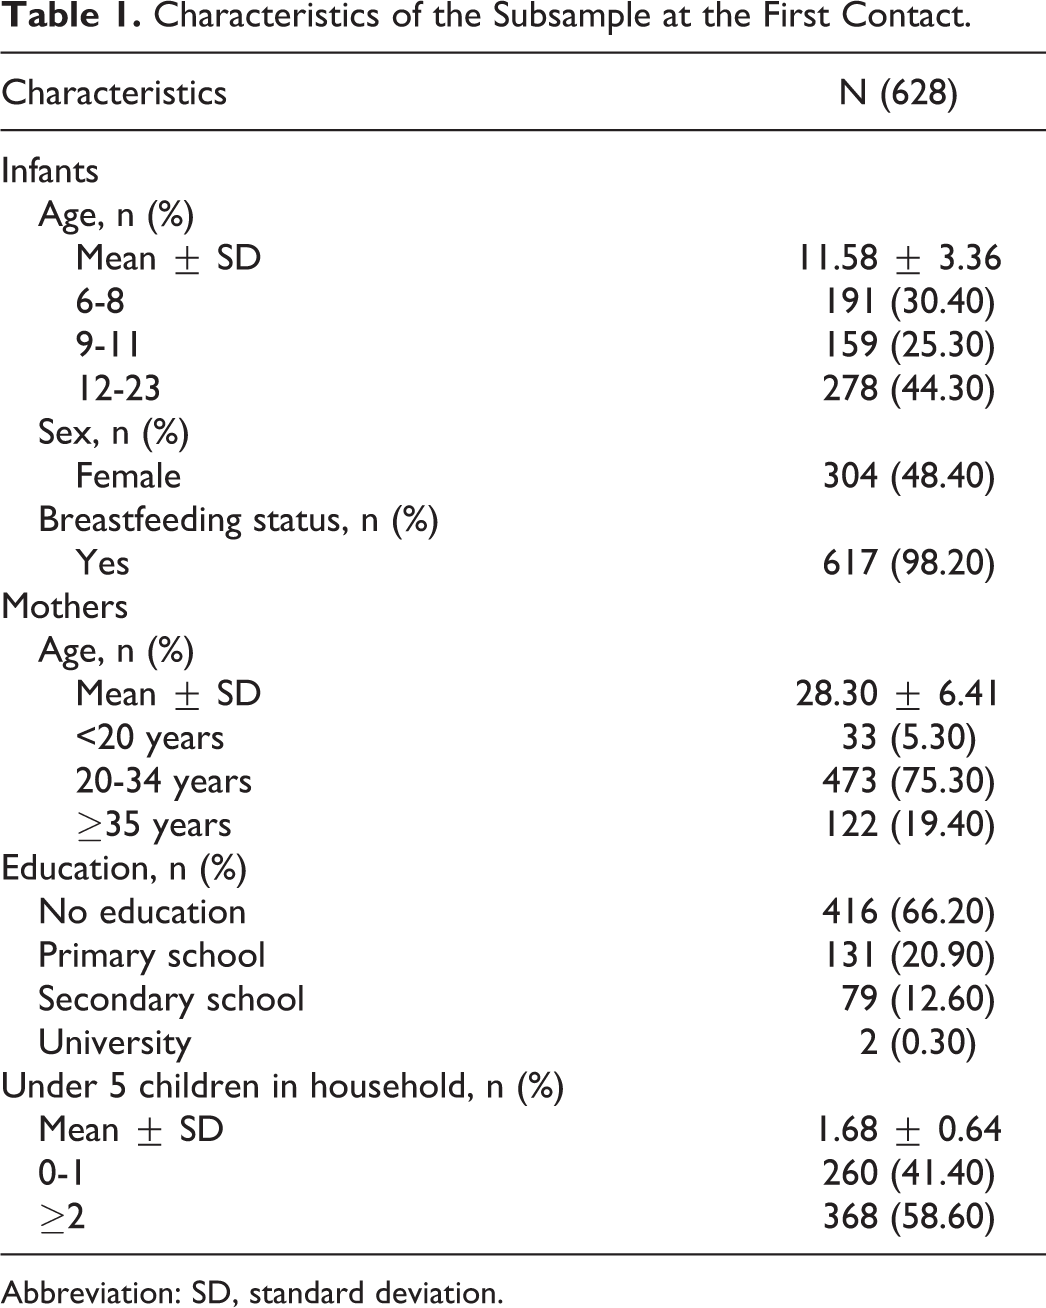
Abbreviation: SD, standard deviation.
Energy and Nutrients Intakes From Complementary Foods Across Seasons
Intakes of energy and micronutrients differed considerably among seasons. Especially, energy, proteins, vitamin A, riboflavin, niacin, and iron intakes were higher during LS than PS. In contrast, vitamin B6, vitamin B12, folate, vitamin C, zinc, and calcium intakes were lower during LS than PS (Table 2).
Energy and Nutrient Intakes of Infants and Young Children Aged 6 to 23 Months in Houéyogbé and Bopa’s Communes During Plenty and Lean Seasons.a
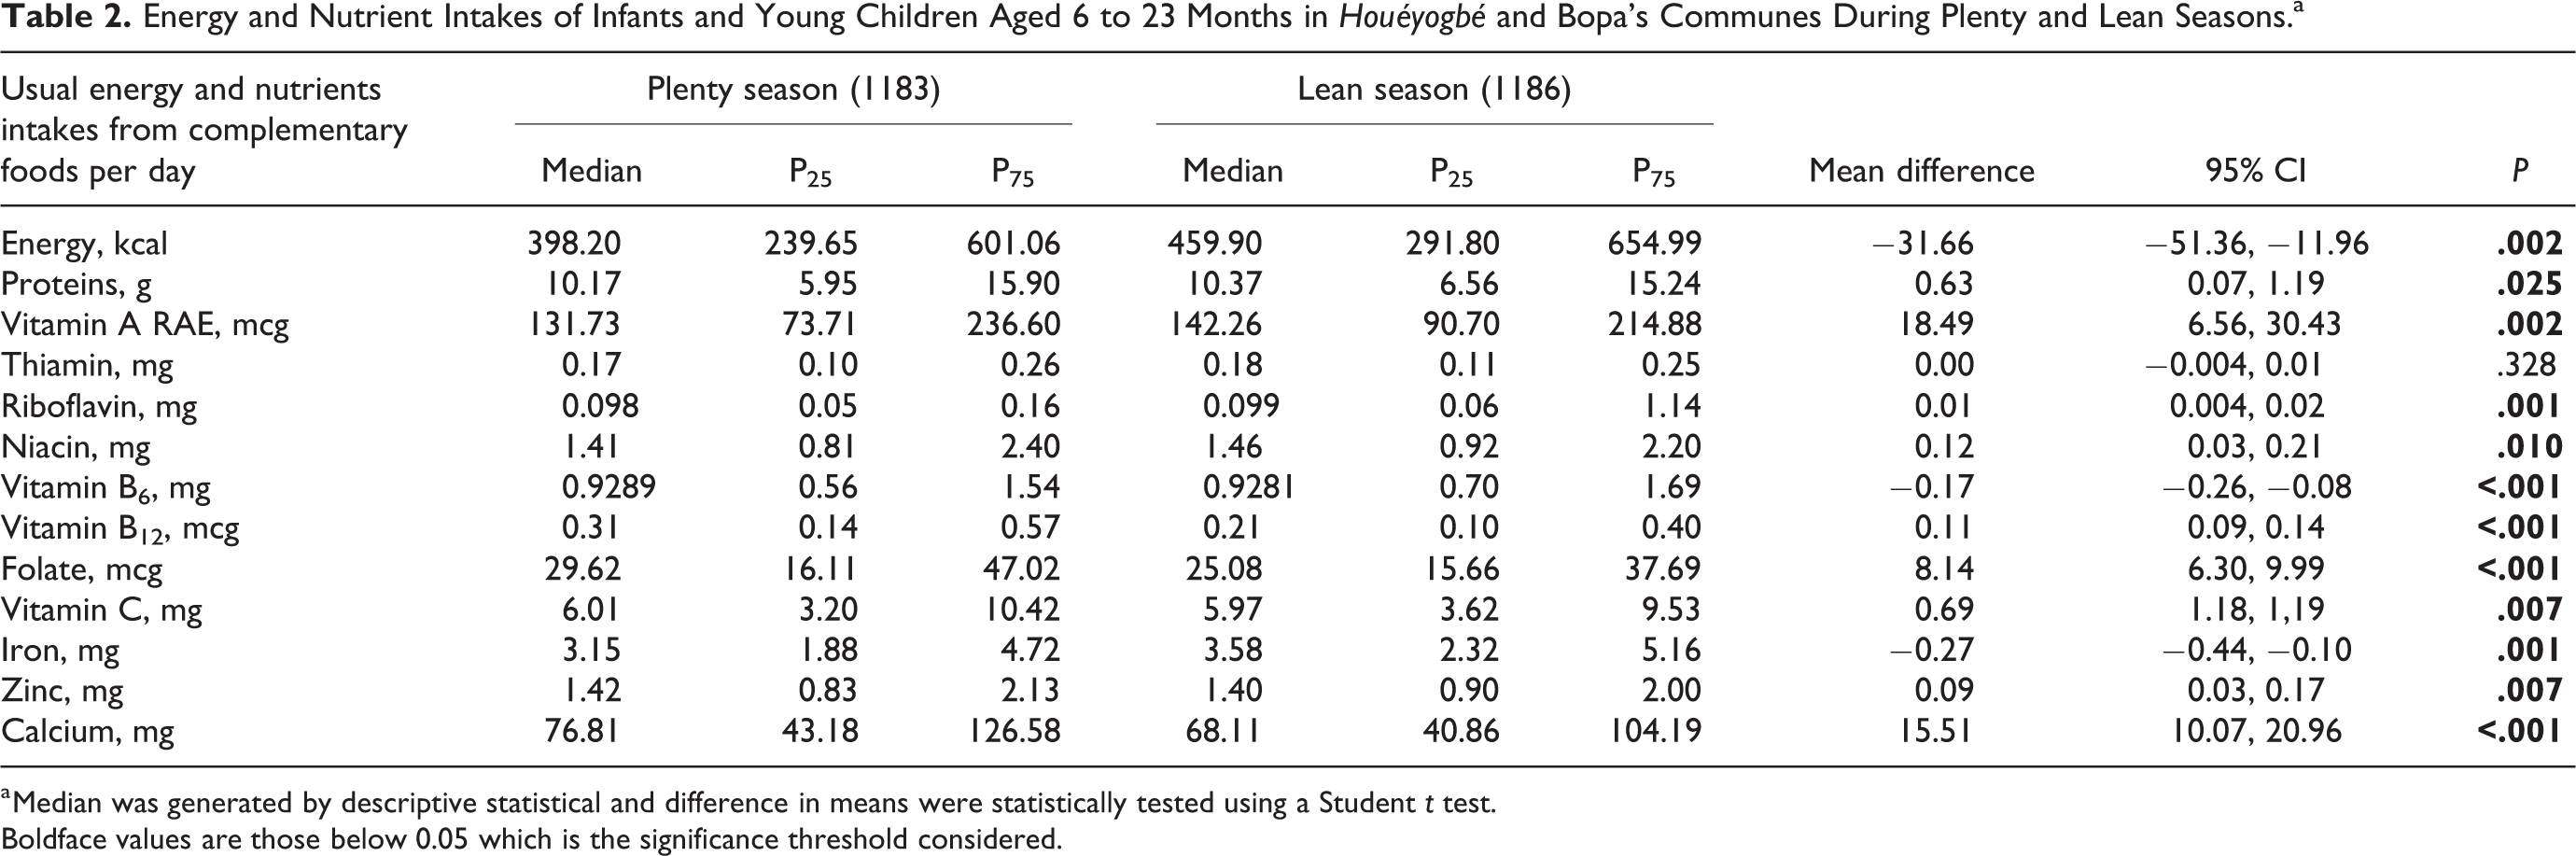
a Median was generated by descriptive statistical and difference in means were statistically tested using a Student t test.
Boldface values are those below 0.05 which is the significance threshold considered.
Diet Diversity and Quality
Tables 3 and 4 present dietary adequacy indicators across seasons. Food consumption varied among IYC-DDS-7. For both seasons, children consumed mostly cereals, roots, and tubers. Beyond this food group, IYC-DDS-7 increased mainly due to fruits, vegetables, nuts, and legumes. Most children with IYC-DDS-7 scores of 3 or higher consumed flesh and vitamin-rich foods. Eggs and dairy products were the least consumed food groups (Table 3). Overall, the children’s diet was inadequate in micronutrients, regardless of seasons regarding both indicators. Indeed, the MMDA was 56.9% ± 12.8 versus 61.9% ± 8.6% and the IYC-DDS-7 was 3.43 ± 1.5 versus 3.77 ± 1.0, respectively, in PS and LS. These indicators showed that the children’s diet adequacy in micronutrients was higher in the LS than in the PS. Some disparities in micronutrient densities were noted according to micronutrients. For example, vitamins A, B6, B12, and C presented adequate micronutrient densities. The micronutrient densities of adequacy for thiamin, riboflavin, niacin, vitamin B6, vitamin B12, folate, vitamin C, zinc, and calcium were higher in the LS compared to the PS. Only iron presented MDA that was higher in PS than in the LS (Table 4).
Distribution of Food Group Consumption According to Dietary Diversity Score and Stratified by Season.
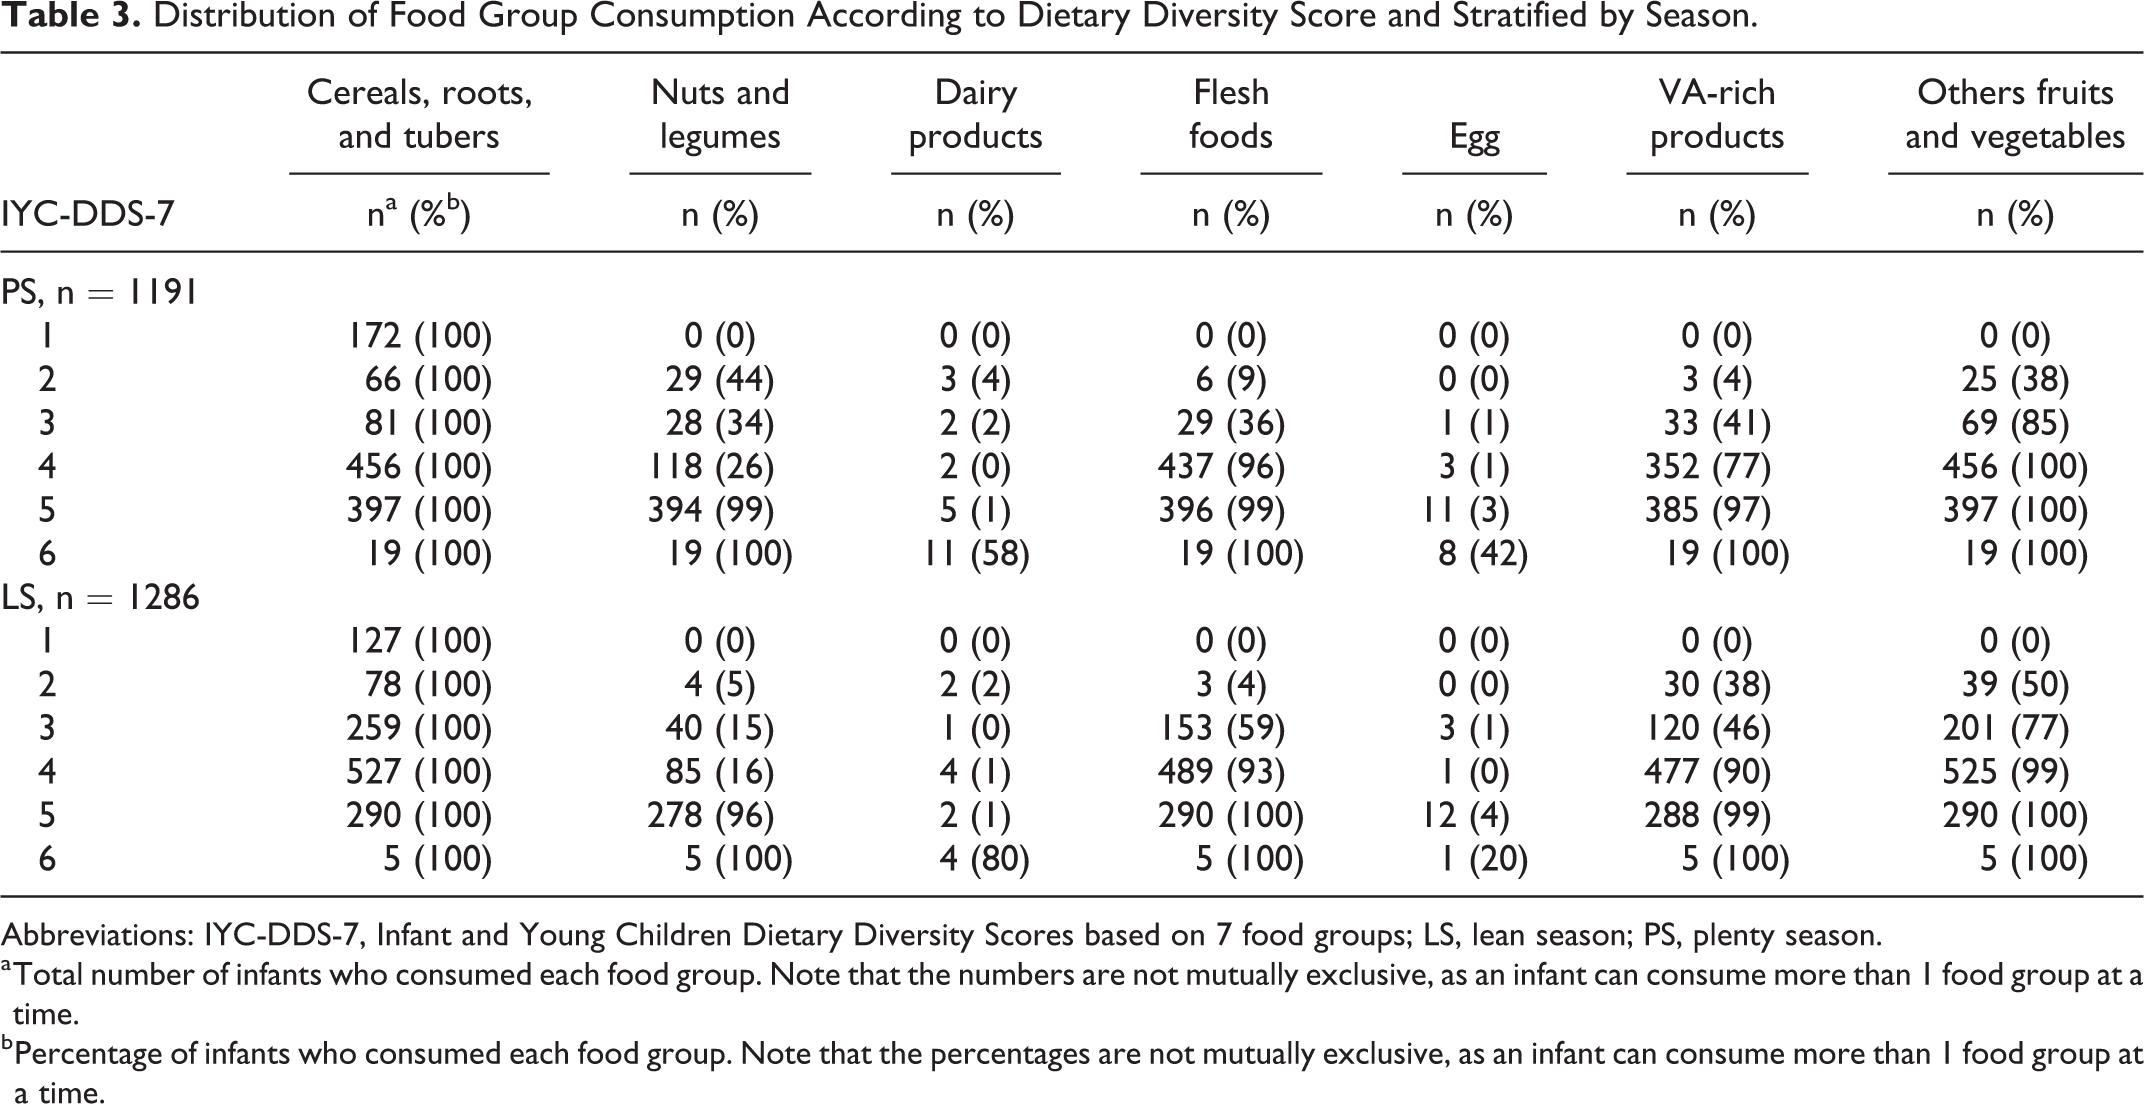
Abbreviations: IYC-DDS-7, Infant and Young Children Dietary Diversity Scores based on 7 food groups; LS, lean season; PS, plenty season.
a Total number of infants who consumed each food group. Note that the numbers are not mutually exclusive, as an infant can consume more than 1 food group at a time.
b Percentage of infants who consumed each food group. Note that the percentages are not mutually exclusive, as an infant can consume more than 1 food group at a time.
Mean Micronutrient Density Adequacy and Dietary Diversity Score of Infants and Young Children Aged 6 to 23 Months Across Seasons.a
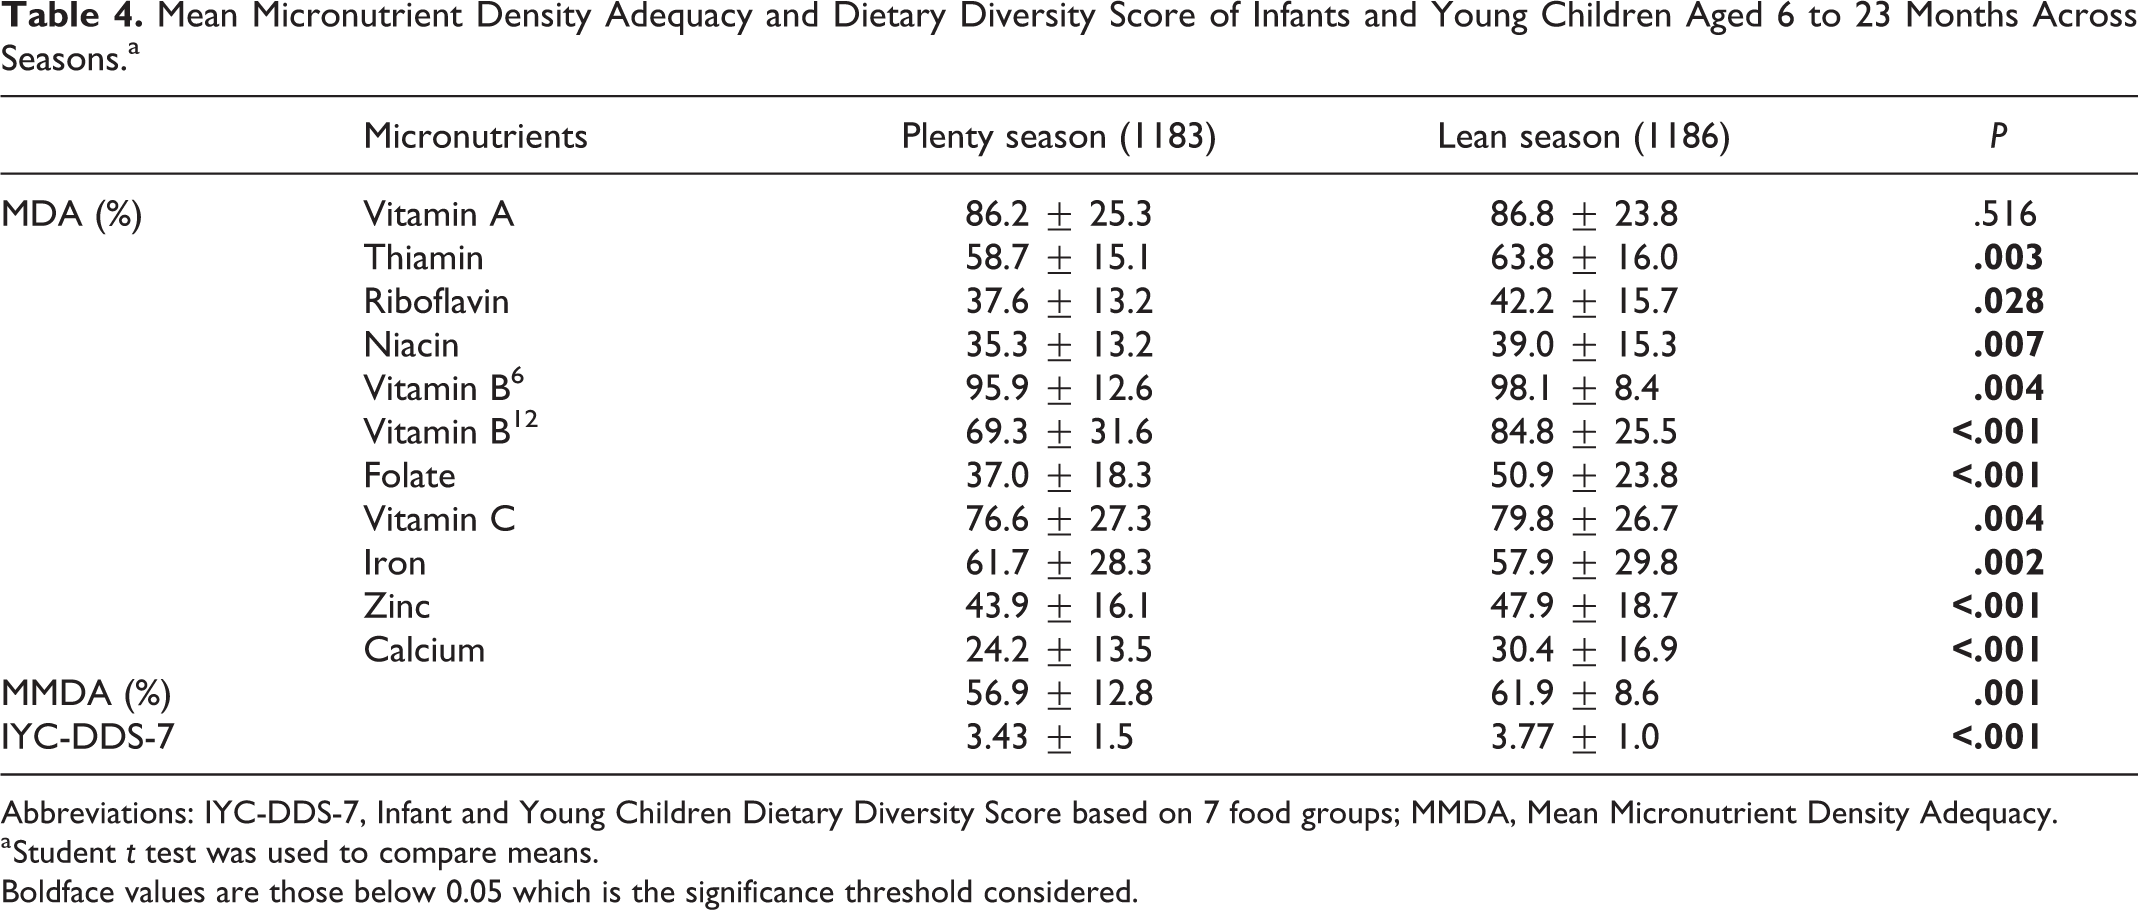
Abbreviations: IYC-DDS-7, Infant and Young Children Dietary Diversity Score based on 7 food groups; MMDA, Mean Micronutrient Density Adequacy.
a Student t test was used to compare means.
Boldface values are those below 0.05 which is the significance threshold considered.
Association Between IYC-DDS-7 and MMDA
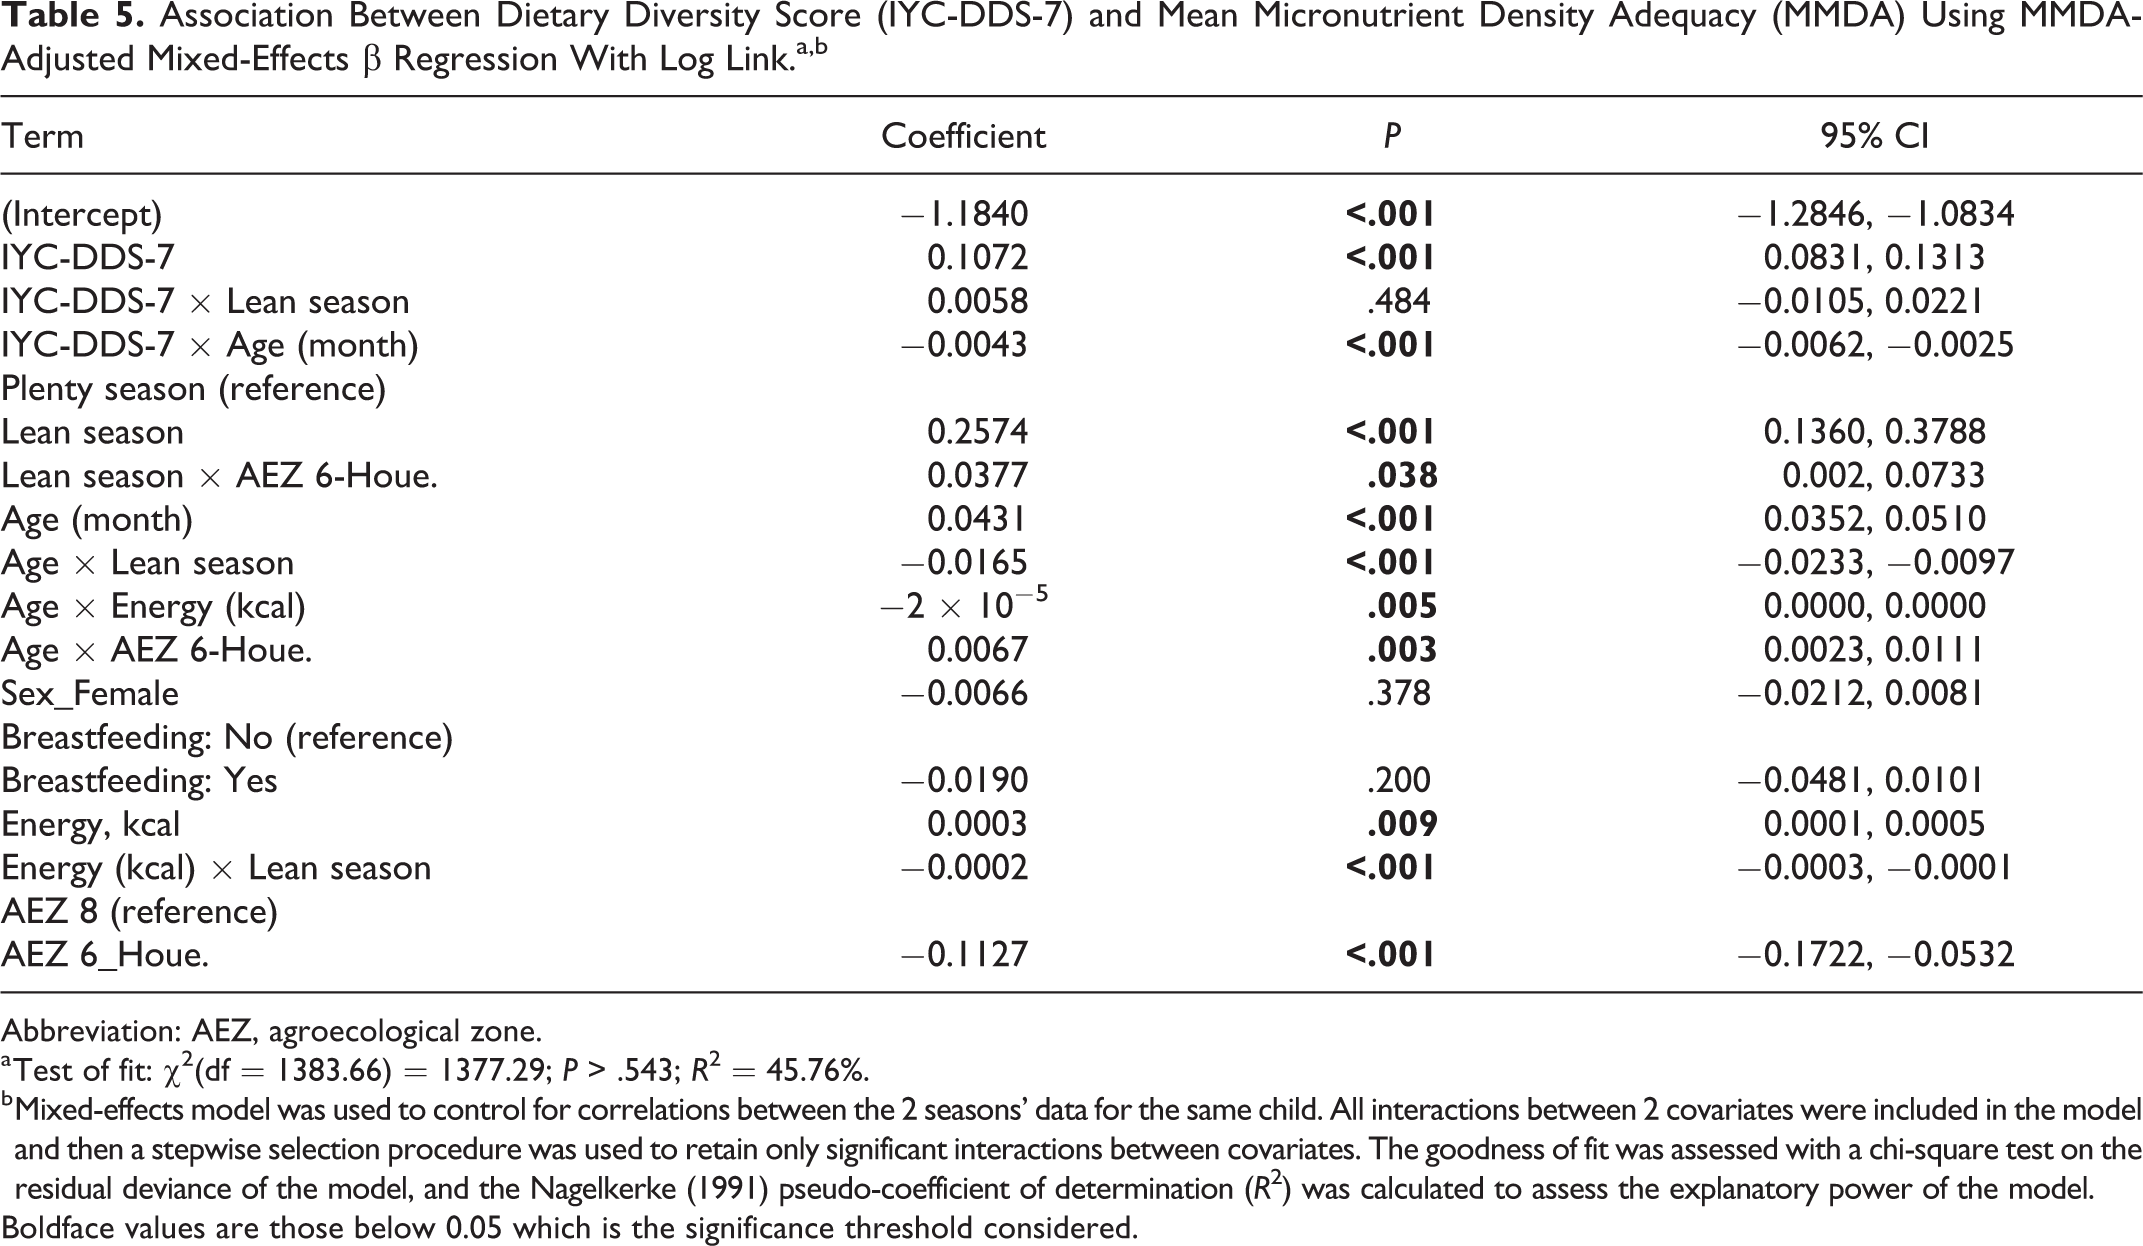
Based on mixed-effects regression, season, IYC-DDS-7, sex, age, breastfeeding status, AEZ, and energy intake account for 45.76% of the variance in MMDA (Table 5). For a 1-point increase in the IYC-DDS-7 score, MMDA increased by an average of 10.7% (CI, 8.3%-13.1%; P < .001). The IYC-DDS-7 was not affected by season (P = .484), but it decreased with age by 0.4% (CI, 0.2%-0.6%) for an increase of 1 month in age. In addition, MMDA was 25.7% (CI, 13.6%-37.9%) higher in LS than in PS and 11.3% (CI, 5.3%-17.2%) lower in AEZ 6 than in AEZ 8 (P ≤ .05). The effect of age on MMDA was marginal, with an average increase of 4.3% (3.5%-5.1%) per month of age. The age effect was 0.7% (CI, 0.2%-1.1%) higher in AEZ 6 than in AEZ 8 but decreased by 1.7% (CI, 1.0%-2.3%) in LS compared to PS. The MMDA was 3.8% (CI, 0.2%-7.3%) higher in LS than in PS in AEZ 6. Energy intake also affected MMDA, with an average increase of 0.03% (CI, 0.01%-0.05%) for 1 additional kcal. However, MMDA was not affected by gender or breastfeeding status (P > .05).
Association Between Dietary Diversity Score (IYC-DDS-7) and Mean Micronutrient Density Adequacy (MMDA) Using MMDA-Adjusted Mixed-Effects β Regression With Log Link.a,b
Abbreviation: AEZ, agroecological zone.
a Test of fit: χ2(df = 1383.66) = 1377.29; P > .543; R 2 = 45.76%.
b Mixed-effects model was used to control for correlations between the 2 seasons’ data for the same child. All interactions between 2 covariates were included in the model and then a stepwise selection procedure was used to retain only significant interactions between covariates. The goodness of fit was assessed with a chi-square test on the residual deviance of the model, and the Nagelkerke (1991) pseudo-coefficient of determination (R 2) was calculated to assess the explanatory power of the model.
Boldface values are those below 0.05 which is the significance threshold considered.
The marginal mean of MMDA after adjusting the mixed-effects regression model for energy intake, breastfeeding status, age, and sex of the child is presented in Figure 1 by season and AEZ. We noted that MMDA generally increased with the IYC-DDS-7 score. However, the IYC-DDS-7 score 4 corresponds to around MMDA of 62%, regardless of the AEZ and season.
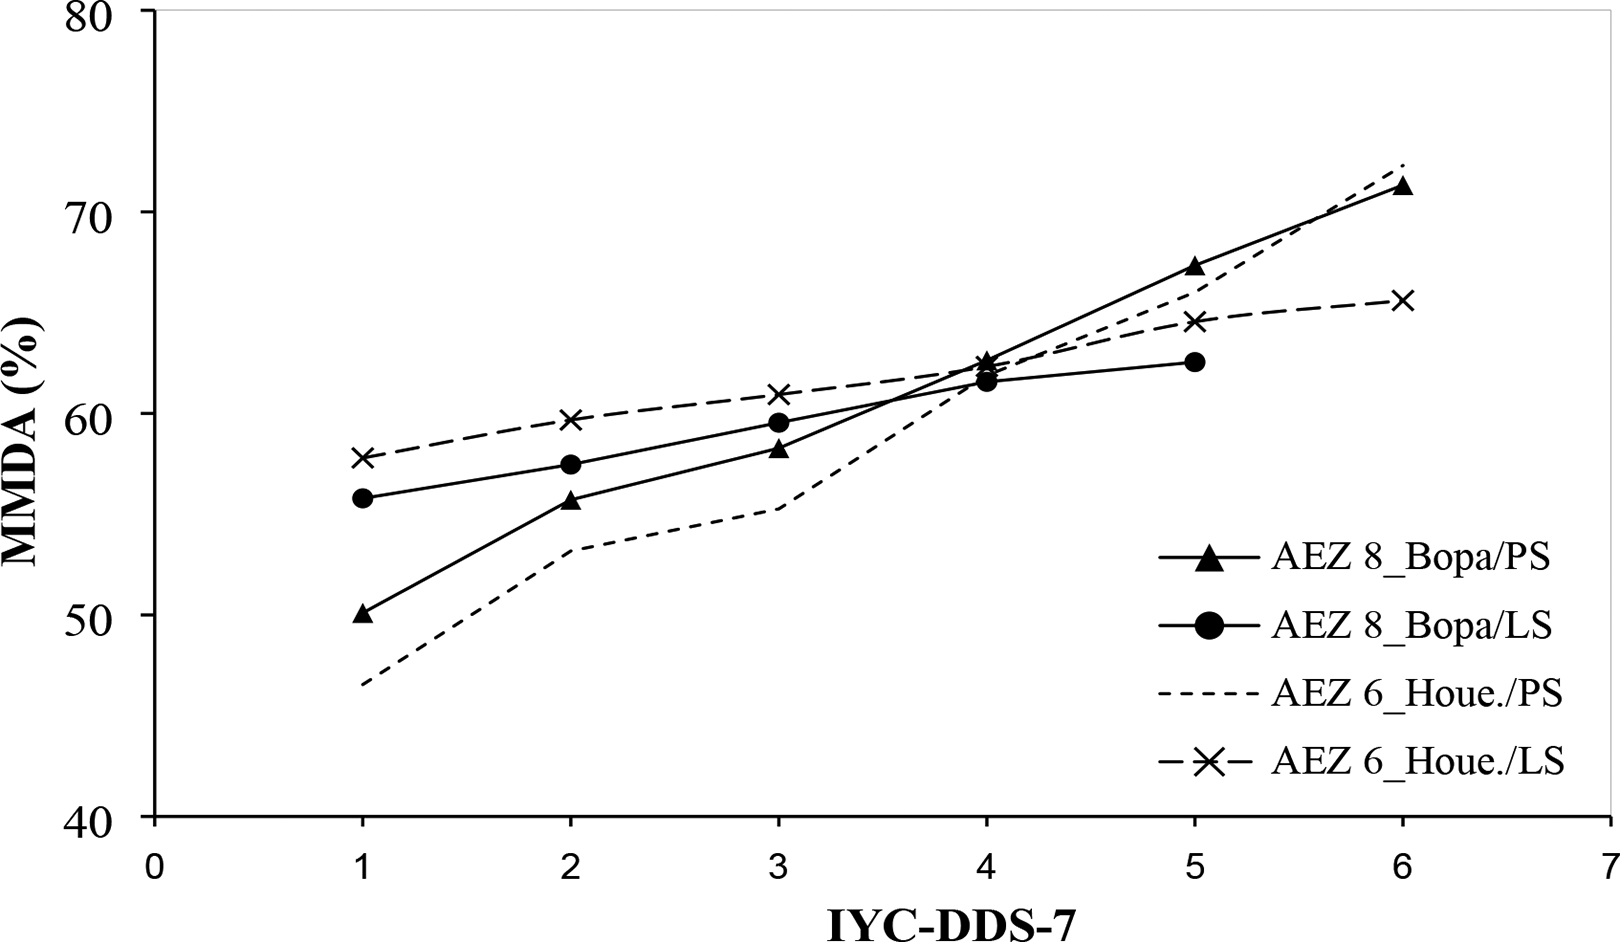
Results of mixed-effects β regression with log link adjusted for marginal mean of mean micronutrient density adequacy per season per agroecological zone. PS indicates plenty season; LS = lean season.
Indicator Performance and Identification of Cutoffs
The calculated AUC values for each season are presented in Table 6. The minimum threshold of the 4 food groups predicts children’s diet inadequacy (MMDA < 50%), with AUC values > 50% regardless of the season and AEZ. Although the AUC did not differ between AEZs, it decreased from 80.8% (CI, 77.0%-84.6%) in PS to 68.6% (CI, 61.8%-75.4%) in LS. The minimum threshold of 4 food groups was a good indicator of children with an adequate micronutrient diet in PS (64.8%), with similar results in both zones (64.5%). However, regardless of the AEZ, the minimum threshold of 4 food groups was not a good indicator of micronutrient adequacy in LS (AUC = 48.8%; CI, 40.2%-57.3%).
Receiver Efficiency Curve Analysis: AUC Values and Confidence Intervals (CI) Calculated by Season, Globally and by Agroecological Zone.
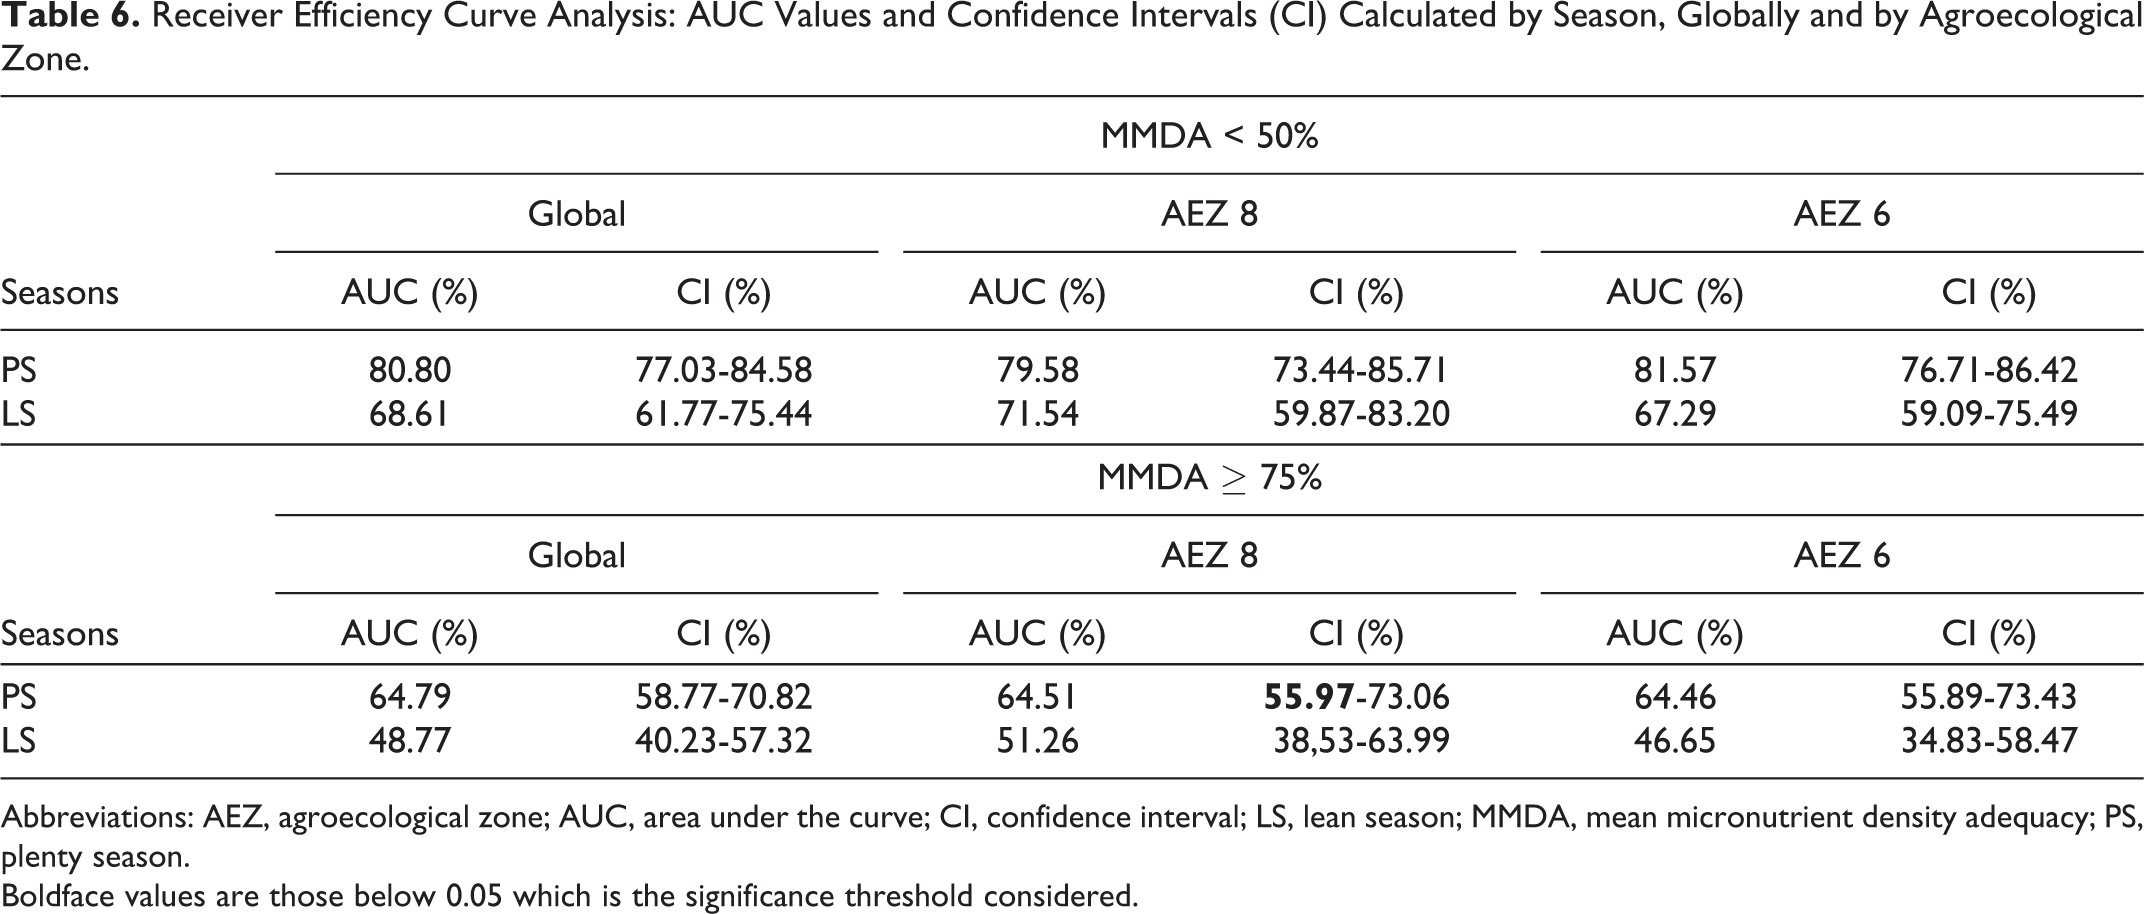
Abbreviations: AEZ, agroecological zone; AUC, area under the curve; CI, confidence interval; LS, lean season; MMDA, mean micronutrient density adequacy; PS, plenty season.
Boldface values are those below 0.05 which is the significance threshold considered.
The sensitivity and specificity curves of the minimum threshold of 4 food groups are presented by season (Figure 2). Based on the results of PS, the minimum threshold of 4 food groups predicted an inadequate diet, with a sensitivity of 76% and a specificity of 75% (MMDA < 50%; Figure 2A). According to LS, an MMDA of 50% corresponds to a minimum threshold of 4 food groups, with a sensitivity of 61% and a specificity of 70%. On the other hand, for the prediction of an adequate diet (MMDA ≥ 75%; Figure 2B), the rejection of the minimum threshold of 4 food groups (Table 3, AUC = 48.8%) was due to low specificities values (38% in PS and 33% in LS), while the sensitivity values were high (87% in PS and 67% in LS).
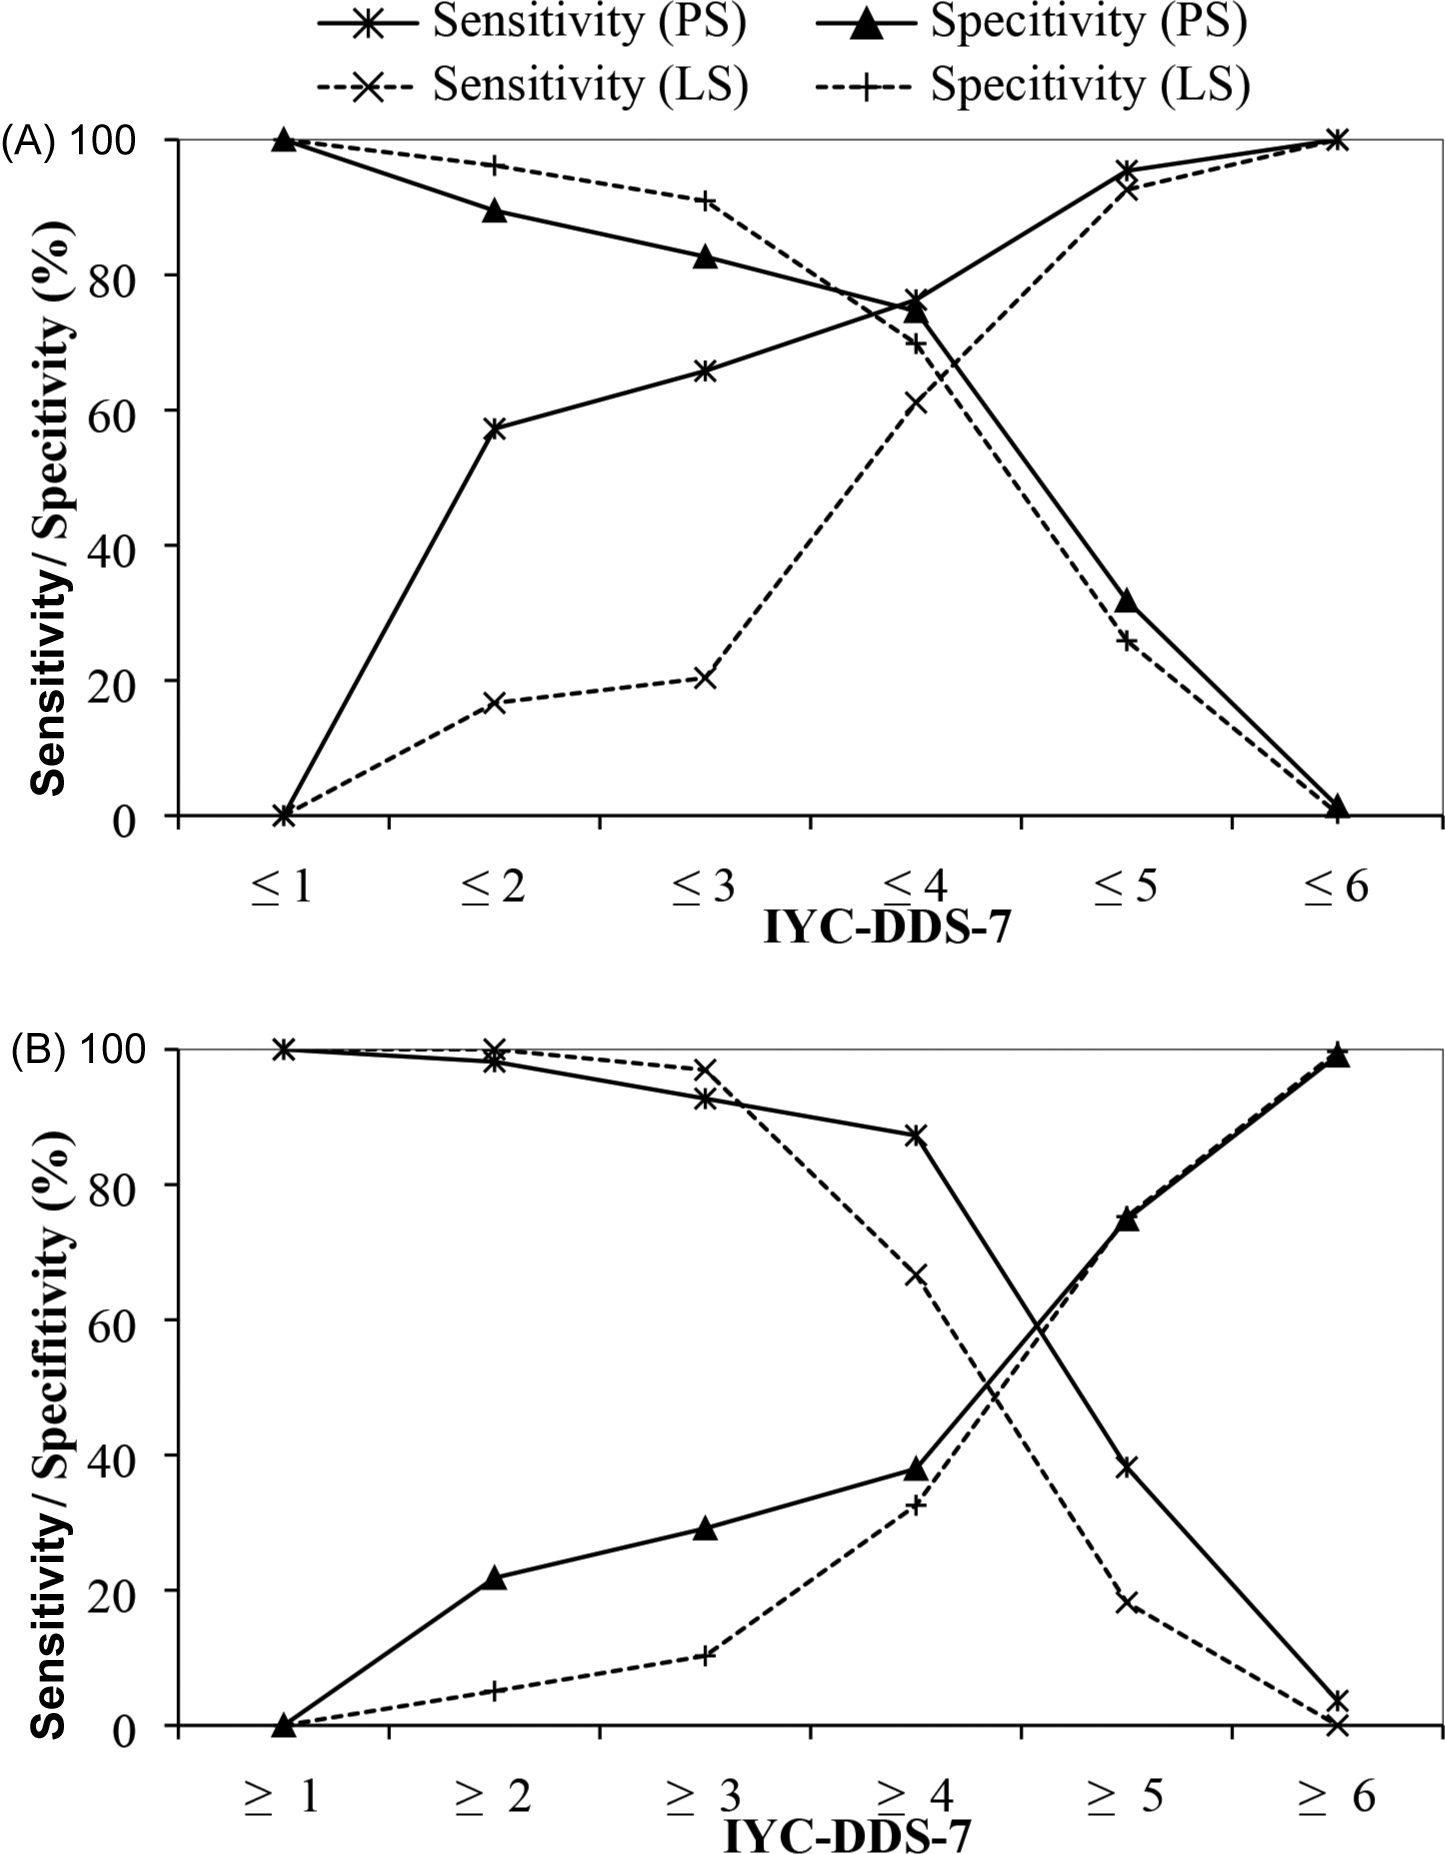
Sensitivity and specificity of the dietary diversity score (IYC-DDS-7) to predict low nutrient intake, that is, mean micronutrient density adequacy (MMDA) < 50% (A) or high nutrient intakes, that is, MMDA ≥ 75% (B) among children aged 6 to 23 months in Houéyogbé and Bopa’s communes (rural southern Benin) during plenty season (October to December 2013) and lean season (May to July 2014). IYC-DDS indicates Infant and Young Children Dietary Diversity Score; PS = plenty season; LS = lean season; X axe: Dietary diversity scores of infant and young children based on 7 food groups; Y axe: Sensitivity and specificity values associated with IYC-DDS-7. (A) Sensitivity indicates the percentage of children having “low” MMDA who are identified as such by IYC-DDS-7; specificity indicates the percentage of children who are above the cutoff for “low” MMDA and are correctly identified as such by IYC-DDS-7. (B) Sensitivity indicates the percentage of children having “high” MMDA who are identified as such by IYC-DDS-7; specificity indicates the percentage of children who are below the cutoff for “high” MMDA and are correctly identified as such by IYC-DDS-7.
Discussion
Our sample’s infants and young children had inadequate micronutrient intake with a particularly low micronutrient density adequacy for key micronutrients. In particular, energy, proteins, vitamin A, riboflavin, niacin, and iron intakes were higher during the LS than the PS. In contrast, vitamin B6, vitamin B12, folate, vitamin C, zinc, and calcium intakes were lower during LS than PS. The IYC-DDS-7 was significantly associated with MMDA and predicted MMDA equally well for infants and young children. However, the proposed IYC-DDS-7 cutoff of ≤4 food groups accurately identified children with MMDA < 50%, as shown by the greater balance achieved in sensitivity and specificity.
Daily energy, protein, niacin, riboflavin, and iron intakes significantly increased from PS to LS. Energy and protein intakes can be partly explained because cereals can be stored and used almost all year round. In addition, during the LS, gari (cassava) is often consumed as a coping strategy, and people turn to natural resources, especially leafy vegetables and fruits, rich in micronutrients (vitamins, iron, niacin, and riboflavin). Our findings are similar to those of Amoussa, 22 who reported a decrease in daily vitamin A intake from LS to PS. In contrast, Alladayè et al 19 found a reduction in daily calories, protein, and iron from PS to LS. The difference can be explained by food availability in households and coping with lean times. As this study shows, seasonal variations are not necessarily synonymous with a reduction in nutritional intake, but they could lead to a change in diet to maintain intake levels. Thus, seasonal variations in nutrient intakes correspond to seasonal variations in food consumption, as documented in Burkina Faso. 40,41 However, according to Mitchikpè et al 42 energy and nutrient intakes among rural Beninese school-aged children were not seasonal, probably because of household adaptation strategies. 43
The MMDA and IYC-DDS-7 results for the participating children were suboptimal regardless of the season, suggesting monotonous diets and inadequate intake of micronutrients. This finding could be due to the high rate of malnutrition in Benin, specifically food insecurity in the study area. However, these indicators show seasonal variations, with a significant increase from the PS to the LS. The fact that a child might consume a variety of foods from different groups due to the food scarcity period where food choice is not strict could explain this trend. This could be explained also by different strategies households developed to cope with food scarcity. Similar results were found previously in the preharvest season as opposed to the postharvest season for dietary diversity among 6- to 23-month-old children. 16,44,45 Like in Burkina Faso 40 and Nigeria, 46 seasonal variations affected the consumption of fresh fruit and/or vegetables and the mean DDS, primarily because of consumption differences. The children’s age may also explain these results since they were more likely to be given a variety of foods during the LS, emphasizing the importance of tracking IYC-DDS-7 across the year to identify seasonal dietary changes. However, our results contradict those obtained by Waswa et al in Western Kenya, where seasonality did not affect dietary diversity in children aged 6 to 23 months. 18 Nevertheless, they considered the harvest and postharvest seasons, whereas in the present study, the periods of abundance are the harvest of cereals and tubers and the LS coinciding with the planting season.
This study also showed that an IYC-DDS-7 calculated from 7 food groups could predict diet quality expressed in terms of MMDA among infants and young children. In addition, seasonality did not affect the association despite the significant differences in nutrient intakes between periods. In both seasons, the mixed β regression analysis demonstrated a significant association between IYC-DDS-7 and MMDA. Several authors have also demonstrated a similar positive association between DDSs and dietary quality in infants and young children, despite using different scores and regression coefficients. 12,14 -16 For example, Steyn et al 15 used measures of diet quality such as mean adequacy ratios. Kennedy et al 14 estimated adequacy based on estimated average requirements (EAR) and required SDs. Because neither EAR nor SD is available for most micronutrients for infants aged 6 to 23 months, we did not follow this approach.
Finally, in the current study, the minimum dietary diversity (IYC-DDS-7 = 4) classified better the children with low-diet quality (MMDA < 50%). It can, therefore, serve as a proxy indicator for the presence of low MMDA in children. It is partly because specific micronutrient requirements such as iron are so high (particularly in infants aged 1 year) that only 7.7% and 4.8% of children in our sample, respectively, in PS and LS, have achieved MMDA levels of 100% using their usual diet. The same pattern was found by Wondafrash et al, 16 regardless of the season in southwest Ethiopia among infants aged 6 to 12 months. According to these authors, DDSs predict low MMDA, regardless of the season. However, Hjertholm et al 47 observed that infant and young children’s DDSs could be used to predict overall nutrient adequacy during only the preharvest season.
The current study has several strengths and limitations to consider. First, we used regression analyses incorporating all measured covariates to evaluate the performance of IYC-DDS-7 as an indicator of child dietary quality expressed in terms of MMDA. Second, unlike most previous studies, our study used two 24-hour dietary recalls to collect data on quantitative nutrient intake. This method offers a more accurate representation of average intake. Third, we also compiled MMDA based on data availability for 11 micronutrients that are mostly of public health importance. However, we did not estimate individual milk intake but instead used the age-adjusted mean intake, as proposed in the WHO guideline. 28 For that reason, we used micronutrient densities (micronutrient intakes per 100 kcal) to characterize diet quality. Despite differences in coefficient magnitude, all studies, including ours, found positive correlations between IYC-DDS-7 and diet quality and/or quantity measures, confirming its usefulness in reflecting diet quality. Furthermore, most studies were conducted during a specific season, limiting their external validity. 12,13,33 Finally, as found by Moursi and colleagues, 12 imposing a 10-g minimum requirement on food groups could improve correlations between MMDA and IYC-DDS-7, but the present study did not address this aspect.
Conclusions
The majority of children had poor diets and low intakes of key micronutrients, regardless of the season. This study also showed that dietary diversity and micronutrient density adequacy are positively associated, and this relationship remained stable over seasons. Furthermore, IYC-DDS-7 score 4 is better at identifying children with low micronutrient adequacy than those with high adequacy. Thus, in rural areas where resources are limited, the IYC-DDS-7 could indicate micronutrient intake adequacy, irrespective of the agricultural seasons that influence food availability throughout the year. While results from 1 area should not be used to make universal indicators, this study illustrates the tradeoffs and outcomes relevant to this area. However, the current cutoff of 4 food groups for the minimum dietary diversity score (IYC-DDS-7) indicator requires further validation in other settings to determine the accuracy of its use in assessing dietary quality among infants and young children and during agricultural seasons.
Footnotes
Declaration of Conflicting Interests
The author(s) declared no potential conflicts of interest with respect to the research, authorship, and/or publication of this article.
Funding
The author(s) received no financial support for the research, authorship, and/or publication of this article.