
Abstract
Background:
Evidence on effectiveness of women’s empowerment (WE) to reduce undernutrition is limited in sub-Sahara Africa, and few studies incorporate multidimensional measures of WE.
Objective:
To examine whether a WE status, in sum and across leadership, decision-making, mobility, economic security, male involvement in housework, and nonfamily group domains, is associated with women and their children nutritional status in Kalalé district of northern Benin.
Methods:
Data were obtained from the 2014 Solar Market Garden baseline study: 767 paired reproductive-age women aged 15 to 49 years and children 6 to 59 months old. Exploratory principal component (cross-validate with confirmatory) factor analysis was first conducted to identify the structure of empowerment. Then, using a new survey-based index, regression analysis was conducted to examine associations between WE measures and maternal dietary diversity score (DDS) and body mass index (BMI), as well as their child’s DDS, height-for-age z score (HAZ), weight-for-height z score (WHZ), and weight-for-age z score (WAZ).
Results:
Positive associations were observed between women’s composite empowerment, leadership, maternal DDS and BMI, and female child’s DDS. However, opposite signs were found between economic security and child’s DDS. Mobility was positively associated with female children’s WHZ and male children’s HAZ and WAZ, while decision-making was correlated with male child’s WHZ and female children’s WAZ.
Conclusions:
Women’s empowerment can be associated with undernutrition. Efforts to improve nutrition may benefit from empowerment initiatives that promote women’s self-confidence and decision-making in Benin. However, additional qualitative and longitudinal research may enhance understanding of WE in the present area.
Keywords
Introduction
Women empowerment (WE) is increasingly viewed as an important strategy to reduce maternal and child undernutrition, 1 –3 which continues to be a major health burden in low- and middle-income countries causing 3.5 million preventable maternal and child deaths, 35% of the disease burden in children younger than 5 years, and 11% of total global disability-adjusted life years. 4,5 Global data show that one of the worst affected regions is sub-Saharan Africa (SSA), where about 20% of children are malnourished. 6,7 Benin is no exception, as the prevalence of stunting, wasting, and underweight was 37%, 5%, and 17%, respectively, among children aged 6 to 59 months in the 2006 Benin Demographic and Health Survey (DHS), 8 while 9% of women had chronic energy deficiency in the 2012 DHS. 9 Greater rates were observed in rural areas where stunting was found in 40% of children, underweight in 19%, and wasting in 5%, while 10% of women had chronic energy deficiency. 8,9 Additionally, Beninese women and children have a limited dietary diversity score (DDS), with diets predominately composed of starchy staples with little or no animal products and few fresh fruits and vegetables. 10,11 Government, United Nation agencies, and nongovernmental organizations in Benin recognize that the state of maternal and child undernutrition requires multiple types of interventions. 12
However, women’s low empowerment status in Benin can hinder the improvement in women’s and children’s undernutrition. Indeed, although females accounted for 47% of the economically active population in 2014, 13 social and civil legislation is strongly influenced by tradition and customs, as women continue to be required to seek their husband’s authorization in certain areas such as family planning or health services. 14 Rural women provided labor to the families’ commercial plots, were responsible for household food production and processing, and also had to work in the cooperative structures set up by the state in addition to their household tasks. 14 In a more recent study of productivity differences by gender in central Benin, researchers noted that female rice farmers are particularly discriminated against with regard to access to land and equipment, resulting in significant negative impacts on their productivity and income. 15 As in other areas of West Africa, women also have the responsibility of caring for children and preparing food for the household, 16 but they may be vulnerable to food insecurity owing to unequal intrahousehold food distribution and their willingness to forego meals in favor of children during times of scarcity. 17 Finally, no study to date has examined links between women’s empowerment and nutrition in Benin.
In addition, the evidence backing the effect of women’s empowerment on maternal and child undernutrition is inconsistent. 18 Using the Women’s Empowerment in Agriculture Index (WEAI), Malapit et al 19 reported positive and significant association between women’s group (WG) membership, control over income, overall empowerment, and women’s health (as measured by body mass index [BMI] and DDS) in Nepal. However, in Ghana, women’s aggregate empowerment and participation in credit decisions were positively correlated with women’s DDS, but not BMI. 20 Mixed findings were also observed between women’s empowerment and child anthropometry. Moestue et al 21 found a positive association between maternal involvement in social groups and length-for-age z score of 1-year-old children, but De Silva and Harpham 22 showed a negative association in 6- to 18-month-old children. Shroff et al 23 found positive association between decision-making and child weight-for-age z score (WAZ), but Begum and Sen’s 24 analysis of Bangladesh DHS data did not reveal any significant associations. Therefore, information about which domains of WE are associated with nutritional status is limited, 20 and this lack of knowledge constrains the set of policy options that can be used to empower women and improve nutrition.
In addition to a limited set of studies in SSA, examinations of the effects of WE on nutrition outcomes are constrained due to interstudy differences in population characteristics, settings, or methods/conceptualizations of WE. 25 –27 For example, despite recognition of the complex, multidimensional, and culturally defined nature and influence of empowerment on nutrition, 20,26,28,29 only a few studies considered the multidimensional structure of empowerment domains in Africa or examined the varied relationships between each measure of WE and maternal and child nutrition status. 30,31 Furthermore, in 2012, the International Food Policy Research Institute developed WEAI constructed from 5 prespecified domains of empowerment, 32 which may not be equally relevant in all areas. In contrast, in 2015, the United Nations adopted the Sustainable Development Goals (SDG), but the specific indicators for the SDG empowerment targets are largely equality metrics. 33 To address the need for multidimensional and contextual examinations of WE and its influence on maternal and child health outcomes, we draw from the concepts put forward in the WEAI and the SDGs but took an approach more along the lines of the World Bank which gathers indicators, both equity and empowerment related, that can be used in contextually appropriate ways. 34 The aims of this study were therefore to first explore the structure and domains of WE in Kalalé district of northern Benin and then to examine the effects of these constructs on nutritional status of women and their children in the region.
Materials and Methods
Data Sources
Data for this study were obtained from a baseline survey to evaluate the multidimensional impact of the Solar Market Garden (SMG) project in the Kalalé district of northern Benin. 35 –37 The SMG is a community-scale, solar-powered irrigation system used by women’s agricultural groups that had previously been engaged in very small-scale hand-watered horticulture. The broader evaluation aims to quantify the impact of the technology on a range of indicators, including socioeconomic well-being, food security, and WE. The baseline study was conducted between January and March 2014 and was carried out in 16 villages (8 intervention villages and 8 matched-pair comparison villages). Details relevant to the design and conduct of the survey are described in detail elsewhere. 38
Briefly, in each village, all households represented in the WGs were surveyed along with a random sample of a maximum of 30 nonmember households (NWGs) in the same village. Participants included a woman–child pair from each household where the woman was not pregnant but of childbearing age (15-49 years) with her youngest child aged between 6 and 59 months. Overall, 767 households were successfully recruited and assessed. Qualitative 24-hour dietary recalls were analyzed for 765 mothers and 647 children. Anthropometric measurements were collected from 585 mothers, while weight and height were collected from 682 and 609 children, respectively, due to missing or incomplete anthropometric measurements. The study was approved by the National Ethics Committee for Health Research of Benin. Ethical clearance was obtained from the institutional review boards (IRBs) charged with the protection of human research subjects of the University of Arizona. The analysis portion of the project was additionally approved by the IRB of the University of California, San Diego. All women were informed verbally about the aims and procedures of the study, and informed consent was obtained from all women and children, via their mother or guardian approval for these latter, before enrollment.
Dependent Variables
Dietary diversity and anthropometry for women and children were the primary outcomes of the analysis. Information about infant and young child-feeding practices was based on responses of mothers or caretakers of children. Child DDS was defined as the number of food groups consumed in the last 24 hours of 7 food groups: (1) grains, roots, and tubers; (2) legumes and nuts; (3) dairy products; (4) flesh foods; (5) eggs; (6) vitamin A–rich fruits and vegetables; and (7) other fruits and vegetables. 39 The minimum diet diversity for children aged 6 to 23 months was defined as consuming at least 4 food groups of the 7 food groups if breastfed and of 6 food groups (excluding dairy products) if not breastfed in the last 24-hour period. The child nutrition outcomes were based on anthropometric z scores for children younger than 5 years calculated using the 2006 World Health Organization Child Growth Standards. 40 Underweight was defined as WAZ <−2 standard deviation (SD), stunting as height-for-age z scores (HAZ) <−2 SD, and wasting as weight-for-height z scores (WHZ) <−2 SD. For women, the DDS was defined as the number of food groups consumed based on 24-hour recall, namely (1) starchy staples, (2) beans and peas, (3) nuts and seeds, (4) dairy, (5) flesh foods, (6) eggs, (7) vitamin A–rich dark green leafy vegetables, (8) other vitamin A–rich vegetables and fruits, (9) other vegetables, and (10) other fruits. 41 The minimum diet diversity for women was defined as consuming at least 5 food groups of 10. Body mass index was defined as the ratio of weight (in kg) to the square of height (in meters). A woman is considered underweight if her BMI <18.50 kg/m2. 42
Independent Variables
Women’s empowerment measures were derived from a factor analysis conducted with 32 questions about WE (Supplementary Table S1). Specifically, the WE questions were based on work from the World Bank. 43 –47 The work by Malhotra and Schuler 44 emphasized that the main domains for these measures at the household, community, and broader arenas were classified as (1) economic, (2) social and cultural, (3) legal, (4) political, and (5) psychological. Domestic decision-making has focused on (1) finances, (2) social and domestic matters and child-related issues, (3) access or control over resources, and (4) mobility and freedom of movement along with family support including couple interactions. 43 These domains have also been combined to determine the role of development as part of community-level development projects 47 and to set the framework for the United Nations Development Program Global Inequality Index as a measure for WE that includes their role in community decision-making as determined by the proportion of parliamentary seats occupied by females, measures of education, and economic status including their participation to the labor force. 33
Our focus on WE was partially based on the models developed by Petesch et al 48 in which empowerment directly affects health. However, due to the reality that multiple factors affect how empowerment is obtained and used to effect health, our framework utilized the interactions between empowerment, policy, and initial conditions which occur in villages (Figure 1). Since this was a new study, an exploratory principal component factor analysis (EFA) was used to uncover the underlying factor structure of the individual responses and to establish a subset of questions suitable for confirmatory factor analysis (CFA). 49,50 In order to perform EFA and cross-validate with CFA, the baseline data were split into 2 samples using a random uniform distribution, with one used as the training set for EFA and the other used for CFA. Before running the factor analysis, the correlation matrix among the 32 questions was examined to justify undertaking the factor analysis. The χ2 for the Bartlett test of sphericity was significant at P < .01, and the Kaiser-Meyer-Olkin test showed a score of 0.74, indicating that the correlation among the variables was sufficiently strong for a factor analysis.
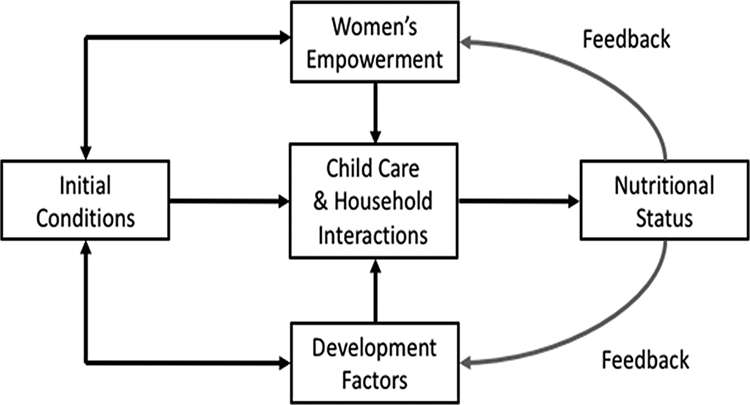
Framework for role of women’s empowerment on nutritional status. Adapted from Petesch et al. 48
The number of factors retained was based on 3 criteria: (1) the Kaiser criterion (eigenvalues >1), (2) inflection point of the screen plot, and (3) interpretability of factors. 51,52 The factors were rotated using a Varimax rotation. Factor loadings indicated the strength and direction of the association between the domains and individual indicator. The derived domains of WE were labeled based on individual indicators having a rotated factor loading >0.6 (Supplementary Table S2 and Figure S1). After reducing the number of questions (n = 22) and establishing our domains using EFA, CFA was performed to determine whether the indicators chosen conformed to the theoretical model. The CFA provided fit indices about the appropriateness of the model based on the covariance structure of the observed data such as root mean square error of approximation (RMSEA), standardized root mean square (SRMS), Bentler comparative fit index (CFI), and Tucker-Lewis index (TLI). 53 These modification indices were used to examine how the model might be adjusted to improve its fit. When error terms of 2 individual indicators were correlated in the same domain, the lower factor loading item was removed, resulting in the final set (n = 16) of included questions (Supplementary Table S3).
Results from the factor analyses identified and confirmed 6 underlying domains from the remaining 16 questions (indicators), and these domains accounted for 74.8% of total variance explained. The goodness of fit of the modified model is superior to that of the proposed model. The RMSEA value was 0.04, the CFI value was 0.98, and the TLI value was 0.97, while the SRMS value was 0.03, suggesting that the fit of the model to the data is acceptable (Supplementary Table S3). Overall, the empowerment domains and their respective indicators were conceptualized as follows: Leadership domain referred to assertiveness and actions indicating a sense of self-security. The domain was examined using 2 questions concerning woman’s sense of self—whether woman feels important or her opinion was respected (1 = yes, always; 0 = no or sometimes) and one question relating to woman’s self-confidence—whether she feels confident to resolve a problem on her own (1 = yes, always; 0 = no or sometimes). Decision-making domain was measured by the woman’s participation in decisions regarding household matters. Three questions were included relating to the number of children, kids’ schooling, and health care (1 = woman alone or joint decision, 0 = other).
Mobility domain was characterized as women’s freedom to leave the home. The 3 mobility scenarios included: goes to local market for purchases, goes to health center or traditional doctor, and goes to visit friends (1 = yes, woman alone, 0 = no or accompanied woman). Economic security domain was examined using 3 questions relating to their capability to afford fruits and vegetables, own clothes, and own beauty (1 = yes; 0 = no). Male involvement in housework domain represents women’s familial and marital roles, including household status in contexts of negotiation. Two questions measured this domain when respondents were asked if they get help from adult males of their household to prepare meals or for the laundry (1 = yes; 0 = no). Nonfamily groups’ domain included participating in an environment for creating a sense of solidarity with other women. This domain was examined using 2 questions relating to participation in labor or political organization groups (1 = yes; 0 = no). Table 1 summarizes the aggregation rules used to code the more empowered response of each question. Most of our binary coding are conservative (“sometimes” and other intermediate answers are coded as zeros or not empowered in that particular domain) as analysis with the alternative coding (“sometimes” and other intermediate answers coded as “empowered”) did not show significant differences.
Women Empowerment Domains, Indicators, and Aggregate Codes.
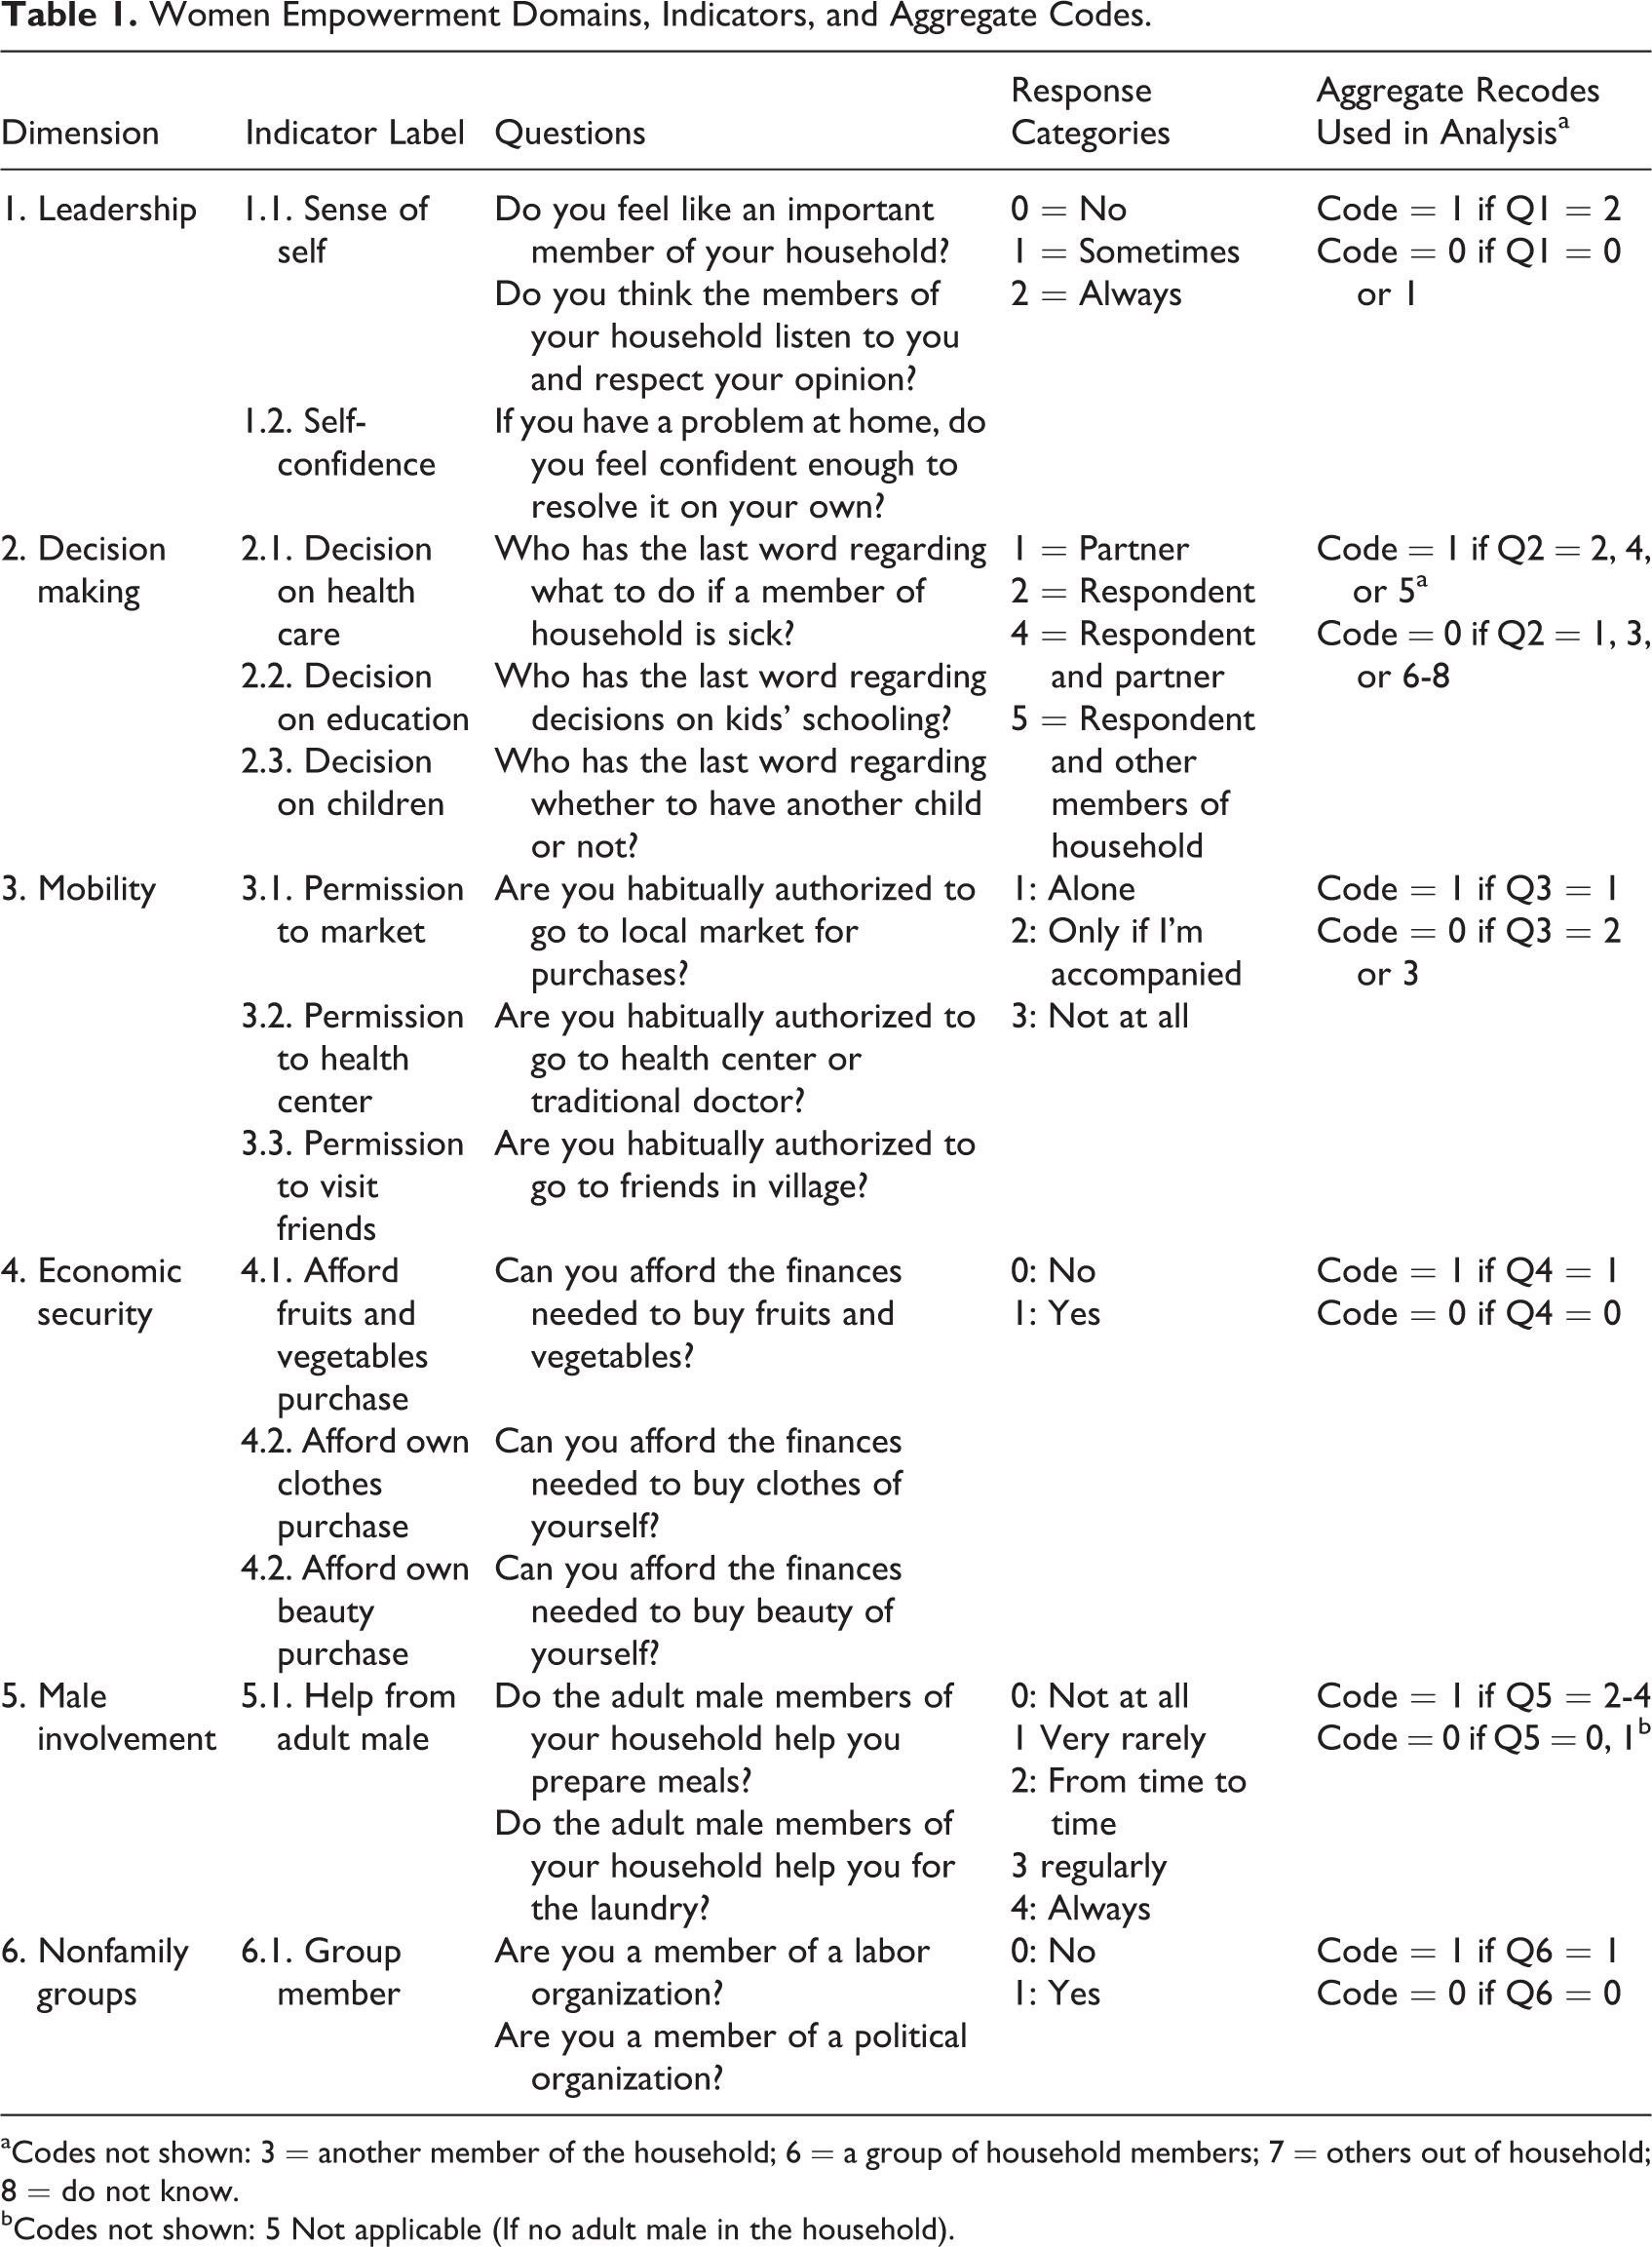
aCodes not shown: 3 = another member of the household; 6 = a group of household members; 7 = others out of household; 8 = do not know.
bCodes not shown: 5 Not applicable (If no adult male in the household).
Control Variables
The potential confounding variables included maternal characteristics (maternal age in years, level of education completed, occupation, and type of group), child characteristics (age in months and sex), and household characteristics (socioeconomic status [SES], self-reported food insecurity in the last 12 months, self-reported access to health care in the last 12 months, production diversity, family size, ethnicity, safe water, electricity connection, village, and frequency of radio listening). Age, family size, and frequency of radio listening were included as continuous variables. Maternal level of education was assessed as categorical—no formal education, primary or less, secondary, university, and more. Maternal occupation was a categorical variable (eg, agricultural/other labor, service/business, and others). Gender of children was examined as a binary variable—male, female. Socioeconomic status was examined using household asset data, such as ownership of consumer items and home attributes. 54 Factor scores derived from the first factor (which explained 27.8% of the variance) were then used to characterize the SES of each household. Households were categorized into SES quartiles based on their individual SES index score. Self-reported food insecurity and access to health care were binary measures defined as a household that was food insecure or health insecure in the last 12 months or not. Ethnicity was a categorical measure (eg, Gando, Boo, Peulh, Boko, Bariba, and others). The production diversity index was based on the household production of 9 food groups: (1) starchy staples; (2) beans, legumes, and nuts; (3) dark green leafy vegetables; (4) vitamin A–rich fruits, vegetables, and tubers; (5) other fruits and vegetables; (6) milk and milk products; (7) eggs; (8) fish; and (10) meat. 19 Type of groups indicated whether the principal female was a member of WG or not.
Data Analysis
Data analysis was conducted in 3 main steps using STATA version 13.1 (Stata Corporation, College Station, Texas). First, descriptive analyses were conducted, and categorical variables were expressed as percentages, while continuous variables were expressed as arithmetic means (standard deviation [SD]). Differences between groups were determined using t test or χ2 test. Second, a composite score of WE was calculated based on the sum of the 16 empowerment indicators with a total possible score ranging from 0 to 16. All domains have a possible score range from 0 to 3, except for male involvement and group membership domains (0-2). Women’s empowerment was categorized into 2 groups: the proportion of women with total scores above the population mean versus those with scores at or below the population mean. These steps were repeated for each of the 6 domains. Third, sequential regression analyses were conducted. The univariate analysis was first conducted to identify the control variables that reached a statistically significant association with maternal and child nutrition outcomes. Next, multiple regression was conducted and included all variables found to be significant at P ≤ .20. The models were estimated in 2 specifications. In the first specification, the total empowerment score was included to isolate the effect of WE. In the second specification, the aggregate WE was decomposed into 6 domains to investigate how each of these domains was associated with maternal and child nutritional status. The variance inflation factor to assess multicollinearity of variables in the models was shown to be below cutoff point of 10. Model fit was assessed though likelihood ratio χ2 test and Wald χ2 test. Significance of standardized coefficients is reported at the 10%, 5%, and 1% probability levels.
Results
Sociodemographic, Dietary, and Anthropometric Characteristics of Participants
Among the children, mean age was 21.6 months (SD 12.5) with a range of 6 to 59 months; 48.9% were male, while 65.4% received vitamin A supplements within the past 6 months (Table 2). The mean child DDS was 3.1 food groups, and 30.8% of children (6-23 months) satisfied the minimum diversity criterion. Overall, 39.8% of children were stunted, 23.6% underweight, and 10.9% of them were wasted. The majority of mothers had no formal education, and half of them were primarily engaged in farming. The mean maternal DDS was 4.5, and 44.7% consumed at least 5 food groups (of 10). About 9% of women had chronic energy deficiency (BMI < 18.5 kg/m2). Analyses of household characteristics revealed an average household size of 7.7 members, with the majority of them as Muslim (92.1%). About 21% of households self-reported food insecurity and 33% self-reported having limited access to health care in the past 12 months. Only 13.2% and 8.2% had access to hygienic latrines and an electricity connection, respectively. The agricultural production diversity was 3.02 (SD 1.5) food groups, and the frequency of listening to a radio was 3.4 (SD 3.1) d/wk.
Sociodemographic, Dietary, and Anthropometric Characteristics of the Study Population.
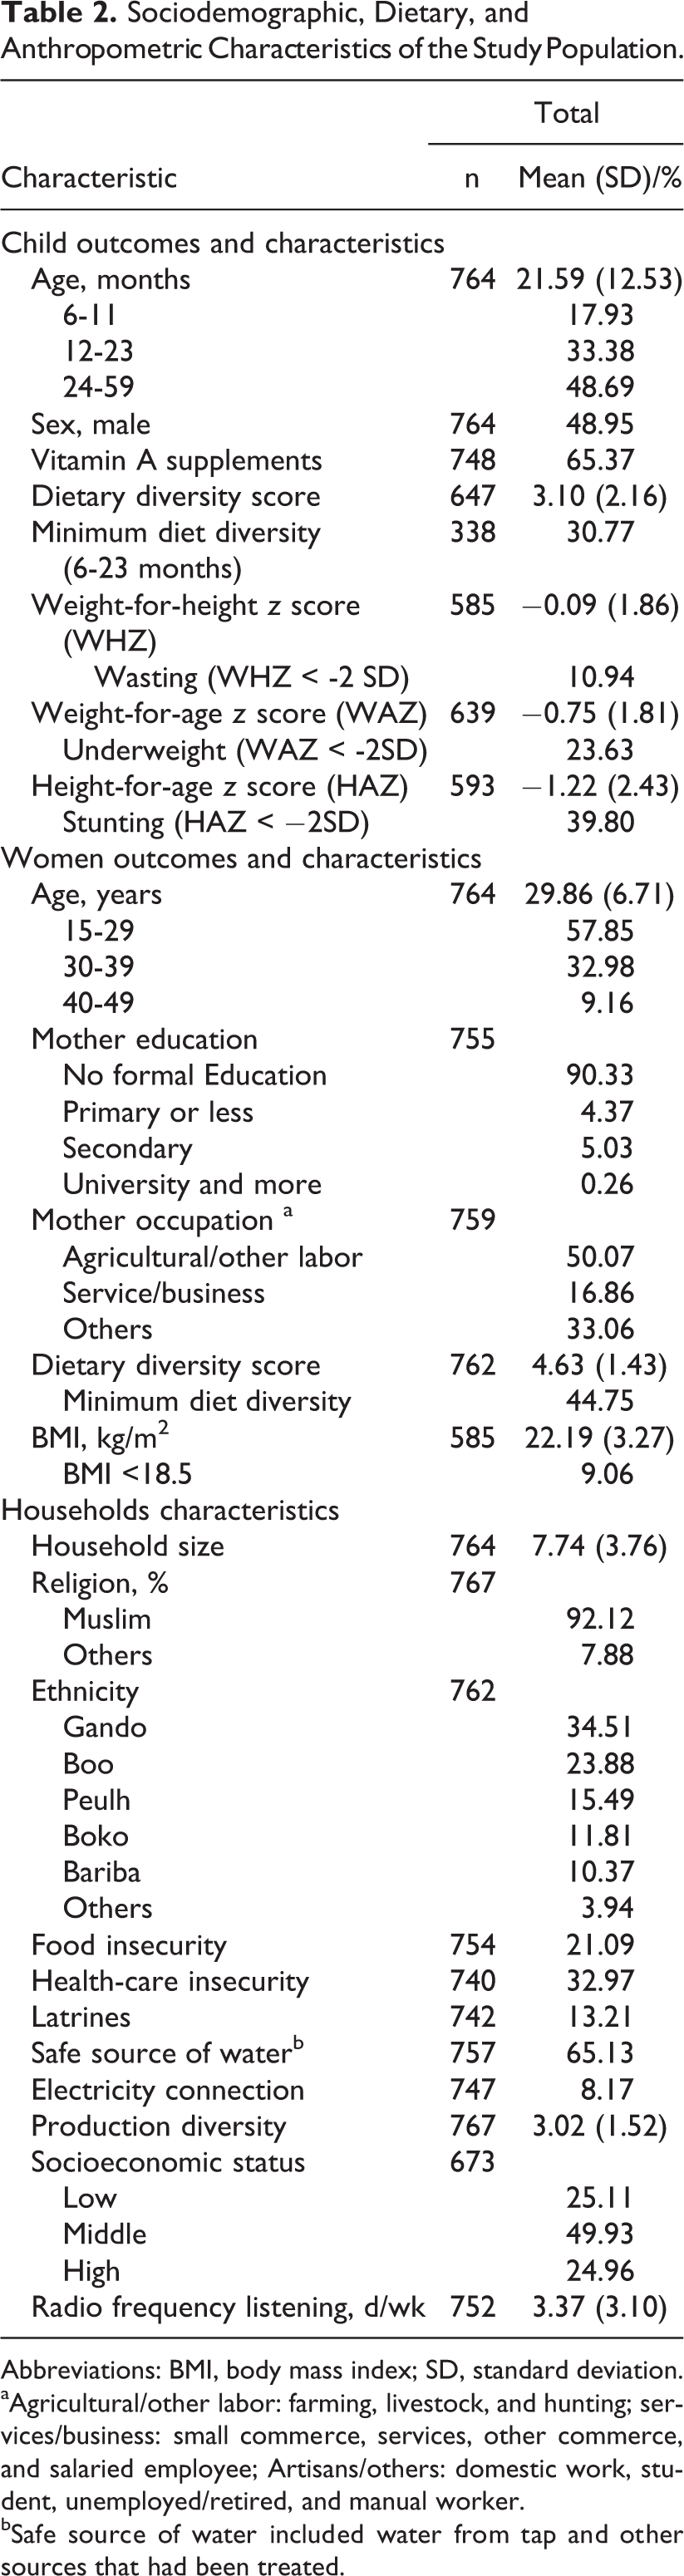
Abbreviations: BMI, body mass index; SD, standard deviation.
aAgricultural/other labor: farming, livestock, and hunting; services/business: small commerce, services, other commerce, and salaried employee; Artisans/others: domestic work, student, unemployed/retired, and manual worker.
bSafe source of water included water from tap and other sources that had been treated.
Women’s Empowerment
Table 3 shows the descriptive statistics for the 16 WE indicators. By domain, mobility was the domain in which most of women were empowered (72%), followed by economic security (55.5%) and leadership (54%). However, only 17.1% of women reported having a say in decisions about number of children, their education, or health care; 17.2% were also labor and political groups’ members, while 10.6% of them received adult male assistance. Overall, 55.8% of women were empowered.
Distribution of Women’s Empowerment Indicators and Domains by Groups.a
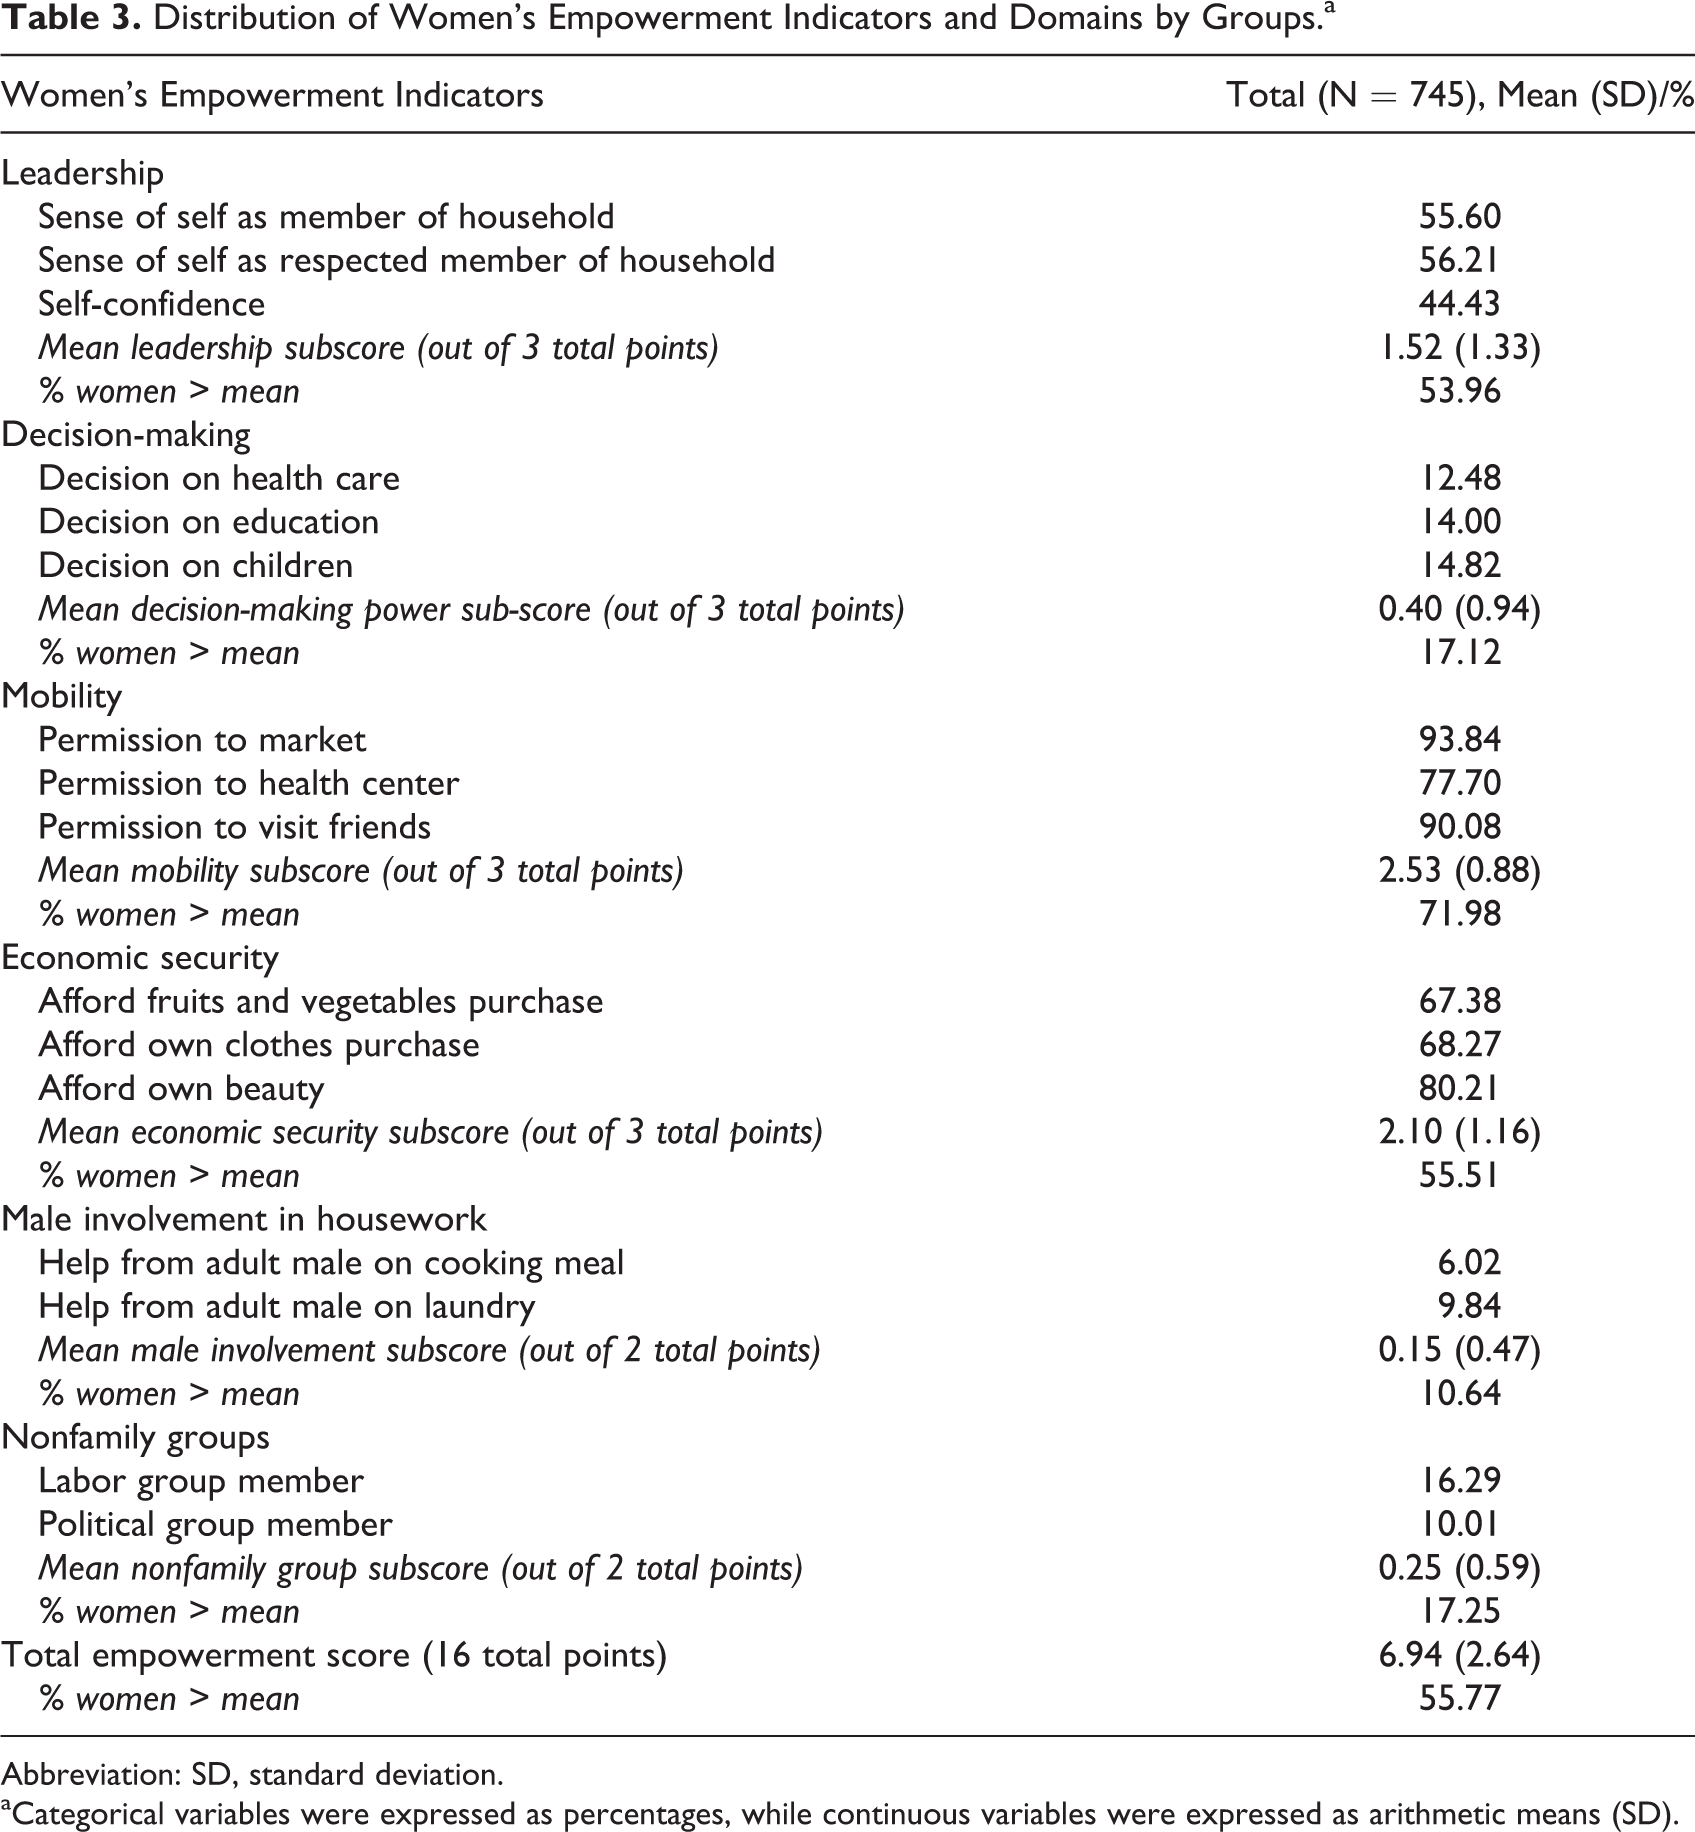
Abbreviation: SD, standard deviation.
aCategorical variables were expressed as percentages, while continuous variables were expressed as arithmetic means (SD).
Women’s Empowerment and Maternal and Child Outcomes
Table 4 presents associations between the composite empowerment status and each domain with maternal DDS and BMI. The results revealed a significant and positive association between the women’s composite empowerment score with their DDS (P = .01) and their BMI (P = .09). Additionally, the leadership domain was associated with maternal DDS (P = .008) and BMI (P = .06).
Associations Between Women Empowerment Measures and Women’s Dietary Diversity Score and Body Mass Index.
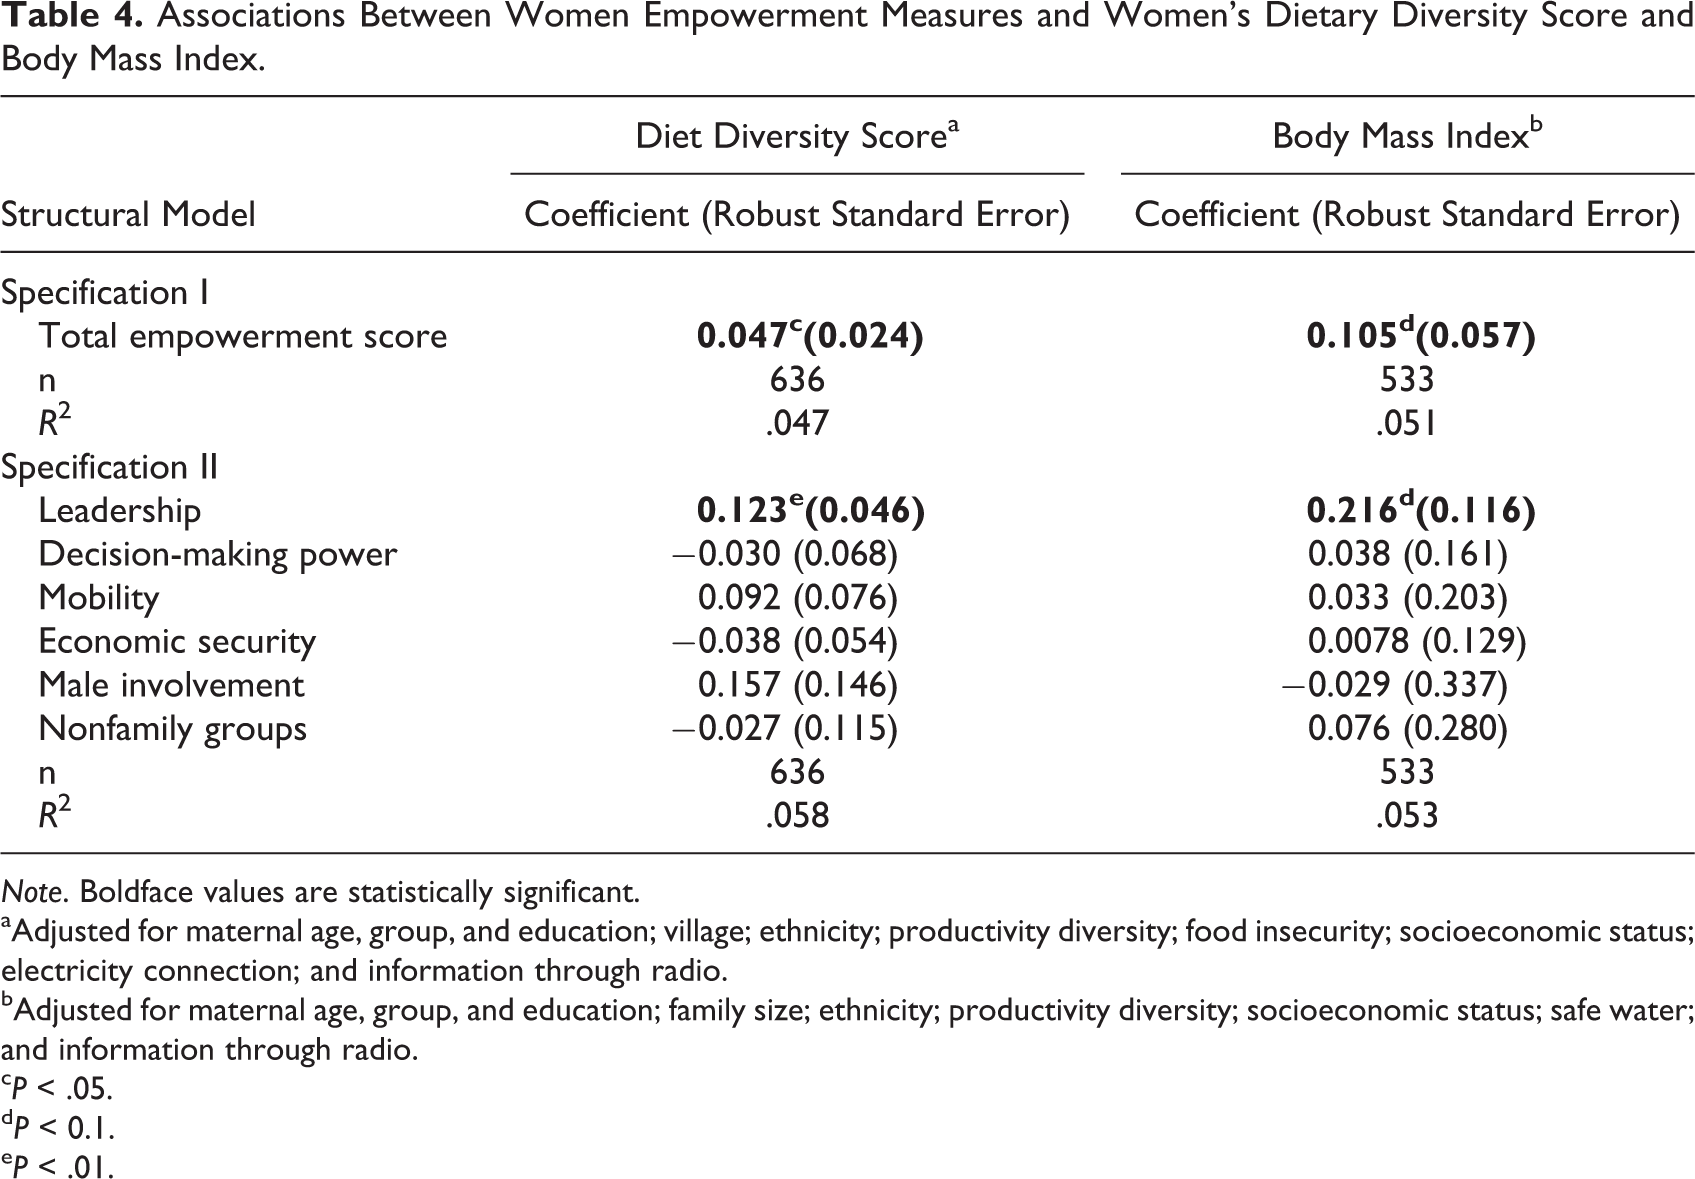
Note. Boldface values are statistically significant.
aAdjusted for maternal age, group, and education; village; ethnicity; productivity diversity; food insecurity; socioeconomic status; electricity connection; and information through radio.
bAdjusted for maternal age, group, and education; family size; ethnicity; productivity diversity; socioeconomic status; safe water; and information through radio.
c P < .05.
d P < 0.1.
e P < .01.
As for children diet quality outcomes, the adjusted models indicated that none of the 5 empowerment indicators (leadership, decision-making power, mobility, male involvement in housework, and nonfamily groups) were significantly associated with male child’s DDS (Table 5). However, the composite empowerment score (P = 0.09) and leadership domain (P ≤ .001) were significantly associated with the female child’s DDS. Surprisingly, the economic security domain was negatively correlated with male (P = .07) and female (P = .05) children’s DDS.
Associations Between Women Empowerment Measures and Children’s Dietary Diversity Score and Anthropometric z Scores.
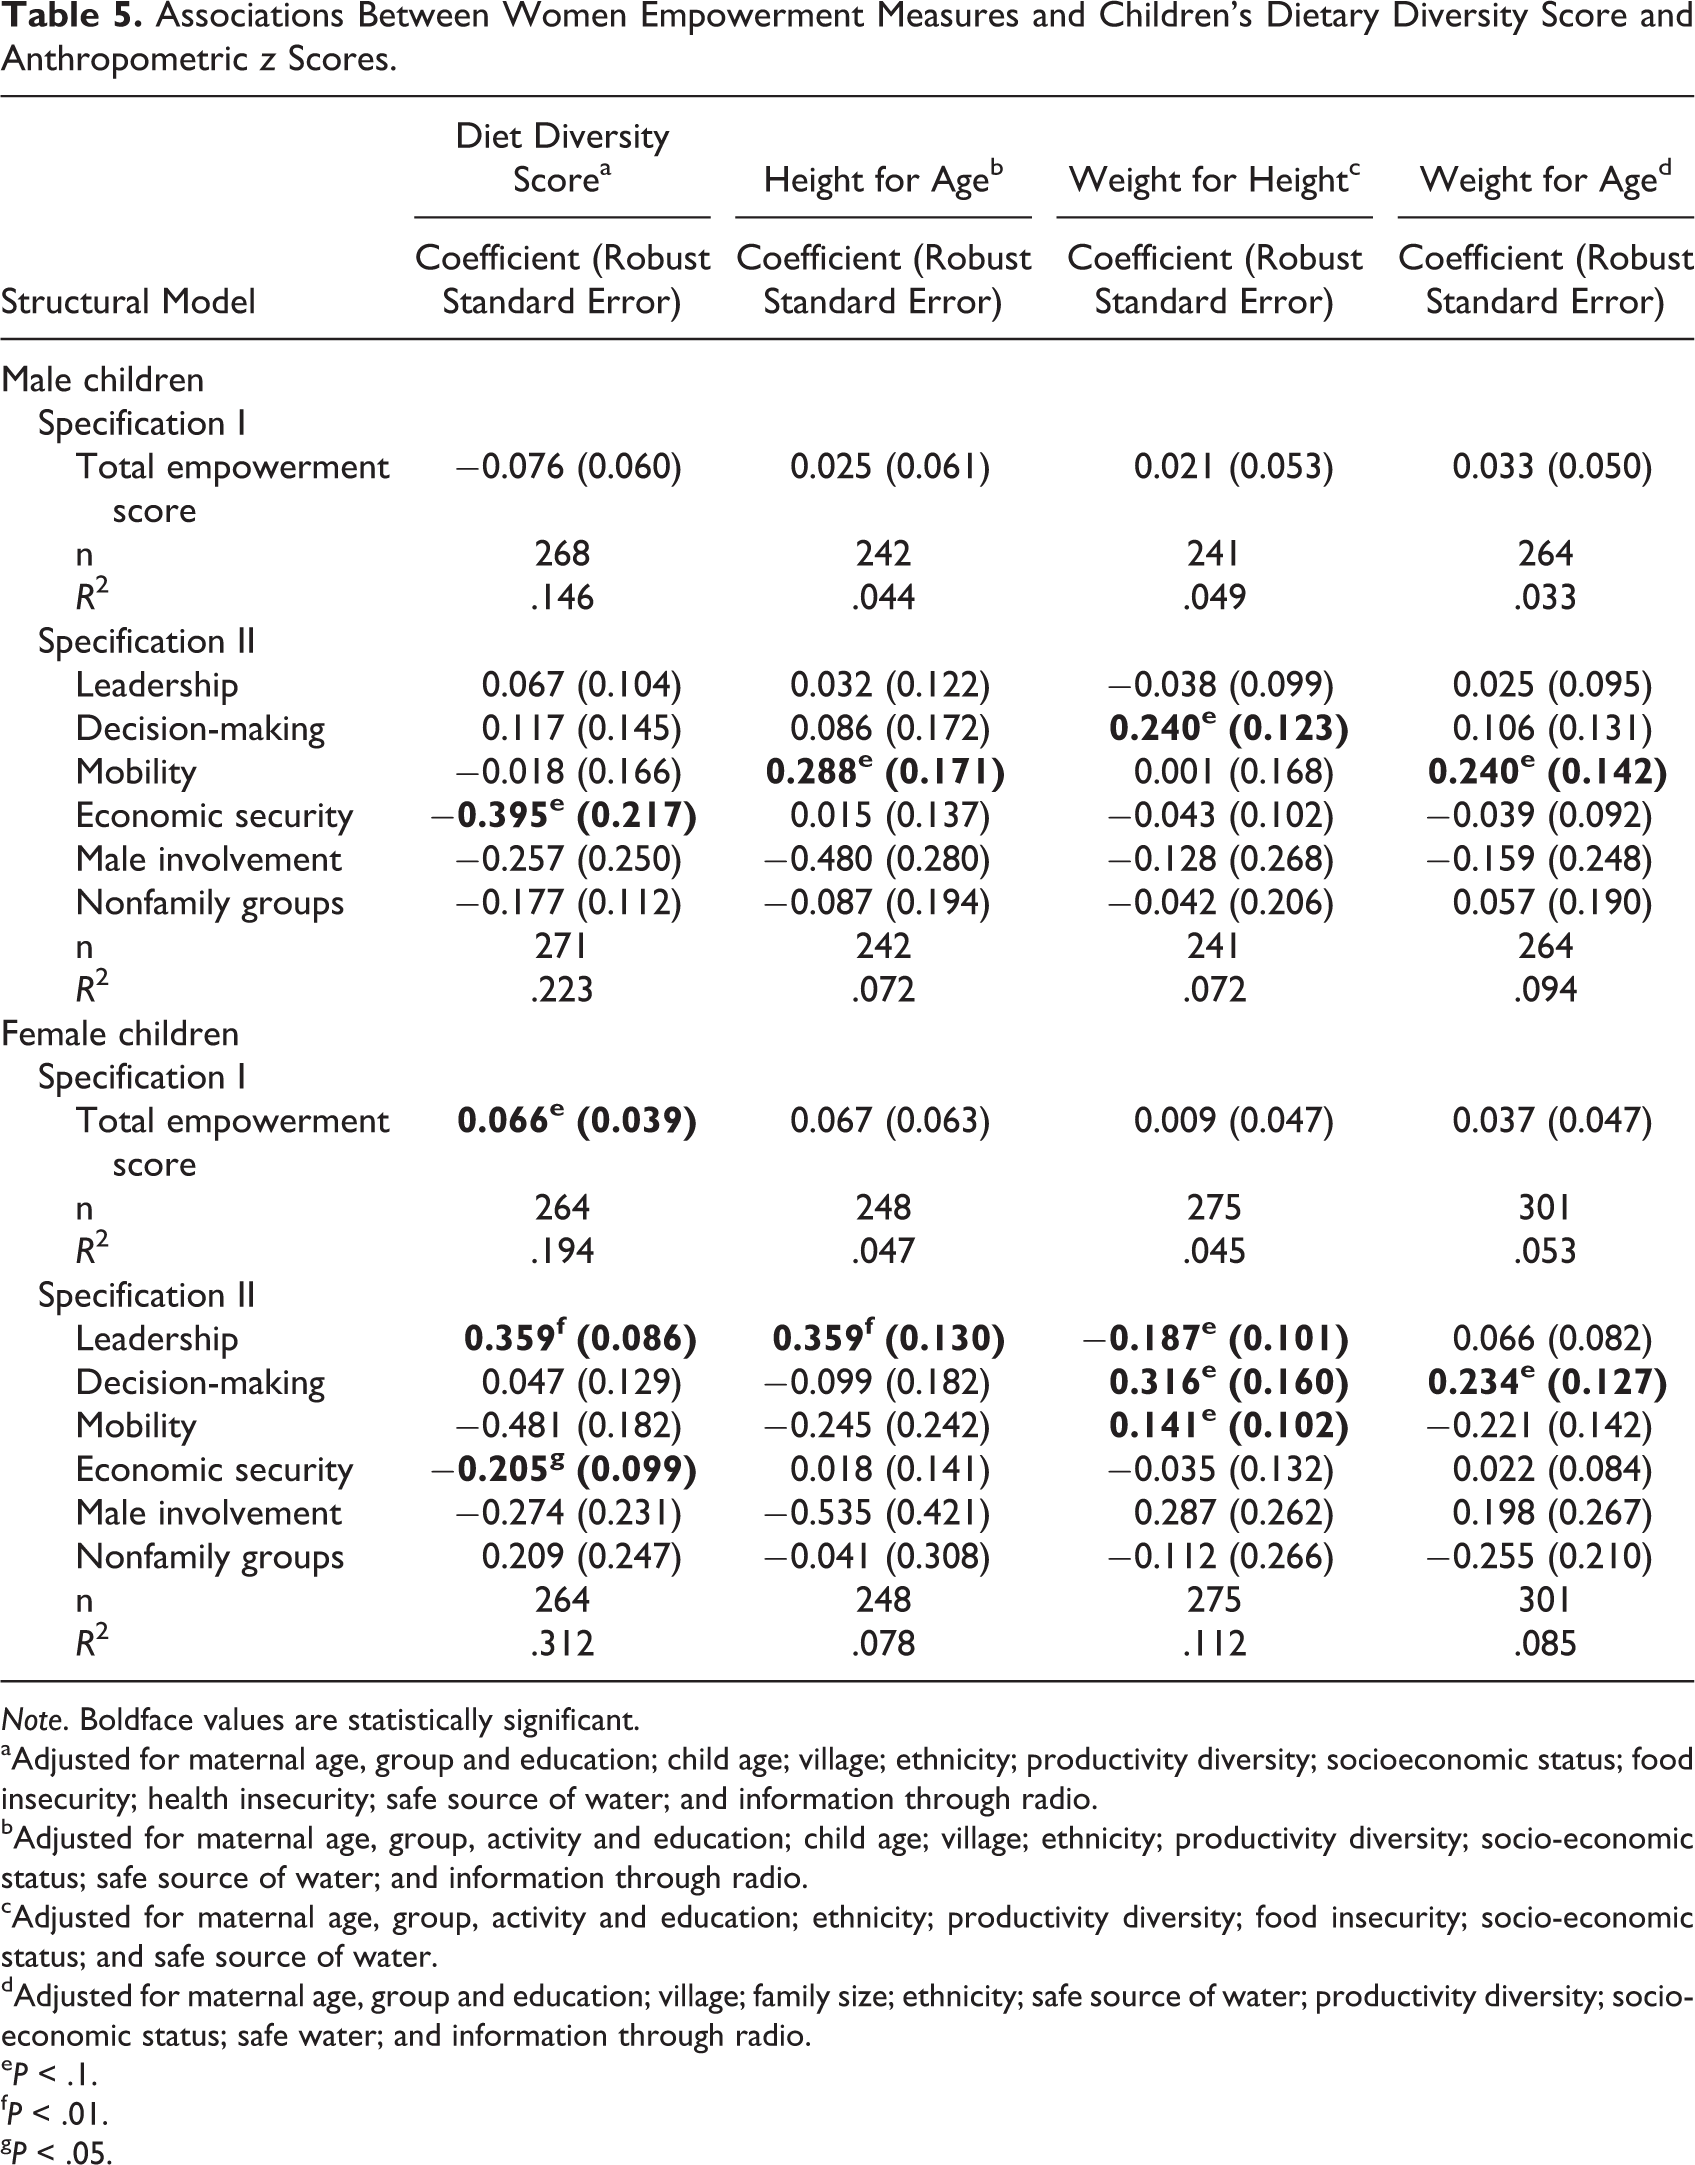
Note. Boldface values are statistically significant.
aAdjusted for maternal age, group and education; child age; village; ethnicity; productivity diversity; socioeconomic status; food insecurity; health insecurity; safe source of water; and information through radio.
bAdjusted for maternal age, group, activity and education; child age; village; ethnicity; productivity diversity; socio-economic status; safe source of water; and information through radio.
cAdjusted for maternal age, group, activity and education; ethnicity; productivity diversity; food insecurity; socio-economic status; and safe source of water.
dAdjusted for maternal age, group and education; village; family size; ethnicity; safe source of water; productivity diversity; socio-economic status; safe water; and information through radio.
e P < .1.
f P < .01.
g P < .05.
Overall, women’s empowerment was only weakly associated with children’s nutrition status. Mobility was positively associated with male children’s HAZ and WAZ scores, while decision-making power was positively correlated with male children’s WHZ. For female children, mobility was associated with WHZ, while decision-making power was correlated with WHZ and WAZ. Leadership was also positively and significantly associated with HAZ; however, significant negative association was observed between leadership and WHZ. Finally, no significant associations were found between the composite empowerment score, economic security, male involvement in housework, and participation in labor and political groups and the anthropometric measurements for male and female children (Table 5).
Discussion
This study is one of the few studies that have examined a multidimensional investigation of WE on children’s and women’s nutrition outcomes in SSA. We built upon prior analyses by including a composite empowerment measure in addition to examining the direct contribution of 6 domains (leadership, decision making, mobility, economic security, male involvement in housework, and nonfamily groups), using analytical methods that accounted for differences in individual, partner, and household characteristics. Key findings indicate that low dietary diversity and undernutrition were common, confirming the urgent need for interventions. 12 In the present study, children had a DDS of 3.09, and only 31% satisfied the minimum diversity criterion of eating 4 of 7 food groups. These results are only slightly lower than those reported (33%) for urban households, 9 reflecting the higher rates of poverty and less diverse production portfolios observed in our study. The prevalence of child wasting (11%) was also greater than the rest of the country (5%). 10 Similar to the child indicators, the prevalence of women’s undernutrition in our study was also greater than reported for Benin (9% vs. 6%). 9 However, mixed results were observed between WE and maternal and children nutrition outcomes and suggest that various domains of WE may have different impacts on nutritional status, consistent with the empowerment literature. 19,55,56
The significant positive association of women’s overall empowerment and maternal leadership with women’s diet diversity in our study is encouraging, as it suggests that increasing women’s empowerment, predominantly in the leadership domain, could work synergistically with food-based approaches meant to improve the diet quality and diversity. 57 A similar pattern was observed by Ross et al 31 in Ghana, where leadership empowerment was significantly associated with increased women’ DDS and BMI. Smith et al 58 even found that women’s lower self-esteem was closely tied to women’s own nutritional status and suggested that women with low status may face difficulty in perceiving the need for their own health care, much less garnering the confidence to act on that need. For this reason, several studies have pointed out the need to strengthen women’s role and self-confidence within their families. 59,60 Additionally, the positive associations found between women’s overall empowerment, leadership domain, and women’s BMI in our study suggest that empowered women in households receive a larger share of family’s nutritious food, which can translate to improved nutrition status. By contrast, women’s empowerment was not significantly associated with women’s BMI in the study of Malapit and Quisumbing. 20 The difference in findings may be explained by the fact that, in our study, women regression models included control variables, such as food security, access to health services, ethnicity, and productivity diversity that could potentially negate the impact of higher diet diversity on nutritional status. 19,61 –65
The current study also suggests that the constellation of factors associated with women’s composite empowerment as well as leadership empowerment was associated with a greater DDS among female children, implying that WE may have a differential impact on male and female child’s DDS. The positive impact of leadership on female children’s diet quality outcomes are in line with earlier findings by Ross et al 31 who reported that increased women’s self-confidence can make better health-enhancing decisions and thus have a positive impact on their families’ nutrition. However, Malapit and Quisumbing 20 observed in Ghana that only credit decision-making was associated with a higher DDS, while the empowerment score was negatively correlated with female child’s DDS. Interstudy differences in population characteristics, settings or methods of women’s empowerment, and the specific domains studied likely contributed to these inconsistencies. Finally, the negative association between economic domain empowerment and child’s DDS in the present study imply that children in households where the principal female can meet affordable needs consumed less diverse diets, contrary to our expectations. The qualitative study by Davis et al 66 in Ghana may provide a possible explanation, since malnourished children were fed a wider variety of food, while well-nourished children typically received fewer types of food. However, in our sample, underweight children consumed fewer food groups (2.6 vs 3.3) and a lower proportion met the minimum DDS (11% vs 17%) compared to well-nourished children. This unexpected finding may point out the need for behavior changes communication that diverse diets are important for a child’s general health.
The third implication relates to the significant positive relationship between 3 of the empowerment measures (leadership, decision-making power, and mobility) and children’s nutrition outcomes. Greater decision-making power was associated with child’ WHZ, suggesting that households where women make decisions may result in supporting greater food consumption and better child care, which could minimize the incidence of acute food shortages or severe disease that results in a deficit weight. Similarly, Dancer and Rammohan 67 found in Nepal that maternal involvement in decision-making regarding the purchase of daily household purchases was associated with child’s WHZ. These estimated associations suggest that an additional decision-making made by the primary female decision maker increases child’s WHZ by 0.23 (male) and 0.32 (female) in the present study compared to 0.087 in the latter study. Additionally, mobility was positively correlated with male children’s HAZ and WAZ as well as female children’s WHZ. According to Shroff et al, 23,68 access to markets to purchase food, medicines, and other essentials can improve knowledge about nutrition and health, whereas women with limited mobility are likely to have fewer social exchanges. 58,59 Furthermore, Mainuddin et al 69 found that women empowered in deciding major household purchases were significant with women’s mobility in visiting hospital. However, opposite signs were observed between maternal leadership and girls’ WHZ, suggesting possible trade-offs within the household.
Two of the 6 WE measures (male involvement in housework and participation in labor and political groups) were not linked to maternal and child nutrition outcomes. By contrast, Ross et al 31 found that membership in social and economic groups played a significant role in improving women’s BMI and DDS, whereas male involvement was associated with improved child and maternal health outcomes. 70 –72 It is possible that maternal and child nutrition outcomes did not involve interactions with this aspect of male involvement 73,74 or these types (political and labor) of groups in the area of study. Indeed, only 11% of women received adult male assistance for housework, whereas women’s participation in labor and political groups was limited (17%). However, WG had significantly greater overall empowerment and economic security scores as well as more children (31.5% vs 30.3%) and mothers (47.6% vs 42.9%) consuming the minimum DDS and lower prevalence of underweight (21.7% vs 25.1%) and wasted (10.7% vs 11.1%) children compared to NWG (data not shown). A final implication relates to the lack of association between composite WE and child nutritional outcomes, despite the association of specific domains of empowerment with child nutrition. This implies that improved nutrition is not necessarily correlated with being empowered across all empowerment domains. Another possible explanation may be that the effects of some of the domains on nutritional status are nullified by others in the composite index because of the low R 2 of most models and the lack of significant associations at P = .05.
Additional qualitative research may provide more in-depth understanding of the contexts driving the different associations between WE measures and maternal and child nutrition outcomes. Specifically, qualitative methods could also assist to understand the specific context surrounding women’s participation in labor and political groups and male involvement in housework to identify appropriate indicator for these measures as suggested by Schatz and Williams. 75 Supplemental qualitative methods could inform whether there is indeed no association between decision-making power and economic security and maternal nutrition outcomes or whether women’s empowerment aspects that are linked to maternal outcomes were unmeasured in this study. Measuring a latent construct such as empowerment is inherently challenging, and it is possible that different meanings and manifestations of empowerment were unable to be captured by the current index.
Our study did entail some limitations despite addressing several research gaps. This study employed cross-sectional survey data sets, thus any causal inference is tentative. It is also equally conceivable that women’s interpretation and response to the empowerment questions varied across villages, and some aspects of WE may not have been captured by the indicators assessed in the present study. 76 Ultimately, this may have decreased the predictive value of the construct. Finally, although the use of a summative index has been challenged by some researchers for discounting item-level distinctions, we considered the summative index a more appropriate approach in examining the broader role of WE, particularly given the concerns regarding the adequacy of any single item in an African context. Despite these limitations, the study’s strengths are the use of multiple empowerment indicators and domains, use of geographically diverse and large sample, and inclusion of measures compatible with the existing literature. The methodology is both transparent and transportable as it traced from the initial questionnaire through construction of indicators and appropriate treatment of uncertainty in the analysis—such that these methods can be both applied in other, different, contexts and compared to the results presented.
Conclusion
This study is one of only a few studies that examined and incorporated a multidimensional investigation of women’s status and empowerment on maternal and child undernutrition in SSA. Our findings contribute to the existing literature by providing positive and negative empirical evidence on the relationship of potentially synergistic and opposing WE measures and maternal and child undernutrition, specifically in Kalalé district of Northern Benin. In addition, our results suggest that efforts to reduce malnutrition in Benin may benefit from empowerment initiatives that promote women’s self-confidence and decision-making power, particularly when informing policies and programs that seek to empower women for improving nutrition. However, the mixed and null findings suggest that additional qualitative and longitudinal research is needed to provide more in-depth understanding of the contexts driving the different associations between WE and maternal and child nutrition status in the region
Footnotes
Acknowledgments
The authors thank the participants and the villages’ delegates, nurses, and enumerators who participated in the study. They wish to express their very special appreciation to ADESCA-ONG, specifically Amidou Mama Sambo, Zacharie Sero Tamou, and Sandra Phillips, whose contribution was central to this project.
Declaration of Conflicting Interests
The author(s) declared no potential conflicts of interest with respect to the research, authorship, and/or publication of this article.
Funding
The author(s) disclosed receipt of the following financial support for the research, authorship, and/or publication of this article: This work was supported by the University of Stanford, Hellman Fellows Program at UC San Diego and the University of Arizona. The funders had no role in the design, analysis or writing of this article.
Supplemental Material
Supplementary material for this article is available online.
References
Supplementary Material
Please find the following supplemental material available below.
For Open Access articles published under a Creative Commons License, all supplemental material carries the same license as the article it is associated with.
For non-Open Access articles published, all supplemental material carries a non-exclusive license, and permission requests for re-use of supplemental material or any part of supplemental material shall be sent directly to the copyright owner as specified in the copyright notice associated with the article.