
Abstract
Background and Objectives:
This study assessed the nutritional status among householders in urban South Tarawa and rural Butaritari in Kiribati.
Methods and Study Design:
In this cross-sectional study, we assessed energy and nutrient intakes, food variety scores, and dietary diversity scores of men and women from 468 households randomly selected in South Tarawa (n = 161) and Butaritari (n = 307) using a 24-hour dietary recall. Nutrient adequacy ratios and mean adequacy ratios of selected nutrients were also determined from 3-day weighed food records collected among participants living in a further 28 households from South Tarawa (n = 29) and Butaritari (n = 44).
Results:
Based on the 24-hour dietary recall, the average energy intake for men and women was 2536 kcals and 2068 kcals, respectively. Carbohydrate (CHO), fat, and protein intakes for men and women were 332.5 g, 76.5 g, and 130.4 g and 291.7 g, 55.1 g, and 103.5 g, respectively. The mean and standard deviation of household Food Variety Score and Dietary Diversity Score was 3.90 ± 1.25 and 5.44 ± 1.92, respectively. Intakes of vitamin A, calcium, and iron, and zinc were notably deficient in both locations, with the urban participants having lower intakes of vitamin B-1, vitamin B-2, magnesium, and potassium than their rural counterparts. Mean sodium intakes exceeded recommendations for all age groups in South Tarawa except children aged 4 to 6 years.
Conclusions:
Food consumption patterns of the households in South Tarawa and Butaritari reflected high consumption of nontraditional diets and refined foods, which manifested in inadequate micronutrient intake estimates and low dietary diversity: strong risk factors for noncommunicable diseases such as obesity and diabetes.
Introduction
As a consequence of global nutrition transition, once-self-sufficient countries have become economically and food dependent on developed countries including most Pacific Island Countries (PICs). This, at least in part, explains the increase in nutrition insecurity and unhealthy diets in many PICs, with resultant high rates of obesity and both communicable and noncommunicable diseases. 1 The extent of diversity in the food supply with available macronutrients and micronutrients is a major underlying factor of nutrition security. 2,3 Although malnutrition causes are complex, a leading cause is suggested to be the simplification of diets, which is linked to reduced dietary diversity (DD), and decline in nutrition quality. An emerging body of evidence linking food and nutrition insecurity to a spectrum of adverse outcomes has focused the importance of DD as an important indicator of good nutritional status. 4 These outcomes include iron-deficiency anemia and increased chronic diseases, 5 long-term physical health problems, 6 and poor mental health. 7 The recent trend is to determine diet quality in characterizing dietary patterns, as measured by food variety (FV) and DD score. 8 Dietary diversity is calculated as the number of food groups consumed compared to a standard number of food groups. 8,9 Many studies have assessed the quality of diet using the measures of FV and DD, especially for developing countries. 10 -12 A lack of DD has been found to adversely impact adults and children of rural households living in poor-resource communities, for example, in Sub-Saharan Africa. 13 -15
Few studies have been conducted in Small Island Developing States (SIDS). A study in Fiji, which measured diet composition, hair, and breath isotopic composition, showed that dietary and tissue isotopic values provide a basis for determining and validating dietary regimes. 16 Another study in Papua New Guinea showed that malnutrition was positively associated with poor socioeconomic factors. 17 No such studies have been conducted in Kiribati, a west Pacific island state, which consists of chain of 16 atolls and 1 coral island with a population of 110 136 (2015 Census) population and a Gross Domestic Product (GDP) per capita of only US$1651. 18 A transition of dietary patterns in Kiribati and other Pacific regions is demonstrated by increased demand for packaged imported foods such as canned meats, instant noodles, rice, and sugar-sweetened beverages, and subsequently, reduced consumption of traditional indigenous plants and animals, thereby leading to food and nutrition insecurity and a high incidence of diet-related noncommunicable diseases. 19,20 The Global Nutrition Report 2018 for Kiribati showed a worsening scenario for adult obesity, diabetes, and anemia. The underlying determinants of malnutrition such as availability of fruits and vegetables, total calories obtained from nonstaples, sanitation, and drinking water coverage, and female secondary education enrolment has not significantly improved. 21
The aim of this research was to measure the nutrient intake, FV, and DD of adult householders in South Tarawa (ST) and Butaritari (BT), Kiribati. The work is part of a baseline survey for the Kiribati Health Champions (KHC) programme 22 and one of the few studies in SIDS that reports nutritional status using dietary intakes of households. The purpose of the 24-hour recall was to assess the energy, macronutrients, micronutrients, food variety score (FVS), and dietary diversity score (DDS) of the households, and weighed food record was carried out to provide prospective quantitative dietary information. The findings from our study provide a benchmark against which progress made by the KHC group in the target communities can be measured. 22
Materials and Methods
Study Area
South Tarawa is the capital of the Republic of Kiribati which is home to approximately half (50, 182) of Kiribati’s total population, and most of the government, commercial, and education facilities. Butaritari is the second most northerly of the Gilbert Islands, formerly called Makin Atoll by the US Military, with a population of 4346 people inhabiting 12 villages. 18
Enumerator Composition and Training
Enumerators were drawn from communities in ST and BT. The enumerators were selected based on their knowledge, fieldwork experience, and community engagement. Ten enumerators each from ST and BT were trained and field work was conducted in teams of two. A translator was present during training, fieldwork, and initial data cleaning. Training was undertaken for 5 days in each location and covered best practices, ethical behavior, sampling protocols, and the questionnaire instruments. Reliability tests were conducted on the instruments. It also included a field test of all of the instruments (24-hour dietary recall and the weighed food record templates) and a final revision of the instruments based on the enumerators’ field experience. Serving/portion sizes were developed for some of the foods with input from the enumerators for better applicability and understanding of the dietary assessment instruments. These were continuously updated or verified until the end of the survey as new foods/dishes/menus were identified from participant responses.
Sampling Methodology
A sample of 468 (161 and 307 from ST and BT, respectively) households was selected for the survey using a systematic random sampling method. The inclusion criterion was any household with at least a mother/father and child/dren living, cooking, and eating in the same household. No exclusion criteria were applied. It is a household study and the individuals were responding on behalf of the households, with the exception of the individual weighed food records, which were recorded at the household level. The list of households was obtained from National Statistics Office, Tarawa. After estimating the total number of households at each site, every third household was approached and invited to participate in the study. The respondents were mostly adult (≥18 years of age) female members of the households who were involved in cooking/purchasing of the food. No incentives were provided.
Ethical Standard Disclosure
This study was conducted according to the guidelines laid down in the Declaration of Helsinki and all procedures involving study participants were assessed and approved as Low Risk under Massey Ethics Committee System with Application No 4000018013. A research permit was also obtained from Kiribati Immigration with RP No 14/2017. Written and verbal informed consent was obtained from all participants. Verbal consent was witnessed and formally recorded.
Data Collection
Data collection was completed in September 2018 using a standardized protocol for the 24-hour food recall and the 3-day weighed food record, both of which are instruments of choice in studies of this type. 23 The 24-hour food recall was administered in Gilbertese (local language) using common local measures used in their homes for better recall. These local measures were standardized and converted into metric measures.
Twenty-Four-Hour Recall
A trained person administered an individual single 24-hour food recall on a random day to minimize the effects of day-to-day differences. During the 24-hour food recall, participating women (320) and men (148) were asked to describe all foods and drinks consumed the preceding day as well as the time these foods or drinks were consumed. Names of dishes and all ingredients used were recorded. The amount of food consumed was expressed using common household measures such as a big spoon, a small spoon, a ladle, a cup, a glass, and a tea glass. These local measures were standardized and converted into metric measures. Portion sizes were estimated using visual aids (photographs of food portion sizes). Preparation techniques of the foods and occasions they were consumed were recorded. The food and drink consumption data were not restricted to any quantity or form for any of the items consumed, and all items were included in the analysis. Energy, macronutrient, and micronutrient intakes were estimated using the Pacific Food Composition Database (2004 version) in FoodWorks 9 Professional Software, Xyris (2009) Ltd.
Dietary Diversity and Nutrient Adequacy
Dietary diversity, defined as the number of different foods or food groups consumed in the previous day, was measured using a DDS. For each individual, DDS was calculated by summation of the number of food groups recorded on the 24-hour food recall. 24 Eleven food groups (fish/sea foods, cereals, sugar, fats/oil, meats/pork, roots and tubers, fruits, dairy products, vegetables, eggs, and legumes and nuts) were used in the study. Any quantity of any food group consumed at least once per day was taken into account. Therefore, the DDS was calculated without considering a minimum intake for a food group. Although we assessed individual DD using 24-hour recall, we consider that they are representatives of their households (as most householders eat the same food). On that basis, we further analyzed and categorized this as Household Dietary Diversity Score (HDDS). Participants were categorized as having low DD (consumption of ≤ 4 food groups), medium DD (5-6 food groups), and high DD (≥7 food groups). 24
Food Variety Score
The food variety score approach was adapted and modified from Clausen and colleagues 8 and obtained from the 24-hour dietary recall. The scoring system was based on the daily intake. One point was given for each consumed food item in each meal and was then categorized. A total of 9 categories of foods with 89 food items were selected for inclusion in the calculation of FVS with scores ranging between 0 and 9 points. These 9 categories of foods were rice, noodles and breads; cereals, cereal products and tubers; vegetables; fruits; fish, poultry, and meat; legumes and nuts; milk and milk products; fat, oils, sugar, and salt; nonalcoholic beverages. The FVS was then categorized into low (1-3 points), medium (4-6 points), and high (>7 points).
Estimation of Misreporting
The proportion of possible under or overreporting was calculated from total energy intake (EI) from reported food intake with individual estimated basal metabolic rate (BMRest), calculated using the Harris-Benedict equations revised by Mifflin et al. 25 The equation for men is (10 × weight in kg) + (6.25 × height in cm) – (5 × age in years) + 5 × physical activity level (PAL) while the equation for women is (10 × weight in kg) + (6.25 × height in cm) − (5 × age in years) −161 × PAL. Cutoff points were applied using the methods described by Goldberg, identified as the optimal method in a review based on the ratio between El: BMRest for a particular PAL. 26 Underreporting was defined as El: BMRest < 1.10 and El: BMRest > 2.19 was used to define overreporters. 27
To check for the impact of misreporters, a sensitivity analysis was undertaken of the proportion of participants from ST and BT with an EI-BMR of between 1.10 and 2.19 who met the Nutrient Reference values (NRV) for Australia and New Zealand for intake of macronutrients by sex (Table 1).
Proportion of Participants From ST and BT With an EI-BMR of Between 1.10 and 2.19 Who Met the Nutrient Reference Values (NRV) for Australia and New Zealand for Intake of Macronutrients.
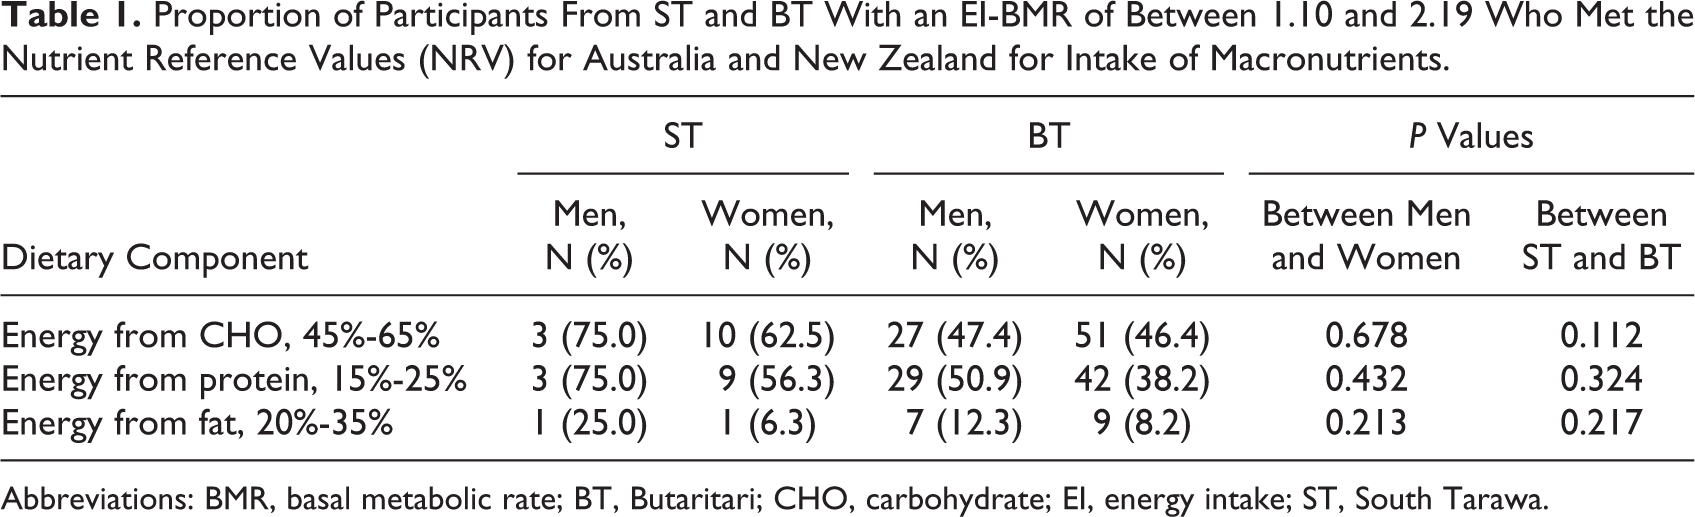
Abbreviations: BMR, basal metabolic rate; BT, Butaritari; CHO, carbohydrate; EI, energy intake; ST, South Tarawa.
Three-Day Weighed Food Record
A 3-day weighed food record was obtained from a subsample of 28 households with 73 individual household members in ST and BT. There were 29 household members in ST (15 males and 14 females) and 44 household members in BT (24 males and 20 females) (Table 2). Measurements of the foods consumed were conducted using modified standard procedures. 28 In particular, household dietary/food scales were used to weigh all raw food ingredients, all cooked food, and individual food portions per person at each meal. Left-overs and inedible portions of each meal were also weighed. Food items were analyzed by coding all the food and drinks recorded by the participants using FoodWorks 9 Professional software, Xyris (2009) Ltd. Data obtained were used to support the 24-hour food recall. Weighed food records are often used as a reference method in validation studies of other dietary assessment methods. 29,30
Age, Location, and Gender Distribution of the Participants Who Participated in the Weighed Food Records.
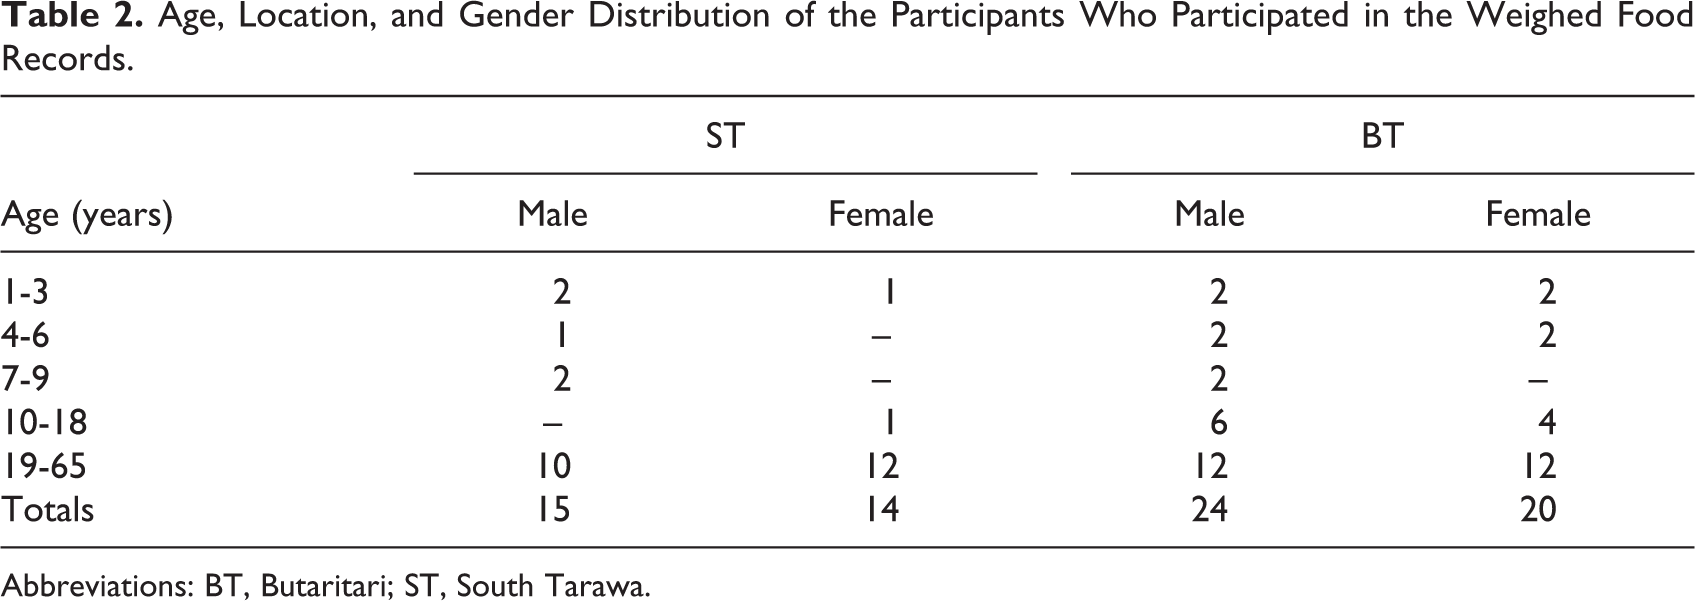
Abbreviations: BT, Butaritari; ST, South Tarawa.
Nutrient Adequacy Ratio
Nutrient adequacy was measured from the weighed food record by computing the nutrient adequacy ratio. 31 Nutrient adequacy ratio was calculated for energy and 12 nutrients including vitamins A, B-1, B-2, B-3, B-12, and C, folic acid, calcium, iron, zinc, magnesium, and protein. The mean probability of adequacy across the nutrients was calculated using the recommended nutrient intakes (RNIs). 32 Mean adequacy ratio (MAR) of the micronutrients (vitamin A, iron, and zinc) was calculated to reflect the overall micronutrient adequacy of the diets. This index quantifies the overall nutritional adequacy of a population based on an individual’s diet using the current recommended nutrient intake for a group of nutrients of interest. 31
Statistical Analyses
Data were normally distributed and entered into IBM statistical tool SPSS version 21 for descriptive analysis involving frequencies, percentages, means and standard deviations. The nutrient intake assessments of the participants were compared with the RNI for protein, thiamin, riboflavin, niacin, vitamin C, vitamin A, magnesium, calcium, iron, and zinc, 33 and sodium and potassium was compared using the NRV for Australia and New Zealand. 34 The nutrients were adjusted for sex and energy and independent t tests were used to assess the differences in nutrient intake, FVS, and DDS between males and females and participants from ST and BT. Values of P < .05 were considered statistically significant.
Results
Twenty-Four-Hour Recall Study
For the 24 hour recall study, the mean age of the respondents was 40.7 years. Seventy-three percent and 59% were women in ST and BT, respectively, and the majority of respondents were aged between 25 to 55 years. Most respondents (over 60%) had a secondary school education as their highest formal education in ST and more than half (55.6%) had a primary school education as their highest formal education in BT.
Energy intakes and major dietary components
A prominent feature of the 24-hour recall results are higher total EIs in BT than ST, which are evident in both men and women (Table 3). On average over both men and women, BT participants consumed 1.8 times more energy. Despite this, and differences in foods consumed, the relative proportions of major dietary components between ST and BT were similar. Estimated as percent energy, the mean contributions from CHO and protein intake were both 10% higher in BT than ST, and fat was 20% higher (Table 3).
Daily Macronutrients and Micronutrient Intakes of the Participants Based on 24-Hour Dietary Recall and Proportion of Men and Women Who Met the RNI.a
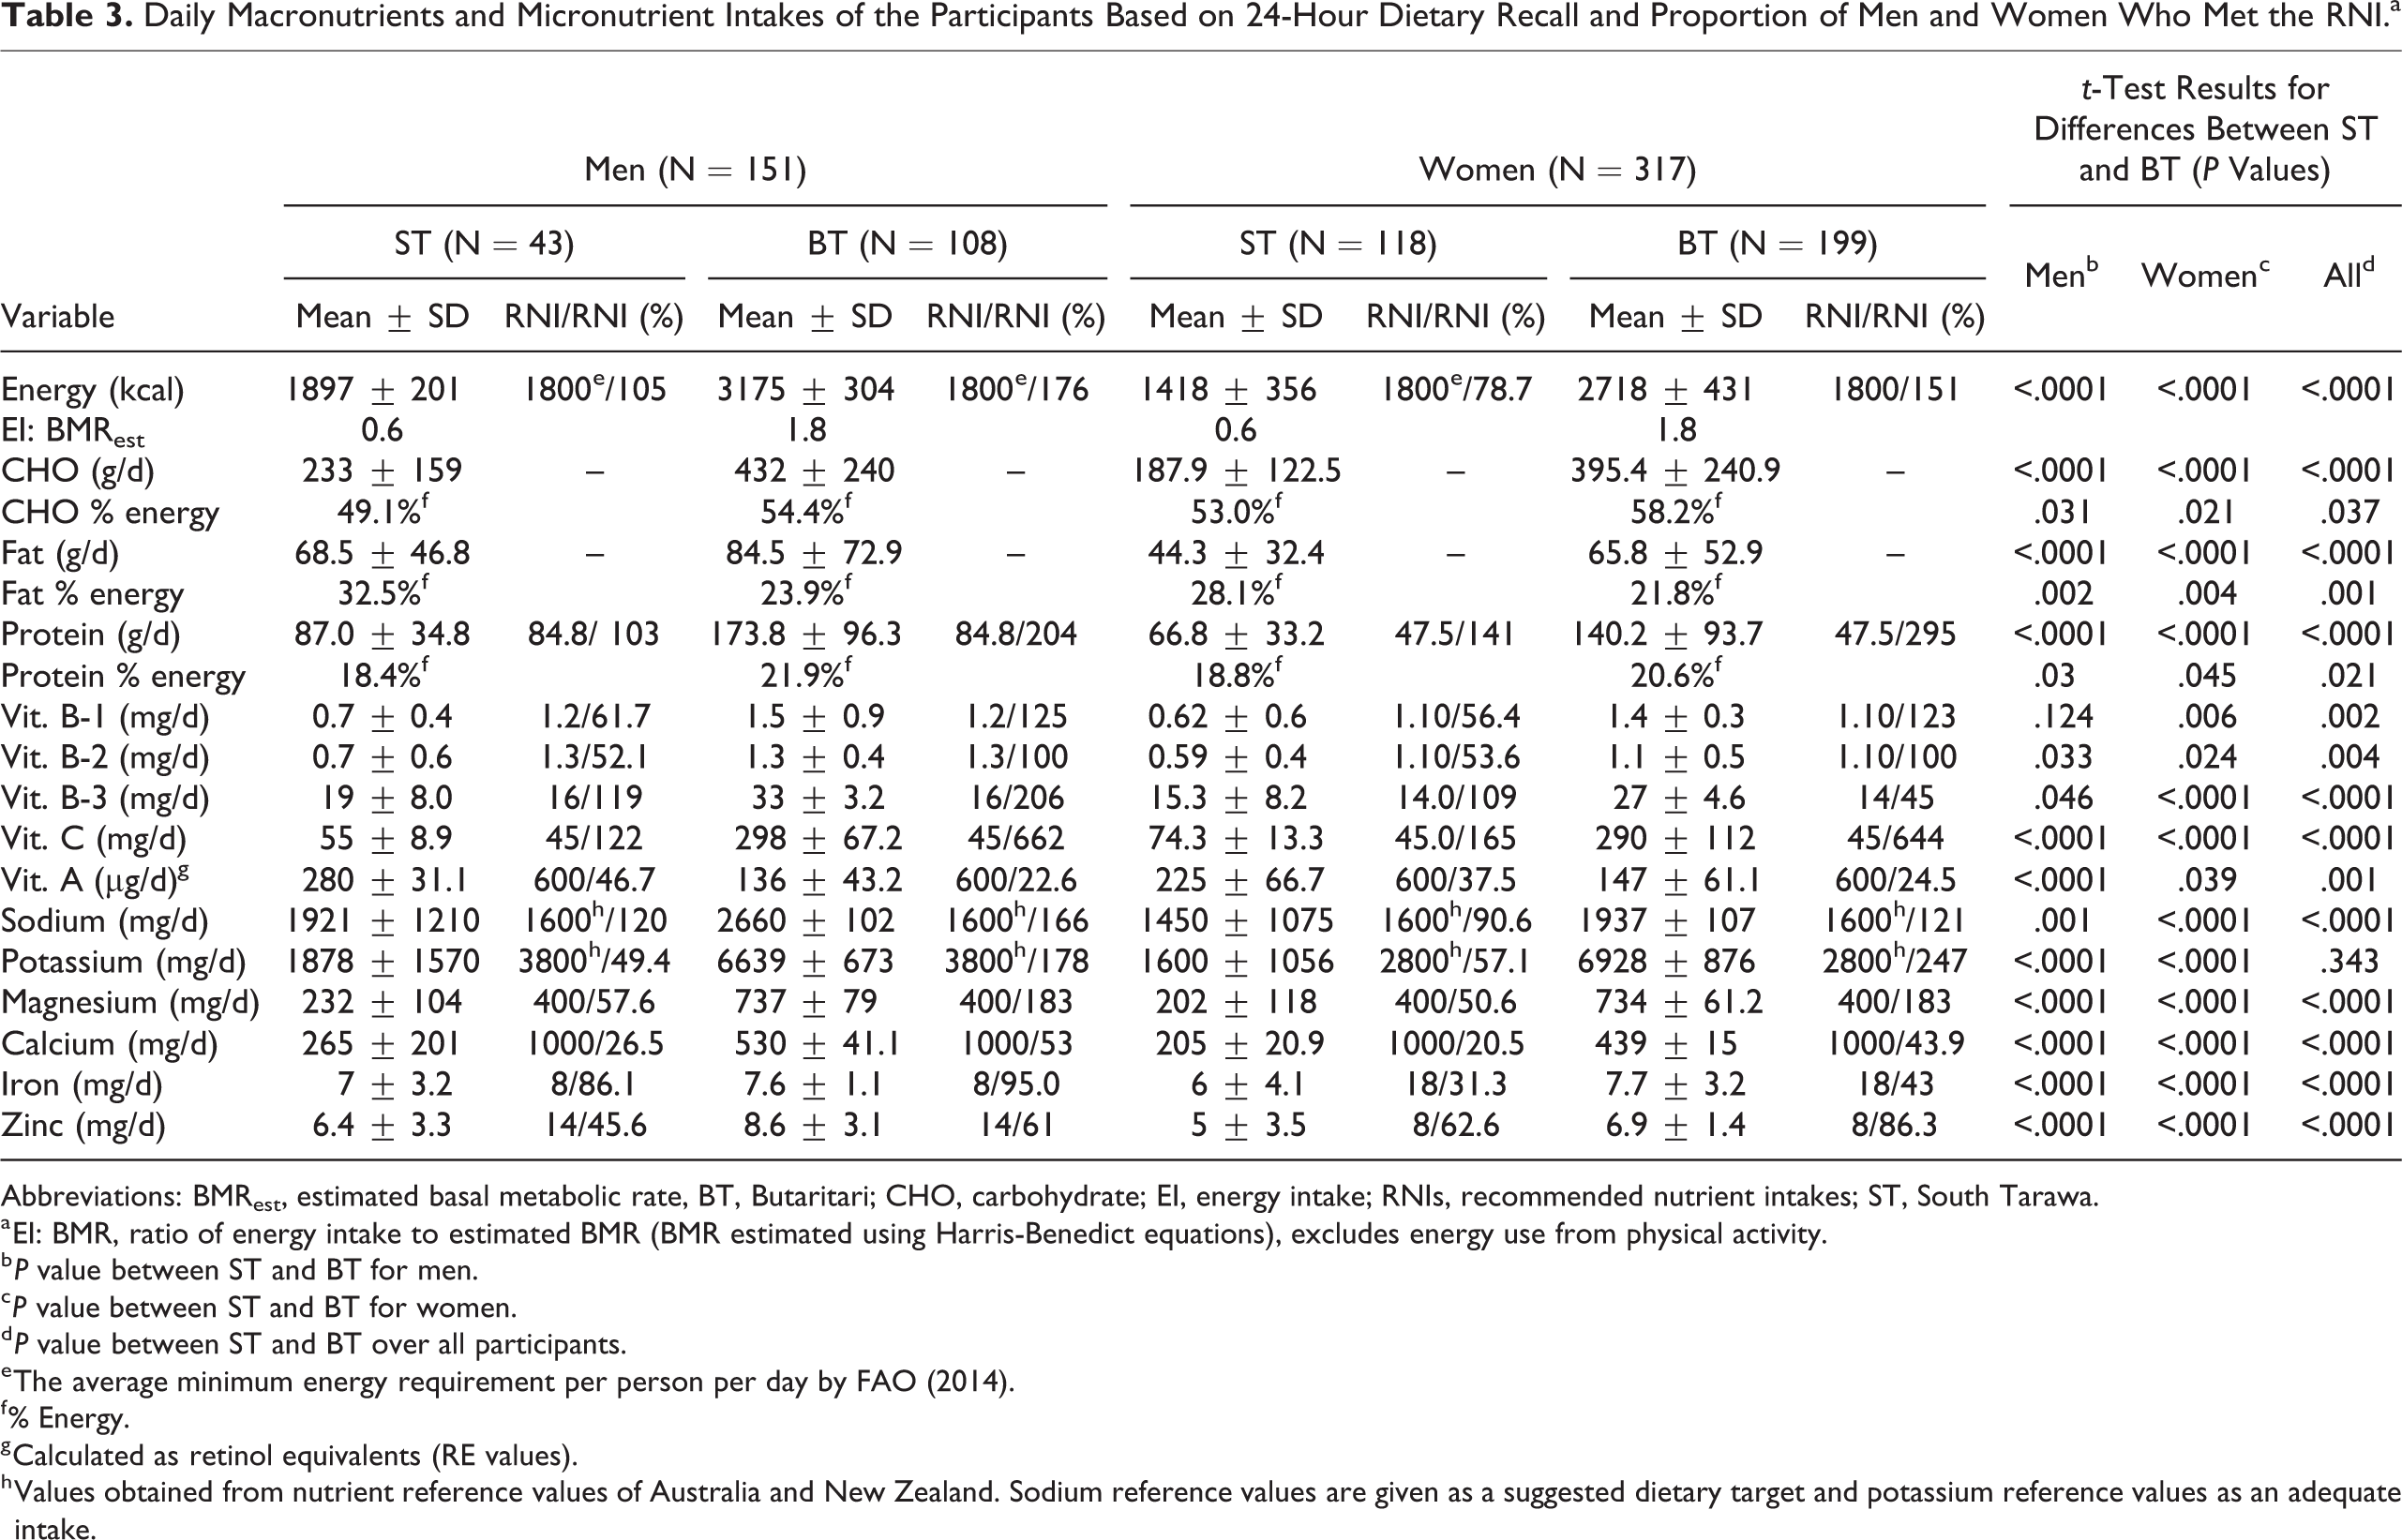
Abbreviations: BMRest, estimated basal metabolic rate, BT, Butaritari; CHO, carbohydrate; EI, energy intake; RNIs, recommended nutrient intakes; ST, South Tarawa.
a EI: BMR, ratio of energy intake to estimated BMR (BMR estimated using Harris-Benedict equations), excludes energy use from physical activity.
b P value between ST and BT for men.
c P value between ST and BT for women.
d P value between ST and BT over all participants.
e The average minimum energy requirement per person per day by FAO (2014).
f % Energy.
g Calculated as retinol equivalents (RE values).
h Values obtained from nutrient reference values of Australia and New Zealand. Sodium reference values are given as a suggested dietary target and potassium reference values as an adequate intake.
Sensitivity analyses
For ST, excluding those whose mean EI suggested potential misreporting EI-BMRest < 1.10 and > 2.19 made a 3% difference to the estimated intake of CHO, a 2% difference to the intake of protein, and an 8% difference in the intake of fat. For BT this made 7% difference to the intake of CHO, 5% difference to the intake of protein, and 8% difference in the intake of fate. Exclusion of results for these participants resulted in significantly higher intakes for protein, fat, and CHO. The results in Table 1 indicate that although the majority of the misreporters were overreporting their intakes, the approximate proportions of energy adjusted macronutrient intakes were credible.
Nutrient and mineral intakes
On average, both male and female participants in ST consumed below the RNI for the following vitamins: vitamin B-1 (61.7% and 56.4%, respectively), vitamin B-2 (52.1% and 53.6%) and vitamin A (retinol equivalents; 46.7% and 37.5%). They had adequate intakes for niacin (119% and 109%) and vitamin C (122% and 165%; Table 3). Of the minerals, both male and female participants in ST consumed below RNI values for: potassium (49.4% and 57.1% of RNIs), magnesium (57.9% and 50.6%), calcium (26.5% and 20.5%), iron (86.1% and 31.3%) and zinc (45.6% and 62.6% respectively); and above the RNI for sodium (1600 mg/d). Male and female participants in BT consumed below the RNI for total vitamin A (22.6% and 24.5%, respectively). On average male and female participants consumed adequate amounts of niacin (206% and 196%, respectively), vitamin B-1 (125% and 123%, respectively), vitamin B-2 (100% and 100%, respectively), and vitamin C (662% and 644%, respectively; Table 3).
A focus on mean values can obscure the significance of variation between individuals, which should also be considered for nutrients that appear deficient. For BT, the percentage of total participants estimated to meet the RNI was in descending order: zinc (77%) > iron (61%) > calcium (47%) > vitamin A (24%) and for ST: zinc/vitamin B1 (58%) > potassium (55%) > vitamin B2 (53%) > magnesium (52%) > iron (46%) > vitamin A (40%) > calcium (22%).
Food groups and dishes
Over 80% of the households reporting consuming fish/seafood, cereals, and sugar in both ST and BT. Few of the households in either location consumed fruit and dairy products, and no households in BT consumed vegetables or eggs (Figure 1). In terms of food groups consumed in the previous 24 hours, the 2 locations showed reported very similar results for fish (consumed in 96% and 93% of households in ST and BT, respectively). The main difference between the 2 locations was higher relative cereal, sugar, and fat/oil reliance in ST. With respect to the base of dishes consumed, Figure 2 shows that households in BT had high recourse to breadfruit (75%) followed by rice-based (64%) dishes, whereas those in ST drew more heavily on rice (90%), followed by flour-based (77%) dishes. One-third (33.5%) of households in ST consumed a breadfruit-based dish in the previous 24 hours, compared with 3 quarters of households in BT. For flour-based dishes the pattern was reversed: these were consumed by 77% of households in ST compared with 22% in ST. Only 2% of households in ST and 10% of those in BT reported consumption of taro-based dishes.
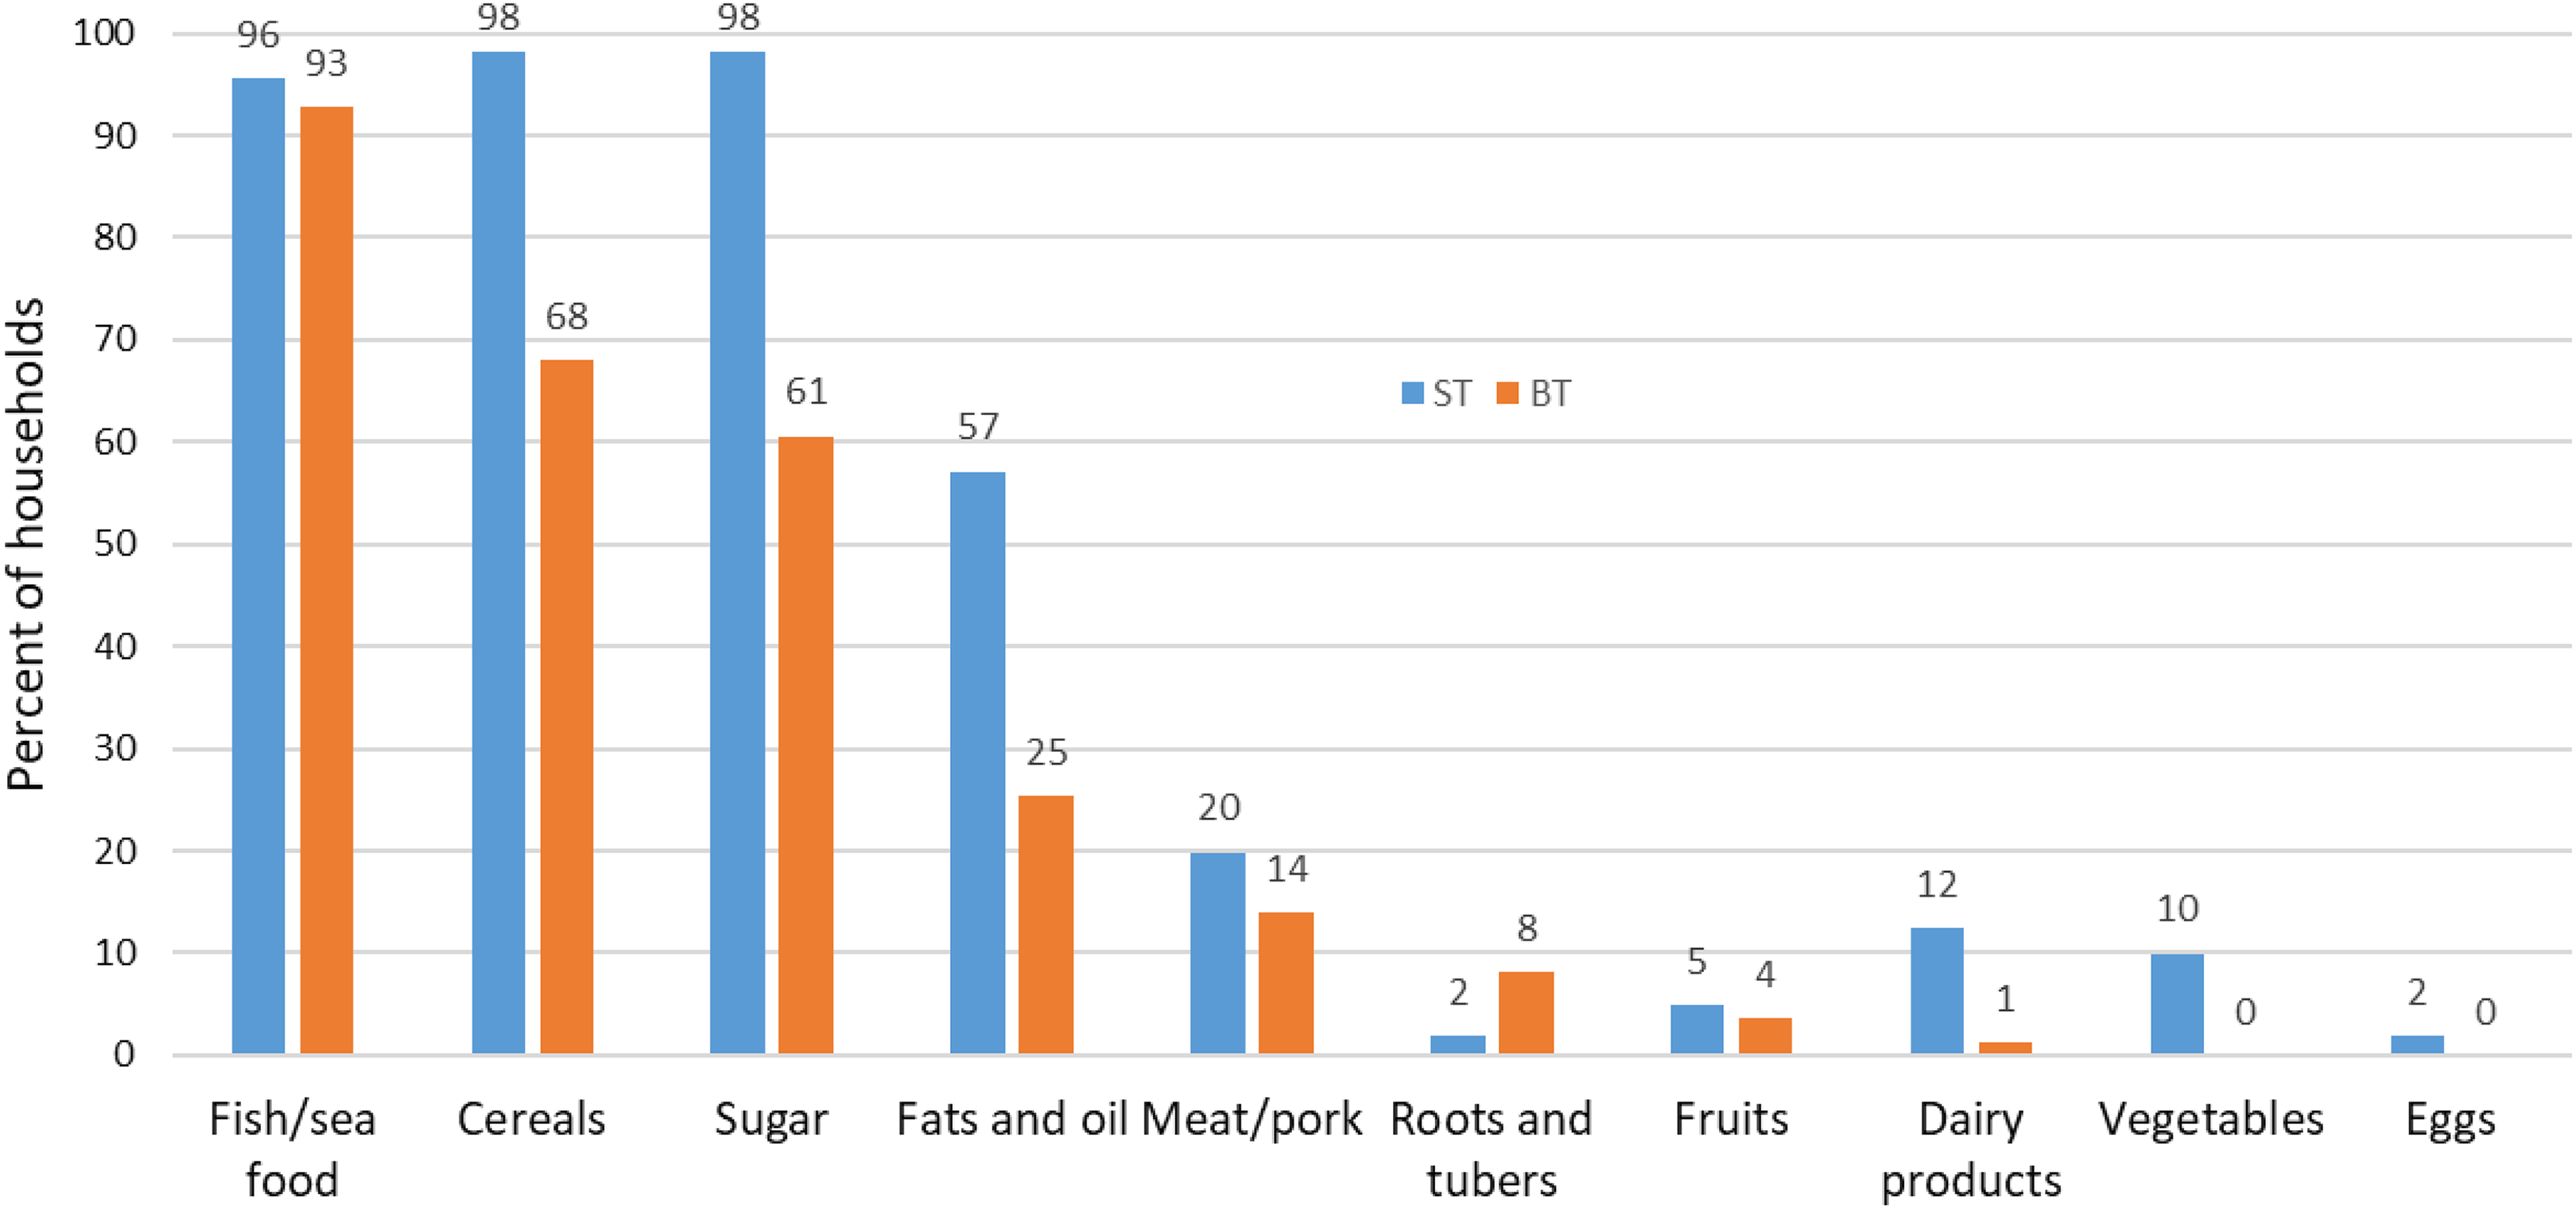
Food groups consumed by the participants in the 24-hour dietary recall by location.
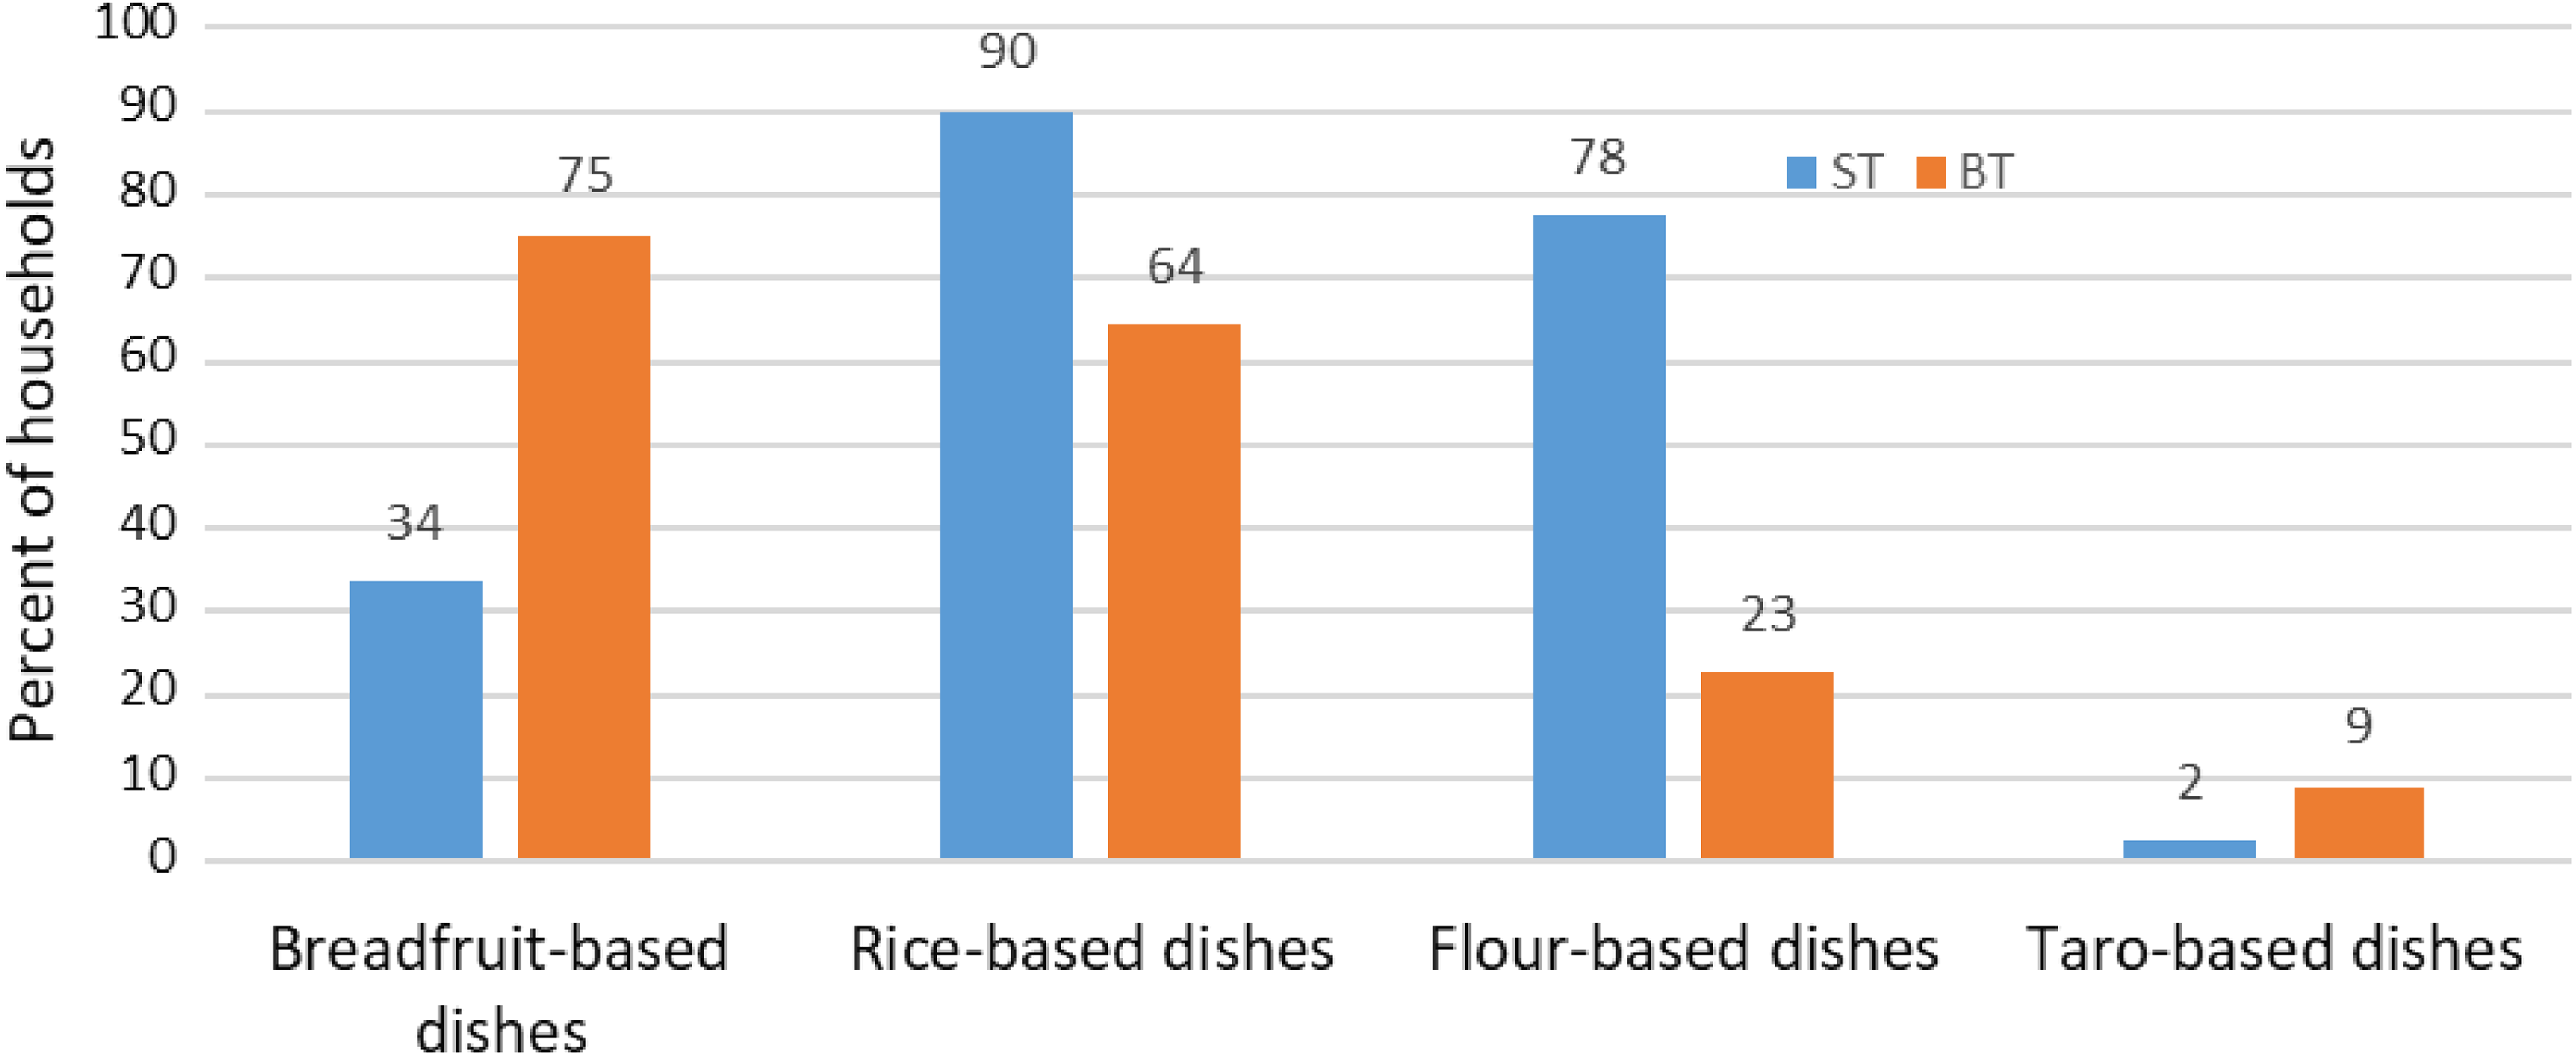
Dishes consumed by the participants in a 24-hour dietary recall by location.
Dietary diversity and FV
Across both locations over 60% of households had DDS and FVS of 1 to 3, and almost all had scores below 6 (Figure 3). Mean FVS (5.44 ± 1.92) was higher than the mean DDS (3.90 ± 1.25). The median DDS for both locations was 4. Between locations, the FVS and DDS were significantly higher in ST than BT (P < .0001). This difference was substantial with the ST/BT ratio of mean scores being 1.26 for FVS and 1.34 for DDS. Figure 4 shows for BT and ST (respectively): 49.2% and 20.7% of households had a low DDS; 48.8% and 75.7% had a medium DDS; and 2.3% and 3.8% had a high DDS.
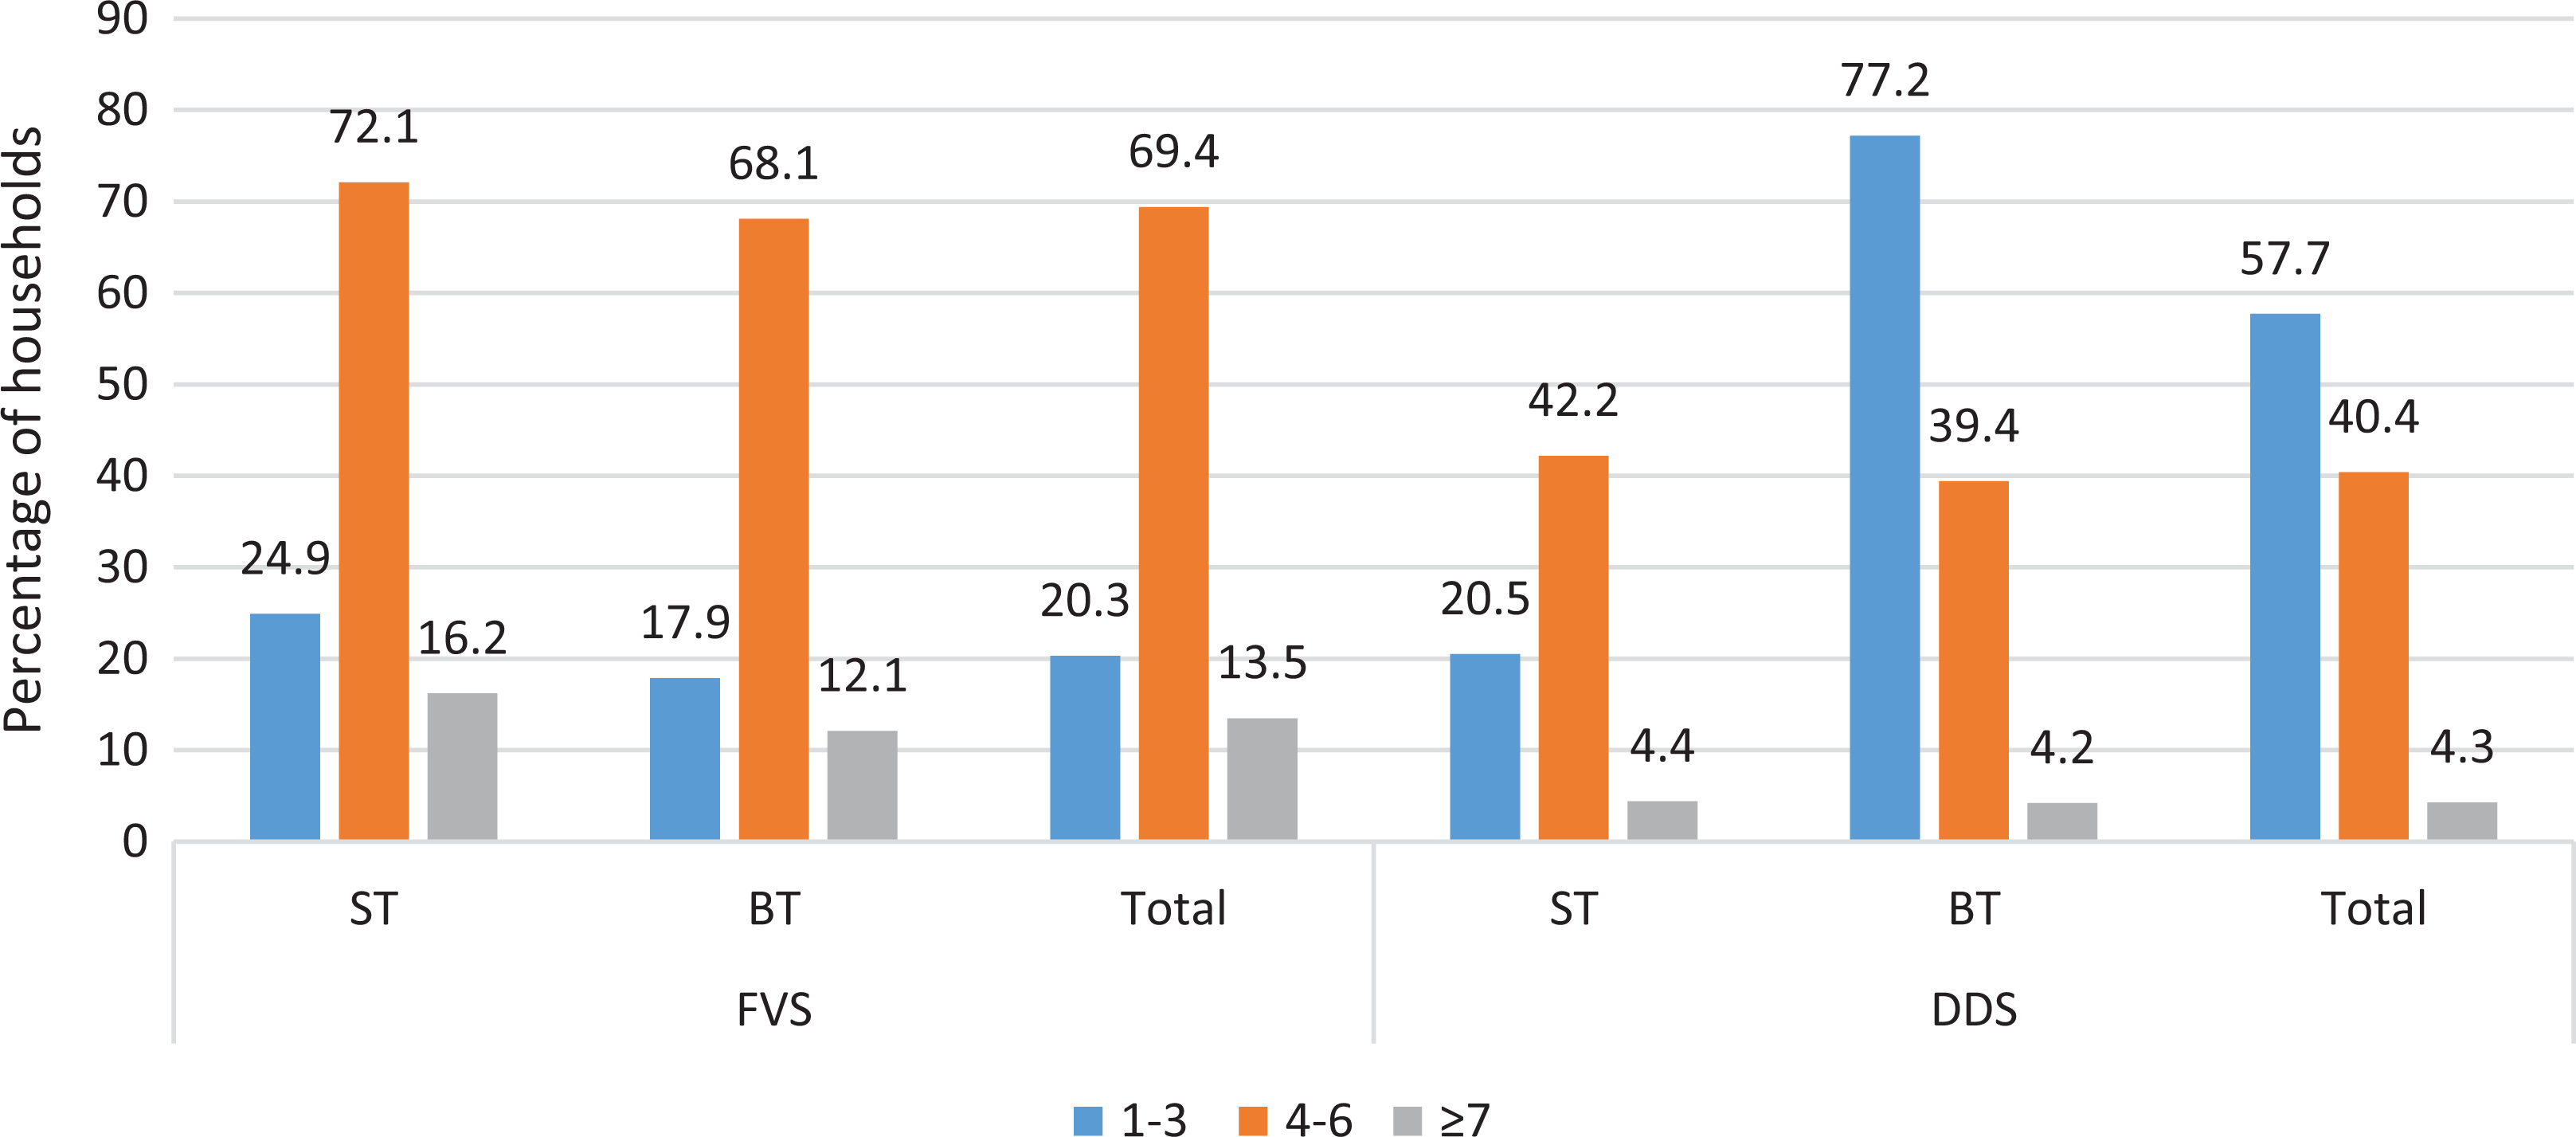
Distribution of the number of households according to FVS and DDS by location. (Note that the total number of households differ between locations: 161 for ST; 307 for BT.) DDS indicates dietary diversity score; FVS, food variety score; ST, South Tarawa.
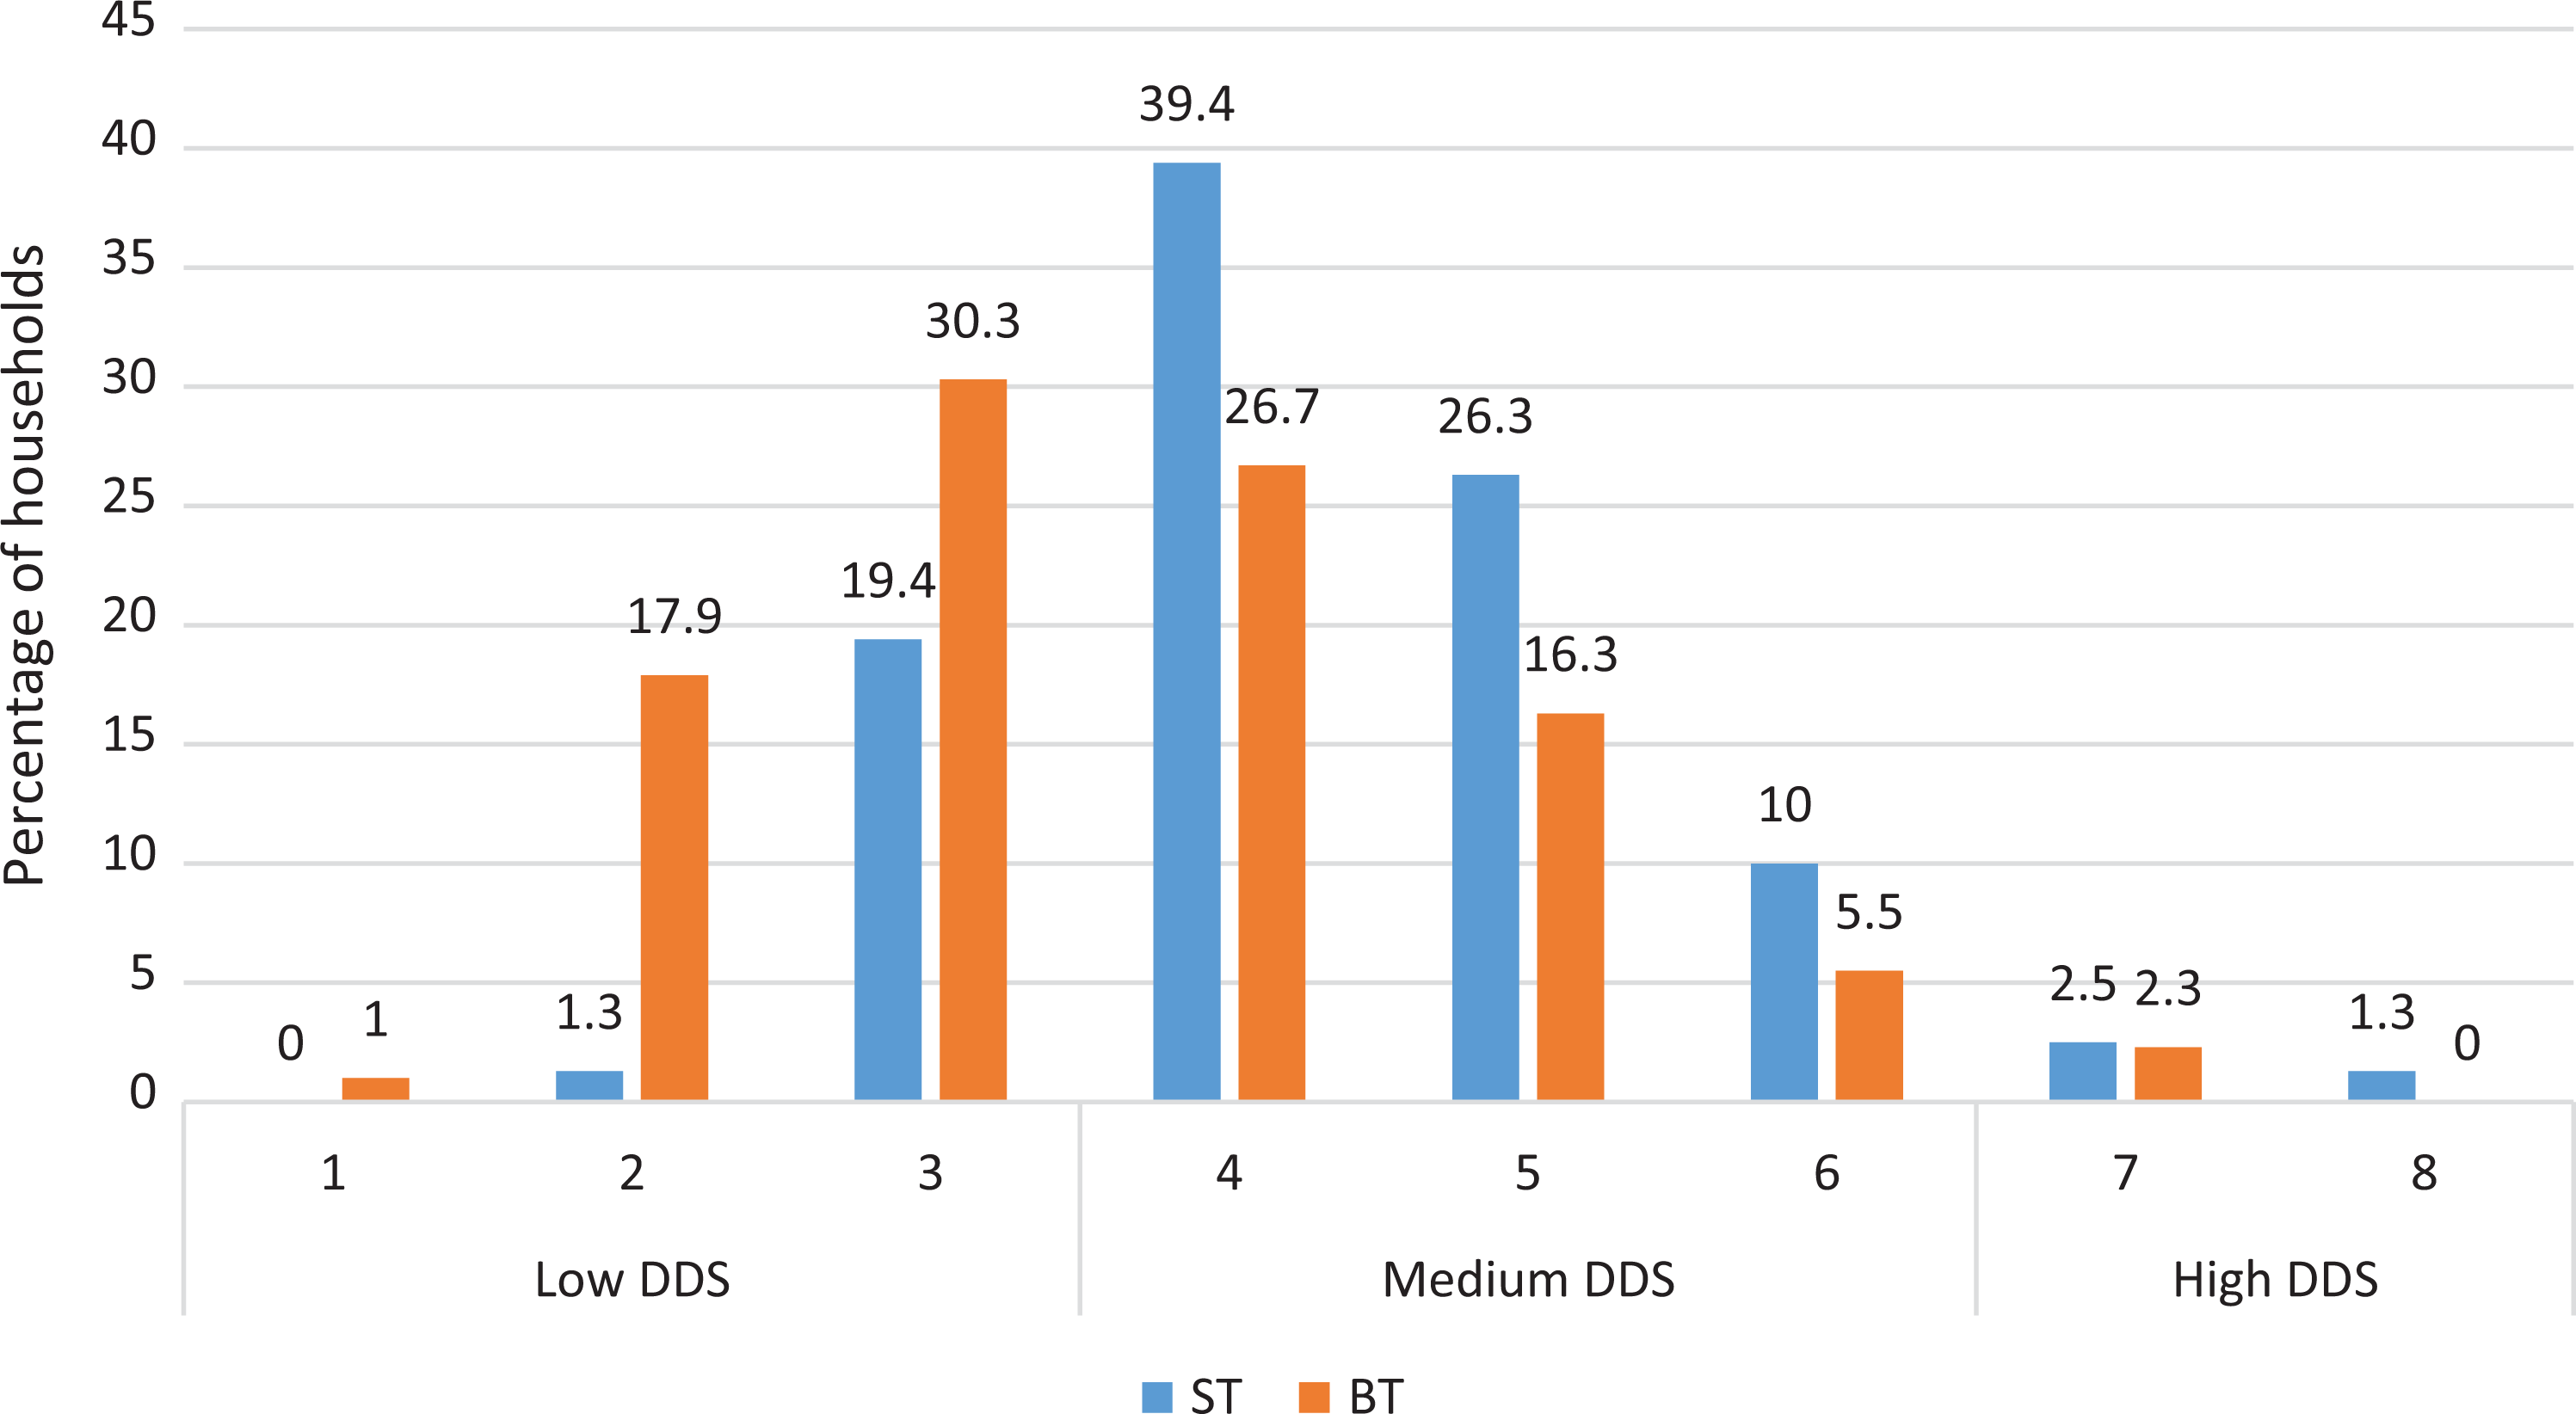
Classification of DDS by location. DDS indicates dietary diversity score.
Weighed Food Record Study
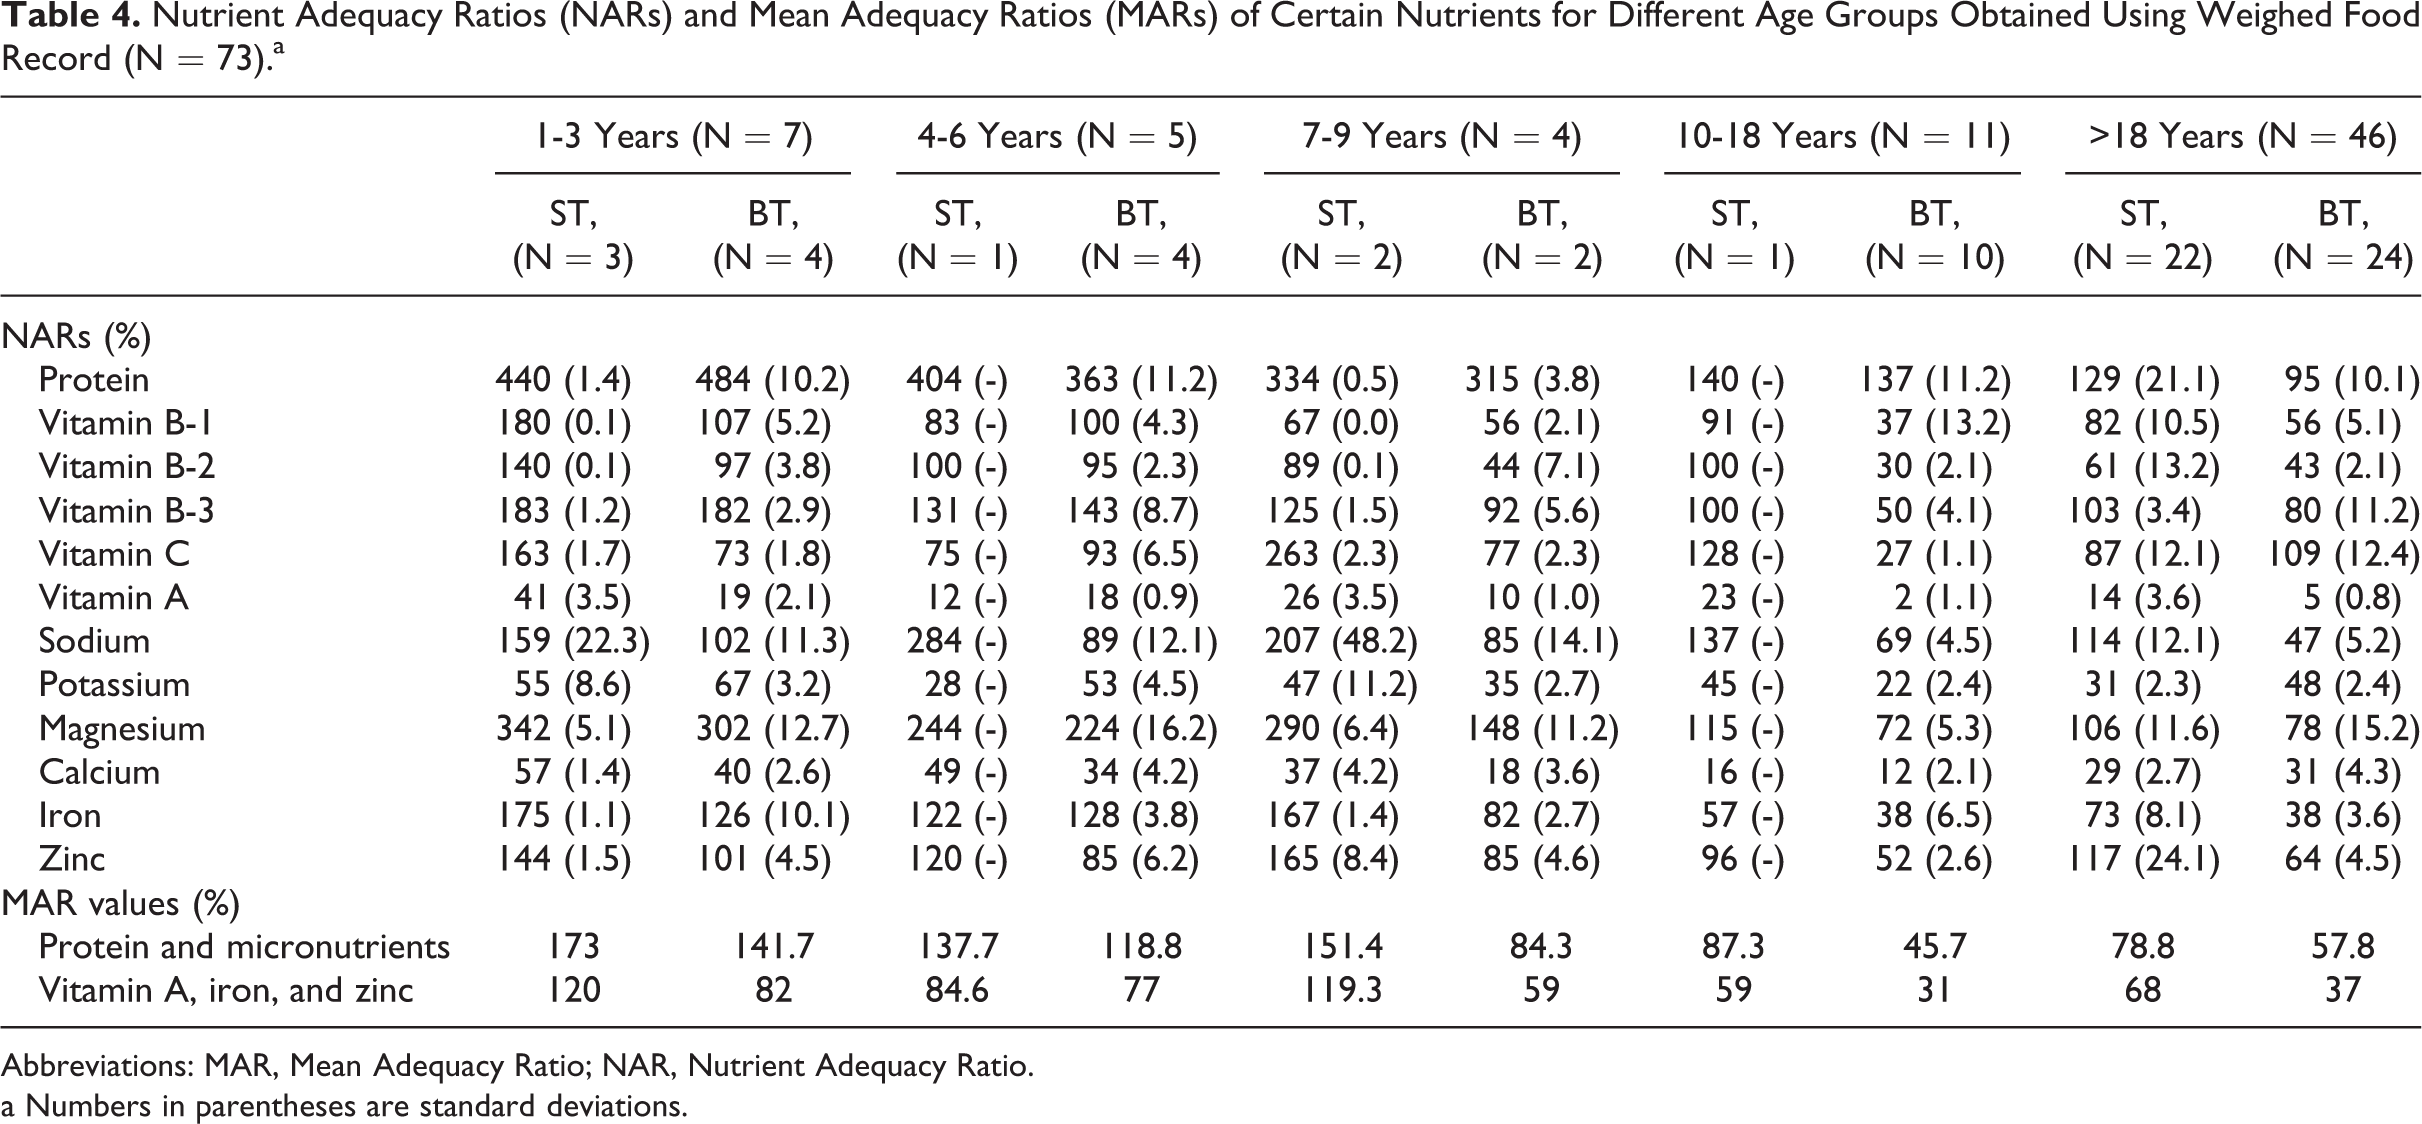
Nutrient adequacy ratios and MARs of selected nutrients by age-group obtained from the weighed food record are shown in Table 4. Over 60% of participants in both locations were adults, of whom most were fisher-folk, farmers, or civil servants.
Nutrient Adequacy Ratios (NARs) and Mean Adequacy Ratios (MARs) of Certain Nutrients for Different Age Groups Obtained Using Weighed Food Record (N = 73).a
Abbreviations: MAR, Mean Adequacy Ratio; NAR, Nutrient Adequacy Ratio.
a Numbers in parentheses are standard deviations.
Data for the 3 youngest age groups in Table 4 should be interpreted with caution due to the low sample numbers. However, for most nutrients results are generally consistent across these 3 age groups (1-3 years, 4-6 years, and 7-9 years) at each location, suggesting some degree of reliability. The one exception appears to be results for the two 7 to 9 year olds in BT which indicate lower micronutrient scores. This flowed through to a lower MAR in this age-group for the aggregate of proteins and micronutrients. Results for 10 to 18 year olds in ST should also be treated with caution as these only represent one participant.
Sample sizes for adults (>18 years) were larger and more evenly split (22 in ST and 24 in BT, Table 4); and more comparable to the larger 24-hour food recall survey results; although it should be noted that participants were not matched.
In ST, adults involved in the weighed food records study showed (on average) adequate but not excessive intakes of protein, vitamin B3, magnesium, and zinc. In BT, only vitamin C showed up as adequate. In both locations, average sodium intakes were excessive.
A focus on mean values can obscure the significance of variation between individuals, which should also be considered for nutrients that appear deficient. For BT, the percentage of participants estimated to meet the RNI follows the order (most to least): protein (95%) > vitamin B-3 (80%) > magnesium (78%) > zinc (64%) > vitamin B-1 (56%) > potassium (48%) > vitamin B-2 (43%) > iron (38%) > calcium (31%) > vitamin A (5%). For ST, the order is vitamin C (87%) > vitamin B-1 (82%) > iron (73%) > vitamin B-2 (61%) > potassium (31%) > calcium (29%) > vitamin A (14%).
Discussion
Major Dietary Components and Problem Areas
Based on minimum mean macronutrient distribution requirements per person per day, diets in ST and BT met or exceeded the minimum of 15%, 20%, and 45% energy from protein, fat, and CHO, respectively. 34 Participants from BT had significantly higher consumption of energy, fat, CHO, and protein for both sexes than their counterparts in ST. Rice, flour-based dishes, and sugar were the main contributors to energy and CHO in ST and BT.
Food intake patterns observed showed that the majority (>80%) of households in both locations consumed rice and sugar during the preceding 24 hours. These findings are not unique, either to Kiribati or to developing countries. Reporting on dietary intakes in Malaysia, Norimah, and Mohaideen 35 found out that 97% of participants consumed nasi putih (cooked rice) and sugar twice daily; while Badri et al 12 reported daily consumption of rice and sugar as 99.7% and 92%, respectively. This trend has also been observed in developed nations such as Japan 36 and South Korea. 37 We observed the consumption of rice-based dishes was also high among the households studied. Rice is the staple food for I-Kiribati population and a major contributor of energy for the households in this study. A key contributory reason for this is that imported rice is subsidized by the Kiribati government 38 making it both affordable and available. In addition to limited land available for planting crops, the relatively dry environment and coarse soil contributes to low traditional crops production.
Sugar is also a source of energy in ST and BT diets as reflected in the average daily intake of 49.5 g, double the World Health Organization recommended daily intake limit for sugar of 25 g. 39 High sugar intake leads to increased prevalence of dental caries, micronutrient deficiencies, diabetes, obesity, and heart disease, 40 and there is no reason to expect that health effects of this type would not also be being experienced by Kiribati households. Dental caries are prevalent in the Pacific Islands 41 ; dietary sugar consumption is linked to the presence of specific bacteria and sugar fermentation on the teeth. 42,43 The low consumption of fruits, dairy products, vegetables, and eggs observed (especially in BT) may be explained mainly by their cost—rather than limits to their availability. These foods are perceived as expensive and are most often sold by the people who produce them for income. Lower consumption of these foods leads to increased intakes of cheaper foods that are higher in energy and fat. According to the Secretariat of the Pacific Community, fruit and vegetable intakes in the Pacific Island Countries and Territories are well below the recommended level of 5 servings per person per day. 44 Low consumption of fruit and vegetables is often attributed to poverty and food insecurity in developing nations. 45
Micronutrient Intakes
For both locations, both dietary assessment methods showed marked low intakes of vitamin A and calcium. Vitamin A intakes were at their lowest prevalence in BT, whereby 24-hour recall, 76% of participants did not achieve the RNI (rising to 95% by weighed food records). In ST, the corresponding figure was 60% (86% by weighed food record). For calcium, 53% of BT and 71% of ST participants did not meet the RNI based on 24-hour recall; corresponding figures from weighed food records were consistent with these results at: BT 69% and ST 78%. Other micronutrients for which more than 30% participants showed intakes below the RNI based on 24-hour recall were iron and zinc (both locations), and vitamin B-1, vitamin B-2, potassium, and magnesium (ST).
In keeping with these results, the 24-hour dietary recall showed that mean intakes of men and women in ST at below their recommended levels for vitamin A, vitamin B-2, vitamin B-3, potassium, magnesium, calcium, iron, and zinc. Diets in BT showed 4 fewer deficient nutrients (on average) compared to those in ST. Mean intakes in BT were low in vitamin A, calcium, iron, and zinc. This variation can be linked to the consumption of more local traditional foods in BT, including breadfruit, coconut, and a wider variety of seafood such as crab, eel fish, and octopus.
As discussed above (and shown in Tables 1 and 4), for all age groups in both locations, vitamin A and calcium intake were inadequate; and the requirement for dietary iron intake was not met for those 10 years and over for both sexes. These nutrients are of public health significance. Vitamin A deficiency is a well-known problem in Pacific Island states as it causes night blindness and increase the vulnerability to other disorders such as iron deficiency. 46 Vitamin A deficiency can be targeted through promotion of specific varieties of yellow-flesh bananas that are rich in provitamin A. 47 Calcium deficiency causes bone mass reduction by increasing bone resorption to preserve the level of ionized calcium in the extracellular fluid. 48 In the absence of available dairy products, dried and ground fish bones provide a valuable alternative to increase calcium intakes. Iron deficiency has been shown to be linked to impaired cognitive and physical performance, even in the absence of anemia. 49 Mild and moderate zinc deficiency may manifest in reduced sense of taste, reduced sperm counts, chronic liver disease, chronic renal disease, and malabsorption syndrome. 50 Sodium intakes were excessive—high sodium intake is recognized as a risk factor for osteoporosis because it alters calcium metabolism by increasing urinary calcium excretion. 51
Vitamin A deficiency in Kiribati has been established in several studies. 52,53 Work carried out in the 1990s showed a high proportion of children manifesting clinical vitamin A deficiencies in the form of xerophthalmia and xerosis. Although our study was based on dietary and not clinical assessment, our results highlight that 3 decades later, dietary intakes of vitamin A in Kiribati are likely to remain critically low. In addition, they are likely to be accompanied by moderate to severe deficiencies in several other micronutrients.
Dietary Diversity and FV
The median DDS of 4 and the mean FVS of 5.4 of the study population were low, indicating an overall poor diet quality. The scores were similar to those of other studies conducted among adult householders in East and West Africa; and Middle East. 3,11,54 The use of DDS as a measure depends on the number of food groups assessed, for instance, in a study done among Kenyan households, the median DDS was 6 but this was out of 12 food groups. 55 Care must also be taken when comparing dietary scores from different studies because food groups may be sorted by food use, food origin, or nutritional value. In this study about half of the participants had a monotonous diet with a notably low DDS of only 2 to 4 food groups per day. These participants consumed a diet containing cereals, fish/seafoods, and usually sugar or oil. These results are similar to findings reported from rural Burkina Faso and Tanzania, where the participants had a low DDS of only 2 or 3 food groups consumed. 3,11
Participants from ST had a significantly higher DDS and FVS than those in BT, which could be attributed to their higher socioeconomic status. South Tarawa is the commercial hub of Kiribati and a more economically viable center where many more of the participants had a secondary school education, compared to BT. Many studies have shown the influence of socioeconomic variables such as income and education on the consumption patterns and food choices of populations. Some studies in developing countries have found households in middle income groups spend more on foods with higher palatability and diversity, 56 and work from the United States 57 to Portugal 58 has demonstrated a positive effect of education on the selection of food varieties. The higher DDS and FVS in ST than BT is likely to reflect greater purchasing power, and the availability of specific nonindigenous options, or nonavailability of many traditional foods. Notably this did not reflect to more adequate nutrient intakes in ST than those in BT. As an overall average across both 24 hours and weighed food record results, only protein, vitamin C, and Vitamin B-3 show up as being at adequate mean intake levels in ST diets. Whereas mean potassium and magnesium intakes in BT would be sufficient, in ST they are deficient—on average 3.1 and 1.6 times lower than the mean BT intakes. Mean calcium intakes are also low in both locations but 1.5 times lower in ST than BT.
This apparent paradox of higher DDS in ST being accompanied by lower nutritional content can be explained by the nature of increased food diversity in ST, which involves a higher reliance on refined and ultraprocessed foods. This in turn highlights the limitations of using DDS and FVS as proxies for assessing likely nutritional adequacy. Such limitations may apply particularly to developing counties where an increase in DDS and FVS may reflect the transition between a relatively balanced traditional diet of low diversity and the wider range of an incoming westernized diet. The DD instrument does not address ultraprocessed food types. While some of these would be relatively simple to include in the instrument (eg, bakery goods or biscuits under the high CHO food product category), they would most often currently be included in the same broad category as more healthy foods, such as rice or oats. 59
Strengths and Limitations
This is the only SIDS study in which weighed food records have been used to support 24-hour dietary recall information in the dietary assessment. On Kiribati’s 16 atoll islands, we only studied 2; thus, this study alone cannot be generalized to either represent the broader Kiribati community or represent the exact situation on any of the other 14 islands. However, our results are indicative of the likely state of urban and rural populations in Kiribati and it is unlikely that the marked micronutrient deficiencies we have found in urban ST and rural BT would not be more widely spread. A second limitation was that dietary data were collected for only one recall period, in one season and at a time of plenty or harvest. However, in theory, this should have resulted in increased DD, as more foods are available to select from. This implies that the results observed may in fact underestimate the problem. Dietary assessment must be treated with some caution. While the training and attention given to adherence of protocol attempted to ensure a quality dietary assessment, an accurate assessment of nutrition status requires a combination of dietary, anthropometric, biochemical, and clinical measures. 60 We also chose not to restrict analysis to only participants with potential misreporting EI-BMRest <1.10 and >2.19.
Conclusions
Food consumption patterns of participants in ST and BT reflect a high reliance on nontraditional diets and refined foods, along with refined sugar. These are evident at both locations but more pronounced in the urban (ST) where intakes of rice and flour-based dishes are higher than the rural (BT) location, and where consumption of traditional foods such as breadfruit and taro is higher in rural (BT) than ST. Reliance on refined foods along with high intakes of sugar and salt has resulted in low intakes of several micronutrients strong risk factors for noncommunicable diseases such as obesity and diabetes.
Intakes of several micronutrients—in particular vitamin A, calcium, and iron, and zinc—were notably deficient in both urban (ST) and rural (BT) Kiribati households. Overall, the participants consumed a low diversity of foods. However, it is essential to consider not only diversification of diets but also the quantity and frequency of food intake of different food groups in order for an individual to attain nutrient adequacy. 15 Despite higher DDS and FVS scores evident in the urban location, a greatest number of deficient nutrients were observed. In this Pacific Island state, DDS and FVS appear to be unreliable as indicators of nutritional adequacy and instead reflect the increased food choices that can characterize the influx of a westernized diet.
Malnutrition will continue to be a major concern in Kiribati if nutrient intake is not improved through diet diversification toward more traditional and healthy foods. Exploration of the potential for food-based dietary interventions is recommended. These could include policies or programs to enhance the use of indigenous fruits and vegetables, and promotion of specific indigenous or Pacific Islands foods using locally available resources to target specific areas of concern.
Footnotes
Authors’ Note
Mr Paul Eze Eme carried out all fieldwork, undertook primary data analysis and interpretation, prepared draft manuscripts, and completed the revisions. Dr Nick Kim involved in the conception and design of the study, technical input into the manuscript, and the overall scientific management. Professor Barbara Burlingame was involved in the conception and design of the study and the overall scientific management. Professor Jeroen Douwes was involved in the conception and design of the study, technical input into the manuscript, and the overall scientific management. Dr Sunia Foliaki was involved in the conception and design of the study as a PhD supervisor an expert on the Pacific Islands. Associate Professor Carol A. Wham provided valuable technical input on interpretation of findings and content of the manuscript.
Acknowledgments
The authors wish to acknowledge Caritas Aotearoa (funding support), Director, Women Development Centre and the participants in Kiribati; and the Government of Kiribati.
Declaration of Conflicting Interests
The author(s) declared no potential conflicts of interest with respect to the research, authorship, and/or publication of this article.
Funding
The author(s) disclosed receipt of the following financial support for the research, authorship, and/or publication of this article: This work was funded by Caritas Aotearoa New Zealand. The funder had no role in the design, analysis or writing of this article.