
Abstract
Background:
Nutritional status has important implications for labor productivity, lifetime earnings, and country-wide economic development. Dietary diversity is an important contributor to nutrition.
Objective:
To identify how patterns of food consumption are related to dietary diversity and to measure the potential for policy interventions to influence diet complexity.
Methods:
Household dietary diversity scores were constructed using data from 11 809 rural and urban households surveyed in Nepal between 2013 and 2016. Diversity scores were based on 7-day recall information on food purchases and food consumed directly from agricultural production. Reported consumption from 14 food groups was mapped into 4 distinct dietary patterns via latent class analysis. Ordered probit regressions were used to identify factors associated with observed diet patterns.
Results:
Diets are heterogeneous and map into 4 clusters along a continuum of complexity. Three identified diets are vegetarian and 1 is nonvegetarian. Diet complexity is associated with geography and socioeconomic features of the sample. On average, poor and agricultural households have less complex diets and households receiving remittances have more complex and higher quality diets. Road density is positively correlated with diet complexity. We find evidence of modest reductions in diet quality over the sample period.
Conclusions:
Results confirm heterogeneous dietary behavior of Nepalese households. The identified patterns could be used to more effectively target policies directed at nutrition education or efforts to improve health by diversifying and improving the nutritional quality of household diets, for example, through supplemental feeding programs, home garden promotion, or targeted food assistance programs.
Introduction
Dietary diversity underpins nutrition, and an individual’s nutritional status has important implications for labor productivity, lifetime earnings, and country-wide economic development. 1 Poor nutrition undermines human capital formation directly, through losses in physical productivity, and indirectly, through losses in cognitive development during childhood. 2 -5 At weaning, complementary feeding from a diet that is diverse in both quality and quantity is necessary because breast milk cannot meet the energy and micronutrients needs for healthy development. 6 Beyond weaning age into adulthood, a diverse diet is essential for meeting energy and nutrient requirements. 7 Diets drive a range of health outcomes including birthweight and anthropometric status, hemoglobin concentrations, hypertension, and cardiovascular disease and cancer. 8 Low dietary diversity has been associated with low birthweight in India, 9,10 Northern Ghana, 11,12 and rural Ethiopia. 13 In young children, a diverse diet is positively associated with anthropometric outcomes such as height-for-age, weight-for-height, weight-for-age, and mid-upper arm circumference. 14 -16 Furthermore, evidence suggests the association between nutrition and dietary diversity can be independent of socioeconomic factors such as household income and wealth. 17
Although dietary diversity is often described by individual foods consumed, individuals typically consume composite diets from foods that households combine in familiar and regular patterns reflecting availability, preferences, habits, and cost. Households may substitute individual food items into or out of their diets on the basis of transitory circumstances, but the overall composition of a household’s diet is often directly anchored to a particular eating pattern. This is especially the case in Nepal, where geography, markets, and economic circumstances circumscribe the options available to households. In order to develop a better understanding of overall diet choice, we investigate in this article dietary diversity in the context of whole diets, asking 2 questions: (1) How are typical diets in Nepal constituted out of the consumption patterns we observe? and (2) What factors, including those amenable to policy intervention, explain variation in these diet choices across households?
To answer these questions, we use 3 rounds of Nepal’s Annual Household Survey (AHS) to calculate household dietary diversity scores and apply latent class analysis (LCA) to identify emergent dietary patterns in this population of households. Then, taking diets as observed data, we use regression analysis to measure the socioeconomic, cultural, and geographic factors that explain how households sort into diet categories. The LCA techniques have been previously used to identify dietary patterns. For example, LCA has been used to study how dietary patterns in the United Kingdom conform to World Health Organization dietary guidelines 18 ; to explain spillover effects in a dietary change intervention project in the United States 19 ; and to identify dietary patterns in Indian women, 20 Brazilian adolescents, 21 and Brazilian adults. 22 Latent class analysis also has been used to identify temporal eating patterns and their relationship to hypertension and blood pressure in Australian adults, 23 to identify diet patterns consumed throughout the day in Irish adults, 24 and to reveal diet patterns varying in milk and solid food for 9-month-old infants. 25 This is among the first studies to apply this technique to household diets in a nationally representative sample of low-income households.
Methods
Data Sources
We used 3 waves of the Nepal AHS to compile a data set consisting of 11 771 households. These data, collected by the Central Bureau of Statistics, cover the years 2013/2014, 2014/2015, and 2015/2016. 26 The AHS uses the sampling frame of Nepal’s 2011 National Population Census and enumerates a balanced set of households from equal numbers of urban and rural primary sampling units. We supplemented the household-level AHS data with district-level data from the 2011 Nepal Census 27 and information on road infrastructure as of 2011. 28 To classify households as agricultural or nonagricultural, we used the Organization for Economic Co-operation and Development (OECD) definition of an agricultural household: A household is considered agricultural if at least one of its members is operating a holding or if the household head reported being economically active in agriculture.
An important shortcoming of the AHS data is that it includes no identifying information on the ethnicity or religion of respondents. Both could be widely expected to influence diet choices. Although the AHS data provide no opportunity to directly test for the importance of ethnicity or religion, we estimated all regressions incorporating fixed effects at the village level, using Nepal’s designation of Village Development Committee (VDC). At the time of the survey, VDCs were the lowest administrative unit in the country, and 98 VDCs were included in these AHS surveys. Although we cannot be certain that ethnicity or religion is homogeneous within VDC or that a binary VDC-level variable controls for all cross-VDC differences in religion or ethnicity, including these fixed effects helps to account for such differences, as well as other unobserved geographic and demographic differences that are separate from ecological zone.
Dietary Diversity Scores
Measures of dietary diversity indicate the degree of access to a variety of foods by using a reference point to count the different food or food groups consumed. A dietary diversity score measures both nutrient availability and the economic ability to access those nutrients. To categorize dietary diversity among sample households, we employed a modified version of the Food and Agriculture Organization (FAO)’s household dietary diversity score, 29 applying it at the household level based on a 7-day recall period. The FAO method aggregates all food consumed within the recall window into 12 key food groups. To provide a more complete analysis of the potential nutritional content of diets, we further disaggregated the vegetables and fruits categories, resulting in the following 14 food groups: (1) cereals; (2) white tubers and roots; (3) green leafy vegetables; (4) other vegetables; (5) vitamin A rich fruits; (6) other fruits; (7) meats; (8) eggs; (9) fish and seafood; (10) pulses, legumes, and nuts; (11) milk products; (12) oils and fats; (13) sweets; and (14) spices, condiments, and beverages. We assigned to each household a value of 1 for a food category if the household reported at least 1 member consuming from that category during the recall period. The diversity score has a minimum possible score of 1 and a maximum possible score of 14. One limitation of this approach is that the data, which were collected to analyze dietary diversity, are being repurposed for pattern identification, and the 14 chosen categories may be somewhat limited or inappropriate to the task. For example, we cannot be certain that Nepalese consumers recognize the nutrient content of foods consumed, in particular vitamin A-rich foods, which we separate out as stand-alone categories. To the extent the FAO categories differ from the underlying categories consumers use when making consumption decisions, our approach may introduce noise. The AHS does not provide information on the types of foods consumed outside the home; we therefore cannot measure the impact of this consumption on diet diversity, although we do account in the analysis for whether any food was consumed outside the household during the reporting window.
Expenditure Shares
To gain further insight into consumption patterns, we aggregated total expenditures, total food expenditures, staple food expenditures, and animal-sourced food expenditures, including in our measure of expenditure cash outlays as well as the value of own-produced food retained for household consumption. We then computed expenditures per capita for each category, using an OECD-modified equivalence scale, 30 whereby the size of each household was adjusted to reflect needs within the household by weighting occupants. The head received a weight of 1, each additional adult member was assigned a weight of 0.5 and each child was assigned a weight of 0.3. We then used linear regression to calculate various expenditure elasticities, incorporating controls for years and districts. We also calculated these elasticities categorized by sex, location of residence (urban/rural), agroecological zone, and education. The 3 official agroecological zones of Nepal—the terai, the hills, and the mountains—are designated based on biophysical and climate characteristics (varying from tropical in the terai [17% of land area] through subtropical and cool, but snow-free in the hills [68% of area], and alpine and seasonally cold in the mountains [15% of land area]). The designation also reflects differences in economic, cultural, and political circumstances.
Our measure of expenditure on animal-sourced foods accounts for all reported household expenditures on meat, eggs, fish, and dairy. Some households reported zero expenditure on animal-sourced foods; to include these observations when calculating elasticities, we used the inverse hyperbolic sine transformation. 31
Latent Class Analysis
Using LCA, we allowed the data to identify distinct dietary patterns from our 14 food groups. The LCA method assumes that our categorical variables belong to a set of unobserved classes, but that the number and size of these classes are unknown. 32 Covariation among observed categorical variables is generated by their relationship with the latent variables. 33 If these latent variables are properly defined, the covariations in the observed variables should be reduced to mainly chance covariation. In the context of diets, we hypothesize that underlying diet types define consumption across the 14 food categories. If such diets exist, LCA should identify them.
We used Stata 15 to estimate multiple LCA models. 34,35 Each class represents a distinct dietary pattern. To allocate each of the 14 food groups to a diet, we used the rule of thumb that the marginal probability of each food group falling within a class should exceed 80%. In some cases, all marginal probabilities fell below 80%. For these, the food category was excluded from the diet if its marginal probability was substantially smaller than those for other food categories.
We determined the number of classes to best describe our dietary patterns using a bootstrap likelihood ratio test. This method calculates a P value by comparing the k-1 class model to the k class model to determine whether there is a statistically significant improvement associated with increasing the number of classes from k-1 to k.
36
That is, the P value determines whether we should reject the k-1 class model in favor of the k class model. A small P value (P < .05) suggests the k class model gives a statistically better fit than the k-1 class model. To obtain these P values, we followed 4 steps: We estimated the k-1 and k class models and used the resulting log likelihoods to calculate the value of −2 × log likelihood difference; Under the null k-1 class model, we repeated step 1 with a bootstrap sample; We repeated steps 1 and 2 independently, many times, to estimate the distribution of the log likelihood difference; and We compared the distribution in step 3 with −2 × log likelihood difference to estimate the P value.
Based on LCA results, we created an ordered categorical variable, diet. This categorical variable serves as the dependent variable in regressions to explain diet choice.
Ordered Probit Regression
To understand correlates with observed diet patterns, we use a series of ordered probit regressions. We appeal to the logic of the nesting of observed diets when selecting the ordered probit model for the analysis. There is a clear progression in the food baskets observed, starting with a simple staple-based diet and continuing through increasingly more diverse diets. Each category is mutually exclusive and each diet in the sequence represents a modification of the preceding diet that results from adding additional items to the food basket. Although we cannot be certain that the more diverse diets observed are nutritionally superior to less diverse diets, the ordering is logical in terms of additions to a market basket, even if the ordering is driven by a desire for variety rather than improved nutrition. An alternative approach would be to assume no underlying diet ordering and estimate choices using a multinomial model. Results from those models (not reported here) provide similar insights. The ordered probit regressions are based on:

where indexes households; H is a vector of household characteristics including education, age, household size, the presence of a remitter in the household, sex of the household head, wealth, total expenditure per capita, whether the household is agricultural, and whether any household member reported eating food away from the home; G is a vector of control variables including indicators for survey rounds (years 2013 and 2014), controls for ecological zone (mountains, hills and terai), and urban residence; and D represents a vector of district-level variables that includes average farm size, road density, poverty incidence, and a binary indicator of the presence of a government-sanctioned nutrition intervention program in the district. Wealth (accumulated savings) and income (current expenditures) are correlated, but not perfectly so, and therefore we included both as explanatory variables. Similarly, we included a binary indicator of whether the household received remittance income to test whether remittance income might be treated differently from other income when selecting diets. To account for possible nonlinearities in associations with the dependent variable, several continuous explanatory variables (expenditures, wealth, household size, and road density) were log transformed before they entered the regressions.
Results
Descriptive Statistics
Table 1 contains descriptive statistics for the sample, which contains 11 771 households, almost evenly divided between urban and rural locations, with 5% living in the mountains and 46% and 49% living in the hills and terai, respectively. The average household consists of 5 members (2.65 adult equivalents). Two-thirds of households can be classified as agricultural, 73% are male-headed, and 40% reported remittance income. The mean age of a household head is 44 years and the mean educational attainment of a household head is 5 years. Average household wealth is US$2978 and total annual expenditure per capita is US$1058. On average, a sample household spent US$546/year/person on food. Of this, US$142 (26%) was spent on staples and $181 (33%) was spent on animal-sourced foods. The average household dietary diversity score is 10.
Descriptive Statistics for the Nepal Annual Household Survey for 2013/2014, 2014/2015, and 2015/2016.a,b
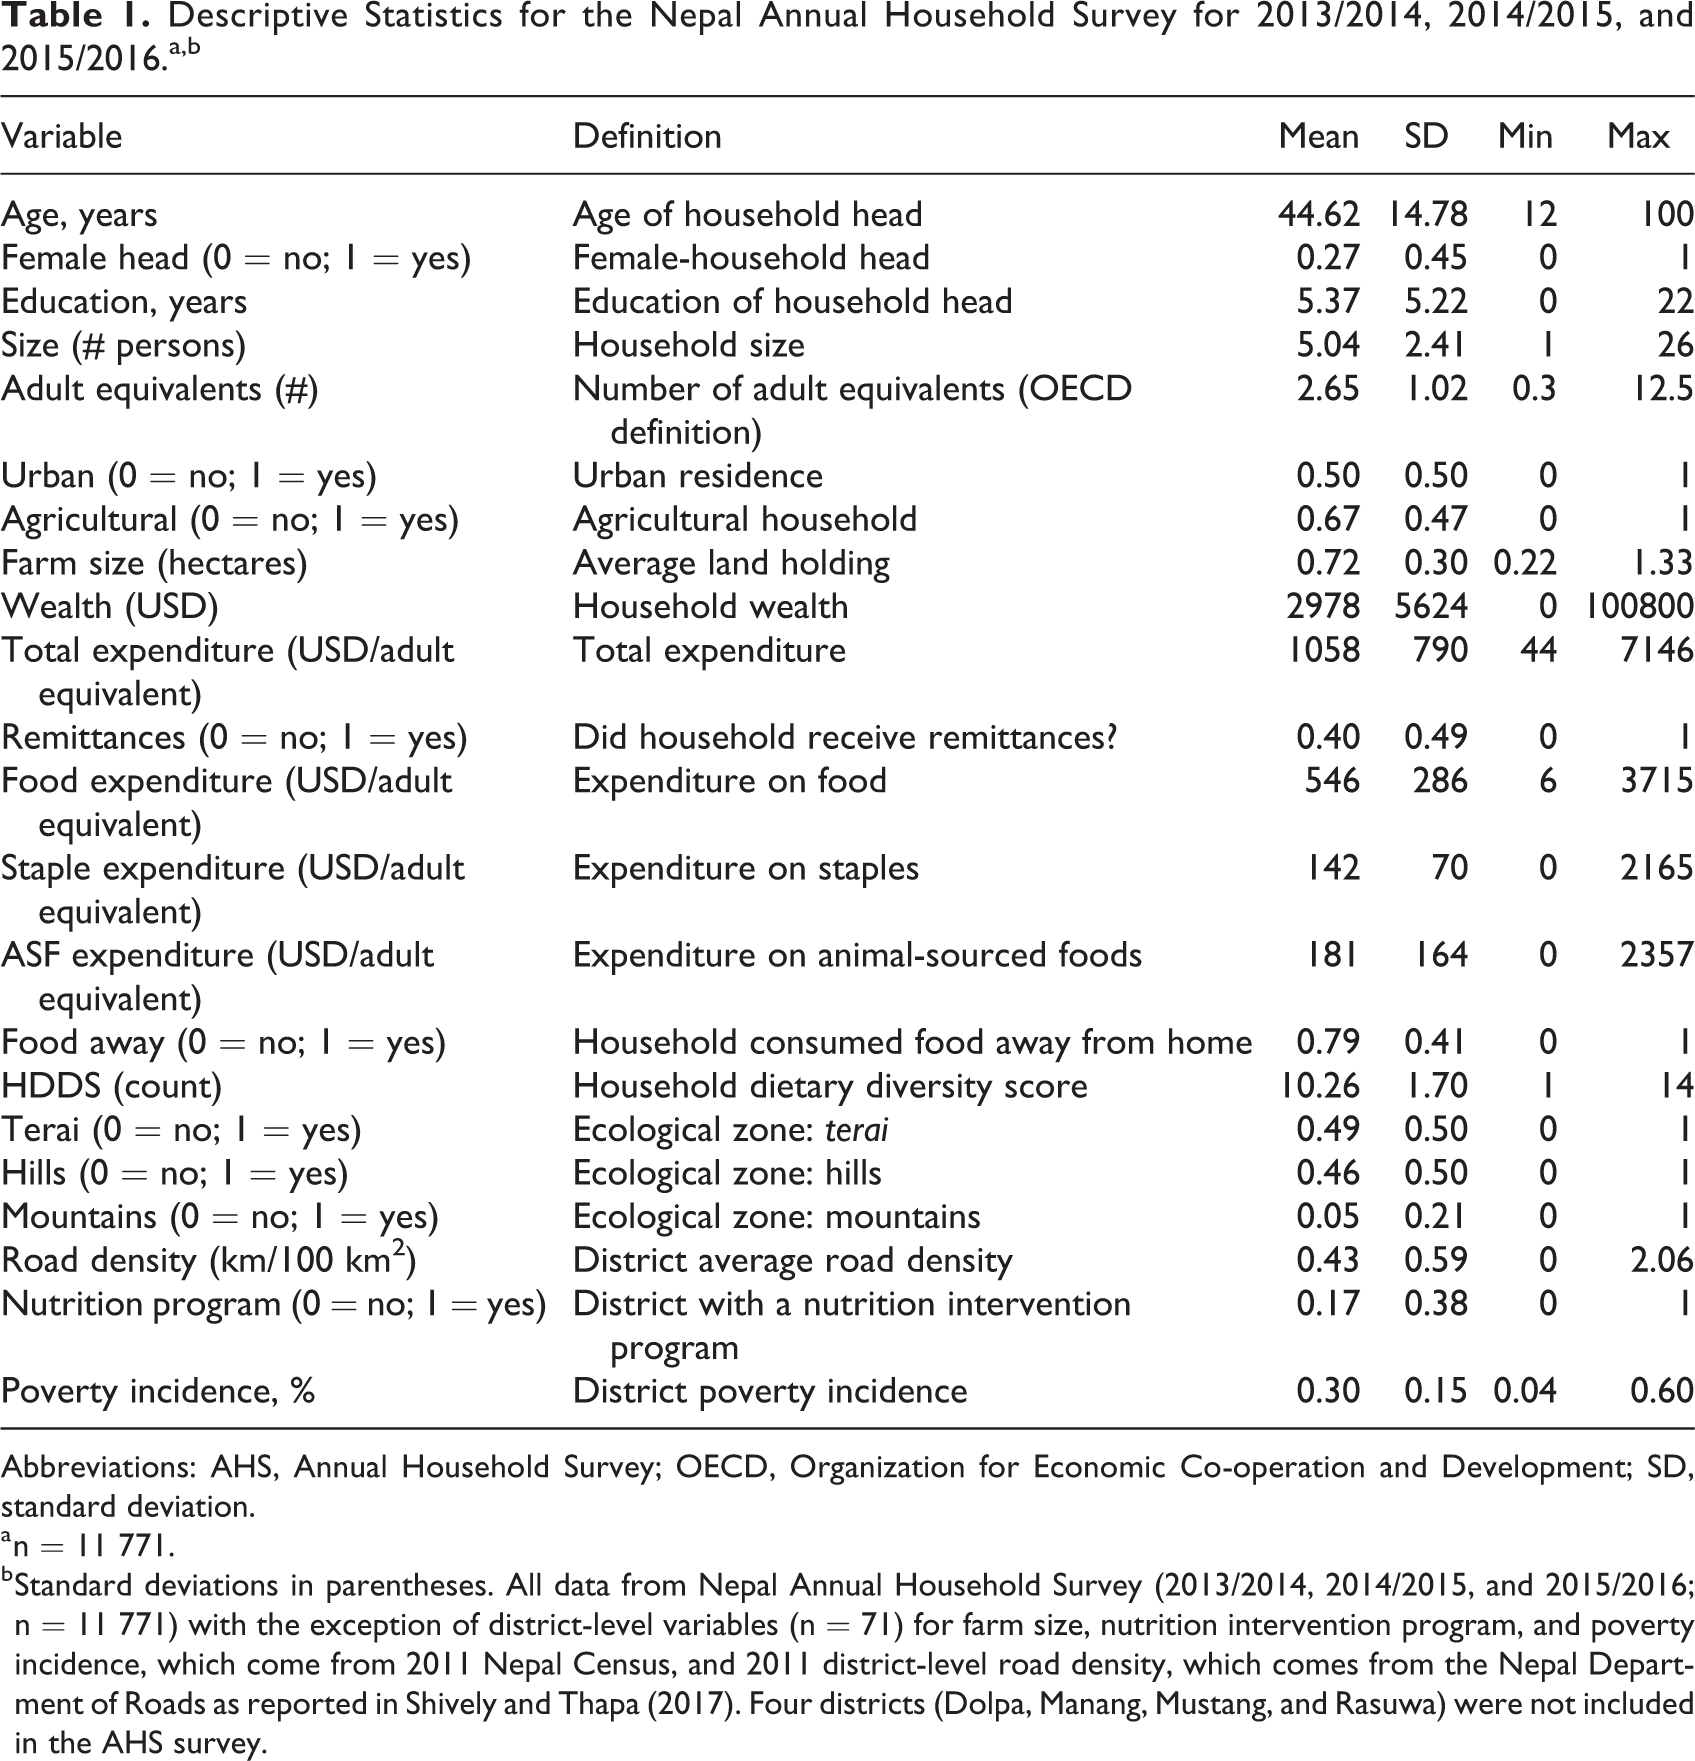
Abbreviations: AHS, Annual Household Survey; OECD, Organization for Economic Co-operation and Development; SD, standard deviation.
a n = 11 771.
b Standard deviations in parentheses. All data from Nepal Annual Household Survey (2013/2014, 2014/2015, and 2015/2016; n = 11 771) with the exception of district-level variables (n = 71) for farm size, nutrition intervention program, and poverty incidence, which come from 2011 Nepal Census, and 2011 district-level road density, which comes from the Nepal Department of Roads as reported in Shively and Thapa (2017). Four districts (Dolpa, Manang, Mustang, and Rasuwa) were not included in the AHS survey.
Results for Dietary Diversity Score Analysis
Sample households in the mountains had a lower diversity score (9.25) than those in the hills (10.36) or the terai (10.25). Twenty districts had diversity scores above average; only 1 (Mugu) had an average dietary diversity score below 8 (Figure 1). Diets tend to be more diverse in urban areas, for nonagricultural households, and for female-headed households. The average diversity score declined slightly from 2013 to 2015 (Table 2).
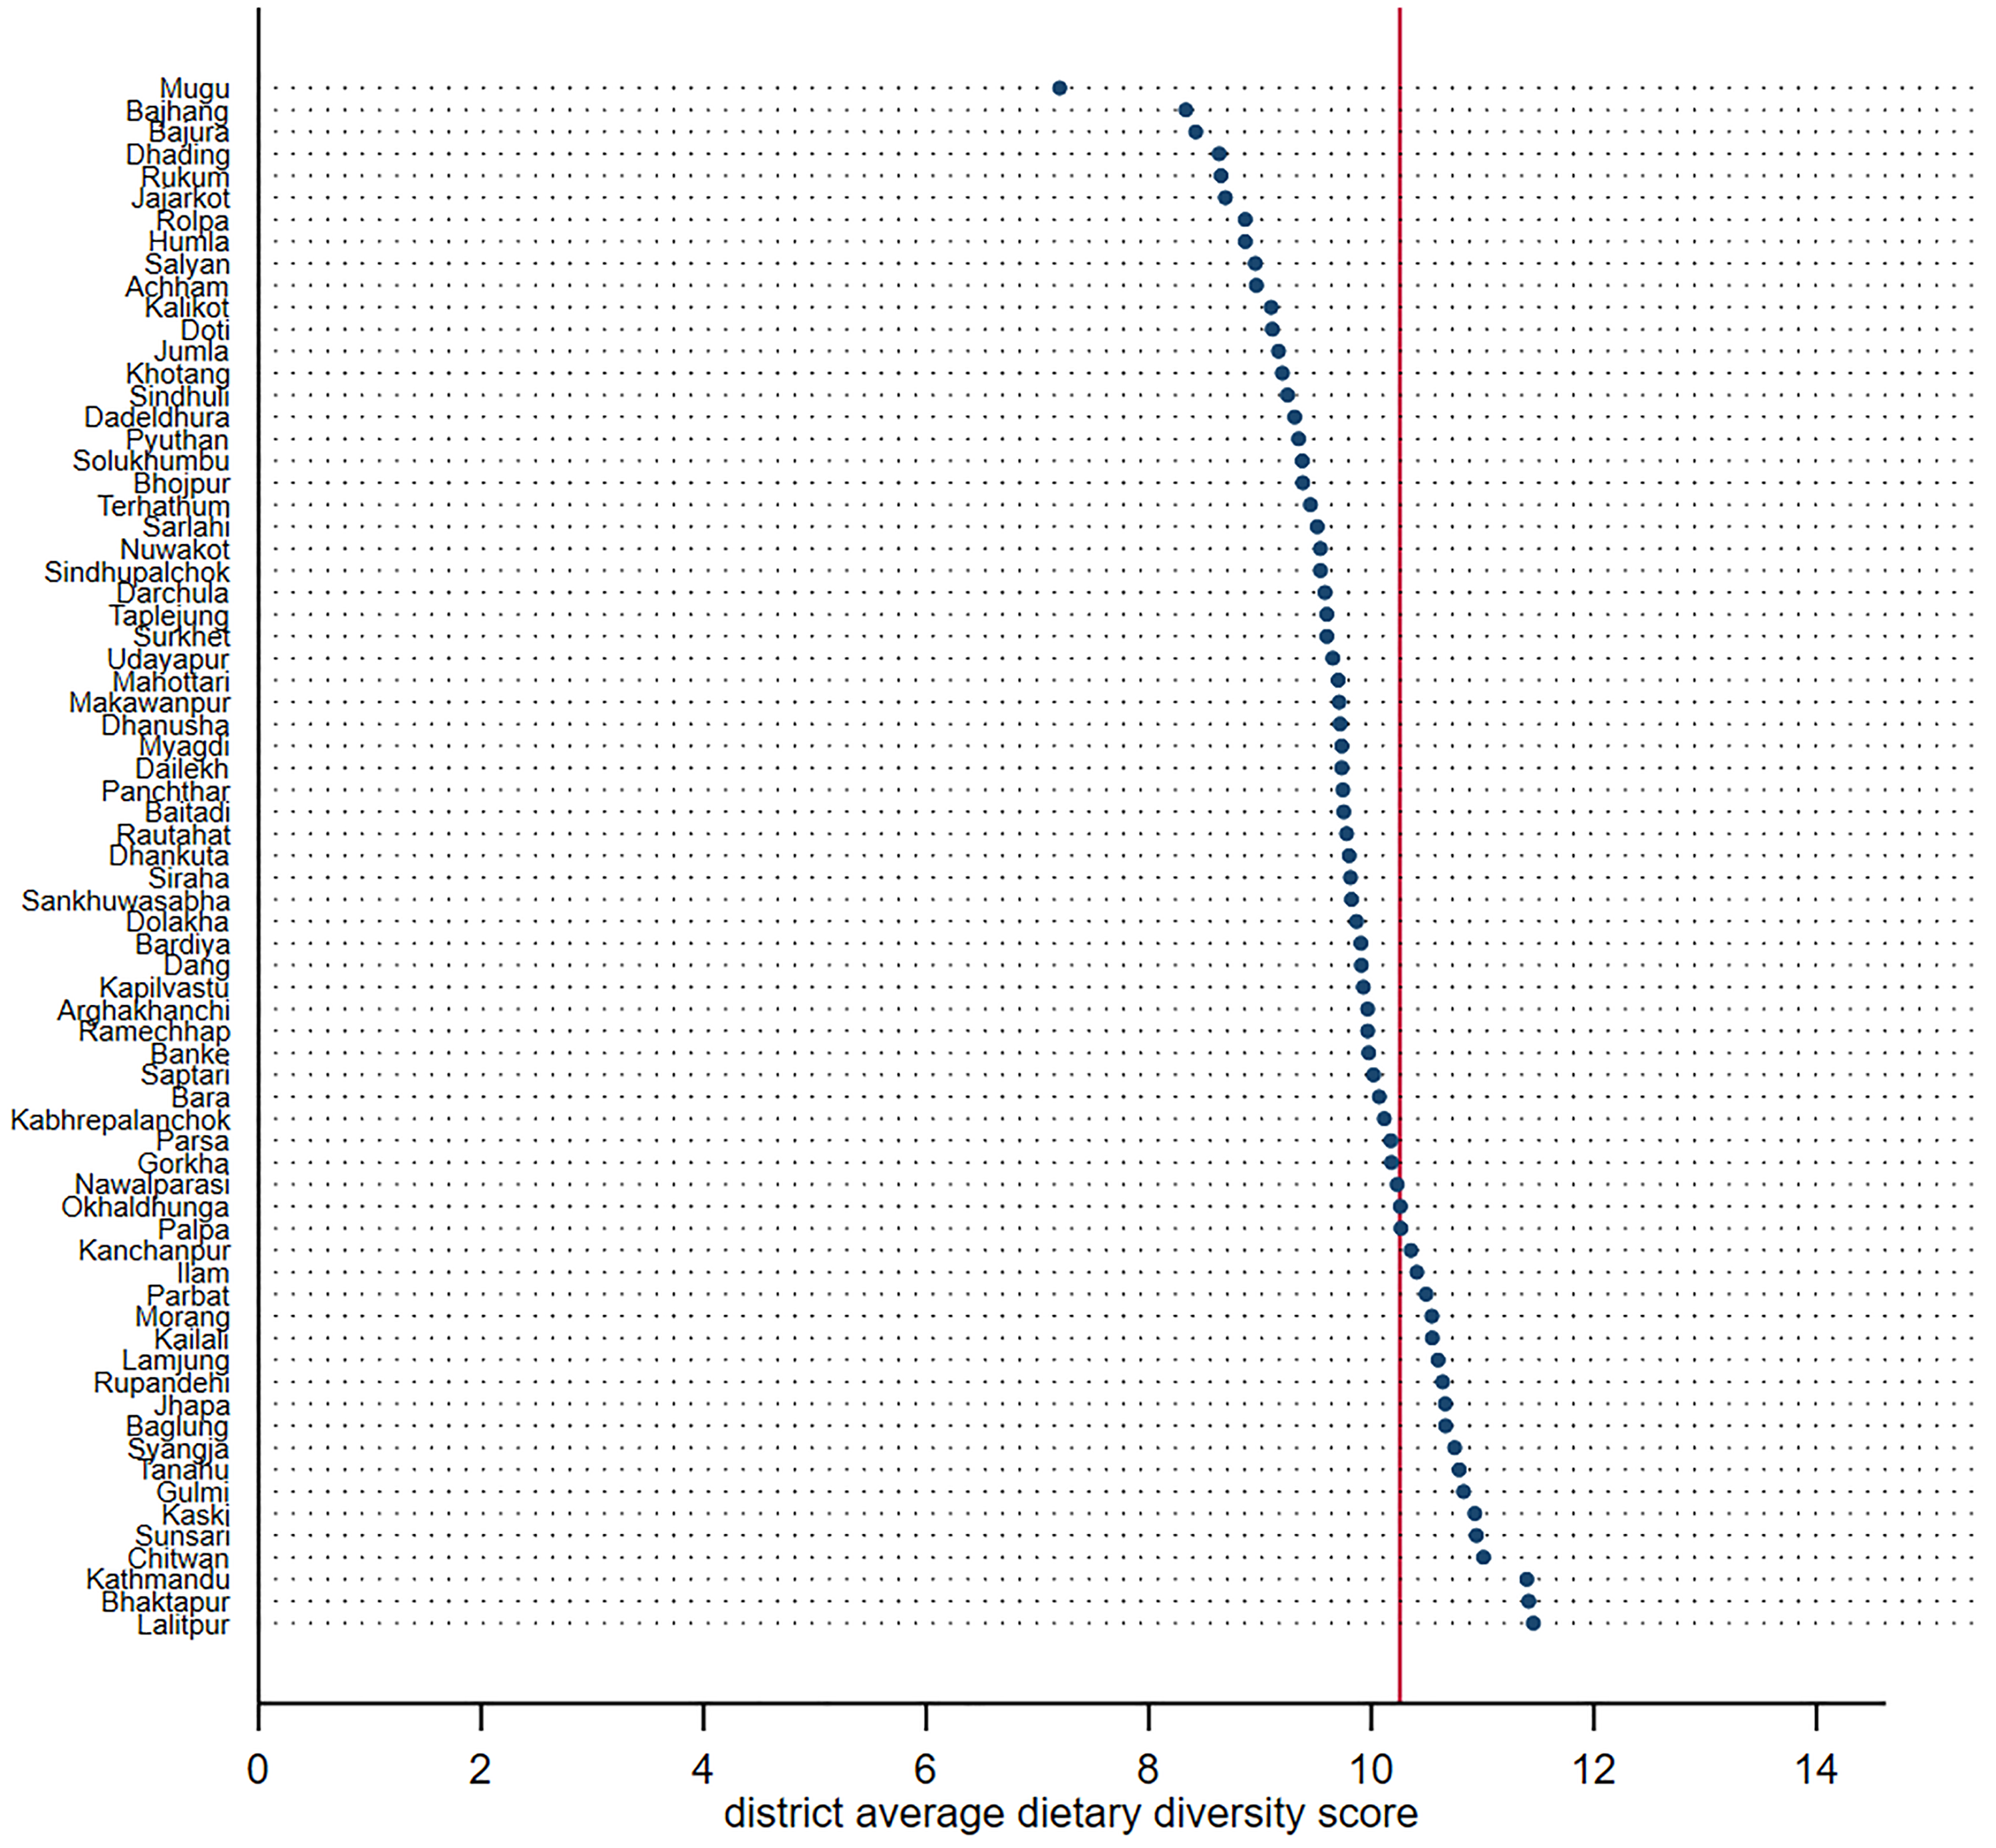
District average dietary diversity scores.
Average Expenditures, Food Budget Shares, and Diversity Scores Describing Dietary Patterns Among Specific Groups in Nepal.a
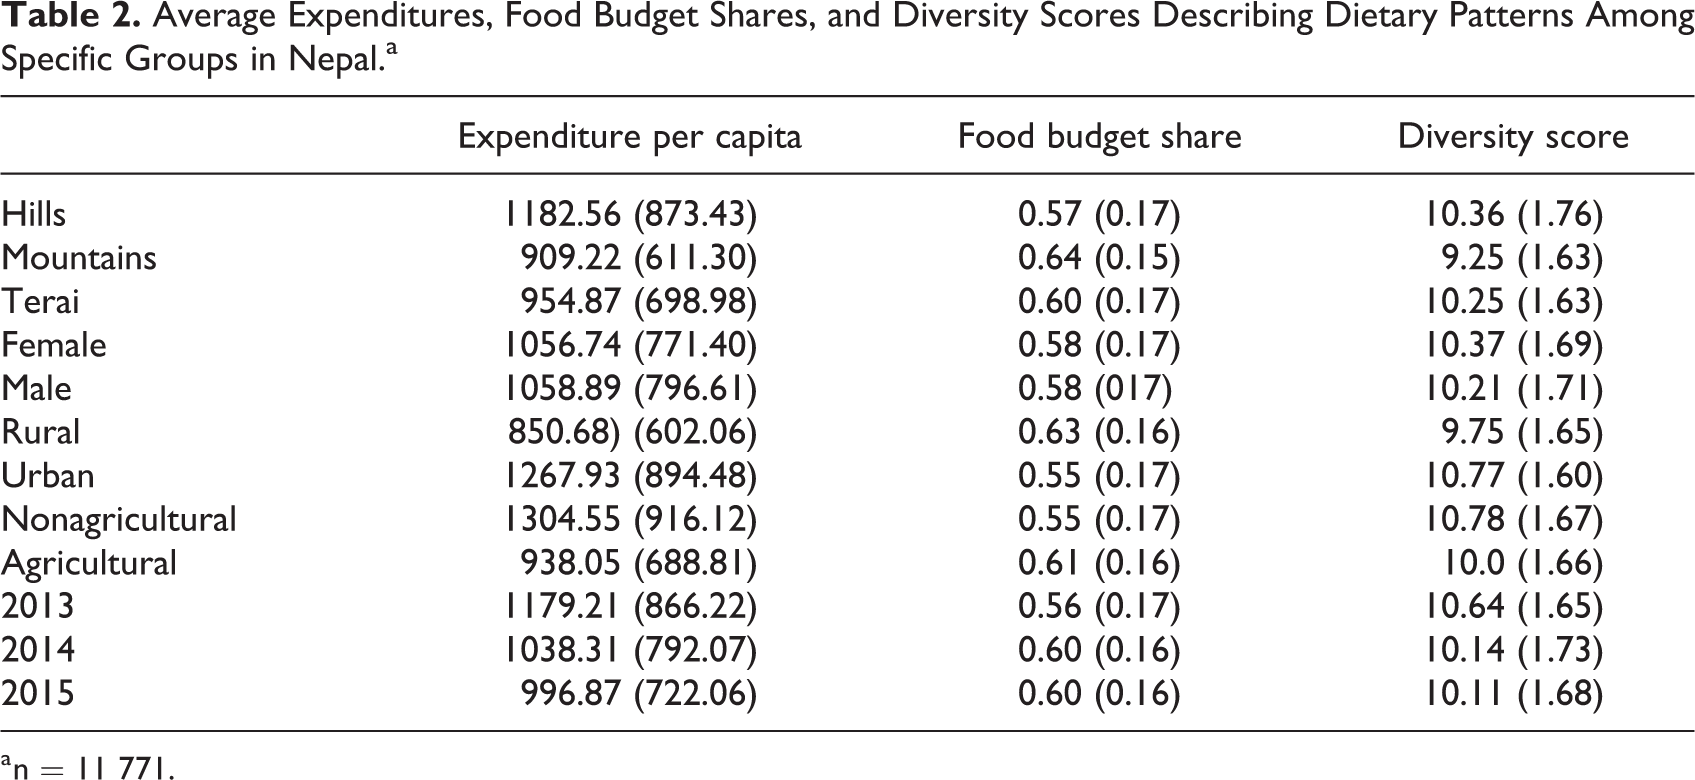
a n = 11 771.
Results for Expenditure Share Analysis
Figure 2 displays an Engel curve for the sample. This plots the share of total expenditure devoted to food against total expenditure, which here is synonymous with total income. Throughout most of the relevant range in income, households spend a greater fraction of income on food than at higher incomes. At extremely low incomes, the food budget share rises sharply with increments in income, peaking in this sample at just over 0.70, on average. Across the normal range of income, additional income increments lead to greater overall expenditures on food, but a reduction in the food budget share. On average, a 1-dollar increase in income is associated with a larger increment in the expenditure on animal-sourced foods (US$1.33) than on staples (US$0.27) or food in general (US$0.68).
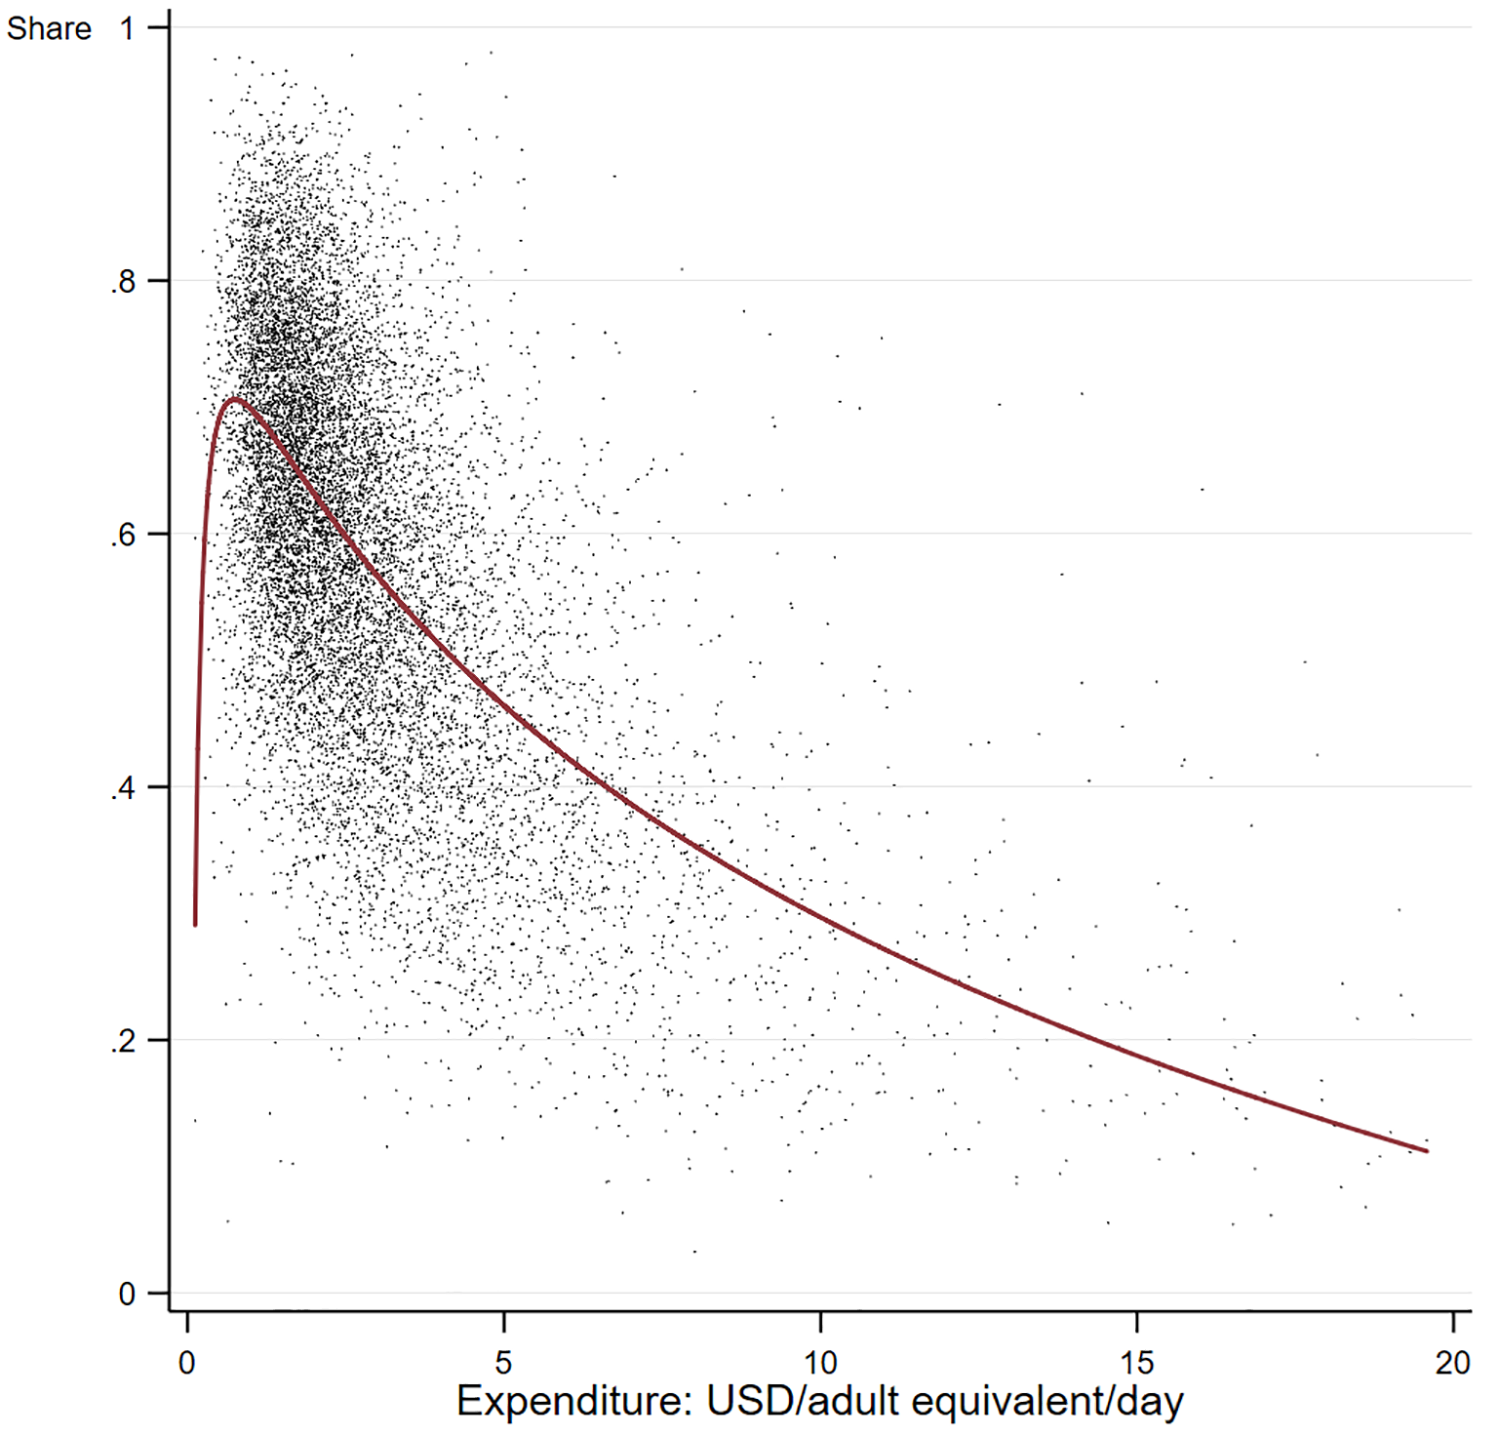
Engel curve plotting food expenditure against total expenditure (income).
Results for LCA
We tested from a 2-class model upward and could only reject increasing from a 9-class model to a 10-class model. However, with 14 food categories, a model with 9 separate diets is not very intuitive. Based on the results of the LCA, we selected a 4-class model corresponding to increasingly diverse diet types. The final selection of a 4-class model is somewhat arbitrary but strikes a balance between doing what the statistical test alone would suggest (add additional classes that are statistically different but not easily placed in a policy context) and what seems meaningful in the context of Nepalese diets. This 4-class model captures important underlying dietary patterns, and statistical improvements in fit beyond this point do not yield empirically meaningful separations in diets. Figure 3 illustrates the LCA diet assignments with 2, 3, and 4 classes. The diets in the 4-class model are nested and identified in order of complexity and diversity as basic, expanded, diverse vegetarian, and diverse nonvegetarian. Figure 3 reports the percentage of households that falls into each dietary class and the food categories commonly consumed in each diet type. Only 4% of the sample falls into the basic diet category (the category of greatest concern, from a nutrition perspective), 30% fall into the expanded diet, 28% sort into the diverse vegetarian diet, and 38% are placed in the diverse nonvegetarian diet.
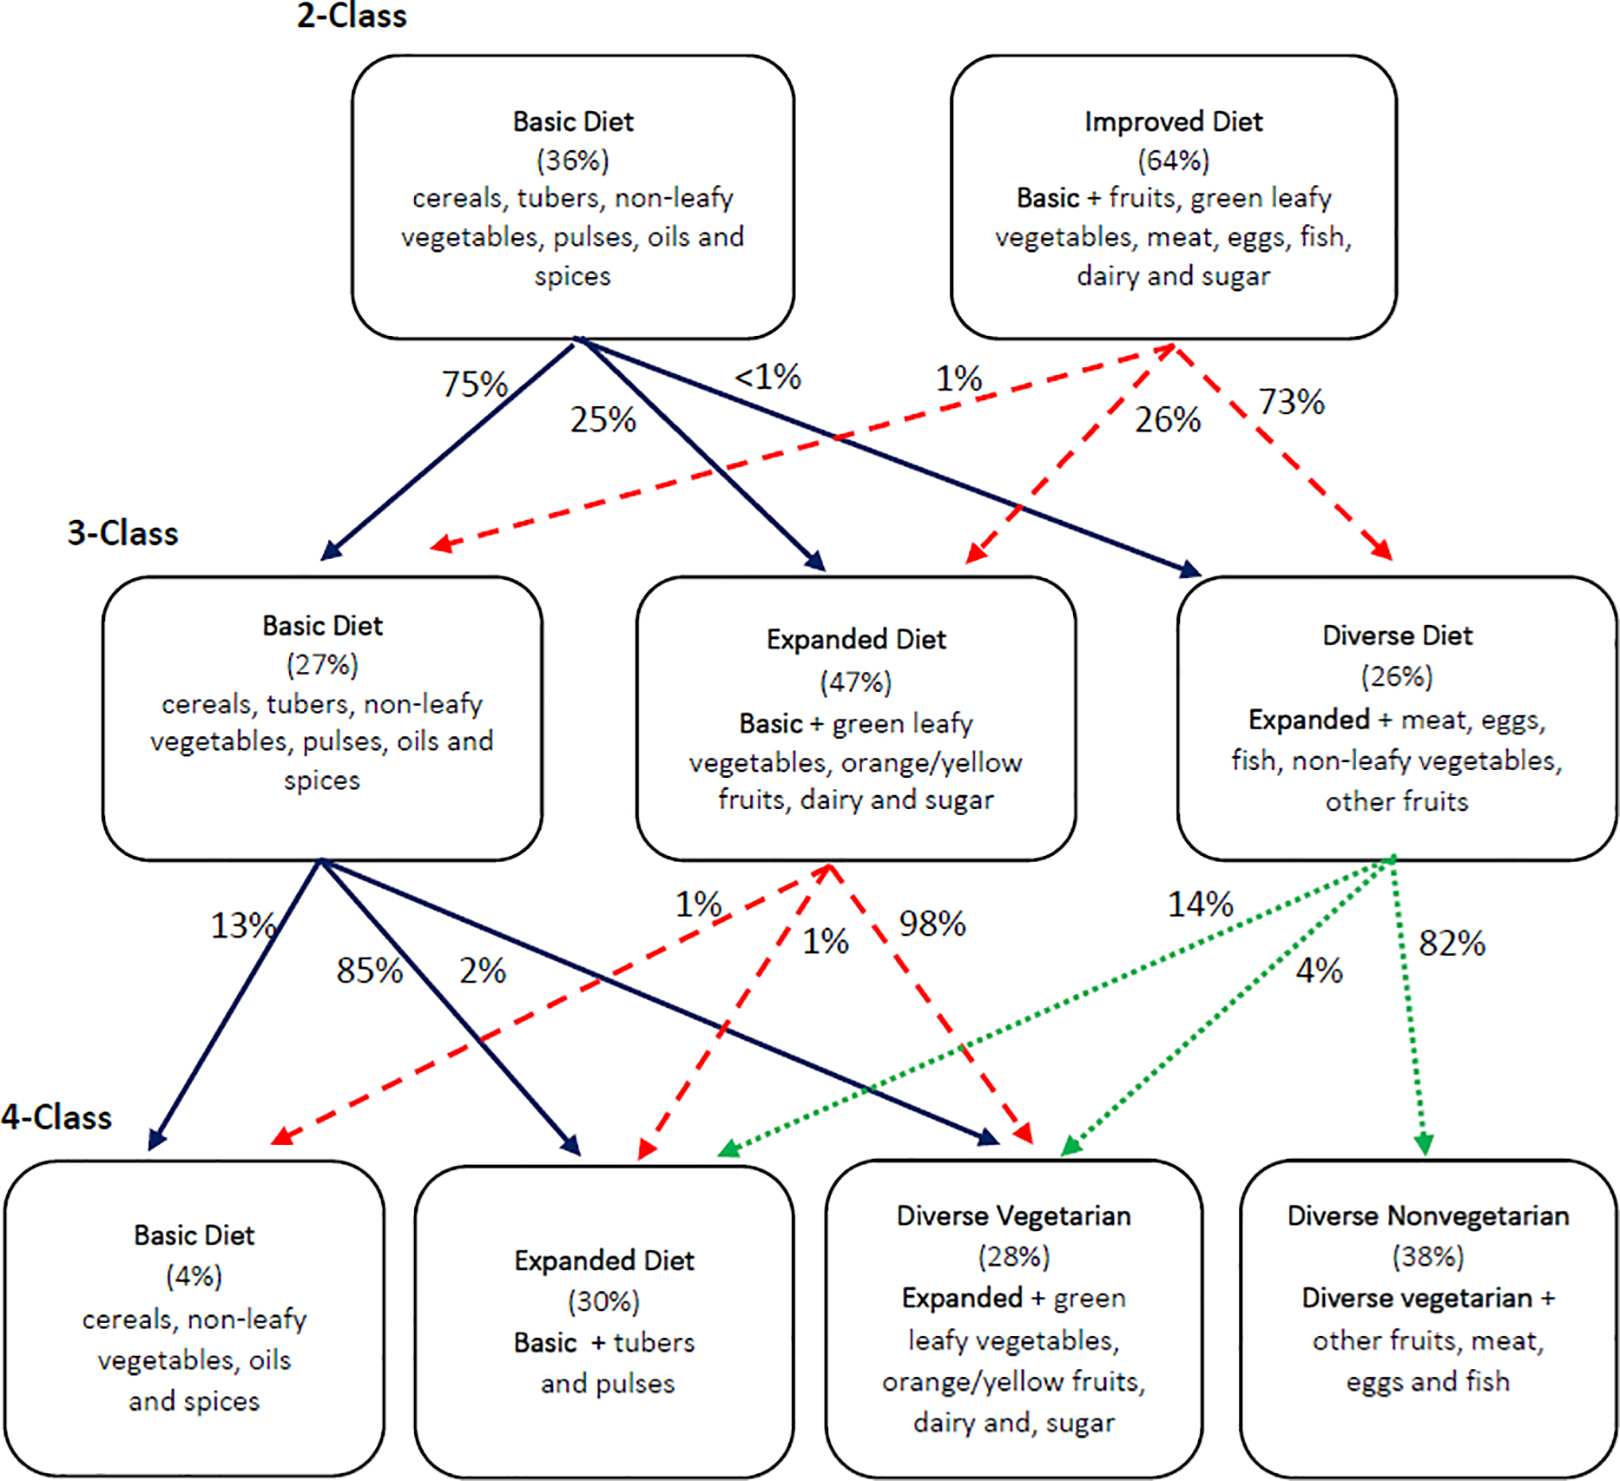
Diet mappings for latent class models.
Diet Type and Sociodemographic Factors
The results of the ordered probit for the full sample (n = 11 771) using household characteristics only as explanatory variables (Table 3, column 1) reveal that higher income has the greatest association with a household being in the highest diet category. Likewise, with increases in age, education, and wealth, there are marginal increases in the likelihood of households being a higher diet category. Agricultural households are more likely to consume from the lower diet categories. With the first set of control variables (Table 3, column 2), these relationships remain—with the exception of being an agricultural household, which is no longer statistically significant. The model incorporating district-level variables as controls (Table 3, column 3) indicates average landholding and road density are associated with more complex diets and higher poverty incidence is associated with less complex diets.
Ordered Probit Regression Results Identifying Factors Associated With Diet Typologies.a
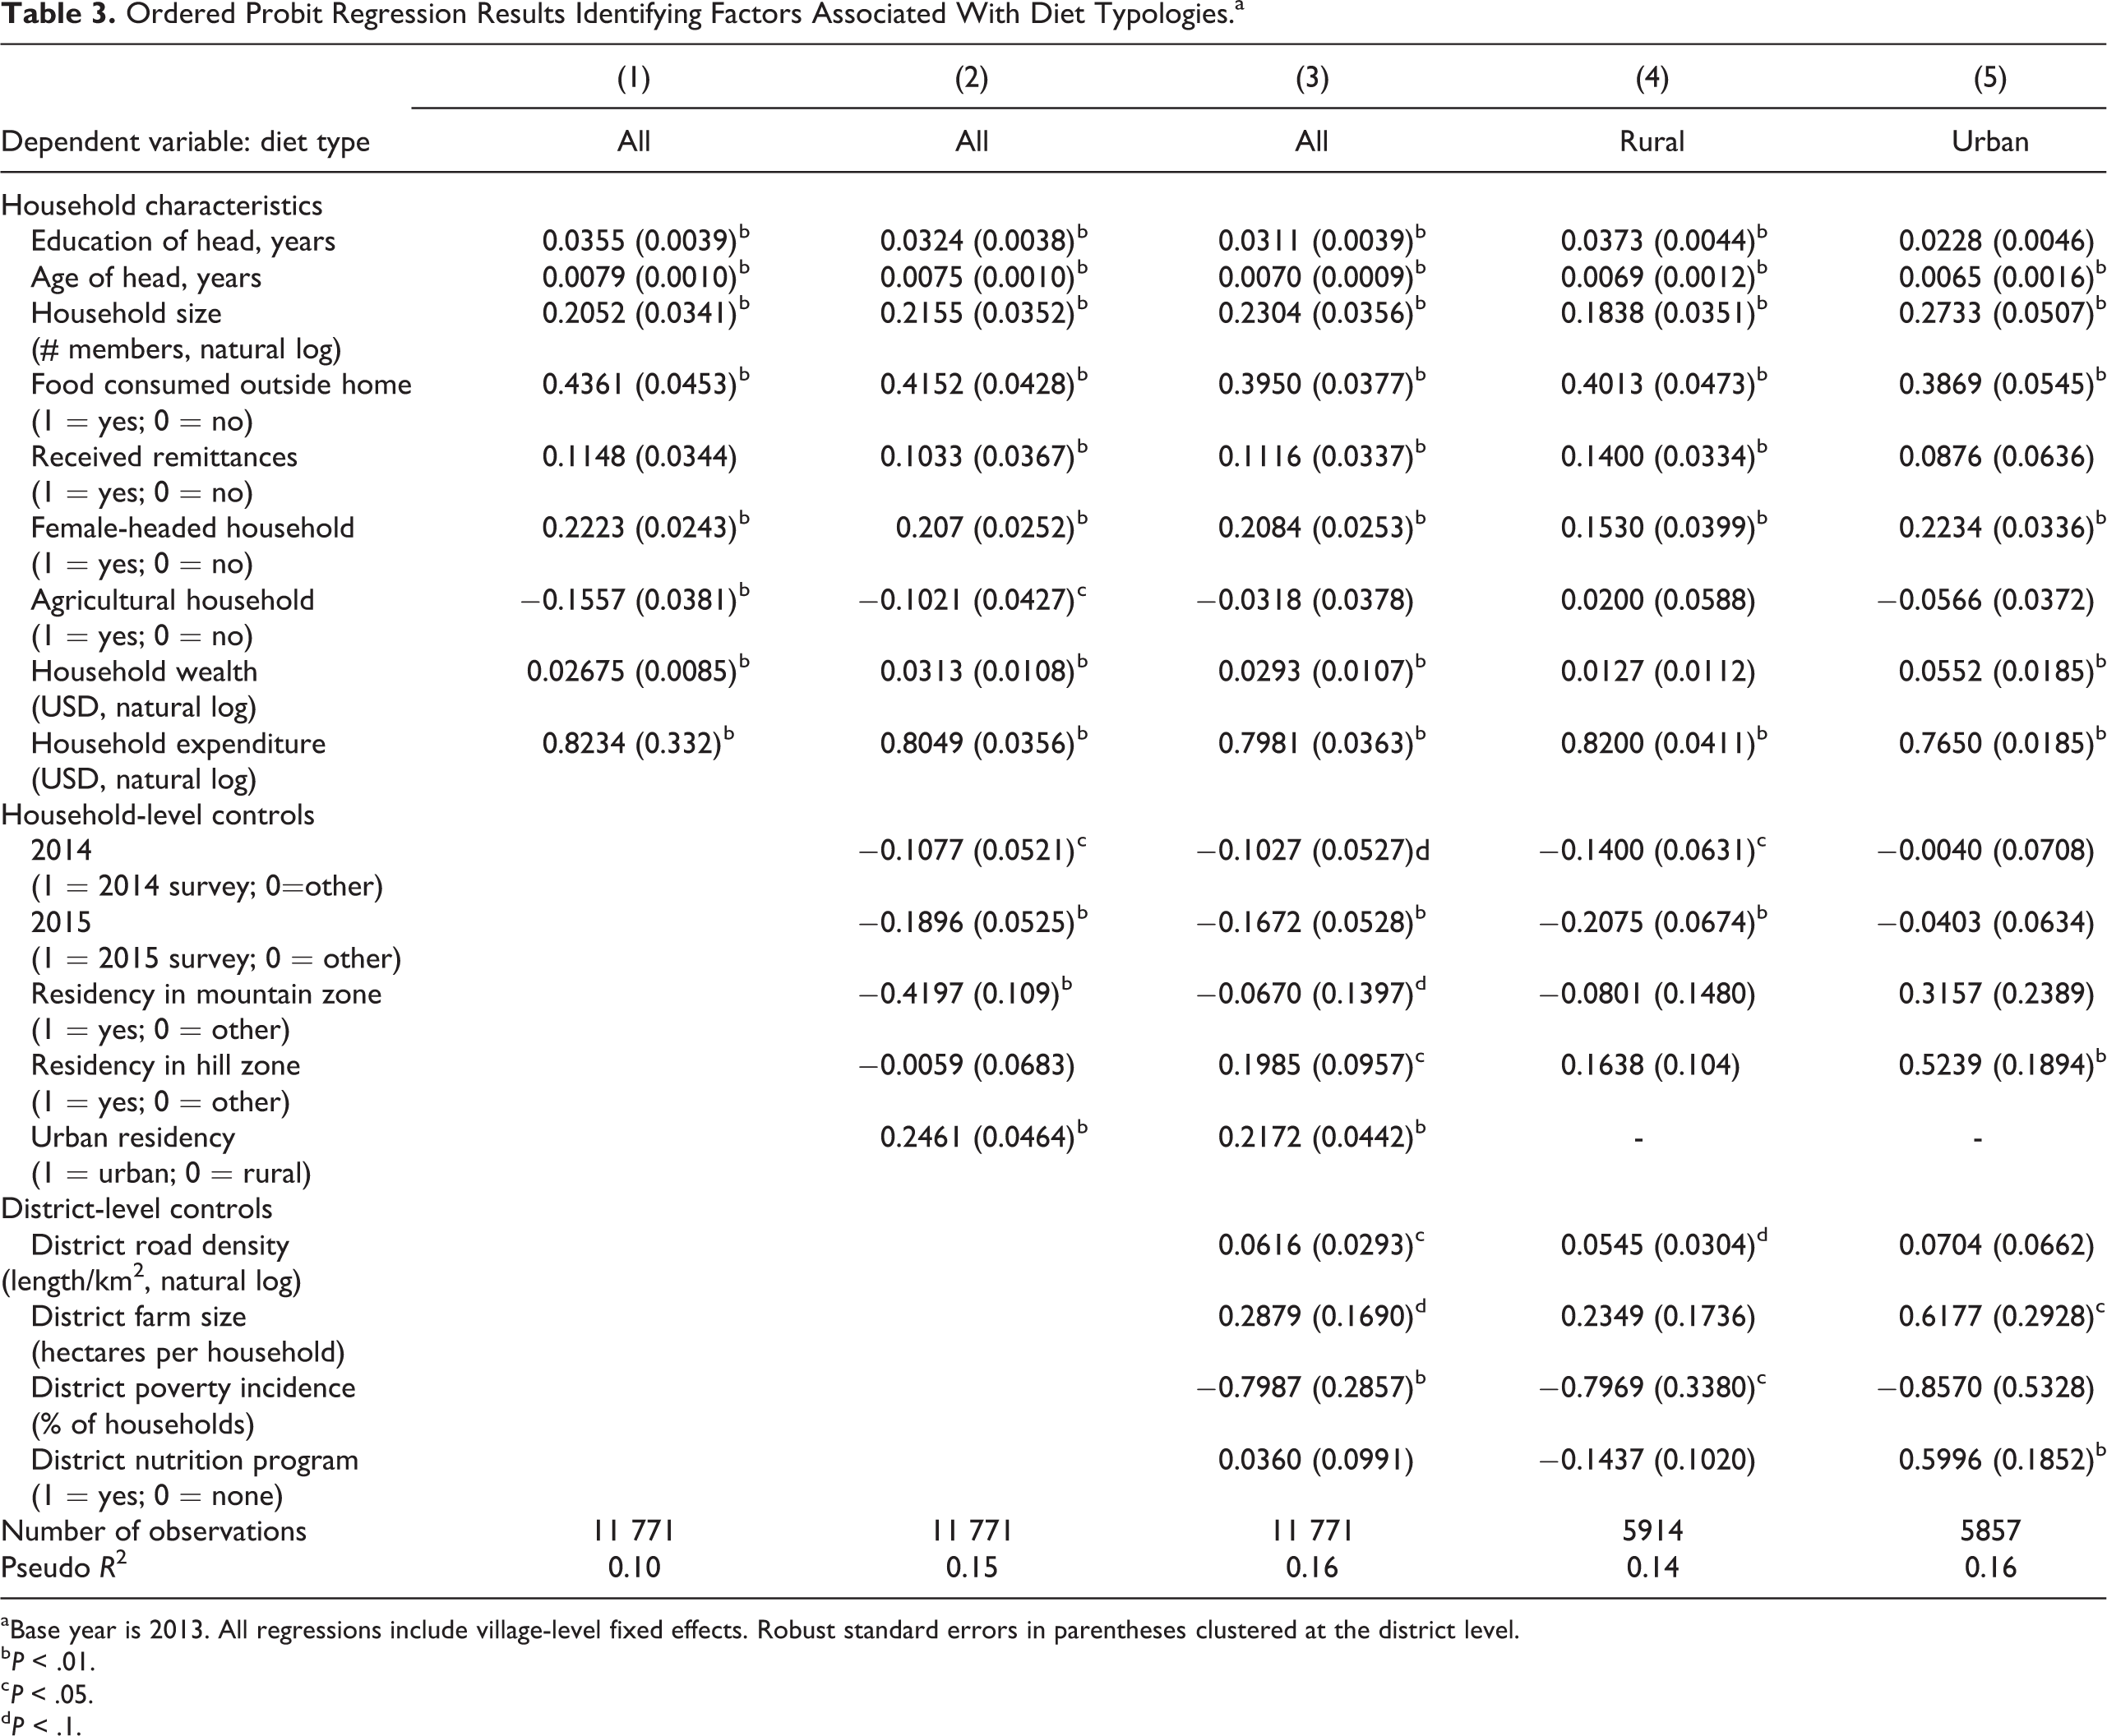
a Base year is 2013. All regressions include village-level fixed effects. Robust standard errors in parentheses clustered at the district level.
b P < .01.
c P < .05.
d P < .1.
Results for models 1 to 3 based on the full sample assume that covariates have the same relationship with dietary choices in rural and urban areas. To relax this assumption, we estimate separate models for the rural (n = 5914) and urban (n = 5857) samples. The final columns of Table 3 report these additional models (4 and 5). Although coefficient estimates from separate models are similar in signs and magnitudes and close to those derived from the pooled sample, several differences appear. These include small but statistically significant differences in estimates for education, female headship, household size, and consumption away from home. Wealth, district farm size, and the presence of a nutrition program in the district are not significant in the rural sample. Remittance status, road density, and poverty incidence are not significant in the urban sample.
Discussion
The patterns of elasticity measurements across gender, location, and education are broadly consistent with the underlying association between these indicator variables and overall income and fall within the range recently estimated in a meta-analysis for a large sample of countries in Africa. 37 Not unexpectedly, income elasticities for food overall exceed those for staples. With income elasticities greater than 1 for nearly all household groups, animal-sourced foods can be clearly classified as luxuries in Nepal. Of the 4 income elasticities examined (Table 4), only the food-income elasticity differs significantly across gender, location, and educational levels, which suggests that policies and programs that seek to improve incomes and livelihoods will likely increase dietary diversity even without strong income targeting. As education levels increase, individuals spend less of each increment in income on food, which is consistent with higher incomes observed at higher education levels and the declining shares of food expenditures as incomes rise. However, while important, the results clearly show that changes in income alone do not drive changes in diets, and that geographic targeting of nutrition interventions may be appropriate. For example, an extra dollar of income is associated with statistically greater incremental spending on food in the hills than in the terai and significantly less than in the mountains, where households are less well connected to markets, limiting food availability and hence responsiveness. Female-headed households and those in rural areas have higher food-income elasticities than male-headed households and those in urban areas. Elasticity patterns for staples are similar to those for food overall and statistically significant for education and ecology. This suggests that livelihood improvements could be especially effective in improving diets if combined with nutrition education or geographic targeting. With an additional dollar of income, urban households spend less of the increment on staples and animal-sourced foods than rural households. Expenditures on animal-sourced foods are almost 5 times more responsive to changes in income for households where the head has no education than in households where the head has above primary education. Similarly, expenditures on animal-sourced foods are twice as responsive to increments in income for households in the mountains as for those in the hills. Diversity scores for all households are relatively unresponsive to changes in income and much less sensitive than expenditures on food or animal-sourced foods. This underscores the relative fixity in diets and the relative lack of heterogeneity in diversity scores. This points to a difficulty in using diversity scores alone as a marker of diets or differences in consumption patterns. A deeper comparison of the elasticity estimates reported in Table 4, incorporating food prices (or, in the case of diet composites, price indices), is not possible using the current data set, which does not include price information but would be a useful extension to this analysis.
Estimated Income Elasticities of Demand for Food and Diet Diversity in Nepal, Identifying the Relative Responsiveness of Food Behavioral Choices Among Select Groups in the Population.
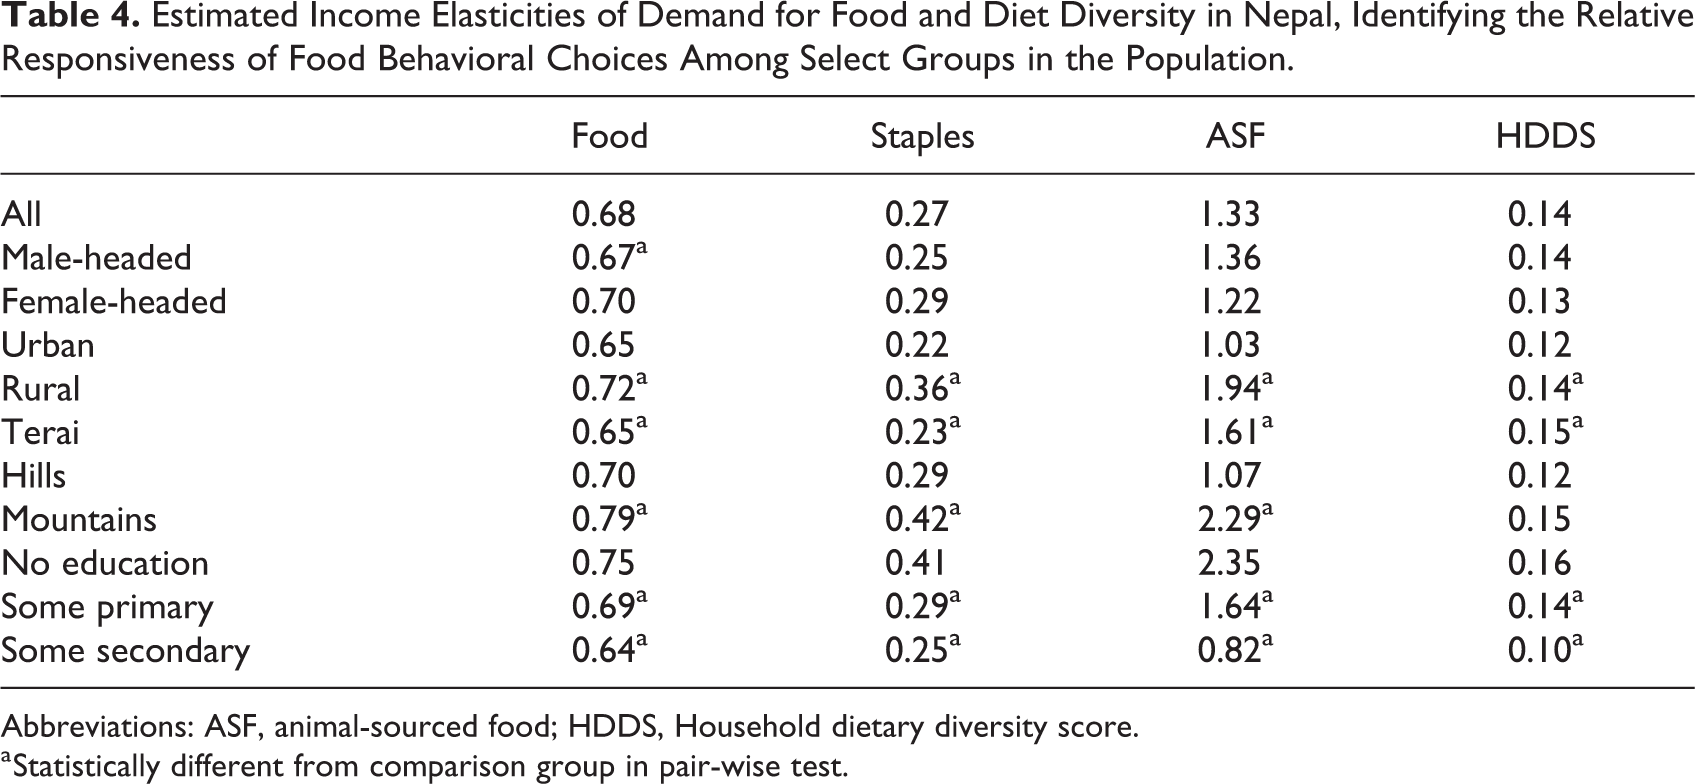
Abbreviations: ASF, animal-sourced food; HDDS, Household dietary diversity score.
a Statistically different from comparison group in pair-wise test.
Turning to diets, we find that characterizing households in Nepal via LCA as fitting into one of 4 distinct diets is a relatively useful way to categorize the sample and could simplify efforts to identify nutritionally at-risk households. In a 4-class model, relatively few households (4%) end up in the most basic diet category, with close to even proportions placed in expanded, diverse vegetarian and diverse nonvegetarian groups. In comparison to the terai and the hills, households in the mountains are more likely to consume a basic diet and least likely to consume a diverse vegetarian diet. These patterns again underscore the importance of geography as a determinant of diets in Nepal and emphasize the potential role of geographic targeting of nutrition interventions, such as promoting home gardens or small livestock production. Predictive margins for some key variables (ecological zone and education) are plotted in Figure 4. The likelihood of being in the diverse vegetarian category is similar across all ecologies and all education levels. However, households in the hills are significantly more likely to consume a diverse nonvegetarian diet compared with those in the mountains and terai. Overall, households in the hills seem more likely to have more nutritionally complex diets, suggesting that policies to increase diet complexity in Nepal would be best targeted at households living in the terai or the mountains. The predictive margins for the hills indicator are lower for the low diet types and higher for the high diet types. As education increases, the likelihood of consuming the diverse nonvegetarian category increases. Since the model we use to develop this result controls for overall income, the finding may be driven by those households’ greater knowledge and access to information about diet and nutrition, in particular an understanding of nutritional advantages of diets that incorporate animal-sourced foods. This once again highlights the potential importance of nutrition education for promoting improved health through better diets. The likelihood of being in the basic diet category falls by roughly half across the relevant range of education, from roughly 5% for households with no education to just over 2% for those with secondary education, strengthening the case for promoting nutrition education as a policy intervention to improve dietary diversity in Nepal.
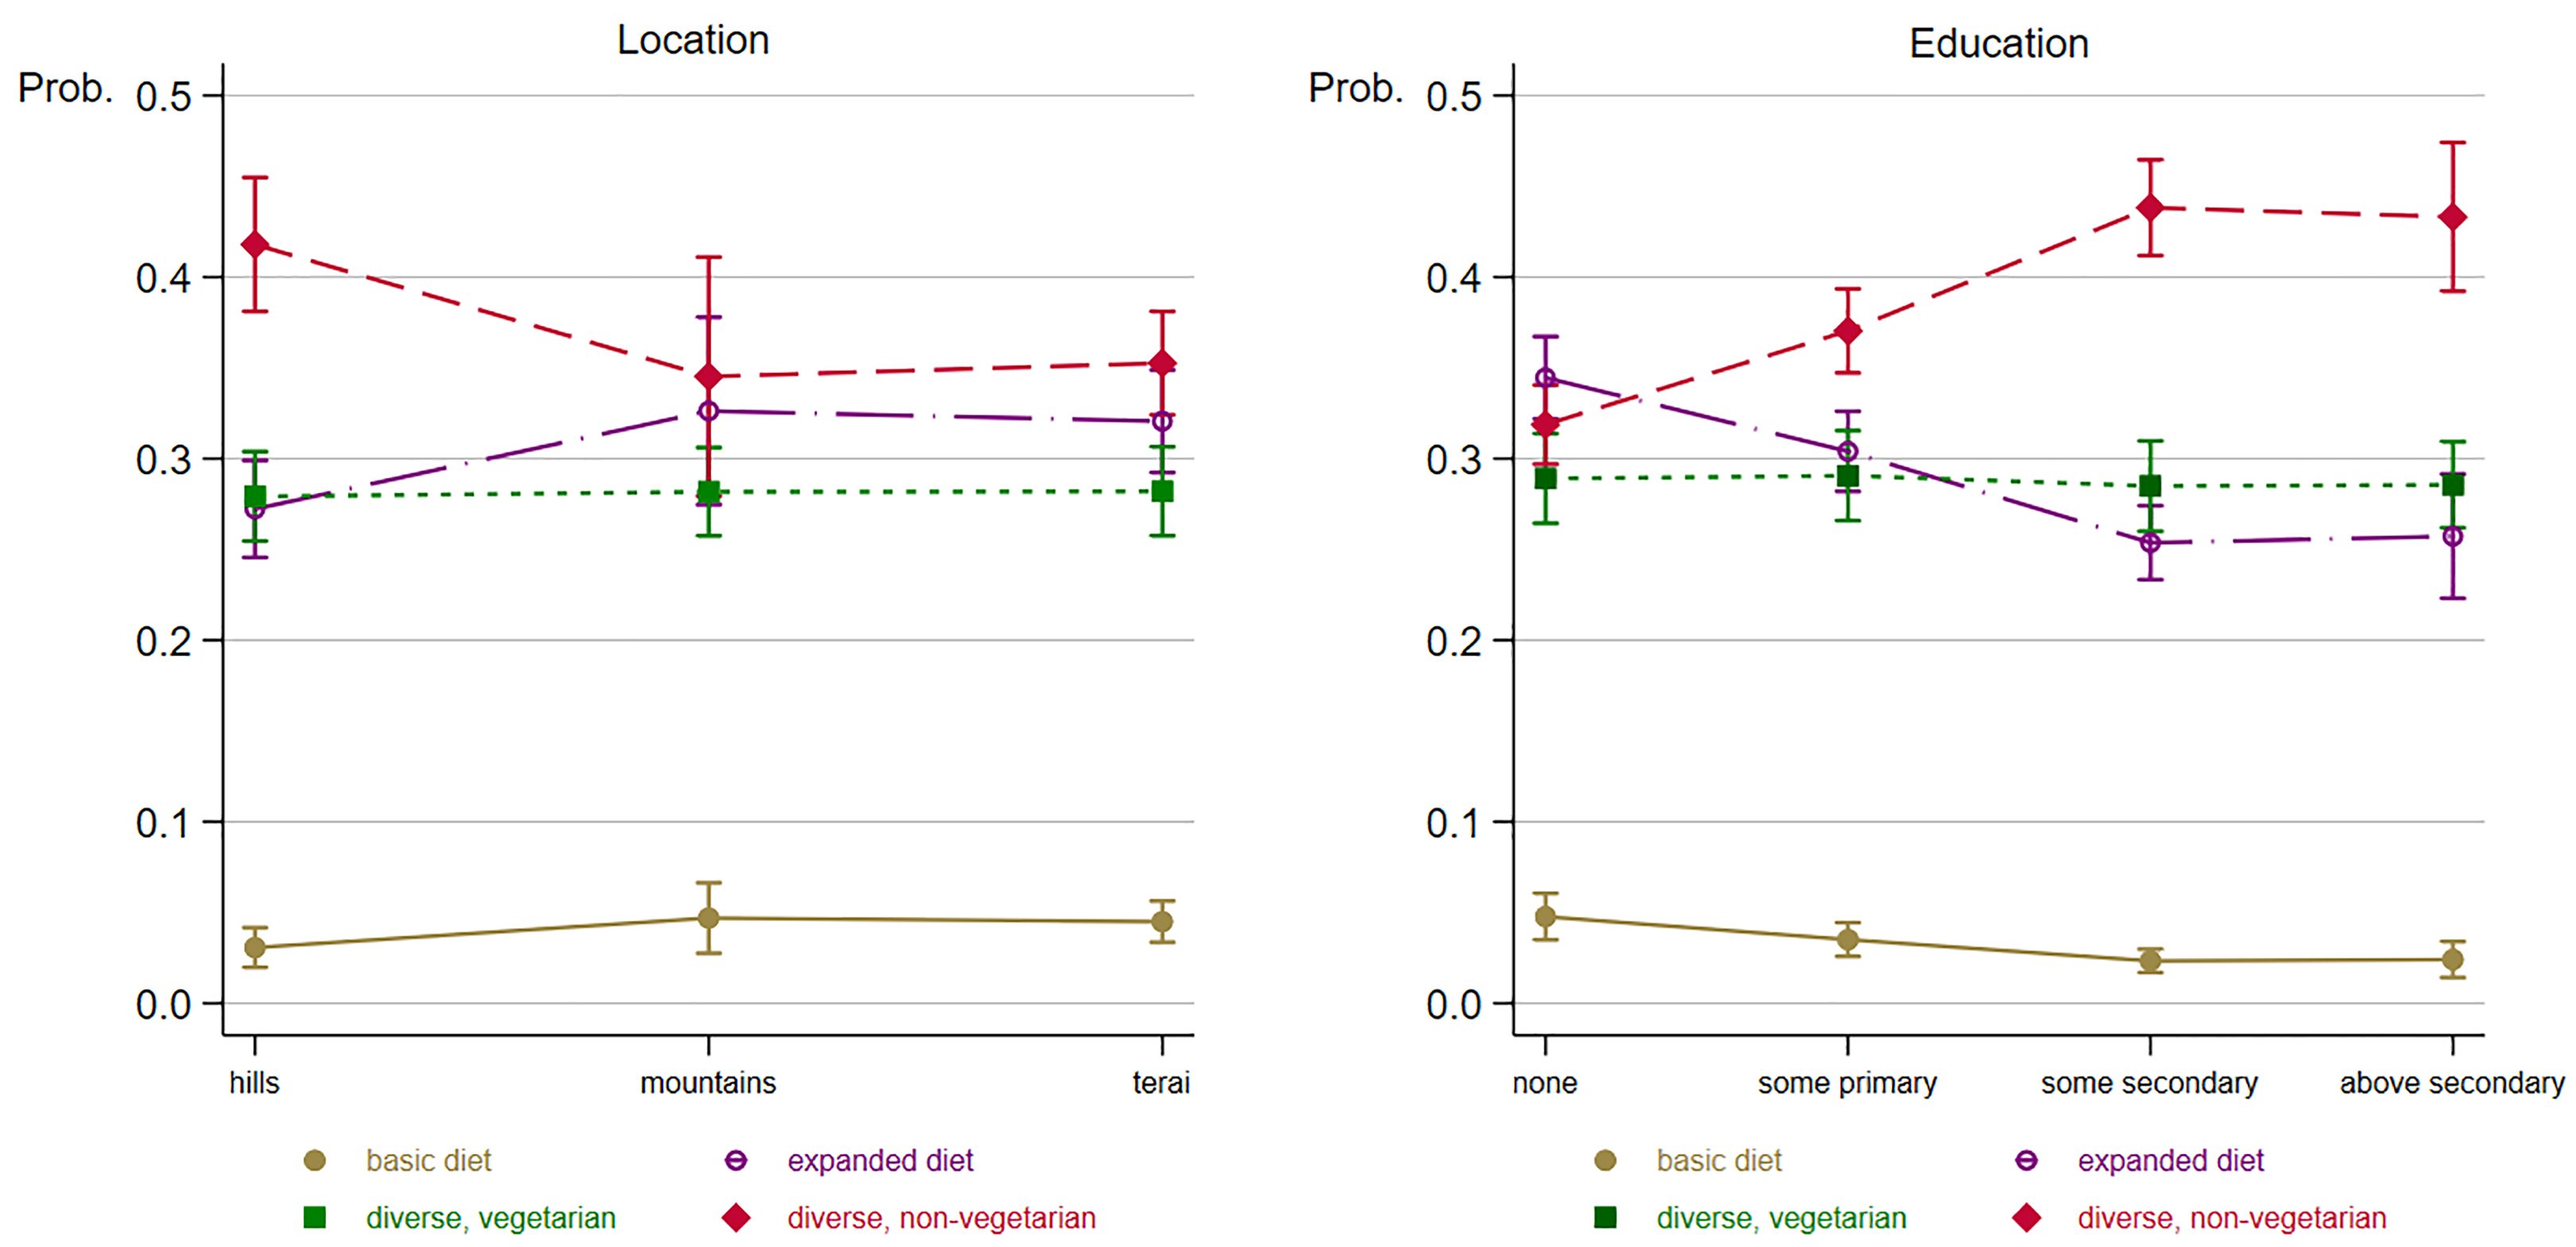
Marginal effects of location and education on diet selection.
Conclusions
Policies directed at improving nutrition require a better understanding of the factors that influence diet choices. In this article, we identified how patterns of food consumption are related to dietary diversity. Household dietary diversity scores were constructed based on 7-day recall information on food purchases and food consumed directly from agricultural production. Reported consumption from 14 food groups was mapped into 4 distinct dietary patterns via LCA. Ordered probit regressions were used to identify factors associated with observed diet patterns. Diets are heterogeneous and map into 4 clusters along a continuum of complexity. Three identified diets were vegetarian and 1 was nonvegetarian. Diet complexity was associated with geography and socioeconomic features of the sample. On average, poor and agricultural households had less complex diets and households receiving remittances had more complex and higher quality diets. Road density was positively correlated with diet complexity.
Overall results confirmed heterogeneous dietary behavior among Nepalese households and provide several key insights into food expenditure patterns and diets in Nepal that could be used to more effectively target policies to improve public health in Nepal through better nutrition. Similarly, efforts to improve health by diversifying and improving the nutritional quality of household diets—for example through supplemental feeding programs, home garden promotion, or targeted food assistance programs—require knowledge of where nutritional gaps currently exist, and how households might respond to changes in food availability and incomes, depending on location and socioeconomic status. Higher incomes facilitate dietary shifts from simple, staple-based diets toward more complex diets incorporating, in some cases, animal-based foods. Income elasticity results suggest only the food-income elasticity differs significantly across gender, location, and educational levels, implying that policies and programs that seek to improve incomes and livelihoods will likely increase dietary diversity even without strong income targeting. While important, changes in income alone do not drive changes in diets and therefore geographic targeting of nutrition interventions in Nepal will continue to be appropriate, especially when combined with nutrition education where households are less well connected to markets, limiting food availability. The relative lack of heterogeneity in diversity scores underscores the difficulty in using diversity scores alone as a marker of diets or differences in consumption patterns.
Characterizing household diets via LCA is a useful and straightforward way to categorize household consumption and could simplify efforts to identify nutritionally at-risk households. The LCA patterns highlight the importance of location, isolation, and education as key determinants of diet diversity in Nepal, suggesting continued importance for geographic targeting of nutrition interventions such as home gardens and small livestock production, especially in the mountains and terai. Controlling for overall income, the association between education and diet complexity is positive, which reinforces the importance of nutrition education as a policy intervention to improve dietary diversity in Nepal.
Footnotes
Acknowledgments
We have benefitted from useful conversations and interactions with Robin Shrestha, Andrew Thorne-Lyman, Patrick Webb, and participants at the sixth Annual Scientific Symposium on Agricultural-Nutrition Pathways, Kathmandu, November 28, 2018.
Declaration of Conflicting Interests
The author(s) declared no potential conflicts of interest with respect to the research, authorship, and/or publication of this article.
Funding
The author(s) disclosed receipt of the following financial support for the research, authorship, and/or publication of this article: Support for this research was provided by the Feed the Future Innovation Lab for Nutrition, which is funded by the United States Agency for International Development.