
Abstract
Robust income growth combined with the highest urban population growth in the world is driving rapid changes in the food system of sub-Saharan Africa. Demand is increasing for higher quality as well as more processed foods. Countries are increasingly experiencing a double burden of over and under nutrition as the overweight and obesity epidemic spreads. In this context, we seek to understand the key drivers and likely evolution of diet quality in Mozambique, in both its positive and negative dimensions, while specifically examining the role of farm ownership among increasingly urban populations. We use national household expenditure survey data and a set of ordinary least square and analysis of variance regressions to observe patterns of current diet quality across city size categories, household income, household education, and other demographic variables. We then anticipate the likely directions of change in diet quality over these same dimensions based on expected income growth and expenditure elasticities developed for several alternative nutrients. We find that growing incomes and the consumption of processed foods are associated with a worsening of negative factors in the diet. Furthermore, urbanization, controlling for income, is associated more strongly with a worsening of negative factors than with an improvement in positive factors in the diet. The effect on diet quality of farm ownership, however, is positive and significant, primarily driven by these households purchasing fewer unhealthy foods. African cities need to consider what mix of policies will counteract the negative effects of continued urbanization and rising incomes on diets.
Keywords
Introduction, Research Questions, and Hypotheses
Robust income growth combined with the highest urban population growth in the world is driving rapid changes in the food systems of Sub-Saharan Africa. Demand is increasing for higher quality foods, including fresh produce, meat, and dairy products as well as more highly processed foods and even ultraprocessed foods with poorer nutritional value. 1,2 The overweight and obesity epidemic that began among developed nations is not sparing developing countries, leading to a double burden of over and under nourished populations in these areas. 3 -6 This article seeks to understand the key drivers and likely evolution of diet quality in Mozambique, in both its positive and negative dimensions, while specifically examining the potential role that owning a farm presents for improving diets in Mozambique’s growing cities.
Previous literature has looked at diet quality measures and their relationships to income, food prices, food expenditure, plot size, and crop diversity among farmers as well as a variety of household sociodemographic characteristics. 7 -13 Several studies across Ethiopia, Malawi, Ghana, Kenya, and South Africa have compared diet and nutrition indicators for rural and urban areas. For example, 24-hour recall data have been used to find that children’s dietary diversity is significantly greater in urban areas of Ethiopia than in rural areas 14 and that women’s mean nutrient adequacy ratios and dietary diversity scores are greater in urban areas of South Africa and Kenya compared to rural areas. 15 In Mozambique’s neighboring country of Malawi, farm production diversity is found to positively affect dietary diversity in rural and urban areas. 16 Verduzco-Gallo et al look at nutrient deficiencies and outcomes over income in rural and urban areas in Malawi, finding that food consumption per capita increases more rapidly with income in urban areas. 17 However they do not use an overarching diet quality indicator.
This article makes 4 contributions to the literature. First, we use a Living Standards Measurement Study-style data set with a uniquely rich set of food items. Second, we examine how conclusions about drivers of diet quality depend heavily on choice of measure. Third, we add to the literature on the impact of income and urbanization on diet quality and diet diversity. Fourth, we analytically draw relationships between own farming, city size, and dietary outcomes. Furthermore, of those who have looked at farming in urban areas and diet, no diet quality measures such as those we developed for this study have been used. 8 -23
We explore 5 hypotheses: (1) the consumption of processed foods is significantly associated with a worsening of negative factors in the diet. (2) Income growth is associated with simultaneous improvement in positive factors and a worsening of negative factors. (3) The income effect on diet does not significantly differ across rural and urban areas. (4) Urbanization (while controlling for income) is associated more strongly with a worsening of negative factors than with an improvement in positive factors. (5) Having one’s own farm in a (peri-) urban area is associated with a healthier diet.
The rest of this article is structured as follows: The next two sections describe the data and methods used in the analysis. The results section then begins by presenting some descriptive statistics which illustrate initial results of household food acquisition patterns and then present the statistical analysis. The first section of regression results assesses the patterns and drivers of current household level diet quality across city size categories, household income, household education, and other demographic variables. The second section anticipates the likely directions of change in diet quality over these same dimensions, based on expected income growth and expenditure elasticities developed for several nutrients. The final section summarizes our findings and concludes.
Data
This study uses Mozambique’s nationally representative 2008/09 IOF (Inquérito de Orçamento Familiar) household budget survey, which was conducted from September 2008 to September 2009. The IOF includes 384 unique food items in September 2008 across over 10,000 households, far more food items than in nearly any other LSMS-style survey. This richness of food items combined with the large and nationally representative sample makes it a uniquely valuable survey for our purposes. 24 Items include those purchased for household consumption, from the household’s own agricultural production, and acquired as in-kind payment or gifts. Responses were recorded by the enumerator or by the households themselves when possible over a 7 day period. The methods we employ build on the pioneering work by Jack Fiedler and colleagues on the use of expenditure surveys for dietary assessments. 25 -39
Nutritional parameters for each food item were assigned using a Mozambique-specific food composition table by Korkalo et al when matches existed, 40 with other sources used for items with no match (note 1). Total population and urban population figures are from the National Institute of Statsitics of the National Directorate for Studies and Policy Analysis (2008-2009). 47
Methods
We assesses levels, patterns, and drivers of current household level diet quality across city size categories, household income (proxied by total household expenditure), household education, and other demographic variables and anticipate future directions of change. We measure diet quality with 15 different indicators and show how conclusions depend on the indicator chosen.
We normalize household food quantity acquisition following the approach of Smith and Subandoro, 48 by converting household acquisition in grams to daily adult equivalent terms. This has the benefit of normalizing outcomes on household composition. 10 Quantities are adjusted for edible percentages and account for milliliter to gram conversion factors of liquid food items.
We first present the current patterns of household diets in calories consumed per day, food groups most commonly acquired, most common processing/perishability characteristics of foods acquired, and nutritional heterogeneity across our processing/perishability groups. We use analysis of variance regression methods (note 2) to test for differences in the mean imindex_std diet quality index (described subsequently) by food grouping. We also look at farm ownership patterns across city size categories.
We then run a set of ordinary least square regressions using the same set of independent variables for each diet quality or dietary diversity indicator. These explanatory and control variables and their relevance and expected relationships to our diet quality measures are discussed in greater detail below. In the last section, we look at expenditure elasticities developed for several nutrients and begin to discuss how diet quality may evolve given expected income growth and our estimated elasticities (note 3).
Dependent Variables
Indicators of Diet Quality
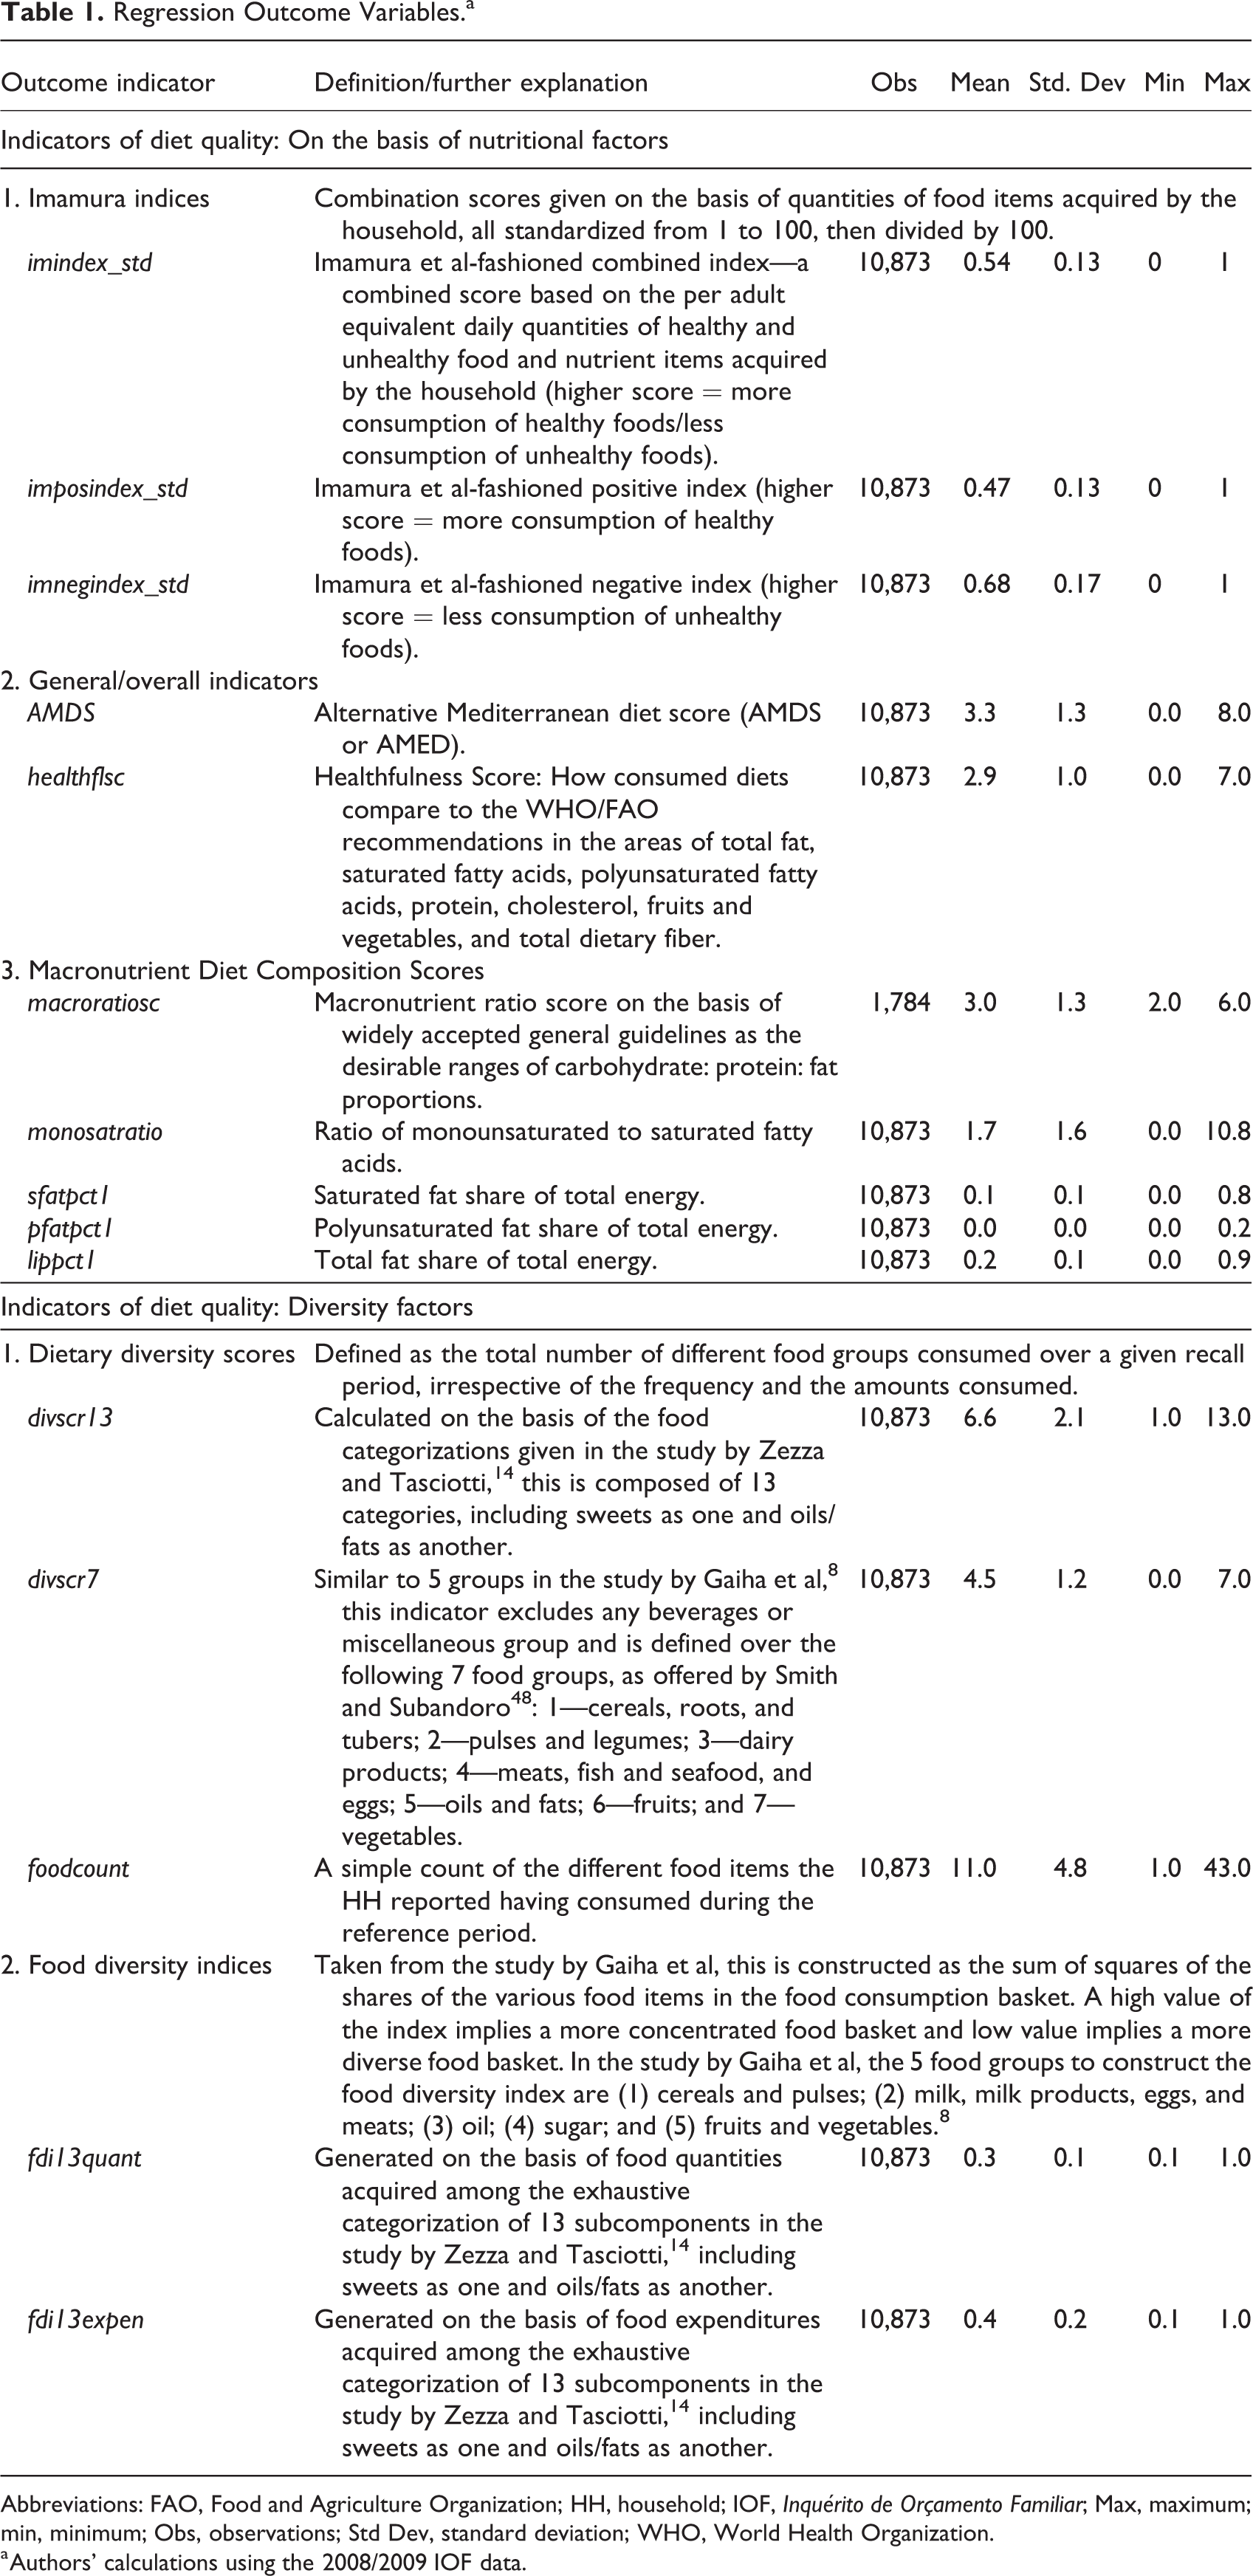
As there is no single accepted measure of diet quality, conclusions regarding the drivers of diet quality may be sensitive to choice of measure. To avoid this, we use several measures (Table 1) and examine how conclusions change depending on the measure. Most broadly, we examine 2 types of indicators: those based on some assessment of the nutritional content of the diet, which we call nutritional factor indicators; and those based on the diversity of food intake, which we call diversity indicators (note 4).
Regression Outcome Variables.a
Abbreviations: FAO, Food and Agriculture Organization; HH, household; IOF, Inquérito de Orçamento Familiar; Max, maximum; min, minimum; Obs, observations; Std Dev, standard deviation; WHO, World Health Organization.
a Authors’ calculations using the 2008/2009 IOF data.
Nutritional factor indicators
We examine 10 indicators in this broad class. The first is based on the approach taken from the study by Imamura et al (imindex_std). 50 Imamura et al use both food categories and nutrient categories in their index. We use standardized per adult equivalent daily quantities of food and nutrient acquisition to assign each household a combined score for each of Imamura’s 15 identified positive and negative food and nutrient categories (note 5). A score of 1 is awarded for household quantities of 0 for a given positive food group, 2 for households with quantities in the first quartile of positive values, through a score of 5 for households with quantities in the fourth quartile. For nutrient categories, a score of 1 is awarded for the first quintile of acquisition of a given nutrient category (none of the nutrients had quantities of zero), and 5 is awarded to households with quantities in the fifth quintile of positive nutrient values. For the 6 negative food and nutrient categories, an inverse score of 1 is assigned for household quantities in the fourth quartile of negative food item quantities, and a score of 5 is assigned for quantities of 0 quantities of these negative foods consumed. Quintiles are again used with the negative nutrients. We sum the combination of positive and negative points across these 15 food and nutrient categories and standardize the resulting value (which has a possible range from 15 to 75) to a 100 point scale, divided by 100 and labeled imindex_std. We also examine the separate positive and negative scores of this index (imposindex_std and imnegindex_std), with higher scores indicating a better dietary outcome, whether increasing consumption of positive food items or decreasing consumption of negative food items. These are also standardized to a 100-point scale, and the natural log version of all 3 indicators is used in the regression analysis. Given the complexity of defining a “healthy diet,” examining positive and negative factors separately is a major attraction of this approach.
The second and third nutritional factor indicators are the alternative Mediterranean diet score (AMDS) and the Healthfulness Score (healthflsc). Each is based on how consumed diets compare to a standard. The AMDS is fashioned as per Fung et al (see Supplemental Table 1 for a full description of this indicator and how it is constructed). 51 Households are assigned 1 point for each of 9 dietary or food group criteria, for a maximum score of 9. Unique to this indicator, consumption of 5 to 25 grams per day of alcohol is awarded 1 point on par with the other 8 criteria.
Our healthfulness score follows the study of Sodjinou et al who use the 15 World Health Organization/Food and Agriculture Organization (WHO/FAO) individual nutritional factor recommendations to generate 8 criteria for a healthy diet and assign 1 point for each factor present in the diet, for a maximum score of 8. We generate the same 8 criteria for our data, based on the recommended intake goals for total fat, saturated fatty acids, polyunsaturated fatty acids, protein, cholesterol, fruits and vegetables, and total dietary fiber. 11,12 Supplemental Table 2 52,53 provides the FAO/WHO guideline ranges used by Sodjinou et al and in this article. Supplemental Table 3 lists the 8 dietary criteria used in the generation of the healthfulness indicator, and Supplemental Table 4 54 shows how our sample fared on average on each criteria.
As the last of the nutritional factor indicators, we create a handful of macronutrient diet composition scores. The Macronutrient Ratio Score (macroratiosc) is based on widely accepted guidelines of desirable ranges for energy proportions from carbohydrates, protein, and fat. 12,55 Points are awarded for ratios (carbohydrate: protein: fat) according to the following ranges: 55 to 65:10 to 15:15 to 25 = 6; 52 to 68:9 to 16:13 to 27 = 4; 50 to 70:8 to 17:12 to 30 = 2; otherwise = 0. (2) The ratio of monounsaturated to saturated fatty acids (monosatratio) is also used as its own nutritional factor indicator of diet quality, 12 with a higher score being more desirable. (3) Thirdly, the variables lippct, sfatpct, and pfatpct represent the total, saturated, and polyunsaturated fat shares of total energy.
Diversity indicators
The second set of indicators are measures of dietary diversity. These are computed in 3 ways. First, 2 scores (divscr13 and divscr7) are assigned according to the number of different complete food groups obtained by the household (note 6). Divscr13 uses the 13 food categorizations given in Zezza and Tasciotti (note 7), while divscr7 uses the 7 food groups from Smith and Subandoro. 48 Similar to Gaiha et al’s 5 groups mentioned in the third point of this section, divscr7 excludes beverages or miscellaneous groups (note 8).
Second, foodcount, also from Zezza and Tasciotti, 14 is the count of different food items obtained by each household. In our sample, households consumed between 1 and 43 items within the 1 week recall period.
Third, we follow the study by Gaiha et al 8 to create 2 food diversity indices generated as the sum of squares of the shares of the various food items in each food consumption basket. These scores better capture the heterogeneity of consumption than do the simple diversity scores. High values imply a more concentrated food basket, while low values imply a more diverse basket (note 9). Fdi13quant uses the 13 categories given in Zezza and Tasciotti. 14 Fdi13expen uses the same 13 but based on expenditure shares rather than quantity shares. A drawback of using any food diversity indicator as a measure of diet quality is that these all must include one or more un-nutritious foods or food groups. As such, increased dietary diversity cannot universally be considered a positive phenomenon.
Independent Variables
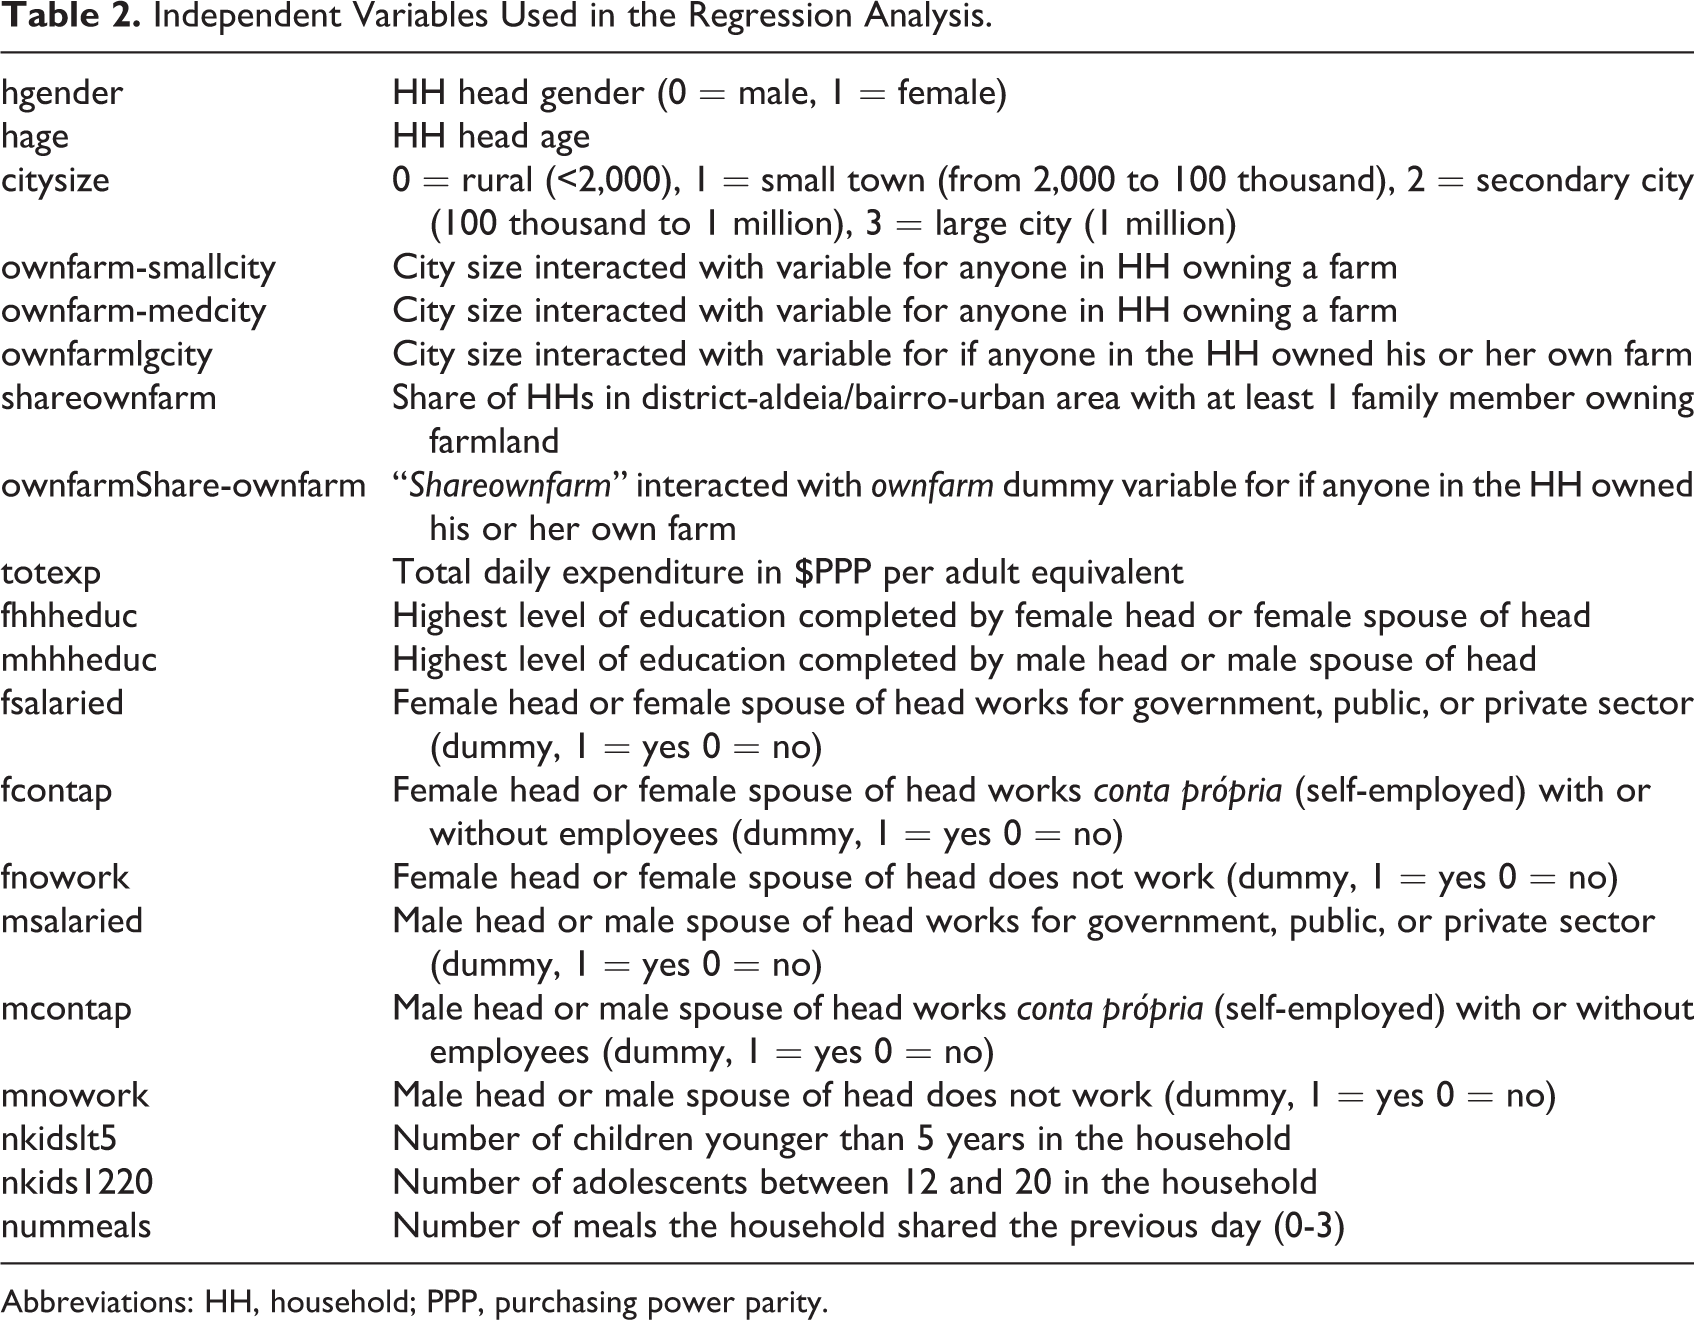
The independent variable definitions are reported in Table 2. Household demographic characteristics include the household head’s gender (hgender) and age (hage). We anticipate that female headed households make better dietary acquisition decisions for their families, consistent with a literature that has found women’s financial decision-making to be more practical than men’s. We anticipate that age of the household head is positively correlated with diet quality, as it seems concern and forethought concerning matters of health may increase with age.
Independent Variables Used in the Regression Analysis.
Abbreviations: HH, household; PPP, purchasing power parity.
A categorical variable for city size is included (citysize). Households fall into one of 4 groupings: rural, small towns (population from 2 to 100 thousand), secondary cities (from 100 thousand to 1 million), and a large city (greater than 1 million; note 10). We expect urbanization to be associated with lower quality diets based on a worsening of negative factors.
We then include 3 interaction terms of city size with a binary variable for whether the household owned a farm (ownfarm-smallcity, ownfarm-medcity, ownfarm-lgcity), since we expect that urban households might eat more healthy diets if they are producing and consuming whole foods from their own fields.
Proximity to other farms may also increase access to healthy foods such as fruit and vegetables. We thus include a variable for the share of households in the smallest surrounding geographical boundary (eg, town, urban extent) who have at least one family member owning an agricultural plot (shareownfarm). We expect the relationship of this variable to diet quality to be positive. We also interact ownfarm and shareownfarm to understand whether the impact of ownfarm is attenuated by the presence of many farms in one’s vicinity.
We include total daily household expenditure in $PPP per adult equivalents to proxy for household income (totexp). We expect that income growth is associated with simultaneous improvement in positive dimensions of diet and worsening of negative dimensions. We also posit that the income effect on diet does not significantly differ across rural and urban areas. We include 2 education level variables, one for the highest level of education completed by a female household head or the female partner of the male household head (fhhheduc) and the other for a male head or male partner of a female head (mhhheduc). We expect both to be positively associated with diet quality, with a greater effect for female education.
We include 3 categories of binary employment variables for the household head and his or her partner, also disaggregated by gender: Whether the individual holds salaried work, self-employed work, or is not working (fsalaried, msalaried, fcontap mcontap, fnowork, and mnowork). Controlling for income, we anticipate that diet quality is negatively associated with having salaried work due to the demands of shopping, preparing, and cooking nutritious home-made meals while working full time. We expect no impact from not having work. Controlling for female headedness, female education level, and income, we anticipate a greater negative effect on diet quality for fsalaried than msalaried, given that females typically maintain primary responsibility for food acquisition and preparation.
We include variables for the number of children younger than 5 years (nkidslt5) and the number of adolescents aged 12 to 20 (nkids1220). We expect that the positive dimensions of diet would be greater in homes with children younger than 5 years, while the negative dimensions of diet would be greater in a home with more adolescents. Finally, the number of meals (0-3) that the household consumed in a day is included (nummeals).
Results
Patterns and Drivers of Current Household Level Diet Quality
This section assesses the patterns and drivers of current household level diet quality (using nutritional factor and diversity indicators, as described in the Methods section) across city size categories, household income (proxied by total household expenditure), household education, and other demographic variables.
Descriptive Statistics
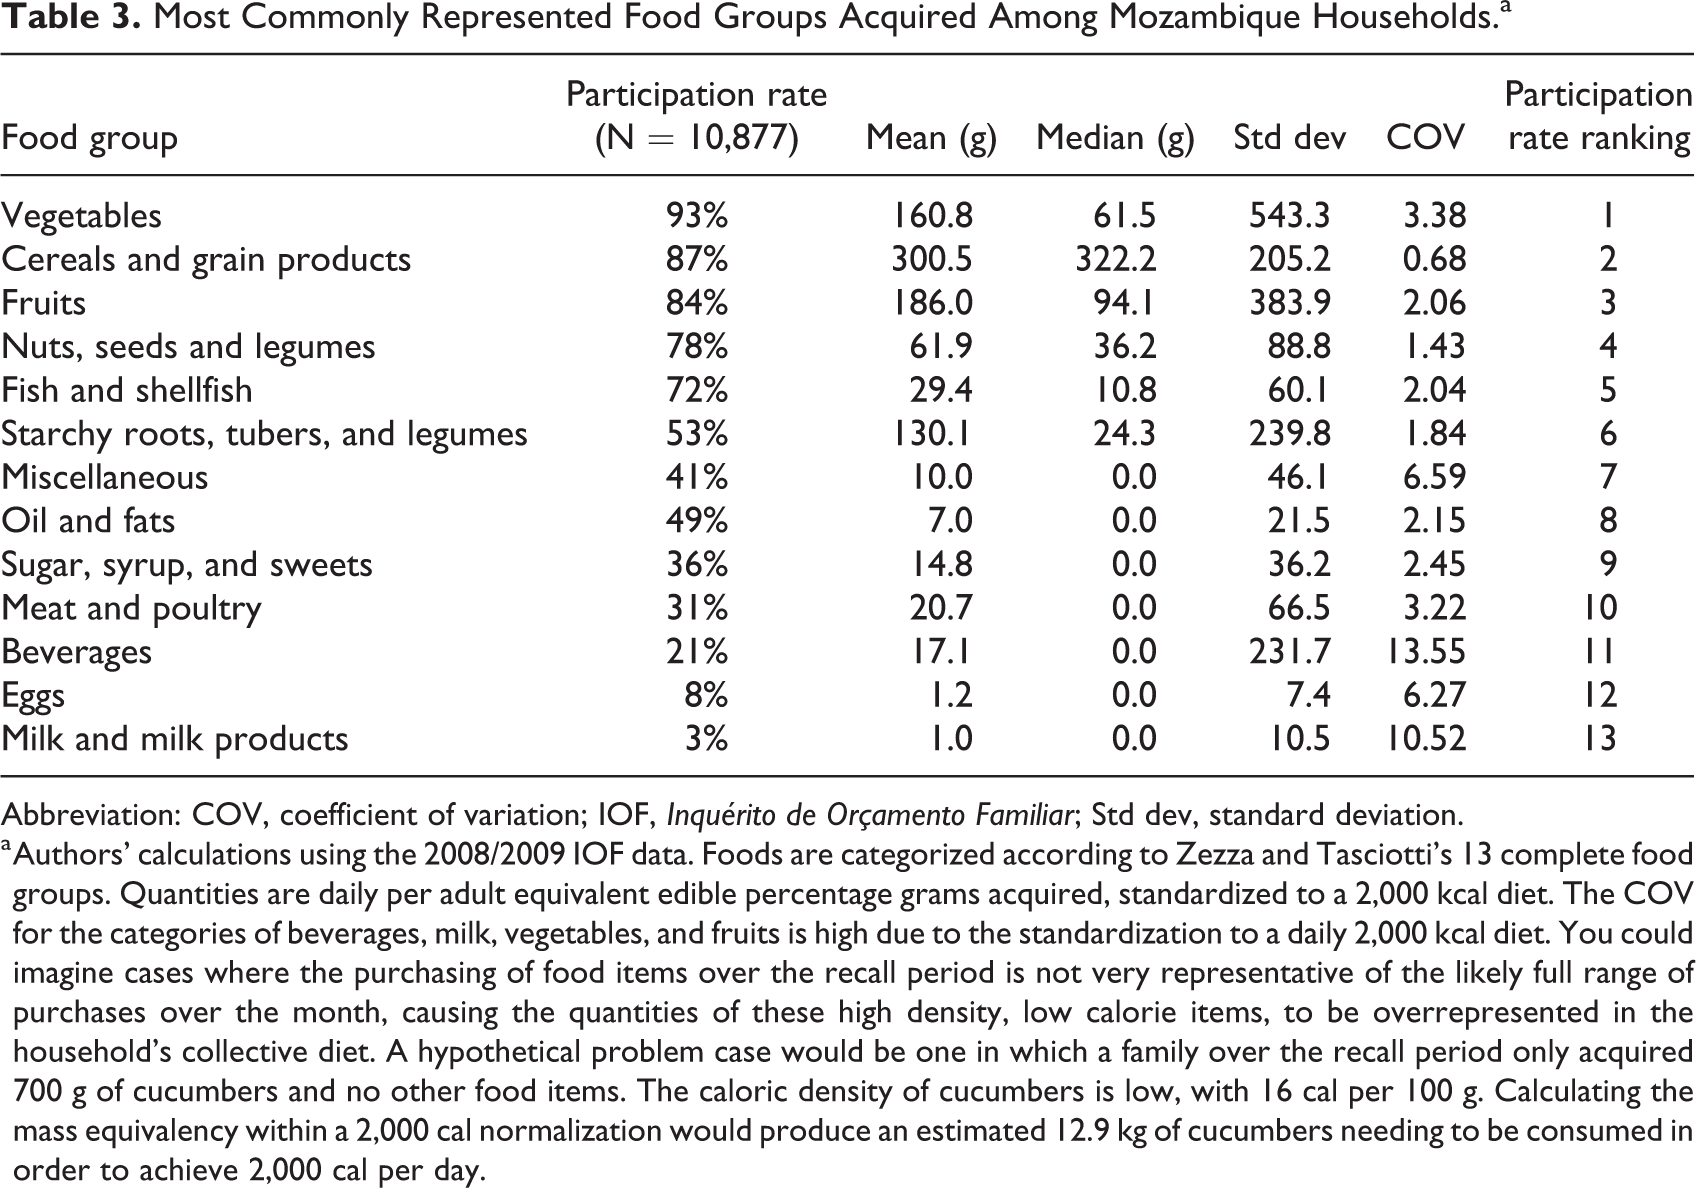
Using the per adult equivalent approach to normalize household food quantity acquisition, daily kilocalorie consumption per adult equivalent at the household level shows a median of 2056 kcal and a mean of 2,220 kcal/d. Both values are reasonable. The 6 most common foods households mention acquiring within the 1-week recall period are vegetables (93% of all households), followed in order by cereals; fruit, nuts, and legumes; fish and shellfish; and roots (see Table 3). Meats ranked 10th of 13, with 31% of households consuming meat. In quantities of food standardized to a 2,000 kcal diet per adult equivalent (as done by Imamura et al 46 ), cereals ranked highest at an average of 300 g/day/adult equivalent (primarily uncooked grains, although bread and other processed or prepared cereal products are also represented, eg, muffins or cake), followed in order by fruit; vegetables; roots; nuts, seeds, and legumes; and fish.
Most Commonly Represented Food Groups Acquired Among Mozambique Households.a
Abbreviation: COV, coefficient of variation; IOF, Inquérito de Orçamento Familiar; Std dev, standard deviation.
a Authors’ calculations using the 2008/2009 IOF data. Foods are categorized according to Zezza and Tasciotti’s 13 complete food groups. Quantities are daily per adult equivalent edible percentage grams acquired, standardized to a 2,000 kcal diet. The COV for the categories of beverages, milk, vegetables, and fruits is high due to the standardization to a daily 2,000 kcal diet. You could imagine cases where the purchasing of food items over the recall period is not very representative of the likely full range of purchases over the month, causing the quantities of these high density, low calorie items, to be overrepresented in the household’s collective diet. A hypothetical problem case would be one in which a family over the recall period only acquired 700 g of cucumbers and no other food items. The caloric density of cucumbers is low, with 16 cal per 100 g. Calculating the mass equivalency within a 2,000 cal normalization would produce an estimated 12.9 kg of cucumbers needing to be consumed in order to achieve 2,000 cal per day.
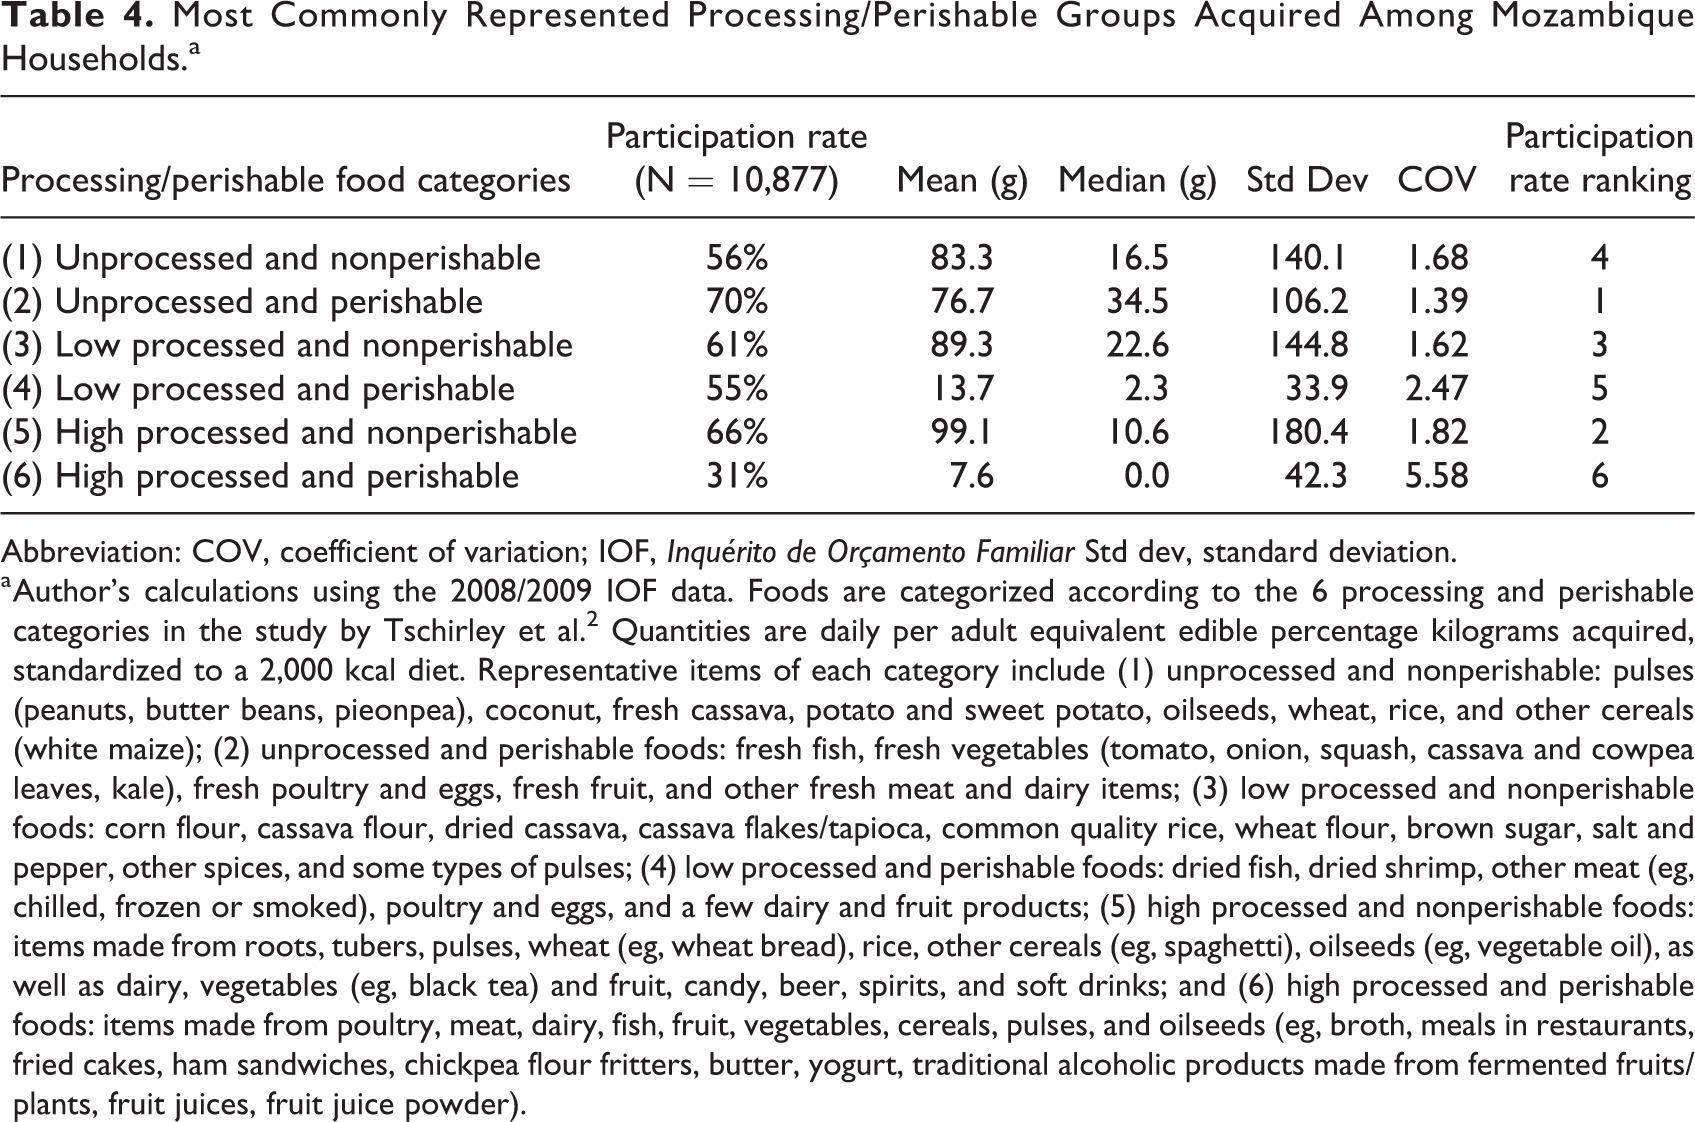
We follow the study by Tschirley et al 2,56 in categorizing food items into one of 3 levels of processing (unprocessed, processed with low value added, and processed with high value added) and one of 2 categories of either perishable or nonperishable. This process results in 6 processing-perishability groups, listed in Table 4. We find that unprocessed perishable foods (note 11) are the most commonly acquired items with a 70% participation rate, while highly processed perishable foods (note 12) are the least commonly consumed, with a 31% participation rate.
Most Commonly Represented Processing/Perishable Groups Acquired Among Mozambique Households.a
Abbreviation: COV, coefficient of variation; IOF, Inquérito de Orçamento Familiar Std dev, standard deviation.
a Author’s calculations using the 2008/2009 IOF data. Foods are categorized according to the 6 processing and perishable categories in the study by Tschirley et al. 2 Quantities are daily per adult equivalent edible percentage kilograms acquired, standardized to a 2,000 kcal diet. Representative items of each category include (1) unprocessed and nonperishable: pulses (peanuts, butter beans, pieonpea), coconut, fresh cassava, potato and sweet potato, oilseeds, wheat, rice, and other cereals (white maize); (2) unprocessed and perishable foods: fresh fish, fresh vegetables (tomato, onion, squash, cassava and cowpea leaves, kale), fresh poultry and eggs, fresh fruit, and other fresh meat and dairy items; (3) low processed and nonperishable foods: corn flour, cassava flour, dried cassava, cassava flakes/tapioca, common quality rice, wheat flour, brown sugar, salt and pepper, other spices, and some types of pulses; (4) low processed and perishable foods: dried fish, dried shrimp, other meat (eg, chilled, frozen or smoked), poultry and eggs, and a few dairy and fruit products; (5) high processed and nonperishable foods: items made from roots, tubers, pulses, wheat (eg, wheat bread), rice, other cereals (eg, spaghetti), oilseeds (eg, vegetable oil), as well as dairy, vegetables (eg, black tea) and fruit, candy, beer, spirits, and soft drinks; and (6) high processed and perishable foods: items made from poultry, meat, dairy, fish, fruit, vegetables, cereals, pulses, and oilseeds (eg, broth, meals in restaurants, fried cakes, ham sandwiches, chickpea flour fritters, butter, yogurt, traditional alcoholic products made from fermented fruits/plants, fruit juices, fruit juice powder).
To these 6 categories, we add 2 additional categories for own production-perishable and own-production nonperishable foods. We then examine the nutritional heterogeneity across these 8 groupings: (1) unprocessed and nonperishable, (2) unprocessed and perishable, (3) low processed and nonperishable, (4) low processed and perishable, (5) high processed and no-perishable, (6) high processed and perishable, (7) own produced and nonperishable, and (8) own production perishable.
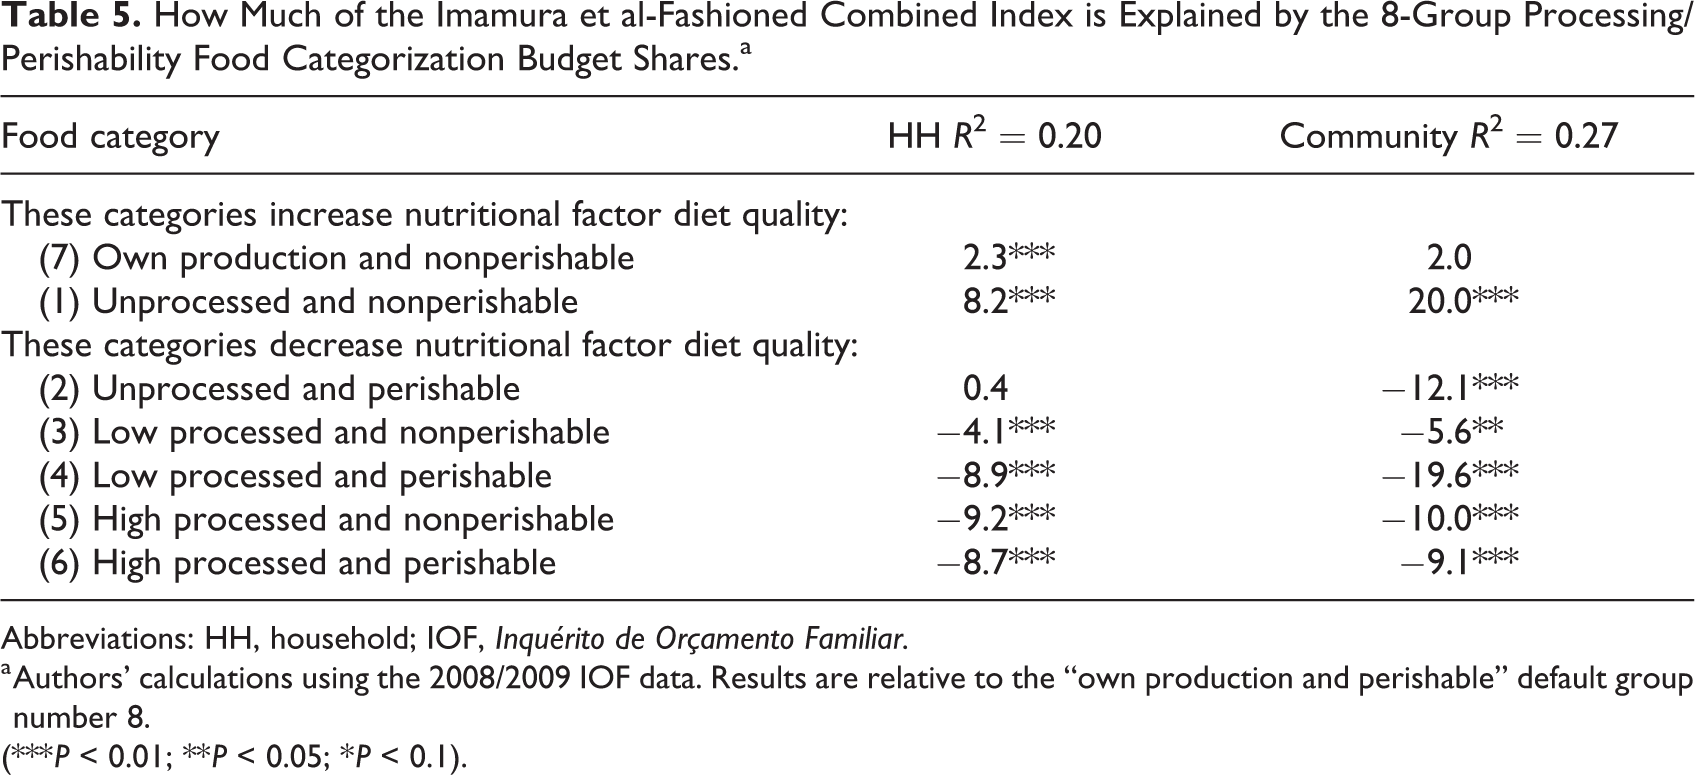
We use a regression to test for the explanatory power of food category budget shares on imindex_std (Table 5) and find that these 8 categories do indeed explain a fair part of it, with an R 2 of 0.27 at the community level and of 0.20 at the household level, and all but 2 categories significant in both levels. Relative to the own production perishable default group, an increasing share of only 2 food shares of 8 improve the imindex_std combined nutritional factor indicator index: own produced nonperishable foods and unprocessed nonperishable foods. Consumption of foods in any of the low or high processed food categories decreases this measure of diet quality.
How Much of the Imamura et al-Fashioned Combined Index is Explained by the 8-Group Processing/Perishability Food Categorization Budget Shares.a
Abbreviations: HH, household; IOF, Inquérito de Orçamento Familiar.
a Authors’ calculations using the 2008/2009 IOF data. Results are relative to the “own production and perishable” default group number 8.
(*** P < 0.01; ** P < 0.05; * P < 0.1).
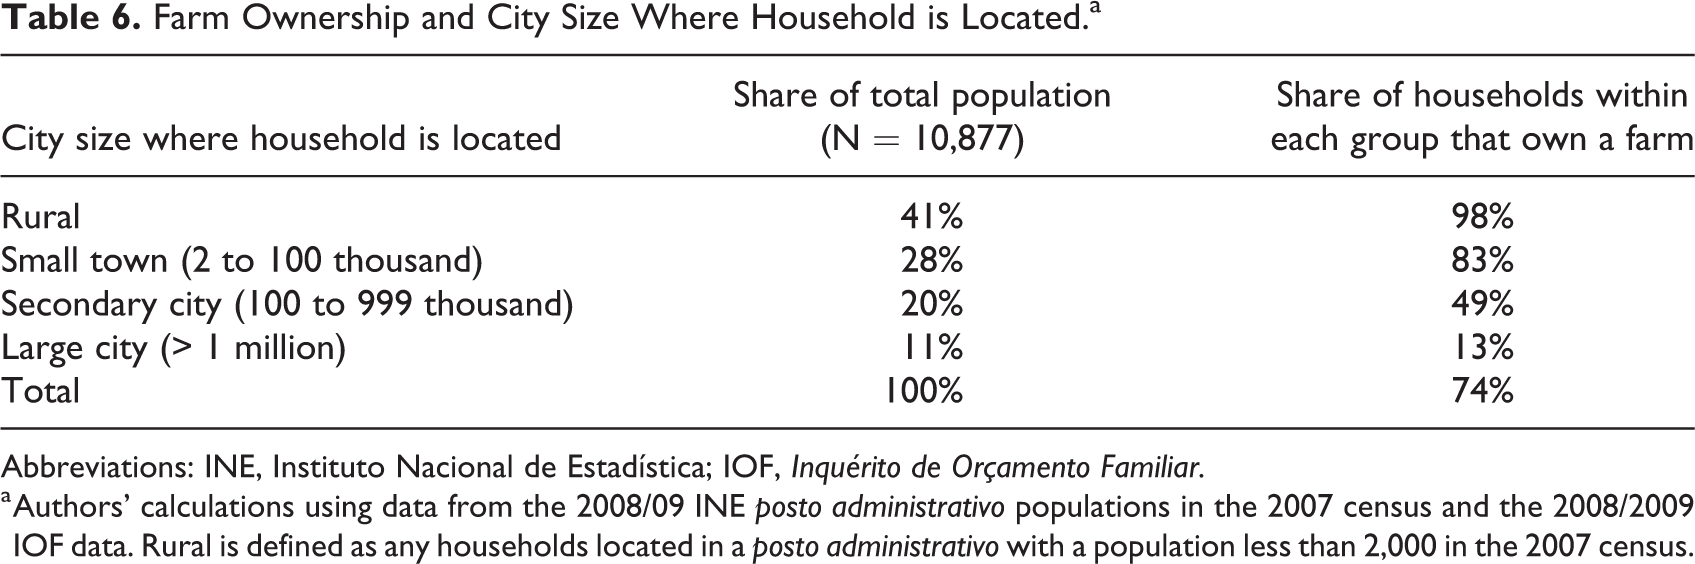
Finally, and perhaps not surprisingly, the share of households owning land falls sharply with increasing city size (see Table 6) but remains meaningful, at 13%, even in the largest city. As we will see in the next section, household diet quality indicators are also monotonically more negative with increasing city size.
Farm Ownership and City Size Where Household is Located.a
Abbreviations: INE, Instituto Nacional de Estadística; IOF, Inquérito de Orçamento Familiar.
a Authors’ calculations using data from the 2008/09 INE posto administrativo populations in the 2007 census and the 2008/2009 IOF data. Rural is defined as any households located in a posto administrativo with a population less than 2,000 in the 2007 census.
Regression Results
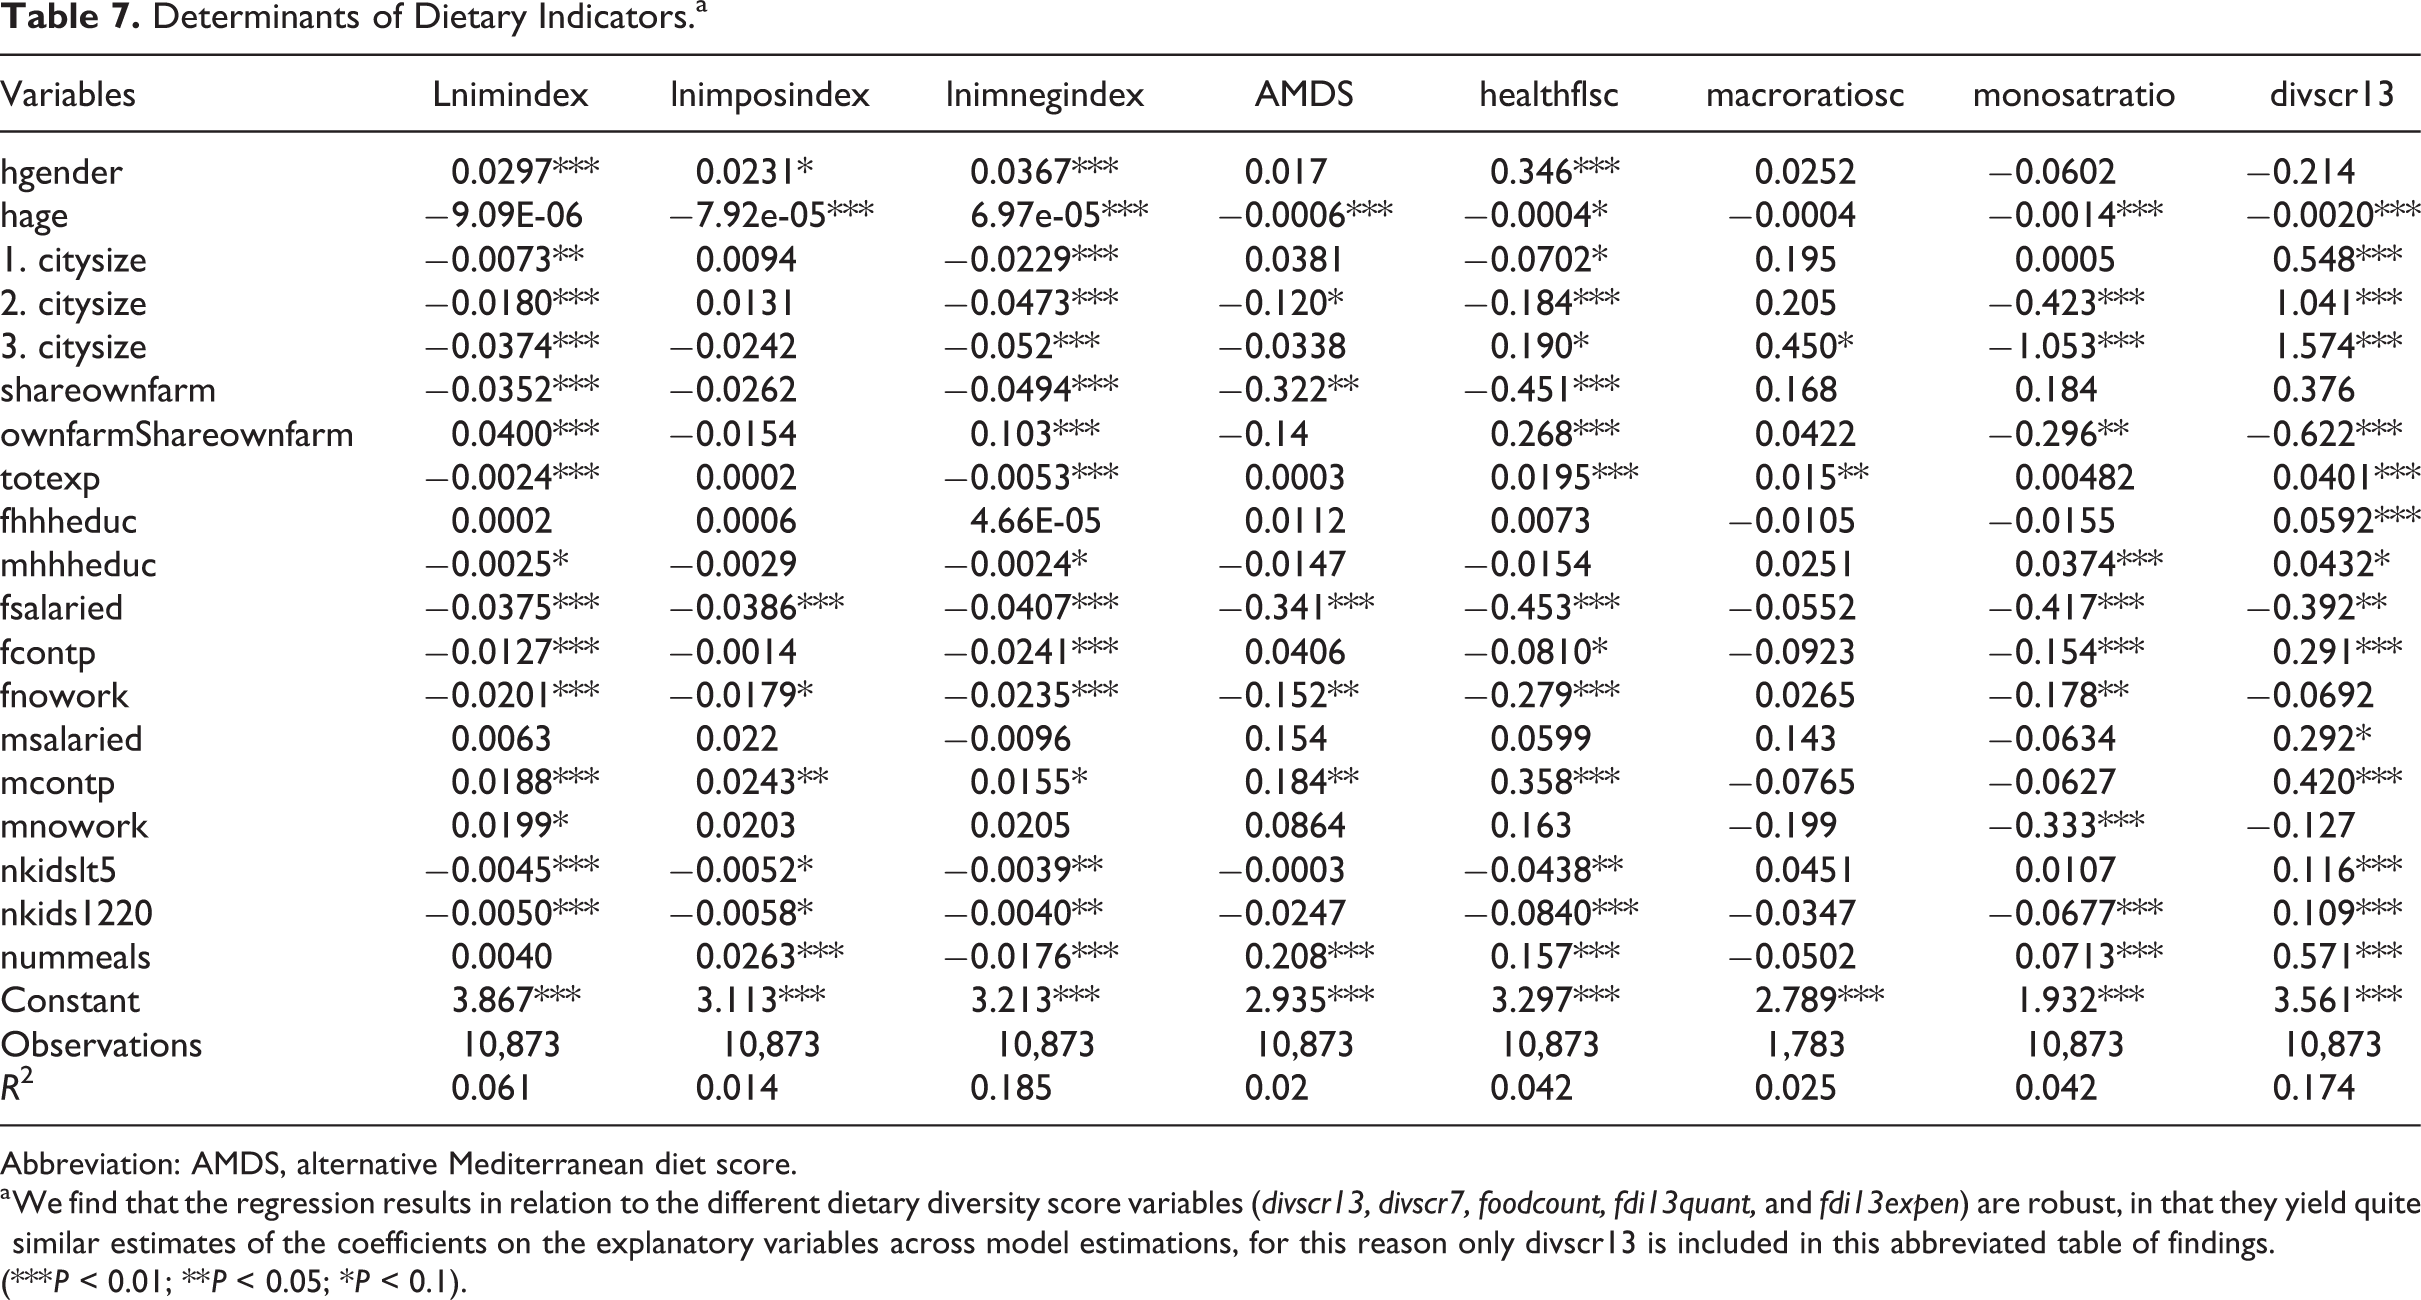
Here, we summarize our main regression takeaways. See the abbreviated set of regression results in Table 7 and refer to Supplemental Tables 6, 7 and 8 for more complete results, including from additional specifications of the model. Summarizing across all results, 5 broad patterns stand out. First, female headed households tend to have higher quality diets. Second, increasing age tends to decrease diet quality, contrary to our expectations. Third, diet quality declines monotonically with rising city size, driven primarily by rises in negative factors. Fourth, owning a farm decreases diet diversity but increases diet quality as measured by nutritional factor indices, by increasing positive factors and decreasing negative ones. Fifth, expenditure and education have broadly similar effects as living in cities, increasing diversity but driving a greater increase in negative than positive factors, thus driving down the nutritional factor indices. In the rest of this section, we discuss these results in more detail.
Determinants of Dietary Indicators.a
Abbreviation: AMDS, alternative Mediterranean diet score.
a We find that the regression results in relation to the different dietary diversity score variables (divscr13, divscr7, foodcount, fdi13quant, and fdi13expen) are robust, in that they yield quite similar estimates of the coefficients on the explanatory variables across model estimations, for this reason only divscr13 is included in this abbreviated table of findings.
(*** P < 0.01; ** P < 0.05; * P < 0.1).
A household being headed by a female has a positive and significant effect on diet quality in 4 of the 8 test indicators presented in Table 7 (all 3 Imamura scores and healthflsc), positive and insignificant in 2 (AMDS and macroratiosc), and negative but insignificant in 2 (monosatratio and divscr13). These effects are significant particularly in the case of the imindex_std, imposindex_std, and imnegindex_std scores by between 2.3% and 2.7% in the case of increased positive dimensions, depending on which normalization approach is used (note 13), and by between a 2.8% and 3.7% improvement in the case of negative dimensions, with an overall increase of 2.7% to 3.0% on the combined imindex_std scale. Having a female head has a positive effect on the household’s healthfulness score, as well, by a score increase of 0.35 on a scale of 1 to 7. Food group expenditure share regressions (Supplemental Table 8 [note 14]) indicate that female headed households consume significantly greater shares of cereals (by an increase of 4.1) and vegetables (by an increase of 1.6) and by significantly lower shares of sugars, syrups, and sweets (by a decrease of 0.4) as well as oils and fats (by a decrease of 0.6).
Increasing age of the household head overall has a negative effect on diet, contrary to our expectation, corresponding to small significant decreases in acquisition of both positive and negative items of the Imamura-based indices. The positive index score decreases by 0.008% to 0.010%, and the negative index score decreases by 0.007% to 0.009% for each increasing year the household head ages. Increasing age of the household head has a small but robust and significant negative effect on dietary diversity across dietary diversity measures (by a lower food count of 0.002 to 0.003 items, eg, for each increasing year the household head ages). It similarly has a negative effect on the Mediterranean diet score, healthfulness score, and monosaturated to saturated fat ratio by a significantly lower score of 0.0006, 0.0004, and ratio of 0.0014, respectively, per additional year in age of the household head. However, age has a significantly positive effect on the fat share of total energy consumed, by 0.009%. The results suggest that as household heads age, their diet choices for the family become less diverse—higher in cereal consumption—but also lower in consumption of sugars, fats, and oils (see Supplemental Table 8).
Living in an urban area has an increasingly negative effect on nutritional factor diet quality indicators the larger the city, robust across our Imamura-based indices and the mono/saturated fat ratio. These effects are most significantly influenced by increased negative food item consumption in larger cities but are also affected by a decrease in the purchases of positive food items in these same areas. Compared to a rural area, the effect on the combined imindex_std index in the case where the alternative normalization of per capita daily calorie consumption is used (Supplemental Table 7) is −1.8% in a small town, −4.6% in a secondary city, and −6.9% in a large city (all coefficients significant at the P <.01 level). These same effects in the original normalization of daily consumption are similar at −0.7%, −1.8%, and −3.7%, respectively; 0.00, −0.42, and −1.05, respectively, for the mono/saturated fat ratio; and −0.07, −0.18, and 0.19 for the healthfulness score. The decrease in the positive food item scale begins with 0.1% when the household is in a small town, to a negative 5.2% in a secondary city, to a negative 8.9% in a large city (see Table 7). The increase in the negative food item scale begins with 0.1% for households in a small town and rises to 3.8% to 4.8% in a large city.
At the same time, living in an urban area has an increasingly positive effect on dietary diversity as city size increases, robust across diversity indicators. Households in small towns eat 0.7 more foods over the reference period compared to households in rural areas, 2.1 more food items if in a secondary city and 5.1 more items if in a large city. As the results on the diversity indicators of diet quality indicate, however, this increasing diversity tends to be less nutritious. Food group expenditure share regressions indicate an increase specifically in sugar, fat, and (nonspecific) beverage shares of food expenditures for nonrural households, for example a significant 2.7 share increase in beverage shares in a large city. And vegetable and nuts/seeds/legume shares progressively decrease from a significant −0.8% to −1.4% to −1.8% for nuts/seeds/legumes and in, respectively, small, medium, and large cities −0.4% to −3.5% to −11.0% for vegetables.
The share of fruit purchased for household consumption declines by a significant 1.5% for households in small towns compared to rural areas but increases by 1.8% in cities greater than 1 million compared to rural areas. This may be due to more developed value chains serving large cities as well as greater supply of imported produce from neighboring countries such as South Africa. There is still room for progress in developing horticultural value chains to reach consumers in middle size and smaller towns in cost-effective ways. Our regression results also show that shares of fish purchases increase by 2.1% and 5.4% as the location of the household moves from rural to a small town, and then to a medium size urban center. Again, this positive trend across increasing city size may be related to the greater access that towns and urban centers have to fishing ports, another commodity that requires a short or cold value chain to deliver freshness (and quality) to its consumers, which rural areas lack.
An increasing share of households with at least one member who owns a farm within their surrounding area (defined as a geographical unit with 6 to 84 households or an average 15) has a negative effect on nutritional factor dietary indicators (both the imposindex_std and imnegindex_std indices, the healthfulness score, and the AMDS). Contrary to our expectations, this is perhaps picking up in part on farming households located in lower income urban areas via the increase in acquisition of negative items rich in oil and fats.
Owning one’s own farm, controlling for the share of those who own their own farm in the surrounding areas, has a positive and significant effect on nutritional factor diet quality as measured by the combined imindex_std index, by 4.0% to 5.1% (depending on the normalization approach used). This result is driven by the large and significant decrease of 10.3% to 10.6% in the negative index (with a small and insignificant effect on the positive items consumed index) and corroborated by a significantly higher healthfulness score of 0.3 on a scale of 1 to 7 and a significant decrease of 2.7% in the share of total fat calories in the diet. As posited in the Methods section, we presume that households who own their own farm probably eat fewer unhealthy food items because they are producing more of their own food for consumption or trade and rely less on purchasing food at the market. At the same time, owning one’s own farm also has a negative and significant effect on dietary diversity. This would make sense if the farmer’s family is more self-reliant and thereby visits a market less frequently. Food group expenditure share regressions indicate households who own their own farm consume significantly greater shares of cereals/grains, starchy/roots/tubers/legumes, and nut/seed/legumes by 9.5%, 6.8%, and 3.0%, respectively, and consume significantly lower shares of sugar, fat, beverages, and meat by −1.0%, −2.6%, −1.7%, and −3.9%, respectively.
Total expenditure has a consistent, significant, and negative effect on nutritional factor diet quality as measured by the Imamura-based indices, decreasing the combined score by 0.001% to 0.2% per international dollar spent; however total expenditure has mixed effects on dietary diversity depending on the method used to normalize daily acquisition quantities—the per adult equivalent method or a 1,000 cal normalization technique. In the per adult equivalent normalization approach (see Supplemental Table 6), total expenditure has a positive and significant effect on all the dietary diversity measures, increasing the number of food items acquired by 0.07, for example. In the alternative normalization approach (see Supplemental Table 7), total expenditure has a negative effect on dietary diversity, with some of the measures showing small significant coefficients, for example, a decreased number of food items acquired by 0.004. Total expenditure has a significantly positive effect on the healthfulness score, on the macronutrient ratio score, both by 0.02 and both indicators only included in the original set of regression results, and consistently has a significantly positive effect on the polyunsaturated fat share of total energy (by 0.0002). These mixed positive and negative results across nutritional factor and diversity factor diet quality indicators are hard to explain and are discussed further in the next section on evolution of diet quality with increasing incomes. Food group expenditure share analysis indicates a significant increase specifically in shares of meat (0.4%), beverages (0.3%), eggs (0.02%), and milk (0.02%) and a significant decrease in vegetables (−0.2%); fruit (−0.1%); fish (−0.2%); nuts, seeds, and legumes (−0.2%); roots and tubers (−0.4%); and sugary food (−0.04%) shares.
Both male and female household head education has a positive effect on dietary diversity, educated female heads, more strongly so—the female educated head coefficient against each dietary diversity score has a greater magnitude than each male educated head coefficient, and all are significant, while only the diversity scores that were not calculated via an index are significant in the case of male educated heads, consistent across either standardization method. For each additional year of education of a female household head, the number of food groups represented in the household’s diet increases 0.06 to 0.08 of 13 possible food groups. For each additional year of education for a male household head, this effect is 0.04 to 0.06. Food-specific regressions indicate an increase specifically in milk and meat expenditure shares among households with female heads possessing greater levels of education.
Greater years of education of male heads specifically increases consumption of negative items (−0.3% on the combined imindex_std score and −0.2% on the imnegindex_std negative food items index per additional year of male household head education), while also having a positive effect on the monosaturated to saturated fat ratio via a significant reduction in consumption of saturated fats by a negative 0.1% per additional year of male household head education. The effect on these indicators of female household head education was insignificant. Food-specific regressions indicate a decrease specifically in nuts/legumes (−0.3%) and vegetables (−0.2%) expenditure shares and an increase in oil/fat (0.1%) and beverage (0.1%) shares for each additional year of male household head education.
Across the categorizations of salaried employment, self-employment and unemployment for household heads and their spouses, male conta propria self-employment is the only category of employment among male or female household heads which has robust, significant, and positive effects on nutritional factor and diversity factor diet quality measures, including increased dietary diversity, increased healthfulness and AMDS scores, and a decreased saturated fat percentage of total energy. It appears these positive effects are driven by both a significant increase in positive food or nutrients acquired and significant decrease in negative food or nutrients acquired among these households (2.1%-2.4% increase in positive items and 1.6%-2.8% decrease in negative items). Food group share-specific regressions indicate a significant increase in cereals and grain expenditures by 4.0% and a significant decrease in oil and fat expenditures by −0.7% among this group.
At the same time, female salaried employment among household heads or female household head spouses is the only employment category among male or female employment categories, which has a significant and negative effect on dietary diversity, the AMDS, the healthfulness score, and the monosaturated fat ratio (the latter, driven by significant increases in saturated fat). It appears these negative effects are driven by both a significant decrease in positive food or nutrients acquired and significant increase in negative food or nutrients acquired among these households (3.9%-4.2% decrease in positive items and 2.7%-4.0% increase in negative items). The same trend does not appear to be the case at all for male household heads or male spouses of household heads who have salaried employment. This as well as other employment categories had more mixed results, sometimes positive and sometimes negative depending on the outcome variable. Food group share-specific regressions indicate a significant decrease in the cereals group share of expenditures among female salaried employee heads or spouses to heads by 3.6%.
Having kids less than 5 years old and adolescents aged 12 to 20 have a generally negative effect on household diet (−0.1% to −0.5% effect on the combined imindex_std index of each additional child in the household younger than 5 years old and a −.03% to −0.5% effect of each additional household member 12 to 20 years old), although this effect is not significant across all results. The strongest driver derives from increased negative food item consumption (by 0.3%-0.4% on the negative food items index), especially among families with adolescents. Only in the alternative normalization technique (Supplemental Table 7), a variable for number of household equivalents is included. We find that with each additional adult equivalent in the household, the negative food item index improves by a significant 0.3%, although the ratio of monosaturated fat to saturated fat decreases by a significant −0.06.
Expected Evolution of Diet Quality as Incomes Rise
By looking at nutrient expenditure elasticities, the measures of proportional changes in the consumption of a given nutrient in response to a given change in total expenditure, we begin to address the question of how diet quality is likely to evolve given expected income growth. Although the results on the expenditure relationship to diet quality are mixed in the analysis of the drivers and patterns of dietary decisions above, the food expenditure elasticity to the Imamura-based nutritional factor diet quality indices are positive and insignificant. That is to say, for a 10% increase in food spending, the dietary value of food purchased as measured by this index is better, although not significantly so. However for an increase in overall spending (a proxy for income), nutritional factor diet quality, as measured by the Imamura et al-fashioned indices, decreases, and this result is significant.
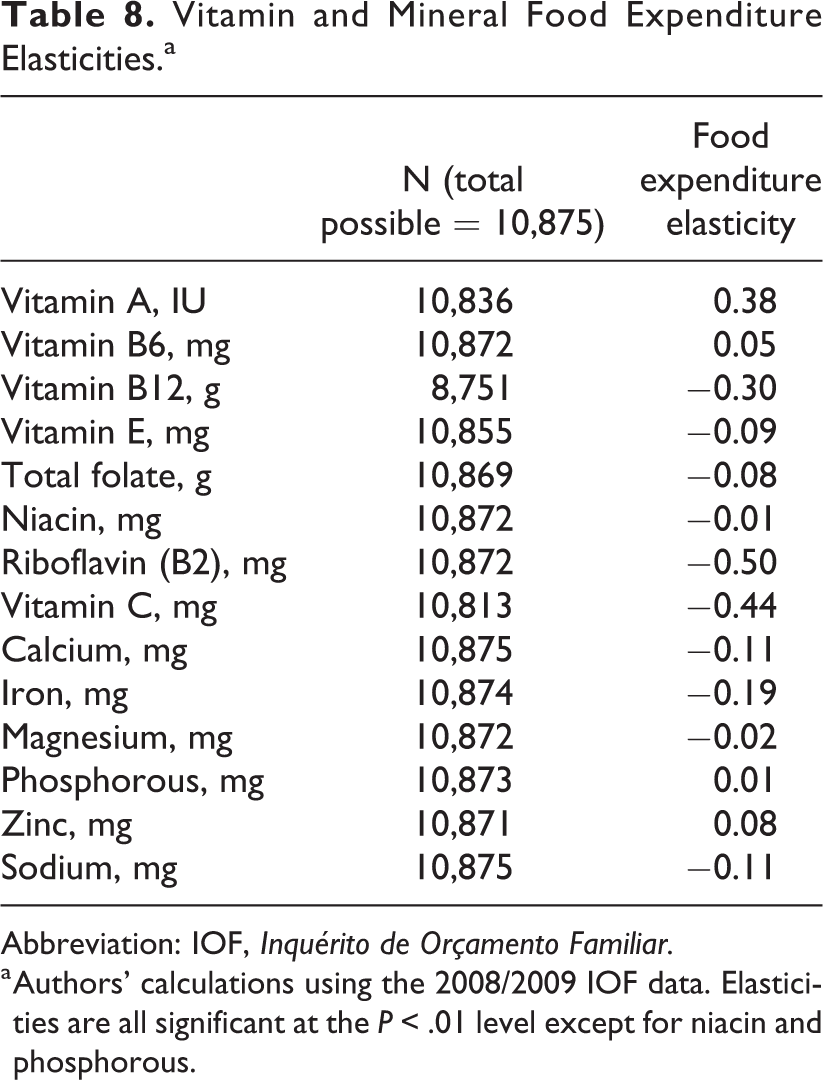
The nutrient expenditure elasticity of demand with respect to normalized total daily expenditure on food shows that while vitamin A is projected to increase with increasing expenditure on food, vitamins C, riboflavin, and vitamin B12 are projected to substantially decrease (Table 8).
Vitamin and Mineral Food Expenditure Elasticities.a
Abbreviation: IOF, Inquérito de Orçamento Familiar.
a Authors’ calculations using the 2008/2009 IOF data. Elasticities are all significant at the P < .01 level except for niacin and phosphorous.
There can be no doubt that falling vegetable and fruit food shares with total household expenditures are one of the drivers of these results. And as mentioned in the previous section, the food group expenditure shares of roots/tubers/legumes, nuts/seeds, cereals/grains, and fish/shellfish are also expected to decrease with increasing total expenditure, while meat, egg, and beverage shares increase.
Discussion and Conclusions
In conclusion, we return to the 5 hypotheses mentioned in the introduction. One, as we hypothesized, the consumption of processed foods is significantly and strongly associated with the worsening of negative factors in the diet. Two, income growth is associated with the worsening of negative dimensions of diet and is not consistently associated with improvement in positive dimensions of diet. In fact, our results show the troubling result of significant decreases in several positive dimensions of diet with households’ rising income.
Three, whether the income effect on diet does significantly differ across rural and urban areas depends on the method of standardization applied to household food acquisition. When normalized to a 1,000 cal diet, the negative income effect does not significantly differ across rural and urban areas, as we hypothesized. However, when normalized by day and per adult equivalent, the income effect is negative and significant in the urban areas but positive and significant in the rural areas.
Four, as we hypothesized, urbanization, controlling for income, is associated more strongly with a worsening of negative factors than with improvement in positive factors.
Five, as described in our Methods section, we assumed that households interested in eating fresh foods are more likely to seek out land to farm so that they can eat more fresh food, regardless of if they are actually able to achieve access to land to do so or not. In this thought experiment, we then asked, for those that do gain access to farm land, does this allow them to eat even more healthy diets than they would otherwise? Our results show that as we hypothesized, controlling for the share of others in one household’s area that have a farm, the effect on nutritional factor diet quality of owning one’s own farm is positive and significant, primarily driven by these households purchasing lesser amounts of negative food items.
As the Mozambican middle class grows and urbanization continues, this analysis shows that making good diet choices may be a challenge particularly for educated men and salaried women who are household heads or spouses to their household’s head, as well as families including adolescents and children younger than 5 years. We also find that consumption of processed foods corresponds to a negative effect on nutritional factor diet quality. Especially in urban settings, we might conjecture that even if ultraprocessed, sugary, fat-dense foods, or foods otherwise critically lacking in essential nutrients became the most accessible and convenient food to be found, this study provides evidence that there are many households, even in urban contexts, who are growing for themselves some of the food they consume at the same time. Our study provides evidence that for those living in urban areas, growing food on one’s own farm is associated with acquiring more healthy items in their diets in general and achieving improved diets compared to their counterparts. As urbanization continues and incomes rise, African cities need to consider what mix of policies and programs might counteract the negative effects we see from both these factors on diet quality. Promoting some continued farming might be part of that mix but will depend on factors specific to each city and must be complemented by additional initiatives that might reach more broadly across the urban population.
Supplemental Material
Supplemental Material, Supplemental_material - Diet Quality and Urbanization in Mozambique
Supplemental Material, Supplemental_material for Diet Quality and Urbanization in Mozambique by Jennifer Cairns Smart, David Tschirley and Francis Smart in Food and Nutrition Bulletin
Footnotes
Author’s Note
Acknowledgments
The authors wish to acknowledge 2 anonymous reviewers who provided constructive comments on an earlier version of this manuscript that allowed us to improve it substantially as well as former MSU graduate students Mayuko Kondo and Michael Dolislager, who each provided some of the initial data work to help classify the Mozambique IOF food items into processing and perishability categories and assign food composition table attributes to each of the food items, respectively.
Declaration of Conflicting Interests
The author(s) declared no potential conflicts of interest with respect to the research, authorship, and/or publication of this article.
Funding
The author(s) disclosed receipt of the following financial support for the research, authorship, and/or publication of this article: This work was undertaken as part of the CGIAR Research Program on Policies, Institutions and Markets (PIM) led by the International Food Policy Research Institute (IFPRI). Financial support for this study was provided by the United States Agency for International Development (USAID) through the Mozambique Policy Analysis and Planning Capacity for Improved Food Security and Nutrition Outcomes (MOZCAPAN) project. The opinions expressed in this document are the authors' responsibility and do not reflect the official position of USAID, PIM, IFPRI, Michigan State University (MSU), or the CGIAR.
Notes
Supplemental Material
Supplemental material for this article is available online.
References
Supplementary Material
Please find the following supplemental material available below.
For Open Access articles published under a Creative Commons License, all supplemental material carries the same license as the article it is associated with.
For non-Open Access articles published, all supplemental material carries a non-exclusive license, and permission requests for re-use of supplemental material or any part of supplemental material shall be sent directly to the copyright owner as specified in the copyright notice associated with the article.