
Abstract
Background:
Food environment (FE) has been linked to obesity in urban areas, but there is limited information in rural areas, particularly in developing countries, where prevalence of obesity is high.
Objective:
To determine the association between FE and childhood obesity using Geographic Information Systems (GIS).
Methods:
A total of 218 (8-10 years) children participated in a cross-sectional study. Weight, height, and body fat were measured. Geolocation of convenience stores (CS) and participants’ households was collected, and the amount of processed food (PF) in the stores was measured. The proximity to the nearest CS and the number of CS within a 250-m buffer from each participant’s household was calculated using GIS. Linear regression models between obesity measurements and FE were performed.
Results:
The combined prevalence of overweight and obesity was 32%. A total of 91% of the children had access to a CS within 250 m. On average, 48% of the shelf-space of the CS were occupied with PF. A positive association between the density of CS with body fat % (β = .145; 95% CI, 0.048-0.241, P = .004), abdominal fat % (β = .206; 95% CI, 0.048-0.241, P = .003), and body mass index (BMI)-for-age z-score (BMIz; β = .028; 95% CI, 0.005-0.062, P = .005) was found. Living closer to CS was associated with increases in body fat % (β = −0.009; 95% CI, −0.017 to −0.001, P = 0.025), abdominal fat % (β = −0.012; 95% CI, −0.023 to −0.001, P = 0.033), and BMIz (β = −0.002, 95% CI, −0.004 to −0.001, P = 0.003).
Conclusion:
In a rural community in Mexico, a high density and low proximity to CS is associated with obesity in school-aged children.
Introduction
Almost 30% of Mexican children are either obese or overweight. According to nutrition and health surveys, prevalence of childhood obesity has stabilized in urban areas while it still rising in rural areas of Mexico. 1,2 Overweight and obese children have an increased risk of oxidative stress, inflammation, and insulin resistance, and they are more likely to remain obese throughout their life. 3 Obesity is the result of the balance between energy intake and expenditure and a complex interaction with socioeconomic, physiological, and genetic factors. 4 In addition, new insight has proved that food environment (FE), which has been defined as the entire environment that influences food selection and food intake, 5 plays a key role in the etiology of obesity. 6,7 The FE includes food stores and food service establishments, such as convenience stores (CS), supermarkets, local markets, restaurants, and fast food stands, among others. 8,9 In the developing world, it is also possible to find small CS or neighborhood CS, and these stores represent an important economic model for the retailing business. 10 In Mexico and some parts of Central America, these small CS are called “tienditas” or “misceláneas,” are usually family owned, and are mainly run by the women in the households. 11 By definition, “tienditas” are CS that provide rapid access to essential products such as food staples (tortillas, rice, beans, eggs, bread, sugar, vegetables, canned foods), toiletries (soap, detergents, toothpaste, toilet paper), processed foods (PF; candy, chips, cookies), and some sell other items such as school supplies. 11
Studies addressing the association between FE and obesity have shown contrasting results among ethnicities, age groups, areas (urban vs rural), and countries. 9,12 -17 For instance, proximity to supermarkets in Indiana, United States, has been associated with a healthier diet and negatively associated with overweight and obesity in children and adolescents (3-18 years). 14 -16 In contrast, availability of CS within a 400-m buffer was associated with a higher risk of overweight and obesity in 6- to 7-year-old girls living in Northern California. 9 In addition, it has been observed that income and ethnicity are associated not only with the location, size, and the number of stores present in the FE but also with the selection of available food. 17 It is important to consider that most of the studies on this topic have come from developed countries, in urban settings, and have been done in adult populations. Interestingly, even though Mexico has one of the highest rates of obesity worldwide, there is limited information concerning the association between FE and obesity, and the available information is from urban areas. For instance, one study in 2 urban settings found that the number of mobile food vendors around schools was positively related with children’s body mass index (BMI). 18 In rural settings from developing countries, most families get their food from CS and it is common for children to play a role in household food purchasing. 11
Using Geographic Information Systems (GIS) provides a reliable and objective measurement on FE. 19 A large list of proxies have been used to evaluate FE, such as the stores within a given radius, the proximity to the nearest food store, and the shelf-length of highly PF and non-PF. 20 A major challenge is to identify proxies that better represent FE and that consider social, racial, physical, and age-related factors in a community or an individual. 19,21
Given the high rates of overweight and obesity in Mexico and the large proportion of the population living in rural communities, the main objective of this cross-sectional study is to assess the association between obesity and FE in children of rural Mexico.
Methods
Population and Study Design
A cross-sectional study was conducted among 218 children (8-10 years) from a rural community named Santa Cruz in the municipality of El Marques within the state of Queretaro, Mexico. The community has a population of 3902, the ethnicity is predominantly mestizo (mixed-race individual), and agriculture is the main economic activity. The nearest supermarket is in the city of Queretaro (nearest metropolitan center), 35 km away from El Marques, so people from the community usually buy their food from small CS (“tienditas” or “misceláneas”).
Children were recruited from the elementary school in the community. Parents were asked to attend a meeting where the study procedures were explained. Those who agreed to participate signed consent forms and were included in the study. Also, children provided their assent to participate. Children who were under a prescribed physical activity or diet regimen were excluded from the study. This study was conducted according to the guidelines of the Declaration of Helsinki and all procedures involving human participants were approved by the Bioethics Committee of the Universidad Autónoma de Querétaro (UAQ).
Demographic Questionnaire
A demographic questionnaire was answered by the caretaker. The questionnaire included information related to their living conditions (number of rooms in the house, inside running water, and home appliances, among others), main mode of transportation, family income, and caregiver’s level of education. The information in the questionnaire was used to determine the socioeconomic level of the participants’ households.
Physical Activity
Physical activity was estimated using a validated questionnaire, specifically for Mexican populations. 22 According to the compendium of physical activities of Ainsworth, 23 the intensities of the physical activities were categorized in 3 using the number of the metabolic equivalent of task (Mets): light (< 3 Mets), moderate (3-6 Mets), and vigorous activity (> 6 Mets). The resulting hours of each type were divided into days of the week to obtain daily hours practiced of each type of activity.
Anthropometry and Body Composition
Children were transported with their mothers from the community to the Nutrition Clinic at the UAQ. Weight, height, and waist circumference were measured twice with a precision of 0.1 g or 0.1 cm, respectively, in all children by trained personnel following the World Health Organization (WHO) procedures. 24 Children were weighed barefoot and wearing light clothes, using a calibrated digital scale (SECA, mod 813). Height was measured using a stadiometer (SECA, mod 206). Nutritional status was calculated based on the WHO criteria of BMI-for-age for children aged 5 to 19 years using the Anthroplus software. Underweight was defined as 2 z-scores below the WHO reference median, overweight as 1 standard deviation above the WHO reference median, and obese as 2 SDs above the reference median of the BMI-for-age z-score (BMIz). 25 Whole-body composition was also measured by a certified technician using dual-energy x-ray absorptiometry (DXA; Hologic Mod Explorer). Body fat percent and body fat content (kg) were recorded from the values provided by the DXA. Abdominal fat percent and abdominal fat content (kg) were estimated following procedures described by Hill et al. 26 High body fat for girls was considered above 30% and above 25% for boys. 27,28
Geographical Data
The geolocation of each participant’s household, of all the CS available in the community, and of the school in the community were obtained using “Open Data Kit tool” that was preinstalled in android OS devices equipped with a Global Positioning System chip. We identified through a community audit, 2 types of stores in the community. The first stores that were identified were the “tienditas” or “misceláneas,” typical family owned found in Mexico. The second type of food stores found were “food venues,” which are local or ambulant small stalls that usually sell 1 or 2 products, such as “aguas frescas” (sugar sweetened fruit drinks), homemade fried chips, and candies, among others. For the purpose of this study, we analyzed only CS, since this is where the inhabitants acquire most of their food. 29 The community audit was done by foot, and data collection was obtained from August 2016 until May 2017.
In-Store Availability
Using a measuring tape, a 2-person team measured the shelf-length (m) of PF and non- or minimally processed foods (NMPF) to the nearest centimeters. 30 The PF were defined as those foods processed to help preserve and enhance nutrients and freshness, foods that combined ingredients (such as flavor, sweeteners, spices, and preservatives) for safety and taste, and ready-to-eat foods with minimal or no needed preparation. 31 These PF included foods such as sugar-sweetened beverages, salty snacks (chips, popcorn), cookies, pastries, candies (chocolates, hard candy and gum), ice cream, dairy products (except milk), instant soup, doughnuts, box bread, ready-to-eat cereals, ham, sausages, and canned products. The NMPF included fresh fruits and vegetables, unprocessed chicken, beef or pork, eggs, milk, maize tortillas, beans, rice, and water, among others.
Food Store Access
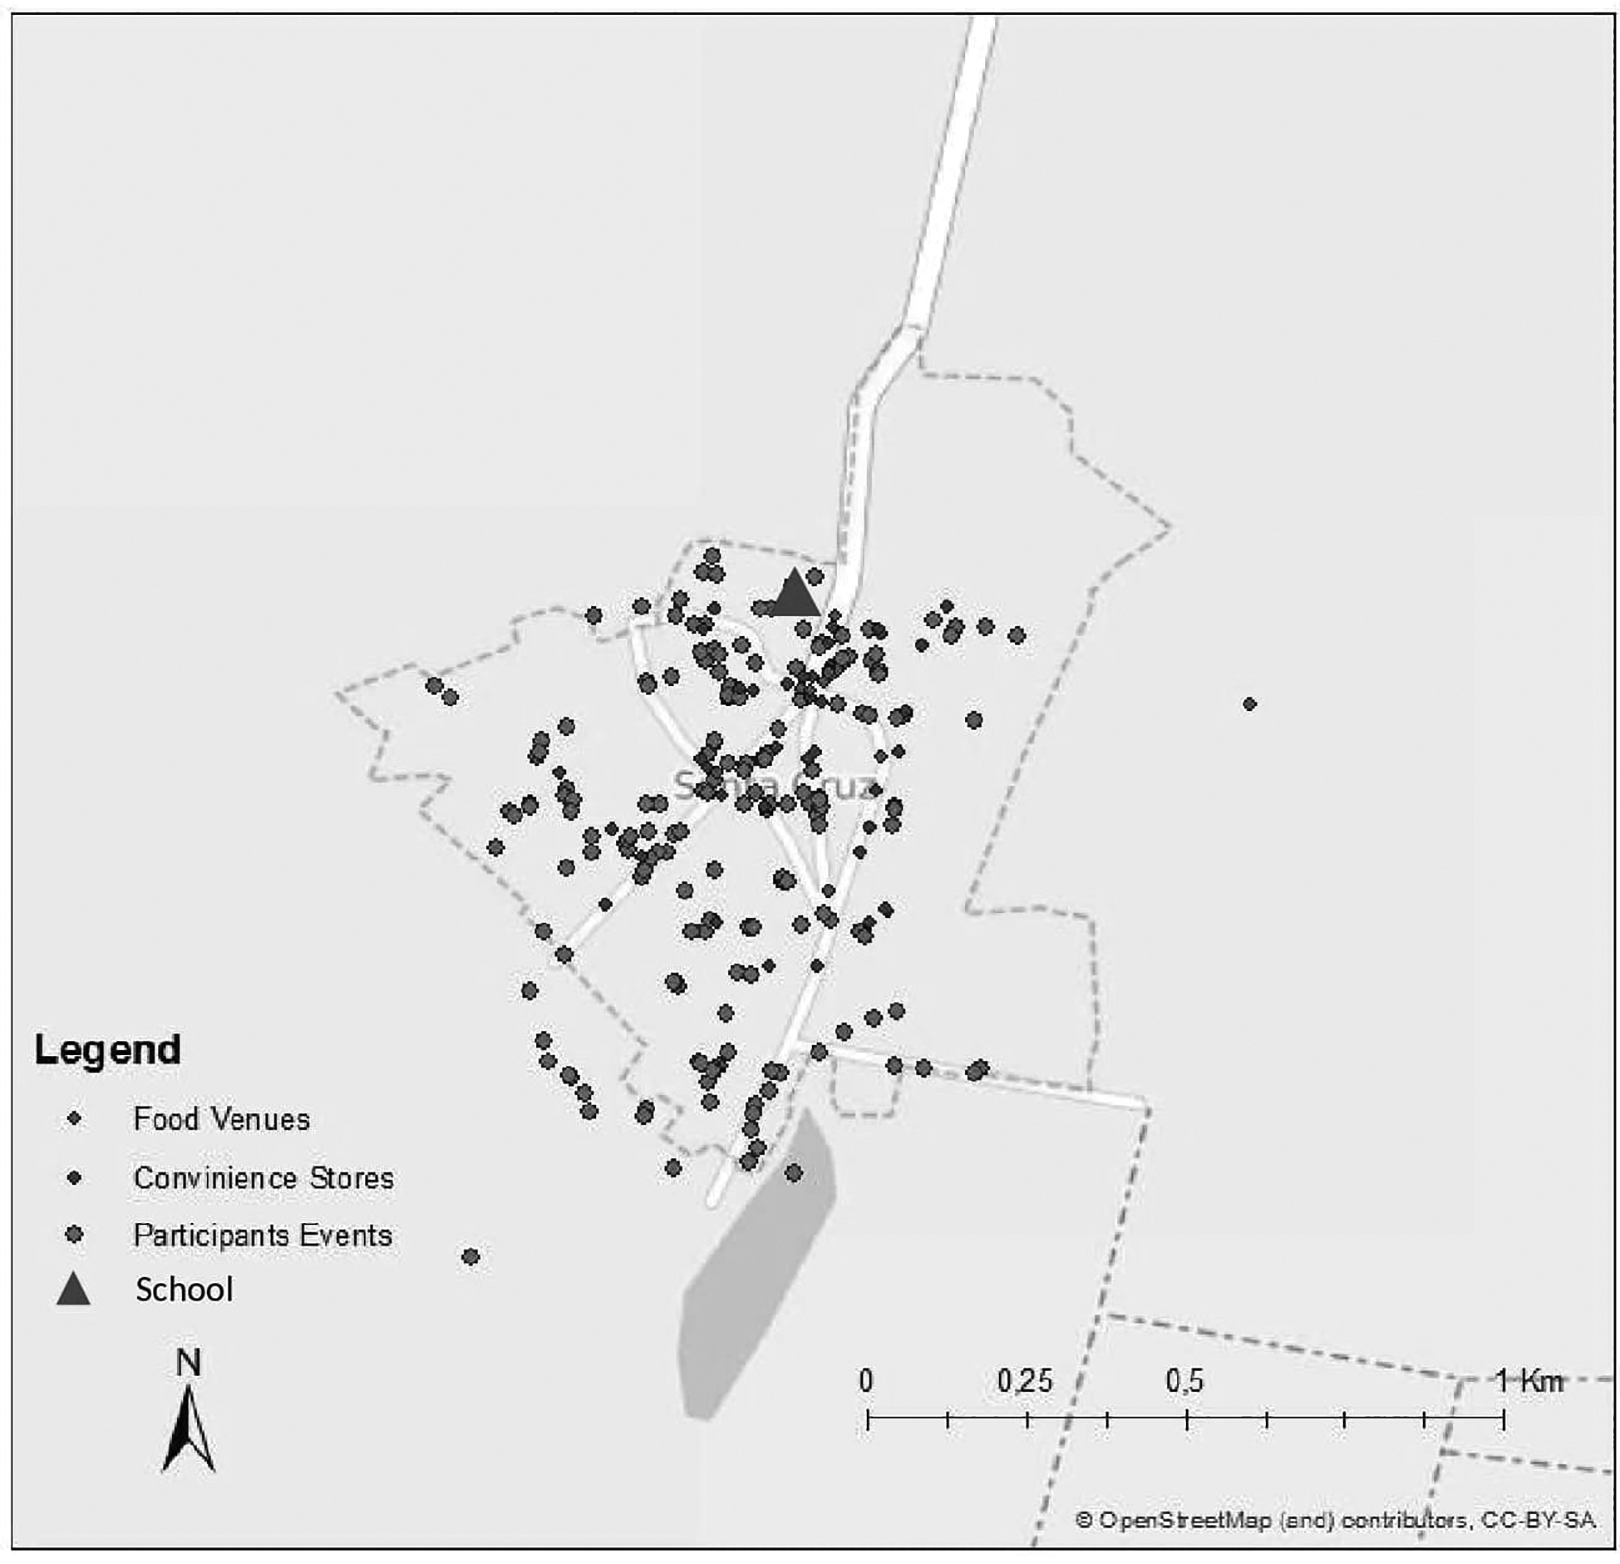
A GIS database was constructed geocoding all the CS and the participants’ households using ArcMap 10 (Figure 1). To determine the best density (number of stores/area) proxy for the FE, 4 circular buffers of 150, 200, 250, and 300 m radius were defined around each household. The WGS1984 coordinate system with a fuller projection was used to geocode addresses and calculate distances and buffers. The number of stores and the shelf-length of each type of food (PF and NMPF) within each buffer were quantified. The length of the buffers was determined based on key GIS data collection information and the characteristics of the community, such as the extension, population, and the number of stores. 32 The proximity was assess using the Euclidean distance (straight-line distance), to evaluate distance between each participant’s household and the nearest CS.
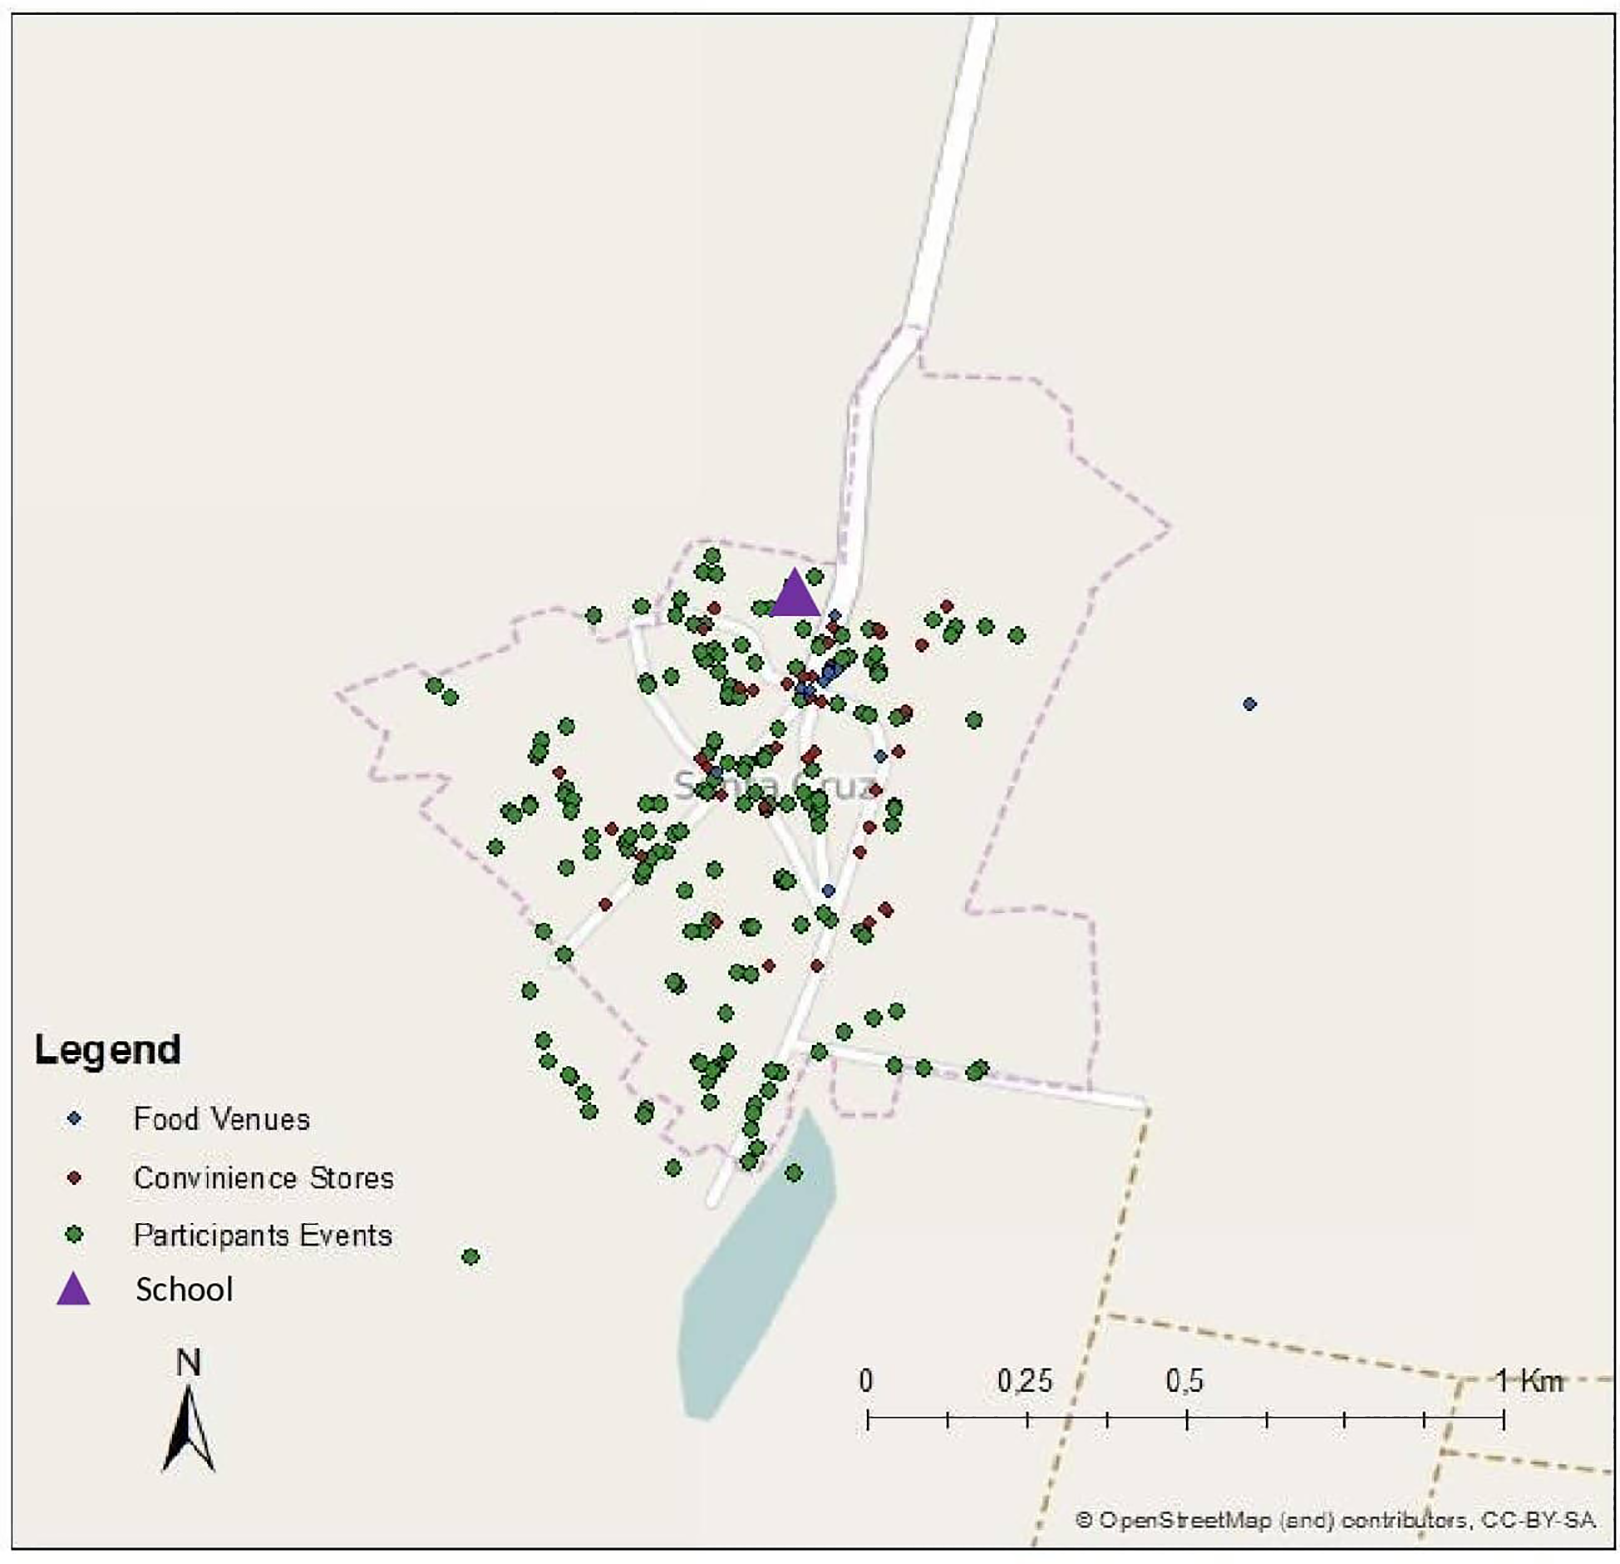
Geolocation of the children’s households, convenience stores, and school.
Statistical Analysis
A descriptive analysis of the demographic variables was performed. As a first step, we assessed which density measure best correlated with obesity. For this purpose, a set of linear regression models between the different measurements of obesity (ie, BMIz, abdominal and total body fat percent) with the number of stores in 150, 200, 250, and 300 m buffers were performed. The 250-m buffer was selected to calculate the density of CS because it had the highest coefficient with body fat (b = 0.16), abdominal fat (b = 0.22), and BMI (b = 0.03).
Normality of the independent variables was confirmed by visual inspection and the Shapiro-Wilk test. Linearity of the association was confirmed visually inspecting the data with a LOWESS graph and by plotting the regression residuals. Also, data analysis of all variables was checked for outliers.
We evaluated the relationship between in-store food availability (ie, total shelf-length of PF and NPF) and the different measurements of obesity. We performed a linear model assessing the association between obesity and FE (ie, density and proximity of CS), while controlling for the different components of FE and possible confounders (ie, sex, age, caregiver’s educational level, physical activity, and proximity to school). All statistical analyses were performed by SPSS version 23.0.
To evaluate if “other food venues” have an influence on the measurements of obesity, we carried out sensitivity analysis. We calculated the density and proximity, this time including “other food venues” together with the CS in the linear models (ie, any food venue or CS in a 250-m buffer or the shortest distance to any “other food venues” or CS).
Results
The general characteristics of the children who participated in the study are provided in Table 1 and the flowchart diagram is in Figure 2. Of the total population, 55% of the studied children were girls, and 52% of the children had an elevated percentage of body fat. The main mode of transportation inside the community in all participants was walking. More than 90% of the households had low socioeconomic status (SES), more than 29% of the caregivers did not complete elementary school, and 91% of the households had access to at least 1 CS within 250 m from their households.
Main Characteristics of the Study Participants and According to Body Fat Percentage (Normal/High).
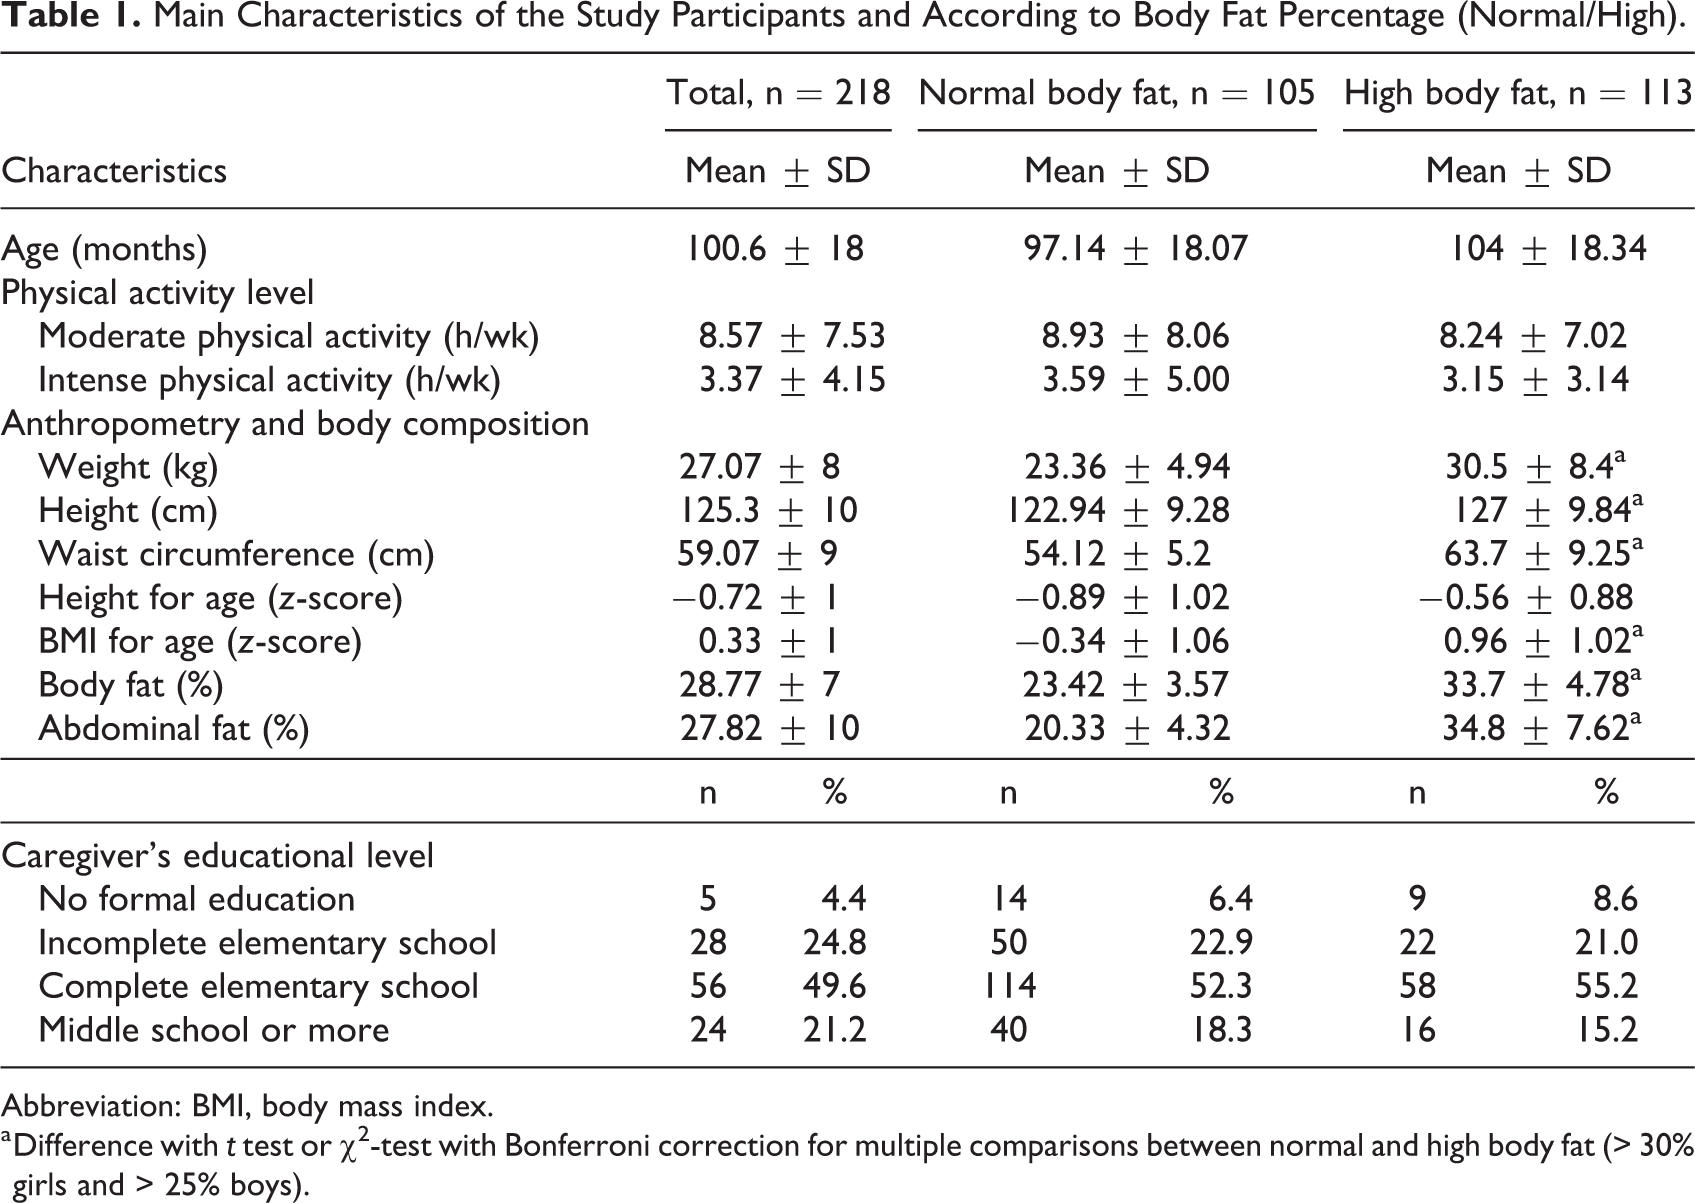
Abbreviation: BMI, body mass index.
a Difference with t test or χ2-test with Bonferroni correction for multiple comparisons between normal and high body fat (> 30% girls and > 25% boys).
CONSORT flowchart.
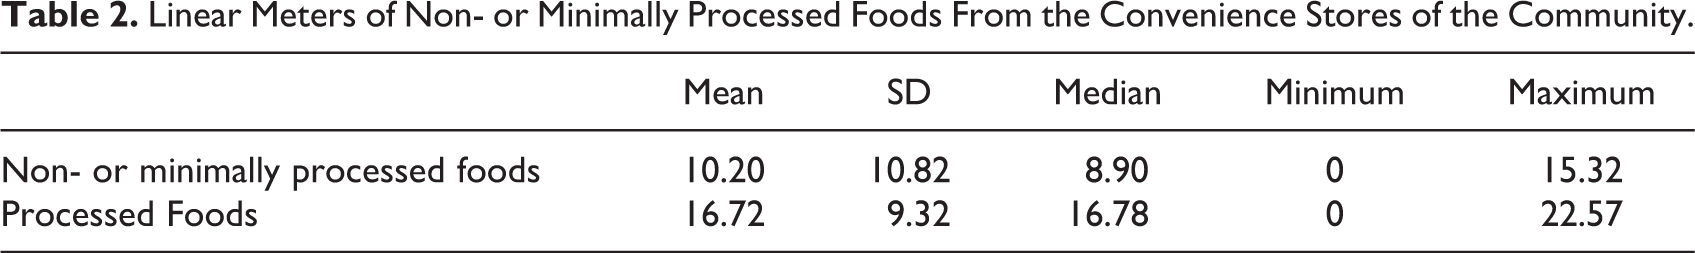
A total of 58 food venues were found in the whole community: 40 CS and 18 other food venues such as 2 “tortillerías” (stores that only sell tortillas), 1 pastry shop, 2 butcheries and 1 poultry shop, 1 fast food restaurant, and 11 street vendors that sold different kinds of food such as “tamales,” corncob, peanuts, and salty deep-fried “churros.” Sixty-two percent (±16 SD) of the shelf-space in the CS contains PF, which represents an average of 16.73 m (±9.3 SD) of the shelf-space (Table 2).
Linear Meters of Non- or Minimally Processed Foods From the Convenience Stores of the Community.
As summarized in Table 3, children with high body fat percent had access to more CS compared to children with normal body fat percent. No differences were observed in proximity to CS in children depending on their body fat percent.
Density and Proximity to Convenience Stores of the Study Participants According to Body Fat Percentage (Normal/High).
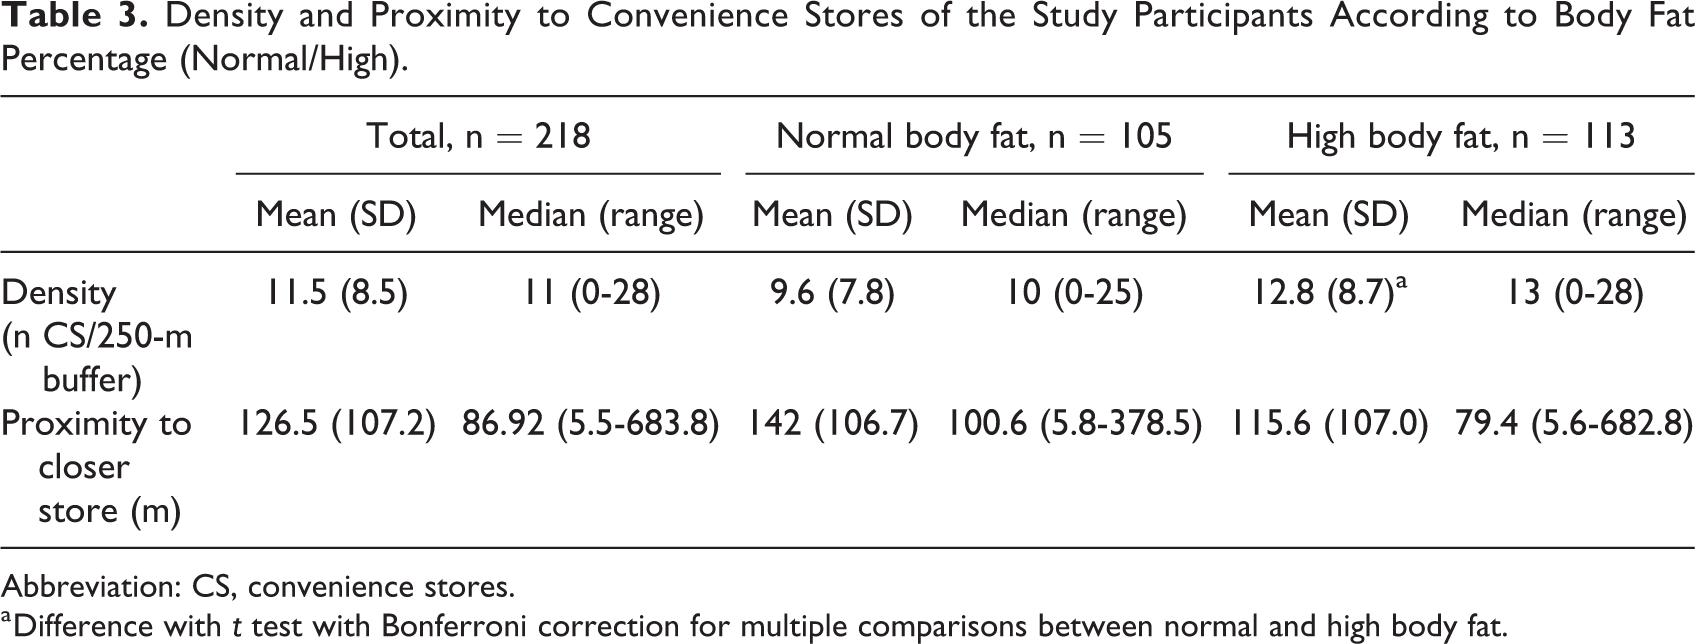
Abbreviation: CS, convenience stores.
a Difference with t test with Bonferroni correction for multiple comparisons between normal and high body fat.
As observed in Table 4, when adjusting for confounding (sex, age, caregiver’s educational level, physical activity, and proximity to school), the density of CS was positively associated with all the measurements of obesity (body fat %, abdominal fat %, and BMIz). The proximity to CS was negatively associated with all the measurements of obesity. A increase in 100 m in the proximity to the nearest CS was associated with lower body fat −0.9% (95% CI, −1.7% to −0.1%), abdominal fat −1.12% (95% CI, −2.3% to −0.1%), and BMIz −0.2 (95% CI, −0.4% to −0.1%). Also, the shelf-meters of both PF and NMPF were positively associated with higher BMIz. However, no differences were observed between groups when analyzing the PF/NMPF ratio.
Association Between Food Environment and Measurements of Obesity.
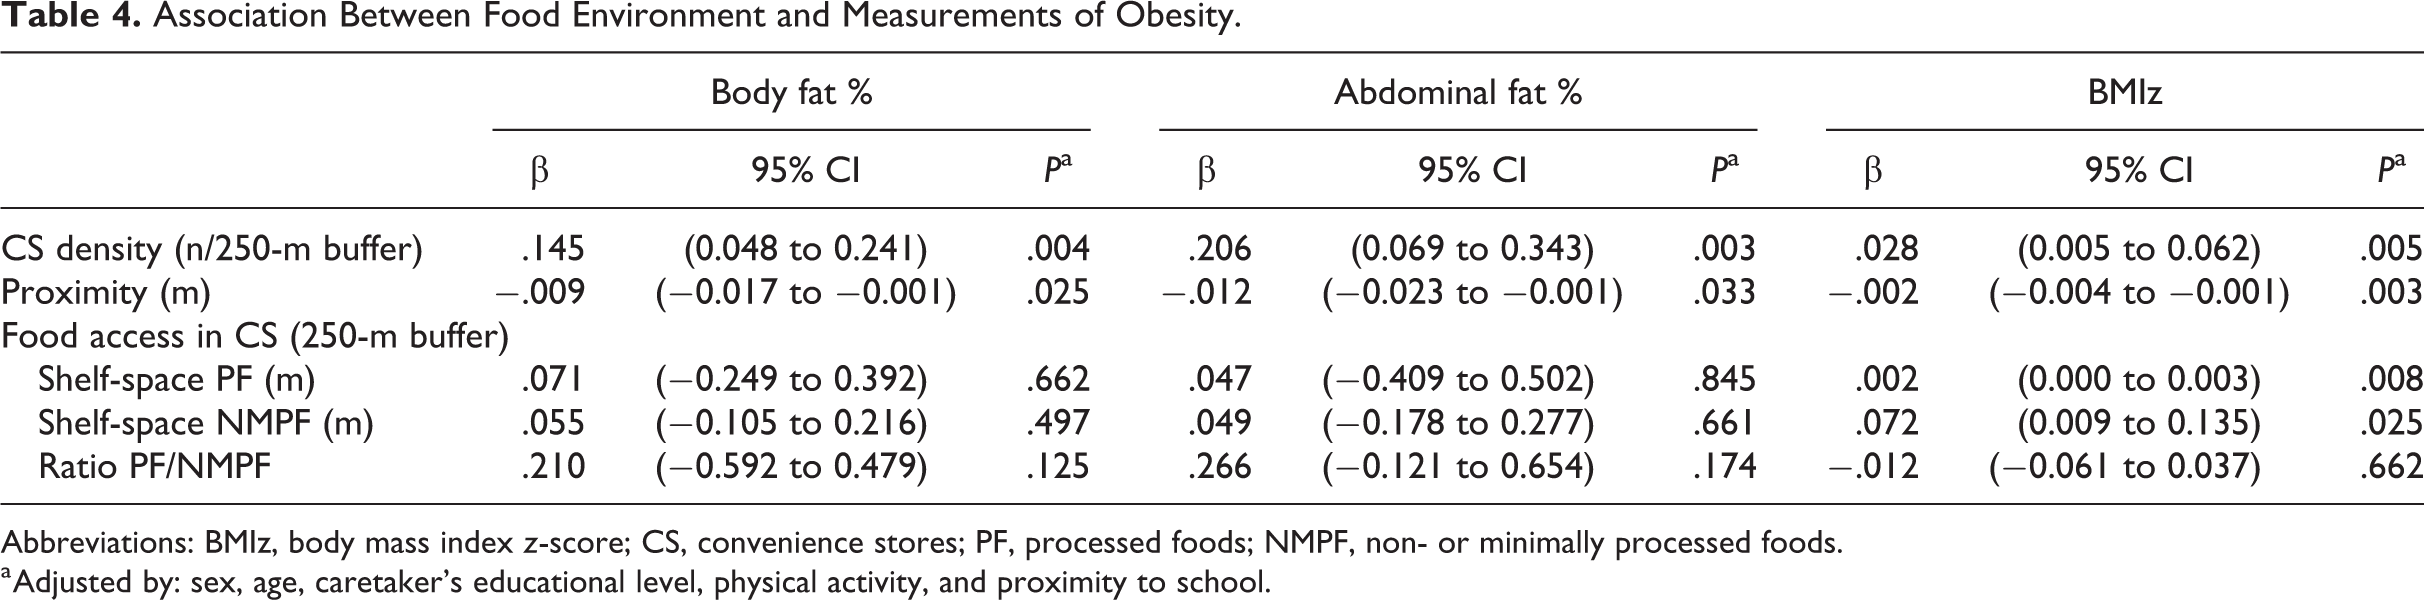
Abbreviations: BMIz, body mass index z-score; CS, convenience stores; PF, processed foods; NMPF, non- or minimally processed foods.
a Adjusted by: sex, age, caretaker’s educational level, physical activity, and proximity to school.
The sensitivity analysis showed no variations in the coefficient or the direction of the associations between density and proximity with the measurements of obesity after including “other food venues.”
Discussion
In the present study, the FE of a rural community of Mexico was evaluated. To the best of our knowledge, the results show for the first time the relationship between obesity and measures of FE in a rural setting in Mexico, where no supermarkets are available, and where its habitants are compelled to buy their food in small CS. In this community, a high density and low proximity to CS was associated with obesity in children, and they were exposed on average to 11.5 CS within 250 m from their household.
The FE of this community differs importantly from other studies in different countries. The main reason of these differences is that most of the studies that have evaluated FE and its relationship with obesity have been done in high-income countries, in both urban and rural communities. There is limited research of this type in rural communities from lower-medium income countries, such as Mexico. This has to be taken into consideration when comparing the results from a rural community in Mexico to those from other settings in high-income countries with different contexts. For instance, in a community in Texas, near the border between Mexico and the United states, 3 CS could be found within a 1600-m buffer of the participants’ households. 7 In Denmark, in metropolitan areas, only 54% of the population had 1 or more CS within a 250-m buffer and in non-metropolitan areas only 22% of the population had 1 or more CS within a 250-m buffer. 33 In the city of New Orleans in the United States, 38% of the studied households had 1 store within 1600-m buffer and 62% had the nearest store farther than 1600-m buffer. 34 In contrast, in the present study, 91% of the children living in the studied community had access to at least 1 CS in a 250-m buffer. Thus, when comparing with other populations and areas in developed countries, the children of this rural community had access to a higher number of CS in their environment.
Higher density and proximity of food stores was associated with a higher BMI, and with higher body and abdominal fat in 8- to 10-year-old children living in a rural setting. Most of the studies that have evaluated the association of FE and obesity have been done in adults and in urban areas, and only a few studies have been done in rural settings and in children. 7,18,35 -38 Results of studies in adults in both urban and rural areas are similar to the results of the present study. For instance, in urban settings in the United States, proximity and frequent use of CS are associated with higher BMI in adults and households. 36,39,40 Food swamps with a higher density of establishments selling high calorie food and lower density of establishments selling healthier food are predictors of adult obesity, particularly in counties with income inequality and low mobility. 41
Similarly, studies in rural communities have found that limited access to healthy foods is one of the main contributors to a poor diet and obesity. 42 Studies that have evaluated the role that the FE has on childhood obesity have produced inconsistent result. 43,44 In Canada, 58% of children had access to one CS within 800 m walking, and proximity and density was not associated with obesity, 45 while children living near a CS in Guam were most likely to have higher BMIz compared to those who lived farther away. 46 Similarly, the presence of 1 or more CS around participants households (a block around or in a 1600-m buffer) in different cities in the United States was positively associated with obesity in both children and adolescents. 6,7 In addition, the presence of CS near schools has also been associated with obesity in different countries. 18,37,47 In Mexico, for instance, the number of mobile food venues around both public and private schools was positively associated with obesity. 18 Thus, the evidence suggests that the density of CS near children’s households and schools is strongly associated with higher BMI.
The association between the density of food venues and obesity in the population studied may be explained by different social and psychological factors. It is more likely that children living close to a higher density of stores can find a store in their way to their destination (ie, school, family member house, while playing in the street) and, therefore, have increased access to CS and food products compared with children living far away from CS. 48,49 Also, children sharing a higher density of stores are exposed to visual cues more often, both outside and inside the stores, where advertisement as promotions, free toys, and colorful labels of their food products may be found. 50,51
In the present study, shelf-space dedicated to PF, which tends to be more energy dense, was higher than NMPF, and the shelf-space of both was associated with obesity in children. However, no association was observed of PF/NMPF with any measure of obesity. These results suggest that the density and proximity of CS are better predictors of obesity than the proportion of PF/NMPF. To our knowledge, no studies have evaluated the relationship between shelf-space of specific foods and obesity in Mexico, but there is evidence in developed countries. Studies in both Australia and the United States have shown that shelf-space dedicated to energy-dense food and less healthy foods is greater in neighborhoods with low SES. 38,52 Rural stores in Australia had lower shelf-space of fruits and vegetables and higher shelf-space of soft drinks compared to urban stores, and rural areas in this country have high prevalence of overweight and obesity. 53
Some limitations of the study need to be addressed. The cross-sectional design of the study does not allow to draw conclusions about causality. Even though associations between FE and obesity were observed, these associations were small. Since obesity is a multifactorial disease, other factors, such as genetics, may be more important. In addition, there may be behaviors that were not measured in the study, such as the routes the children take to visit family members that may influence their exposure to the FE of the community. Another limitation is the small sample size of the participants. Also, no information of how often children actually shop in the CS is available, or what type of food they actually purchase. Despite adjusting for proximity to the school, children shared similar FEs near their houses and their school, and thus, the assumption of independence of residuals might be violated. Physical activity was measured using self-reported data and this may be subject to recall bias.
The main strength of the study was the assessment of all the CS available to the community, providing better estimates for the associations found. Another strength of the study was using DXA to measure body composition as an indicator of obesity. Also, the present study is one of the few addressing the relationship between “tienditas” and childhood obesity in rural communities, where supermarkets are not available.
Future studies in rural communities should include information regarding how often the children buy food in the CS, what type of food they purchase, and how children move within the community, around their households, and their school.
Conclusion
Georeferenced locations provide a useful approach to assess the relationship between FE and obesity by modeling spatial accessibility (density, proximity to CS, and exposure to PF). The results show that FE near participants’ households is associated with obesity in 8- to 10-year-old children living in a rural community in Mexico. In a country where prevalence of childhood obesity is one of the highest in the world, understanding the FE will contribute to shape the environment to promote and support healthy eating and thus prevent childhood obesity.
Supplemental Material
Supplemental Material, sj-pdf-1-fnb-10.1177_03795721211033146 - Proximity and High Density of Convenience Stores Was Associated With Obesity in Children of a Rural Community of Mexico: Using a Geographic Information System Approach
Supplemental Material, sj-pdf-1-fnb-10.1177_03795721211033146 for Proximity and High Density of Convenience Stores Was Associated With Obesity in Children of a Rural Community of Mexico: Using a Geographic Information System Approach by Gerardo Antonio Zavala, Yessica Tenorio-Palos, Maiza Campos-Ponce, Juana Elizabeth Elton-Puente, Carlos Alberto López-González, Colleen M. Doak, Jorge L. Rosado and Olga P. García in Food and Nutrition Bulletin
Footnotes
Authors’ Note
OPG, MCP, and GAZ conceived and designed the study. YTP and GAZ carried out the field work; YTP, JLR, JEEP, CALG, CMD, and GAZ analyzed and interpreted data; and OPG, CALG and JLR gave important intellectual advice. OPGO, GAZ, and YTP drafted the manuscript. All authors were involved in revising the article and had final approval of the submitted and published versions.
Zavala Gerardo Antonio, and Tenorio-Palos Yessica contributed equally in the manuscript.
Acknowledgments
The authors thank the children and their parents who gave their consent and support to the study, Dolores Ronquillo, Lorena Oropeza, Paulina Estrella, and Gabriela Curiel who participated in the fieldwork and data management.
Declaration of Conflicting Interests
The author(s) declared no potential conflicts of interest with respect to the research, authorship, and/or publication of this article.
Funding
The authors disclosed receipt of the following financial support for the research, authorship, and/or publication of this article: The project was partially supported by the research network Obesity Treatment and Prevention, financed by CONACYT, Mexico.
Supplemental Material
Supplemental material for this article is available online.
References
Supplementary Material
Please find the following supplemental material available below.
For Open Access articles published under a Creative Commons License, all supplemental material carries the same license as the article it is associated with.
For non-Open Access articles published, all supplemental material carries a non-exclusive license, and permission requests for re-use of supplemental material or any part of supplemental material shall be sent directly to the copyright owner as specified in the copyright notice associated with the article.