
Abstract
Background:
In middle-income countries, malnutrition concentrates in marginalized populations with a lack of effective preventive strategies.
Objective:
Identify risk factors for undernutrition in a peri-urban Ecuadorian community of children aged 12 to 59 months.
Methods:
Data from a cross-sectional survey in 2011 of children 1 to 5 years were analyzed including demographic data, medical history and examination, food frequency questionnaire (FFQ), anthropometric measurements, and blood for complete blood count, C-reactive protein, vitamin A, iron, and zinc levels. Dietary Diversity Score (DDS) was calculated from FFQ. Bivariate and multivariate analysis assessed effects on primary outcome of undernutrition by DDS, vitamin deficiencies, and demographic and nutritional data.
Results:
N = 67, 52.2% undernourished: 49.3% stunted, 25.4% underweight, and 3% wasted; 74.6% (n = 50) were anemic and 95.1% (n = 39) had low serum zinc. Dietary Diversity Score was universally low (mean 4.91 ± 1.36, max 12). Undernutrition was associated with lower vitamin A levels (20 306, IQR: 16605.25-23973.75 vs 23665, IQR: 19292-26474 ng/mL, P = .04); underweight was associated with less parental report of illness (43.8%, n = 7 vs 80% n = 40, P = .005) and higher white blood count (13.7, IQR: 11.95-15.8 vs 10.9, IQR: 7.8-14.23 × 10⁹/L, P = .02). In multiple regression, risk of undernutrition decreased by 4% for every $10 monthly income increase (95 CI%: 0.5%-7.4%, P = .02, n = 23); risk of underweight decreased by 0.06 for every increased DDS point (adjusted odds ratio: 0.06; 95 CI%: 0.004-0.91, P = .04, n = 23).
Conclusions:
In this peri-urban limited-resource, mostly Indigenous Ecuadorian community, stunting exceeds national prevalence, lower monthly income is the strongest predictor of undernutrition, lower DDS can predict some forms of undernutrition, and vitamin deficiencies are associated with but not predictive of undernutrition.
Introduction
Undernutrition, defined as low weight for length or height (WLZ or WHZ, wasting), low weight for age (WAZ, underweight), low height or length for age (stunting), or micronutrient deficiencies, contributes to near 45% of younger than 5-year child mortality in lower middle-income countries (LMICs). 1 In Ecuador as of 2014, 2 younger than 5-year children experience undernutrition at rates mostly unchanged since 2004 with wasting (1.6%), overweight (8%), and stunting (23.9%). Ecuador’s national prevalence of stunting exceeds global averages of 21.9% and ranges widely from 36.5% for the lowest economic to 13.8% for the highest economic quintile. 3,4
Micronutrient deficiencies impact health and development. Anemia, a global proxy of iron deficiency, disproportionately affects children younger than 5 and is associated with reduced neurocognitive development, stunting, and lower psychosocial function. 1,5 -8 Zinc and vitamin A deficiency increase childhood morbidity and mortality due to their role in immunity and recovery from diarrheal illness, vitamin A deficiency worsens complications from measles and is a leading cause of blindness, 9,10 and zinc deficiency is an independent risk factor for stunting. 1,11 In Ecuador, the WHO in 2011 estimated childhood anemia at 40% (95 CI%: 18-67). 8 Ecuador is reported as a UNICEF nonpriority country for vitamin A supplementation programs, 9 despite its high observed prevalence in marginalized populations (J. Ceballos-Osorio, personal communication, December 4, 2018). Systemic and intestinal inflammation are also increasingly linked to morbidity and mortality in childhood undernutrition. 12 -14
Dietary diversity may be used as a proxy for diet quality. 15 Resources to complete dietary assessments are often cumbersome and may not be feasible when working in underresourced communities. Dietary Diversity Score (DDS) is a widely used estimate of food access. It generates a score from 0 to 12 (higher numbers represent more diversity). A more diversified diet correlates with high-quality protein, increased expenditure on food, and improved hemoglobin and childhood nutritional status. 16 Dietary Diversity Score requires less time and resources than dietary assessments and is based on the number of consumed food groups. Dietary Diversity Scores can be generated from individual dietary assessments using standardized measures. 17 Additionally higher scores among youth are associated with a high diet quality, meaning that the diet provides sufficient macronutrients and essential nutrients for an active life and growth, while diets with less diversity may lead to nutrient deficiencies. 17 A limitation of DDS is that it does not capture alone the influence of fortification or micronutrient supplementation.
Santo Domingo de los Tsáchilas, Ecuador represents a vulnerable mostly indigenous population in the lowest economic quintile with limited access to health care, consistent familial income, or improved sanitation and water. The University of Kentucky Hombro a Hombro (Shoulder to Shoulder, StS) program supports a permanent clinic in 3 peri-urban communities of Santo Domingo with quarterly specialty health care visits. Among observed food insecurity, poverty, and high rates of preventable illnesses, the prevalence of and risk factors for childhood undernutrition in this population remain undefined. Thus, this analysis aimed to assess nutritional, demographic, and biochemical risk factors of undernutrition, underweight, stunting, and wasting in children younger than 5 years within the StS catchment area.
Methods
We analyzed a cross-sectional survey from May to August 2011 of children presenting to the StS clinic. All children aged 1 to 5 years were included without exclusion. Caregivers provided informed consent and answers to a structured questionnaire including food frequency questionnaire (FFQ) and demographic information in Spanish. The FFQ assessed dietary history of the child from the previous week. A trained nurse took medical and demographic history, anthropometric measurements, and performed venipuncture. A medical doctor performed medical examination and diagnoses.
Anthropometrics included protocolized measurements of length (1 to <2 years of age, cm) or horizontally measured height (2-5 years of age, cm), weight (kg), and head circumference (cm). Birth weight (g) was recorded. Nutritional diagnoses were based on WHO Z scores for WLZ or WHZ, WAZ, and length or height for age (LAZ or HAZ). Undernutrition was defined as wasting, stunting, and/or underweight with wasting: WLZ/WHZ <−2, stunting: LAZ/HAZ <−2, and underweight: WAZ <−2. Nutritional edema (diagnostic of severe wasting) did not occur.
White blood count (WBC), hemoglobin, platelets, serum iron, and C-reactive protein (CRP) were processed in a certified laboratory in Ecuador. Additional blood was frozen on dry ice and shipped to the University of Kentucky Research Laboratory for determination of serum human retinol-binding protein 4 (serum RBP4) as a measure of vitamin A and serum zinc.
The FFQ was adapted from a standardized dietary diversity questionnaire published openly by the Food and Agriculture Organization of the United Nations to include foods common to our population. 18 The questionnaire included 21 questions on food consumption from the previous week including questions with examples for fruits, vegetables, grains, meats and seafood, dairy, starchy vegetables, beans, sweets, and beverages. It was verbally administered in Spanish by a trained team member and based on dietary recall over the prior week. Dietary data from questionnaires were recorded in a database and divided by 7 days to estimate daily intake. These daily intakes were used to calculate the DDS. Intake of a nutritional supplement, Chis Paz, was also recorded. This supplement was administered in Ecuador by the Ministry of Health starting in 2011, around the time that the data for the current study were collected. 19 Chis Paz (chispitas nutricionales), also called Sprinkles in English, is a multivitamin supplement developed originally for the purpose of iron supplementation. Each serving (1 packet) of Chis Paz contains 12.5 mg iron, 5 mg zinc, 160 µg folate, 300 µg vitamin A, and 30 mg vitamin C. 20
Anemia was determined by hemoglobin for age defined at 12 to 23 months as hemoglobin <10.5 g/dL and at 24 to 59 months as hemoglobin <11.5 g/dL. Low serum zinc was <70 μg/dL; low serum vitamin A was <10 000 ng/mL and was not corrected for CRP. C-reactive protein, WBC, and platelets represented inflammation. C-reactive protein was reported by the performing lab as undetectable at <6 mg/L; elevated CRP was ≥6 mg/L.
Illness was evaluated via parental report of any health problems; report of fever and/or diarrhea in the last month; or physician diagnosis of acute gastroenteritis (AGE, 3 or more watery stools in 24 hours), upper respiratory infection (URI, the presence of infectious symptoms of the upper respiratory tract), or congenital disease.
We performed descriptive and bivariate analysis with IBM SPSS Statistics version 25 (IBM Corp, 2017) and multivariate analysis and modeling with SAS software version 9.4 (SAS Institute Inc, 2017). Pearson correlation assessed relationships between continuous variables. Associations between binary variables were assessed via Pearson χ2 and Fisher exact for smaller sample size for parametric and independent samples median test for nonparametric tests. We utilized multiple logistic regression for dichotomous outcomes and multiple linear regression for continuous outcomes using selection methodology of backward elimination selection. We received ethical approval from the institutional review board of the University of Kentucky and the London School of Hygiene and Tropical Medicine.
Results
Main demographics and nutritional diagnoses are summarized in Table 1. Sixty-seven children were included in the analysis with 55.3% (n = 37) female and mean age 3 years (SD 1.13). Monthly household income was universally low with a median of US$250 (IQR: US$120-US$387.5), and a minority of mothers worked (26.7%, n = 18, not presented in Table 1). The majority of families used well water (78.4%, n = 51); sanitization of the well or of drinking water from the well was not recorded. Maternal education was low with median 7 (range: 0-14) years of education. Most children were born in a hospital with access to a birthing professional versus at home (74.6%, n = 50).
Sociodemographic Characteristics of Included Children.a
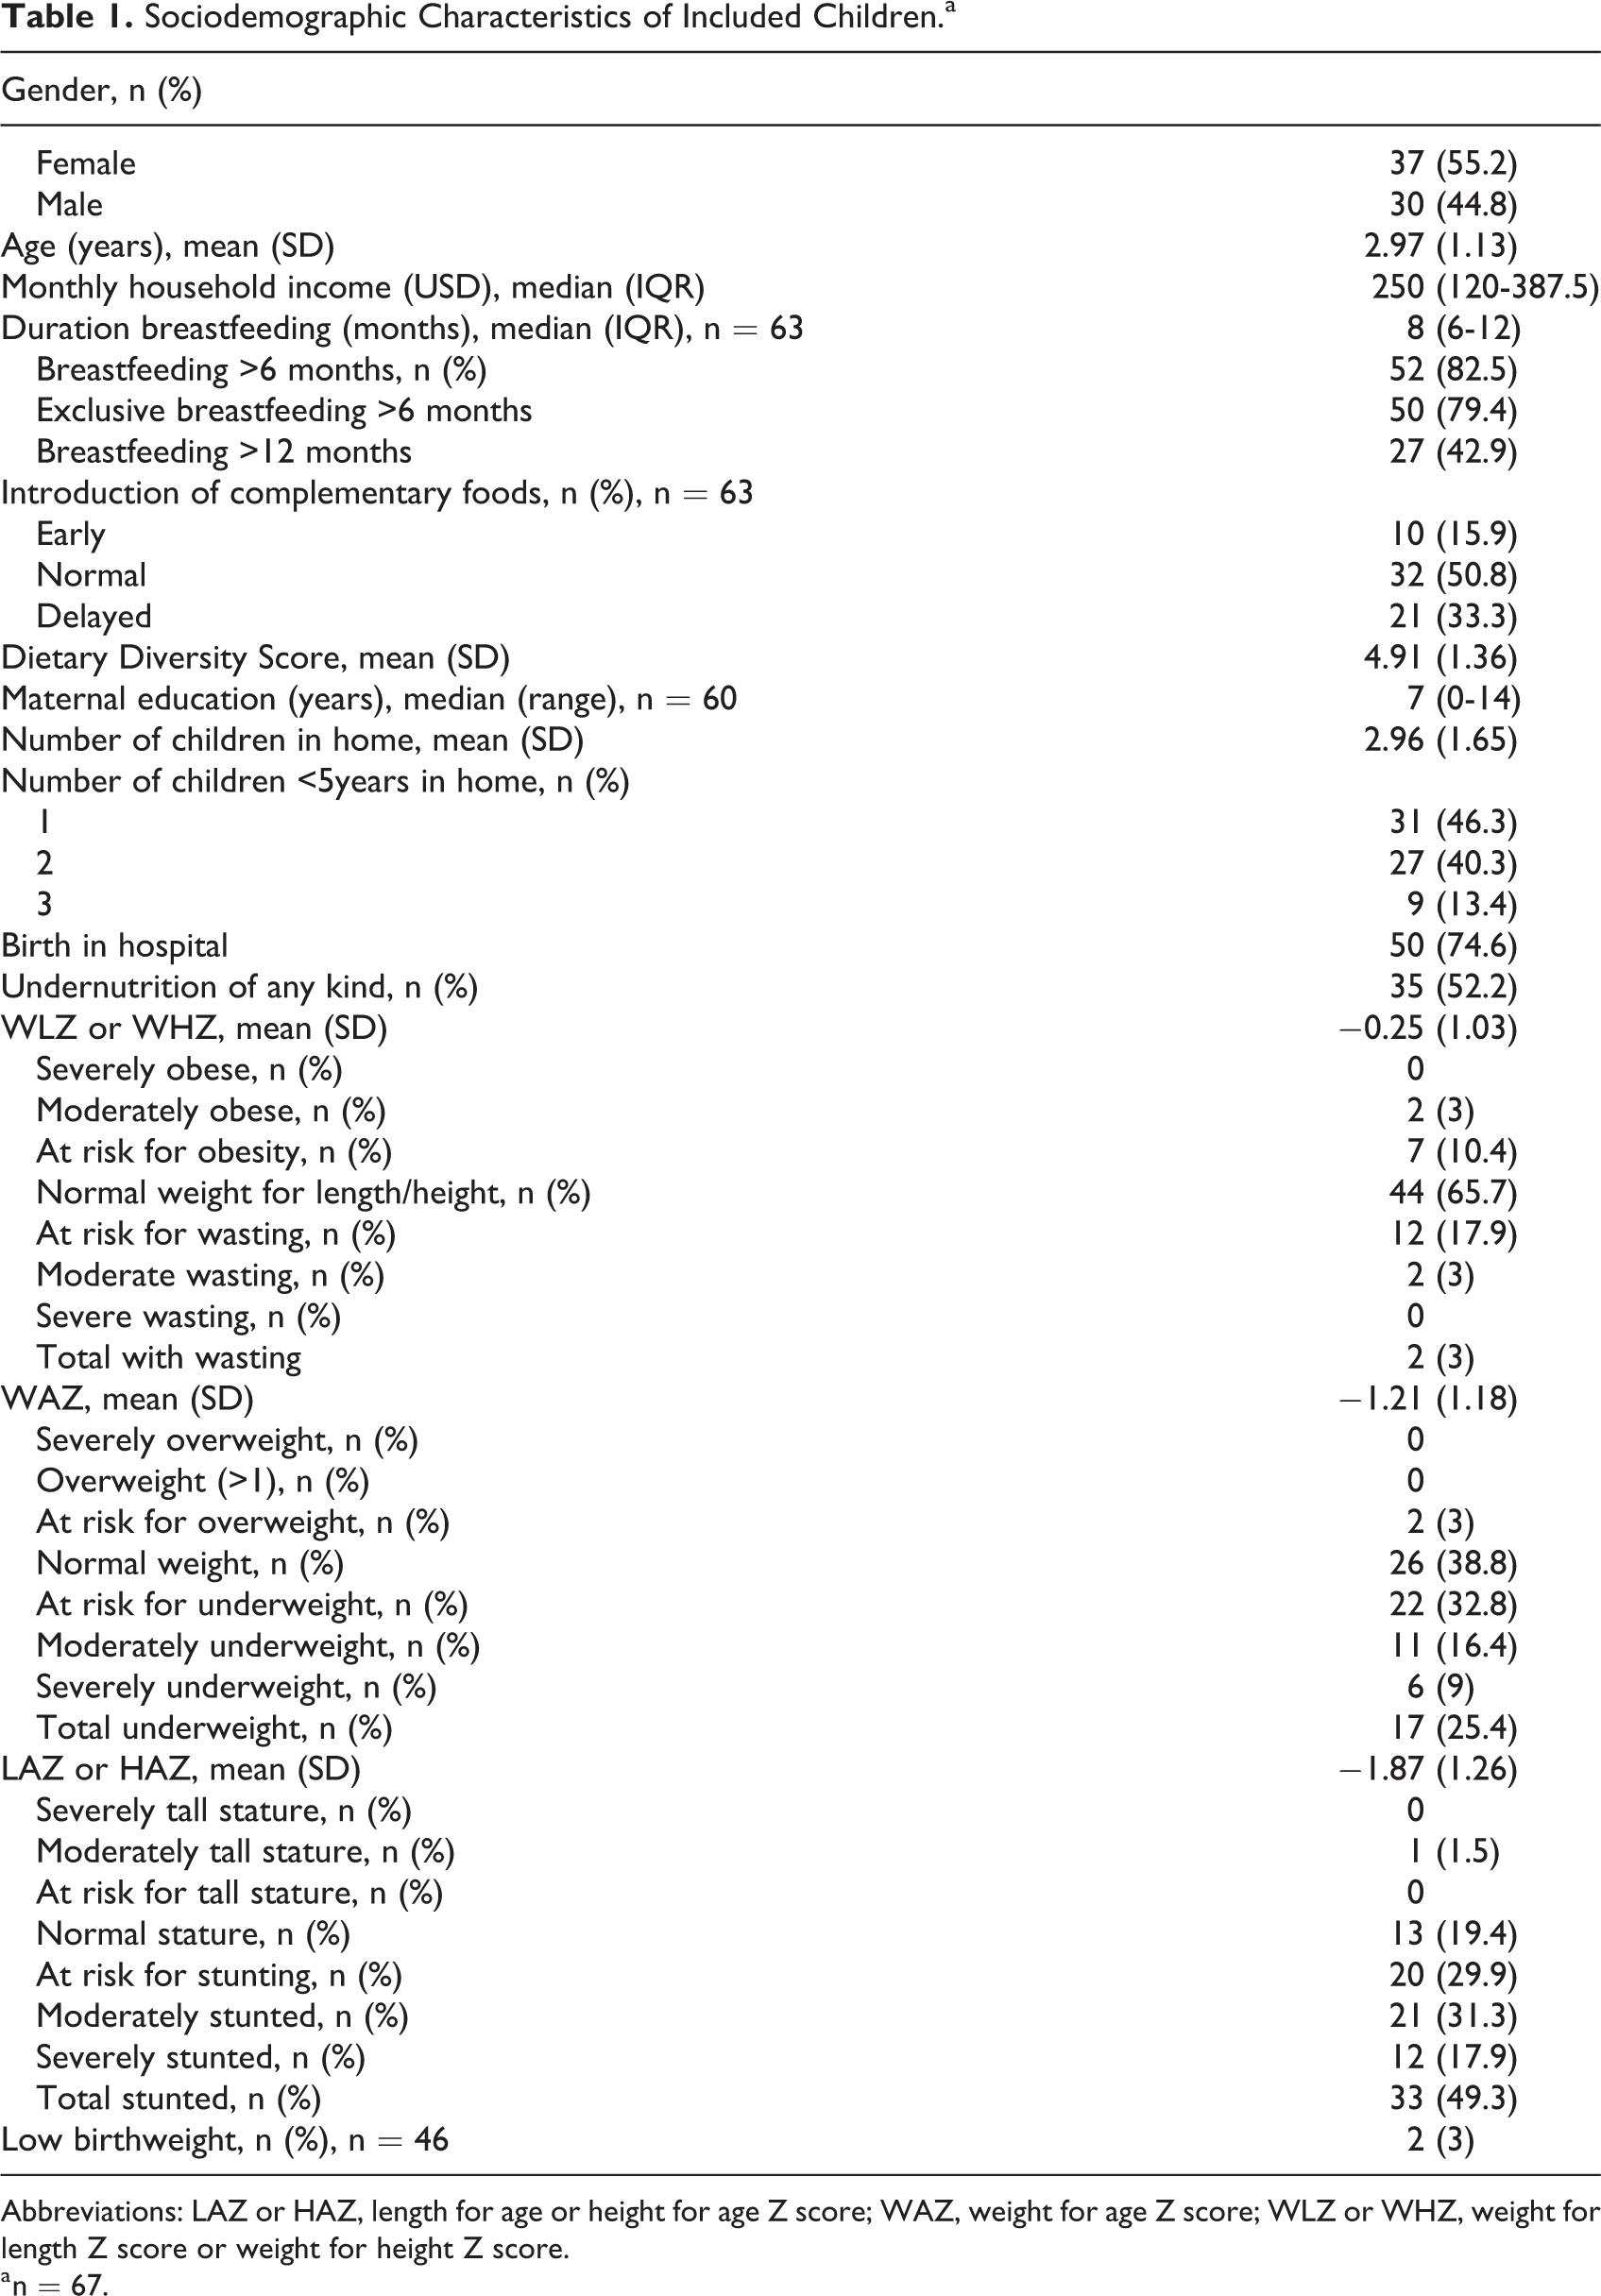
Abbreviations: LAZ or HAZ, length for age or height for age Z score; WAZ, weight for age Z score; WLZ or WHZ, weight for length Z score or weight for height Z score.
a n = 67.
The number of children in the home averaged 3 (SD: 1.65). Many children had other siblings younger than 5 years with 40.3% (n = 27) with one other sibling younger than 5 years and 13.4% (n = 9) with 2 other siblings younger than 5. Three children (4.5%) had siblings older than 18 years in the home (not reported in Table 1); it is not known if adult siblings contributed to family income.
Most children (79.4%, n = 50) received 6 months exclusive breastfeeding, and almost half of infants received breast milk for older than 12 months (42.9%, n = 27). The duration of breastfeeding usually surpassed 6 months with median 8 months (IQR: 6-12 months). Few children received early introduction of complementary foods; the majority of children received normal (ie, at 6 months, 50.8%, n = 32) or delayed (ie, after 6 months of age, 33.3%, n = 21) introduction of complementary foods; only 10.4% (n = 7) of infants were premature.
Birthweight was available for 46 (68.7%) children with a median of 3300 g (IQR: 2872.5-3558.75 g). Only 2 (3%) children were small for gestational age (<2500 g). Head circumference averaged 45.6 cm (SD: 1.53) for the 17 children aged 1 to 2 years for whom this was measured (data not presented in Table 1).
Just over half of children in this study were undernourished (52.2%, n = 35). Almost half of children (49.3%, n = 33) were stunted (LAZ or HAZ less than −2), while a quarter (25.4%, n = 17) were underweight (WAZ less than −2). Due to this, only a minority of children (3%, n = 2) were wasted (WLZ or WHZ less than −2), as low weight was appropriate for low height in the majority. Almost one-fifth (17.9%, n = 12) were at risk for wasting and over a third (32.8%, n = 22) were at risk for underweight and at risk for stunting (29.9%, n = 20). Obesity (3%, n = 2), overweight (n = 0), and tall stature (1.5%, n = 1) were rare in this population of 1- to 5-year-old children. Dietary Diversity Score was calculated for all children with a mean of 4.91 (SD 1.36) of a goal of 12 points.
All (n = 67) children received complete blood counts; 41 samples were processed for serum CRP, serum retinol-binding protein 4 (RBP4 as a measure of vitamin A), serum zinc, and serum iron. Laboratory findings and medical outcomes are summarized in Table 2. The majority of children were anemic for age (74.6%, n = 50) with mean hemoglobin 10.66 g/dL (SD: 1.16). Serum iron was on average at the lower range of normal with a median of 60.5 μg/dL (IQR: 40.25-85.75; normal range: 60-170 μg/dL). Low serum zinc occurred in 95.1% (n = 39) of children with median 35.1 (IQR: 30.9-52.7) μg/dL. Vitamin A was normal (>10 000 ng/mL) in all with a median of 21 882 (IQR: 17 731-25 864) ng/mL.
Medical and Laboratory Outcomes.a
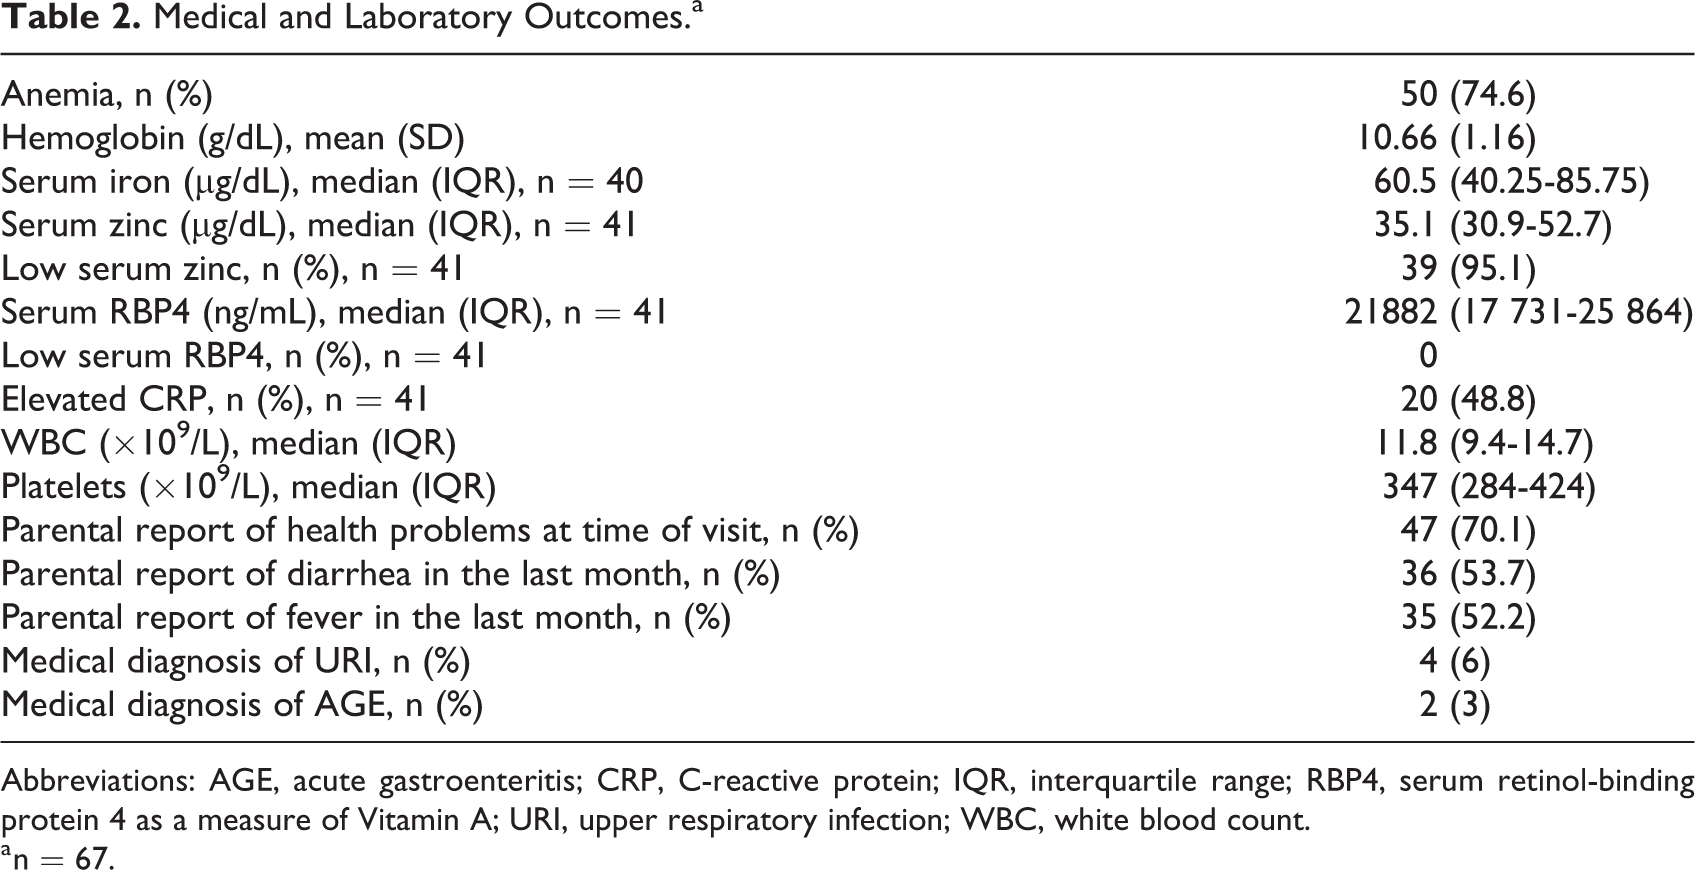
Abbreviations: AGE, acute gastroenteritis; CRP, C-reactive protein; IQR, interquartile range; RBP4, serum retinol-binding protein 4 as a measure of Vitamin A; URI, upper respiratory infection; WBC, white blood count.
a n = 67.
Fifteen children received Chis Paz micronutrient supplementation. Of these 15 children, 10 had available data for micronutrient levels. These 10 used a full serving of Chis Paz 5 to 7 days a week from 1 month to 1 year in duration. There were no significant differences in vitamin A levels, zinc levels, serum iron levels, or prevalence of anemia between groups; although, there were trends to higher serum iron and serum vitamin A levels in those receiving Chis Paz, while serum zinc trended lower in these groups (data not shown).
Markers of inflammation showed elevated CRP in 48.8% (n = 20). White blood count was mostly within the range of normal with a median of 11.8 (IQR: 9.4-14.7) ×109/L and was never low. Platelets also remained in the range of normal with median 347 (IQR: 284-424) ×109/L.
The majority of children experienced illness by parental report at the time of their medical visit and enrollment (70.1%, n = 47). Problems reported included poor appetite, diarrhea, cough, colds, trouble breathing, fever, headache, malnutrition, problems with vision, stomach pain, asthma, concern for urinary tract infection, bony pain, and concern for dengue fever (data not shown). Just over half of children (53.7%, n = 36) were reported by parents to have diarrhea in the last month and just over half of children (52.2%, n = 35) were reported to have subjective fever in the month prior to their visit with the majority of those having both (n = 24, 35.8% of all children). That is, of those with reported fever, 11 (31.4%) did not have any reported diarrhea. Two children had congenital disease (3%) with cerebral palsy and possible Pierre Robin syndrome. Medical diagnosis of URI (n = 4) and AGE (n = 2) were rare.
The bivariate assessment of risk factors for our outcomes is summarized in Table 3. Bivariate categorical analysis of wasting was not presented due to the small sample size of 2 wasted children; however, in examination of Pearson correlations, appropriate WLZ or WHZ correlated with WBC, birthweight, and head circumference (Table 4). Undernutrition was strongly associated with lower vitamin A levels (20 306, IQR: 16 605.25-23 973.75 vs 23 665, IQR: 19 292-26 474 ng/mL, P = .04) and weakly associated with monthly income (Table 3). Stunting was weakly associated with monthly income (Table 4). Linear growth (LAZ or HAZ) correlated with serum iron, serum zinc, WBC, birthweight, monthly income, duration of breastfeeding, and head circumference (Table 4). Underweight was strongly associated with DDS (mean ± SD, 5.35 ± 1.23 vs 5.11 ± 1.3, P = .047), parental report of illness (43.8%, n = 7 vs 80% n = 40, P = .005) and WBC (13.7, IQR: 11.95-15.8 vs 10.9, IQR: 7.8-14.23 × 10⁹/L, P = .02) and weakly associated with serum vitamin A, monthly income, platelets, and birth in hospital (Table 3). Normal WAZ was associated with DDS, serum iron, serum zinc, birthweight, monthly income, and head circumference (Table 4).
Risk Factors for Undernutrition, Stunting, and Underweight.
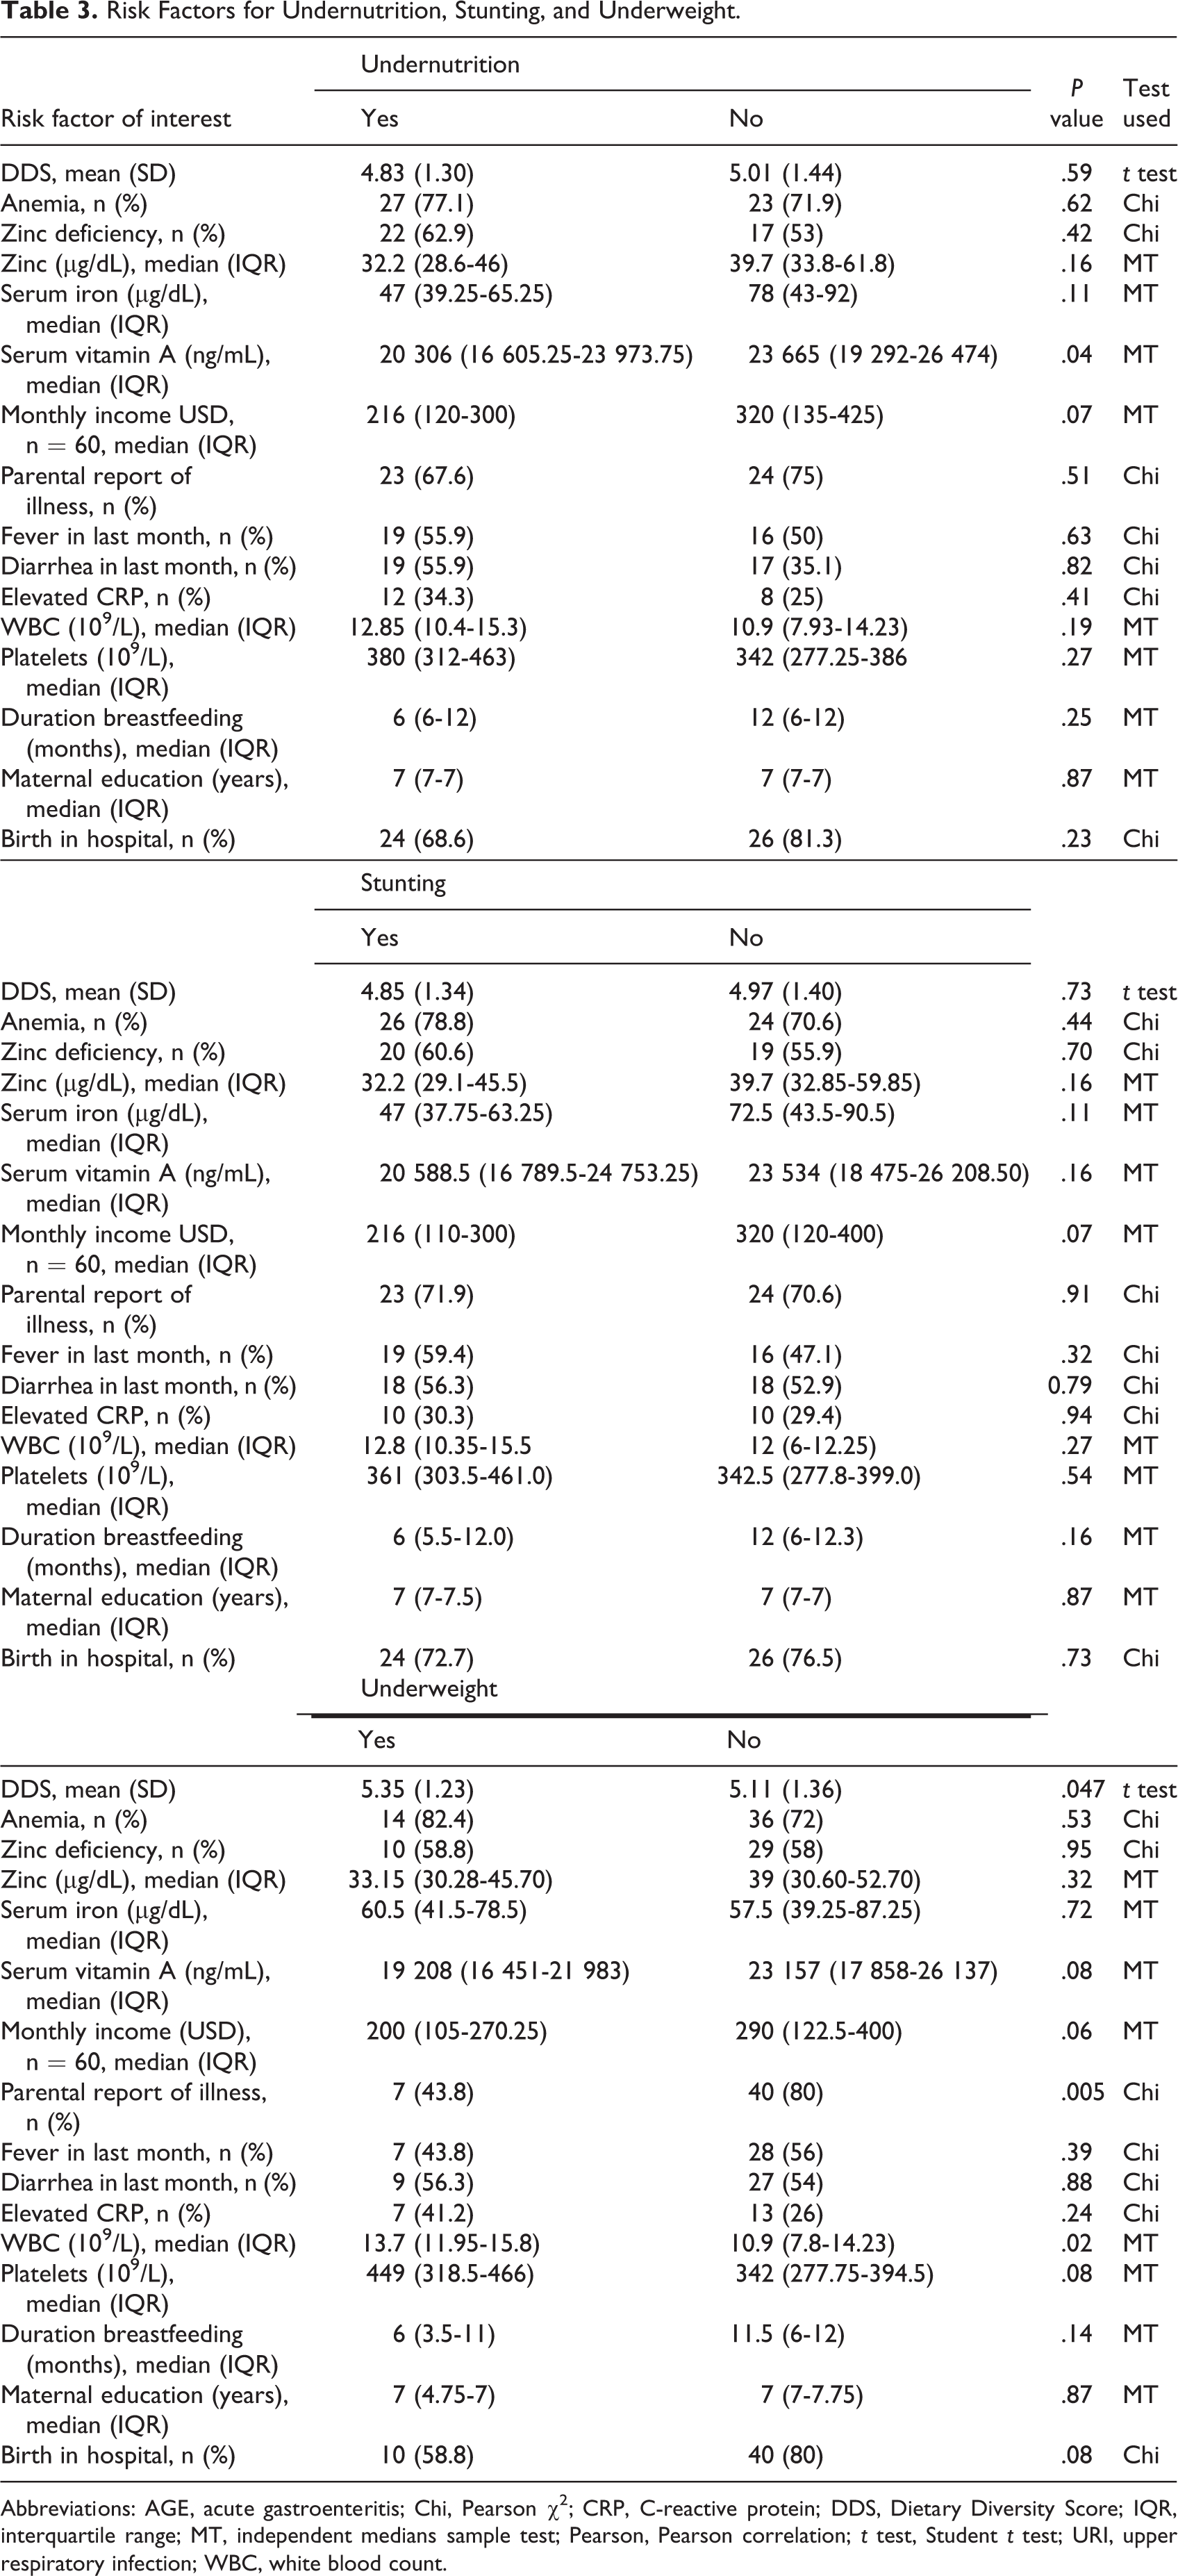
Abbreviations: AGE, acute gastroenteritis; Chi, Pearson χ2; CRP, C-reactive protein; DDS, Dietary Diversity Score; IQR, interquartile range; MT, independent medians sample test; Pearson, Pearson correlation; t test, Student t test; URI, upper respiratory infection; WBC, white blood count.
Nutritional, Sociodemographic, and Laboratory Correlations With Nutritional Diagnoses.a
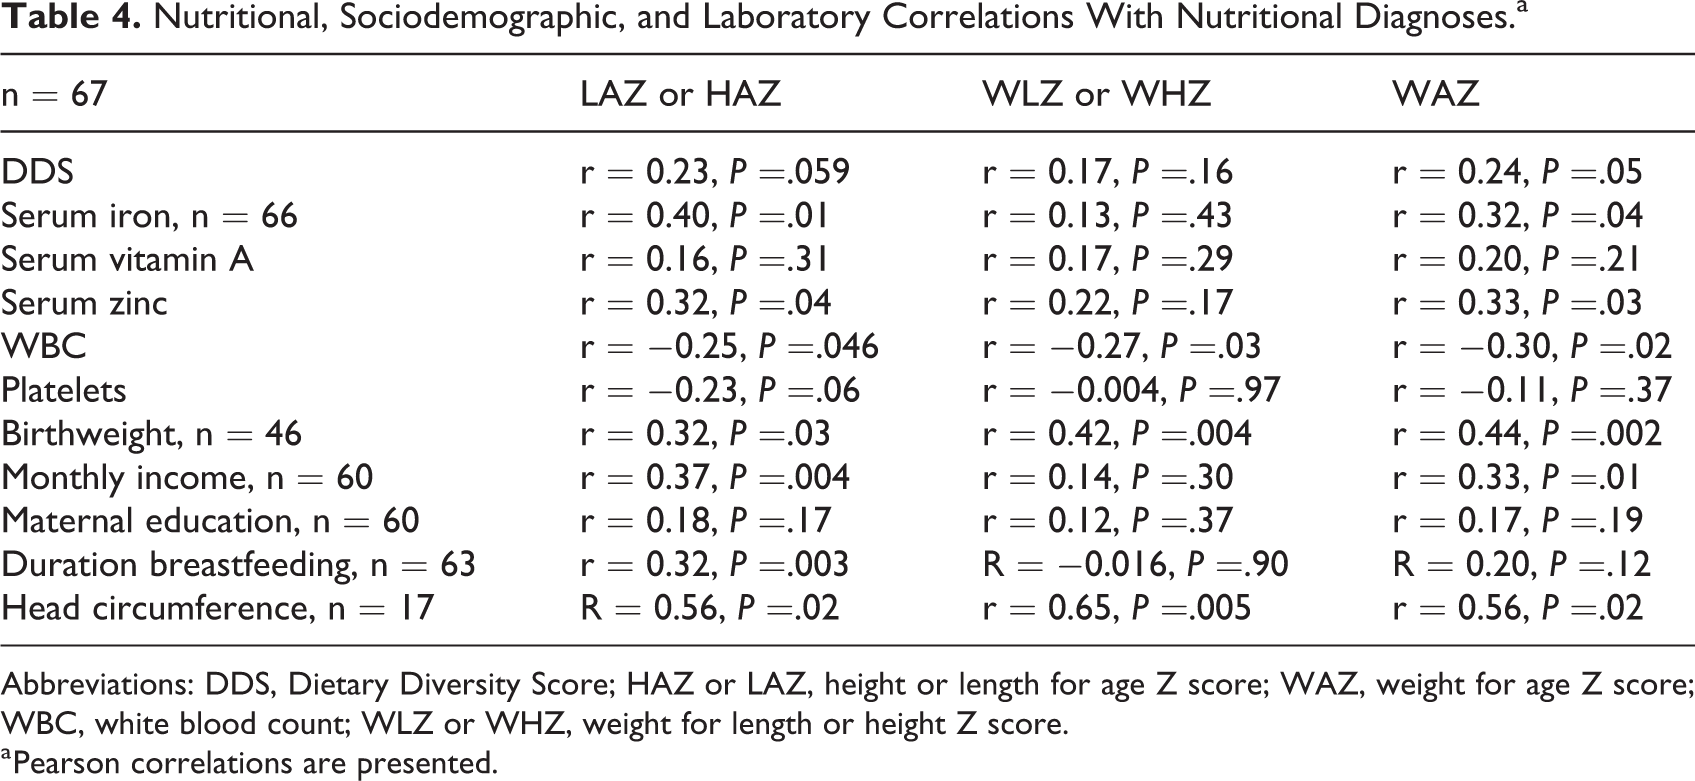
Abbreviations: DDS, Dietary Diversity Score; HAZ or LAZ, height or length for age Z score; WAZ, weight for age Z score; WBC, white blood count; WLZ or WHZ, weight for length or height Z score.
a Pearson correlations are presented.
Of our main explanatory variables of interest, DDS was universally low and did not show any associations with nutritional outcomes except for a small but significant difference for underweight children (mean ± SD, 5.35 ± 1.23 vs 5.11 ± 1.3, P = .047). Dietary Diversity Score did show a modest trend to significant positive correlation to increasing LAZ or HAZ and a significant positive correlation with WAZ (r = 0.24, P = .05). In assessing factors influencing DDS, monthly income showed a trend to association with a small positive correlation (r = 0.24, P = .065). Duration of breastfeeding also increased as DDS increased (r = 0.30, P = .02).
By cross-tabulation, neither anemia, serum zinc or zinc deficiency, or serum iron showed any association with nutritional outcomes. Zinc was equally low in all nutritional outcomes and anemia equally prevalent. Vitamin A serum levels, however, were significantly lower for those with undernutrition (20 306, IQR: 16 605.25-23 973.75 vs 23 665, IQR: 19 292-26 474 ng/mL, P = .04) and trended to significantly lower in those who were underweight (Table 3). Of all serum micronutrients, serum iron showed a positive correlation with increasing WLZ or WHZ (r = 0.40, P = .01) and increasing WAZ (r = 0.32, P = .04). Serum zinc also showed a similar rise with increasing LAZ or HAZ (r = 0.32, P = .04) and with increasing WAZ (r = 0.33, P = .03). Serum vitamin A levels did not show any relationship with undernutrition, stunting, or underweight. Of note, serum iron and serum vitamin A levels showed a modest positive correlation with each other (r = 0.35, P = .03). Despite the very low prevalence of low birthweight or small for gestational age infants (data not shown), birthweight was positively correlated with all nutritional diagnoses (LAZ or HAZ: r = 0.32, P = .03; WLZ or WHZ r = 0.42, P = .004; WAZ r = 0.44, P = .002) and head circumference also correlated strongly with both WLZ or WHZ (r = 0.65, P = .005) and WAZ (r = 0.56, P = .02); though this is limited by a small sample size (n = 17).
Although universally low, monthly income trended to even lower for families with undernourished children as well as those specifically with stunting or underweight in bivariate analysis (Table 3). Monthly income also correlated positively with increasing LAZ (r = 0.37, P = .004) and WAZ (r = 0.33, P = .01).
Parental report of health problems or illness did not differ significantly for undernutrition but less problems were reported in underweight children (43.8%, n = 7 underweight vs 80%, n = 40 normal or overweight, P = .005). Parental recall of fever or diarrhea in the last month was not associated with any nutritional outcomes, and medical diagnosis of URI (n = 4) or AGE (n = 2) were too infrequent to analyze.
Elevated CRP prevalence did not differ significantly for any nutritional outcome. Median WBC was lower in underweight children (13.7, IQR: 11.95-15.8 vs 10.9, IQR 7.8-14.23 × 10⁹/L, P = .02), and median platelets trended higher as well in those children (Table 3). In support of this, WBC showed modest negative correlation with all nutritional Z scores (Table 4); however, platelets were not related to underweight and only showed a trend to negative correlation in LAZ or HAZ (Table 4).
Of all feeding practices examined, only duration of breastfeeding showed an association with growth in its positive correlation to linear growth (Table 4). Other breastfeeding practices including exclusive breastfeeding for 6 months, breastfeeding for over 12 months, and early introduction of complementary foods were highly prevalent and did not show any associations with growth.
Neither maternal education, total number of children in the home, number of children less than 5 years in the home, nor birth in hospital versus in the community affected nutritional outcomes in bivariate analysis (data not shown). Age did not appear to strongly influence nutritional outcomes; but in a larger sample, younger children may show a risk for increased underweight (mean ± SD, 2.55 ± 0.99 vs 3.12 ± 1.15 years, underweight vs not underweight, P = .07). In the assessment of interaction between variables, weak associations were found between maternal education and hemoglobin (r = 0.25, P = .059, n = 60 Pearson correlation) and WBC (r = −0.25, P = .05, n = 60 Pearson correlation); there were no associations with maternal education or other variables which could also interact with these laboratory findings.
Risk factors influencing growth outcomes in bivariate analysis were selected for evaluation in our model for each nutritional outcome. These were monthly income, duration of breastfeeding, birthweight, parental report of health problems, serum iron, serum RBP4, serum zinc, platelets, and WBC. Head circumference was excluded due to its small sample size of 17. Results are summarized in Figure 1. Within this population, monthly income was the only risk factor independently associated with undernutrition. For every 10 dollar increase in monthly income, the risk of undernutrition decreased by 4% (adjusted odds ratio [OR]: 0.96; 95 CI%: 0.926-0.995, n = 29).
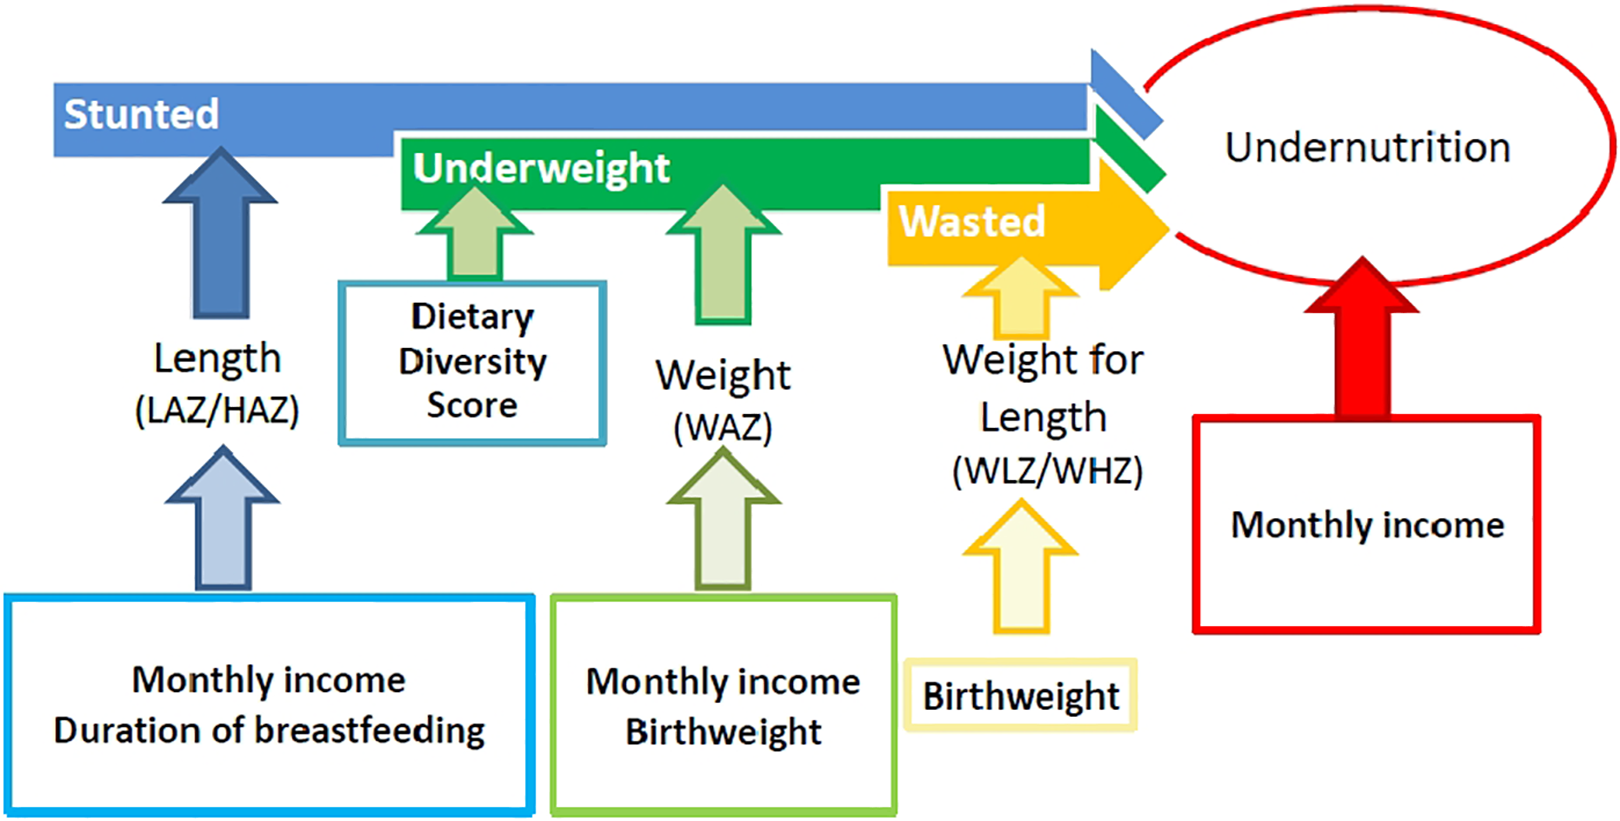
Model of identified risk factors of any type of undernutrition and specifically stunting, underweight, or wasting in children younger than 5 years in a peri-urban limited resource mostly Indigenous community in Santo Domingo, Ecuador.
No examined variables were independently associated with stunting. In evaluation of linear growth or stature via LAZ, increasing duration of breastfeeding and increased monthly income increased LAZ when adjusted for other variables. For every increased month of breastfeeding, LAZ increased by 0.08 (β = .08, SE: 0.02, P = .002, n = 56). For every 10 dollar increase in monthly income, LAZ increased by 0.03 (β = .025, SE: 0.009, P = .0046, n = 56).
Due to the small sample size, multiple regression analysis of wasting was not performed. In evaluation of WLZ or WHZ by WLZ as a continuous variable, birthweight was the only independently associated influence on this growth parameter when adjusted for other risk factors; for every gram increase in birthweight, WLZ increased by 0.0008 (β = .0008, SE: 0.0003, P = .004, n = 45).
Dietary Diversity Score was independently associated with underweight. For every point increase in DDS, odds of underweight decreased by 0.06 (adjusted OR: 0.06, 95 CI%: 0.004-0.907, P = .04, n = 23). In complementary analysis of WAZ, a 10-dollar increase in monthly income was associated with a 0.02 increase in WAZ (β = .02, SE: 0.01 P = .046, n = 39) and a gram increase in birthweight was associated with a 0.001 increase in WAZ (β = .001, SE: 0.0003, P = .01, n = 39).
Discussion
In our cross-sectional study of 67 children age 1 to 5 years in a peri-urban limited resource community in Ecuador, we found that undernutrition especially stunting is highly prevalent and dietary diversity universally low. This was despite a low prevalence of risk factors related to birth or early infancy including a high rate of birth in a hospital, majority normal birthweight for gestational age, a low prevalence of prematurity, and excellent feeding practices including prolonged breastfeeding and limited early introduction of solids. We also found that low serum zinc and anemia are also highly prevalent with lower normal serum iron but normal vitamin A levels. Despite rare medical diagnoses of infectious illness at the time of examination, the majority of children had normal WBC and platelets but elevated CRP. Nutrient levels and inflammation appeared associated with nutritional outcomes but did not appear as independent risk factors when adjusting for other variables. Household income, maternal education, and access to clean water in this population were very low and did not appear to differ by growth status. This is likely due to the small amount of variation in the prevalence of these risk factors. This study took place during the dry season; however, this season is not marked by a drop in available cultivated food.
Of all perceived risk factors, monthly income, birthweight, duration of breastfeeding, and DDS most affected growth outcomes, while monthly income was the only risk factor independently associated with undernutrition. This may be due to the large-reaching impact of low monthly income on both linear growth (LAZ) and weight gain (WAZ), as both comprise undernutrition (Figure 1). Money allows for the purchase of more food, transportation to remote health resources, improved sanitation, and other determinants of health that may also affect nutritional status. Dietary diversity was universally low and this may explain why lower dietary diversity was an independent risk factor only for underweight. Dietary Diversity Score may represent a snapshot over a short period of time, while monthly income may represent available resources over a longer period of time. Dietary Diversity Score and monthly income are also weakly correlated with each other (r = 0.24, P = .07, n = 60), and thus the impact of monthly income on undernutrition may partly explain the relationship of DDS to components of undernutrition especially underweight. Socioeconomic risk factors for malnutrition are not well reported from Ecuadorian communities; however, a recent meta-analysis of national surveys from 1986 to 2012 confirms the role of household income and also finds that maternal education is also a risk factor for undernutrition in children younger than 5 years. 21
Longer duration of breastfeeding appeared to be a protective risk factor and was associated with higher DDS and higher serum iron as well as improved WAZ. The high prevalence of exclusive breastfeeding and normal introduction of solids in this community are likely protective factors.
Our findings of undernutrition (52.5%), especially stunting (49.3%), highly supersede national estimates of 23.9% 2 and regional estimates of 24.6% 22 of similar childhood communities younger than 5 years or even of the highest estimate of stunting at 36.5% 4 in the lowest socioeconomic quintile such as our community. These prevalences have changed little in the last 10 years and are reflective of our 2011 data collection. Stunting marks chronic malnutrition with a global prevalence at the time of this study of 25% and may be as important to treat as wasting in the malnourished child. 23 Indigenous populations such as ours may show disproportionate levels of stunting. We note increased prevalence both over national and global stunting; other studies such as one of 298 Ecuadorian Andean indigenous children 6 months to 12 years also report stunting at a similar prevalence to ours of 48.6%. Similar to our study, they also note an increased adjusted odds ratio of 2.90 for stunting with household earning less than minimum wage compared to above minimum wage. 24 Rates of wasting in children younger than 5 years are low in Ecuador (1.6%) and in our study (3%), yet our population again experiences worse outcomes. The low rate of wasting is likely due to the disproportionately high prevalence of stunting over the prevalence of underweight as reflected in our study (eg, 49.3% vs 25.4% underweight); unfortunately underweight prevalence is rarely reported. This emphasizes the importance of assessing both chronic malnutrition (stunting) and acute malnutrition (wasting), as well as paying attention to underweight status. Interestingly, low birth weight was much lower in our population than national estimated prevalence of a 10%. 2
The homogeneity of poor dietary diversity in this population minimizes associations between lower DDS and nutritional outcomes. It is likely that all children are similarly at risk for malnutrition and micronutrient deficiencies due to their poor diet; this may be reflected by the high prevalence of low serum zinc and high prevalence of anemia. The universal adequacy of vitamin A levels may reflect universal vitamin A supplementation unknown to our team or conducted prior to the analysis and time of recall. The consumption of vitamin A containing fruits, vegetables, or organ meats was low to nonexistent in our FFQ (data not shown). Oat was a common food group, but data on the brands used or any incumbent fortification are not available. According to medical providers in this program, access to health care outside of the Shoulder to Shoulder Medical Center is limited in this region and most children do not receive vitamin A preventive supplementation or WHO standard zinc supplementation for AGE (J. Ceballos-Osorio, personal communication, May 15, 2020). This was reflected by a low prevalence of the only known supplement, Chis Paz, used in only 10 children in our population.
In healthy populations, birthweight when appropriate for gestational age and without Intrauterine Growth Restriction infrequently predicts growth potential. In our population, the clear association of birthweight and head circumference with lower nutritional Z scores in the absence of high rates of SGA or prematurity suggests that these smaller—though still appropriate for gestational age—infants have decreased reserves when exposed to the same risk factors as larger infants or that they experience higher rates of iron deficiency or other undetected risk factors for adequate growth. Indeed, birthweight correlated strongly with all nutritional diagnoses. Although an imperfect measure of iron stores, serum iron did not show any relationship to birthweight, but it did correlate positively with head circumference (r = −0.64, P = .04 Pearson correlation, n = 11). This was, however, available in a very small sample. Serum zinc showed a modest trend to correlation with increasing birthweight (r = 0.34, P = .09, n = 46). Birthweight was also negatively correlated with duration of breastfeeding; this may be one possible explanation for lack of optimal growth as breast milk in LMICs is often the cleanest and most nutrient dense available liquid supplement for infants.
The rare occurrence of low birthweight (data not reported) suggests that the impact of postnatal insults to growth such as repeated infectious illnesses and poor nutrition, water, sanitation, and hygiene is more applicable to our population than the more frequently seen compounded risk as in sub-Saharan African communities of these factors on top of poor intrauterine growth. 1 The addition of maternal data especially on anemia, maternal malnutrition, and maternal illness would add to this assessment.
In regard to additional subtler etiologies for the high prevalence of stunting, animal protein including the consumption of eggs and dairy is associated with improved linear growth. 25 In our population, there was universally no consumption of eggs but a modest consumption of meats and fish and excellent consumption of milk (data not shown) as recorded via FFQ.
In this study, we elected not to correct Serum RBP4 for CRP. Serum RBP4 can change with inflammation and indeed there were modest negative correlations with increasing WBC or platelets (WBC r = −0.31, P ≤ .05; PLT: −0.31, P = .05). As serum vitamin A did not change with nutritional outcomes as did WBC and to a lesser extent platelets, it is possible that these did not interact.
Anemia, iron deficiency, and vitamin A deficiency remain national challenges. Our study emphasizes the concentration of nutrient deficiencies in poor populations with a rate of 74.6% for anemia much higher than WHO estimates of 40%. 8 The lack of vitamin A deficiency is not representative of other similar populations.
The role of inflammation and especially intestinal inflammation in the pathophysiology of malnutrition, though weakly measured in our study, has been proven in other regions but has not been explored in this region. 26 Our study inadequately measures inflammation via CRP and platelets and to a lesser extent WBC, but further investigation of concurrent intestinal infection, elevation of cytokines, and fecal calprotectin would add to this assessment.
Immune dysregulation and immune deficiency is a hallmark of acute malnutrition, and micronutrient deficiencies and may contribute to the slightly lower (but still normal) WBC in underweight children in the face of a trend in increased platelets that are themselves a marker of inflammation. 27,28 Physiologically, WBC tends to increase mostly in response to infection, and the low prevalence of diagnosed infection at the time of medical evaluation may suggest a reason for the lack of elevation of WBC. Despite a similar reference range of platelets for all ages, platelets decreased with increasing age (r = −0.35, P = .004, n = 67) and with decreasing hemoglobin (r = 0.54, P < .001). These associations are not physiologically supported. These relationships were not explored further in the scope of this analysis.
The prevalence of diagnosed URI and AGE is low for this age-group especially in the context of an undernourished population and may be underreported or underdiagnosed. The much lower report of parental illness in underweight children is difficult to interpret; one explanation may be that these children are sick more often and thus parents become desensitized; however, this is unlikely and may be a chance finding.
Two children were diagnosed with likely congenital disorders of cerebral palsy and possible Pierre Robin syndrome; both of these are known to frequently affect feeding capabilities and to put the child at increased risk of malnutrition. Cerebral palsy can also create challenges in accurate length and the use of mid-upper-arm circumference (MUAC) or triceps skinfold thickness helps to assess nutrition in spastic cerebral palsy or any condition that alters the ability to obtain a fully elongated standing height or recumbent length measurement. We included these children in our analysis as the low number (n = 2) of these individuals was unlikely to significantly affect our results, and children with disabilities are often excluded from nutritional investigations and thus would benefit from greater visibility and reporting in medical literature.
This study is limited by selection bias as only children presenting to our medical center were included, a small sample size, a lack of random selection, and dietary and medical historical information based on caregiver recall. In addition, MUAC was not obtained as a measure of wasting.
Lab limitations include the difficulty of precisely measuring serum zinc, rapid fluctuations in CRP, and the potential impact of inflammation on reducing measurable retinol levels. No participant had low serum vitamin A levels despite elevated CRP. 29 The use of serum iron reflects iron available for measurement and is not always a precise marker of total body iron stores. A combination of serum iron, MCV, ferritin, transferrin saturation, and total iron-binding capacity would more accurately assess iron stores.
Potential confounders include selection bias from more urgent medical attention sought for a sick child, provision of unreported micronutrient supplementation, unreported macronutrient nutritional supplementation or medical nutritional rehabilitation, unreported or undiagnosed illness leading to a change in C-reactive protein, or recent weight loss including from dehydration. Our small sample size limited our ability to identify strong associations and to create an adequately powered multivariate model. There were, however, a sufficient number of plausible associations as well as trends, and some weak but present correlations that are worth investigating at a larger scale in our next prospective study.
Conclusion
We hypothesized that undernutrition including stunting, wasting, and underweight would be most strongly associated with decreased DDS, increased micronutrient deficiencies, anemia, low family income, and recent or current illness. We hypothesized additionally that measures of undernutrition would be associated with increased inflammation, suboptimal feeding practices, and additional markers of socioeconomic stress such as lower maternal education, increased children in the home, and birth in the community. We found that of these, low monthly income, lower WBC, and lower DDS can predict some forms of undernutrition in our population. Serum iron and zinc appear correlated with improved anthropometrics, and vitamin A trends lower in undernourished children. Markers of inflammation do not appear predictive of nutritional outcomes, but WBC does negatively correlate with all anthropometrics. Additional demographic variables do not appear to predict undernutrition, but lower head circumference and lower birthweight may be markers for poorer future nutritional outcomes. Of all of these, lower monthly income is the strongest predictor of undernutrition. Although limited, our study adds valuable details to the analysis of risk factors for undernutrition in Ecuadorian children and emphasizes the concentration of undernutrition in marginalized and indigenous populations. Further evaluation of a larger sample size of this target population with improved laboratory markers, more detailed nutritional and clinical assessment, and evaluation of maternal risk factors during pregnancy is needed to build upon the findings of this study. Future studies should focus on confirming these findings and identifying interventions to reduce the risk factors for this devastating childhood condition.
Footnotes
Acknowledgments
The authors would like to thank all the study participants and personnel for their involvement, GMV for data entry assistance, and GJF for mentorship. The authors also thank Hazel Forsythe, PhD, RDN, for her leadership in collecting and for sharing the data used for this study.
Declaration of Conflicting Interests
The author(s) declared no potential conflicts of interest with respect to the research, authorship, and/or publication of this article.
Funding
The author(s) received no financial support for the research, authorship, and/or publication of this article.