
Abstract
Background:
Iron deficiency is a global public health concern and has implications on the health status of women in reproductive age.
Objective:
We hypothesized that improving iron intake with double fortified salt would improve food intake, resulting in higher energy, nutrient intakes, and weight indicators of female tea plantation workers.
Methods:
In this randomized double-masked study, the participants (n = 245) were assigned to receive salt double fortified with iron and iodine (DFS; treatment) or salt fortified with iodine (control) and followed for 7.5 to 9 months. Dietary intakes were measured at three time points, baseline, midpoint, and end line using (1) food frequency questionnaire, (2) 24-hour recall, and (3) weighed lunch intake. Anthropometric measures of height (cm), weight (kg), and mid-upper arm circumference (cm) were also recorded at three time points. Mixed-model repeated-measures approach was used to detect group differences across time.
Results:
Double fortified salt improved dietary iron intake in the treatment group compared to the control group (P < .001). No other dietary or anthropometric differences could be attributed to treatment. Significant effect of time was observed in the intake frequency of major food groups and calcium, vitamin A and C (P <.001 for all), suggesting an equal effect of seasonality in both the groups.
Conclusion:
Addition of DFS in the diet improved dietary iron intake but did not affect the intake of energy, other nutrients, or nutritional status indicators. The improvement observed in the dietary iron intake demonstrates that fortification is an effective strategy to address iron deficiency in at-risk populations.
Introduction
Globally, 800 million women have anemia, with most of them being iron deficient. 1 –3 In India, the National Family Health Survey-3 reported 55% of women aged 15 to 49 years are anemic. 4 Iron deficiency (ID) and ID anemia have implications for overall health status of women in reproductive age and affect several behavioral outcomes including worker productivity and cognitive functioning. 5 –7 Intake of iron-rich foods is a challenge in marginalized populations. 8 –10 Typical diets in India are predominantly cereal based contributing to high phytate content and limited intake of heme iron-rich foods and fruits that enhance iron absorption. 11
Poor appetite can be a consequence of anemia and affects energy and nutrient intake. Improvement in appetite and food intake has been observed in studies of anemic children, 12 adolescents, 13 and adults 14 after iron supplementation. In a study of male rubber plantation workers in Indonesia, iron supplementation improved appetite and intake of vitamins C and A. 14 The physiological relationship between the improved iron status and increased appetite is not clearly understood. 12 One of the possible mechanisms of the relationship between ID and food intake can be explained by an increase in the pancreatic cells and cholecystokinin-8, a gut hormone that regulates satiety, and could potentially reduce appetite and food intake. 15
Fortification of foods is a promising strategy to address ID. 16 –18 Efficacy studies in women and young children using the different formulations of salt double fortified with iodine and iron (DFS) have demonstrated that DFS can significantly improve the iron status. 17,19 –21 Changes in appetite and food intake over time with iron fortification have not been previously reported. The main objective of this analysis was to measure change in the dietary intake in relation to the DFS intervention. We hypothesized that improving the iron intake of female tea plantation workers would increase food consumption and thereby the intake of energy, macronutrients (proteins, fats, and carbohydrates), and micronutrients (iron, calcium, zinc, vitamins C and A) as well as enhance nutritional status, specifically body weight, body mass index (BMI), and mid-upper arm circumference (MUAC).
Methods
Study Site and Study Participants
The research was conducted in a tea plantation in Panighata village, Darjeeling district, West Bengal, India. The total population of the village was 4623. The main source of income of the village was from working as tea pickers in the tea plantation or manual laborers in the tea estate factory. In 2007, 63% women in West Bengal state were anemic, 4 and the prevalence of anemia was higher among the rural women (65%) compared to the urban women (59%). 4
The study participants were female tea pickers from Panighata tea estate. They were recruited for a randomized, controlled, double-masked study to test the efficacy of DFS to improve iron status. The participant inclusion criteria were aged 18 to 55 years, not pregnant/lactating, not severely anemic (hemoglobin [Hb] <8.0 g/dL), experienced tea pluckers (worked for more than 5 years), and permanent and full-time workers. Ethical clearance for the study was obtained from the institutional review boards of McGill University, Montreal, Canada, and the participating nongovernmental organization, Child in Need Institute, Kolkata, India. The nature of the study was explained to the women and they were invited to participate in the intervention. Informed written consent was obtained from the study participants. The study was registered with ClinicalTrials.gov (NCT01349634).
Screening and Randomization
The study participants and all family members were dewormed using albendazole (400 mg; GlaxoSmithkline, Mumbai, India) one month before baseline blood collection and antihelminthic treatment was repeated every four months until the end line blood collection. The duration of the intervention was 7.5 to 9 months. Deworming was performed once the nonpregnant status was confirmed using the home pregnancy test kit to detect the presence of human chorionic gonadotrophin in urine. Screening for severe anemia (Hb < 8.0 g/dL) was carried out in 498 women using HemoCue AB (Quest Diagnostics, Gurgaon, India). From this preliminary screening, 281 women met the above-mentioned participant inclusion criteria. Venous blood was then sampled and information about work productivity, physical activity, and cognitive function were collected at baseline and end line data collection. Venous blood samples were collected at the field office by trained phlebotomists from Super Religare Laboratories (SRL), Siliguri. Blood samples were transported on dry ice within 24 hours to SRL, Kolkata, to measure blood Hb, hematocrit, and mean corpuscular volume (MCV) (analyzed using Beckman Coulter Counter, Indianapolis, US), serum ferritin, and C-Reactive Protein (CRP) (chemiluminescent immunoassay—Immunite 2000). Vitamin B12 (Immunite 2000), folate (Immunite 2000), alpha-1-acid-glycoprotein (AGP) (radial immunodiffusion; Kent Labs, Bellingham, US), and transferrin receptors (enzyme-linked immunosorbent assay; Biovendor, Brno, Czech Republic) were analyzed at the Molecular Diagnostics (Lucknow, India). Ferritin levels were adjusted for inflammation using Thurnham correction factors. 21,22 Urinary iodine was also measured at both time points (fast colorimetric method; Molecular Diagnostics). The detailed methodology has been published previously. 21 From the 281 participants, 36 women were excluded at the randomization time due to incomplete baseline data, poor health, and severe anemia determined from the venous blood sample, injury, or refusal. A total of 245 women were stratified based on the anemia classification (iron-deficient anemic [Hb <12 g/dL; ferritin <20 μg/L], iron depleted not anemic [Hb ≥12 g/dL; ferritin <20 μg/L], anemic not iron deficient [Hb <12 g/dL; ferritin ≥20 and <80 μg/L], normal [Hb >12 g/dL; ferritin ≥20 and <80 μg/L], and not anemic and high ferritin group [Hb >12 g/dL; ferritin ≥80 μg/L]) and randomized into either iodized salt (IS; the control) or DFS, using 4 color-coded salt bags. The CONSORT diagram of the intervention has been reported elsewhere. 21 Dietary intake assessment was measured at three time points—baseline, midpoint, and end line. The study flowchart is reported in Figure 1 (inset)
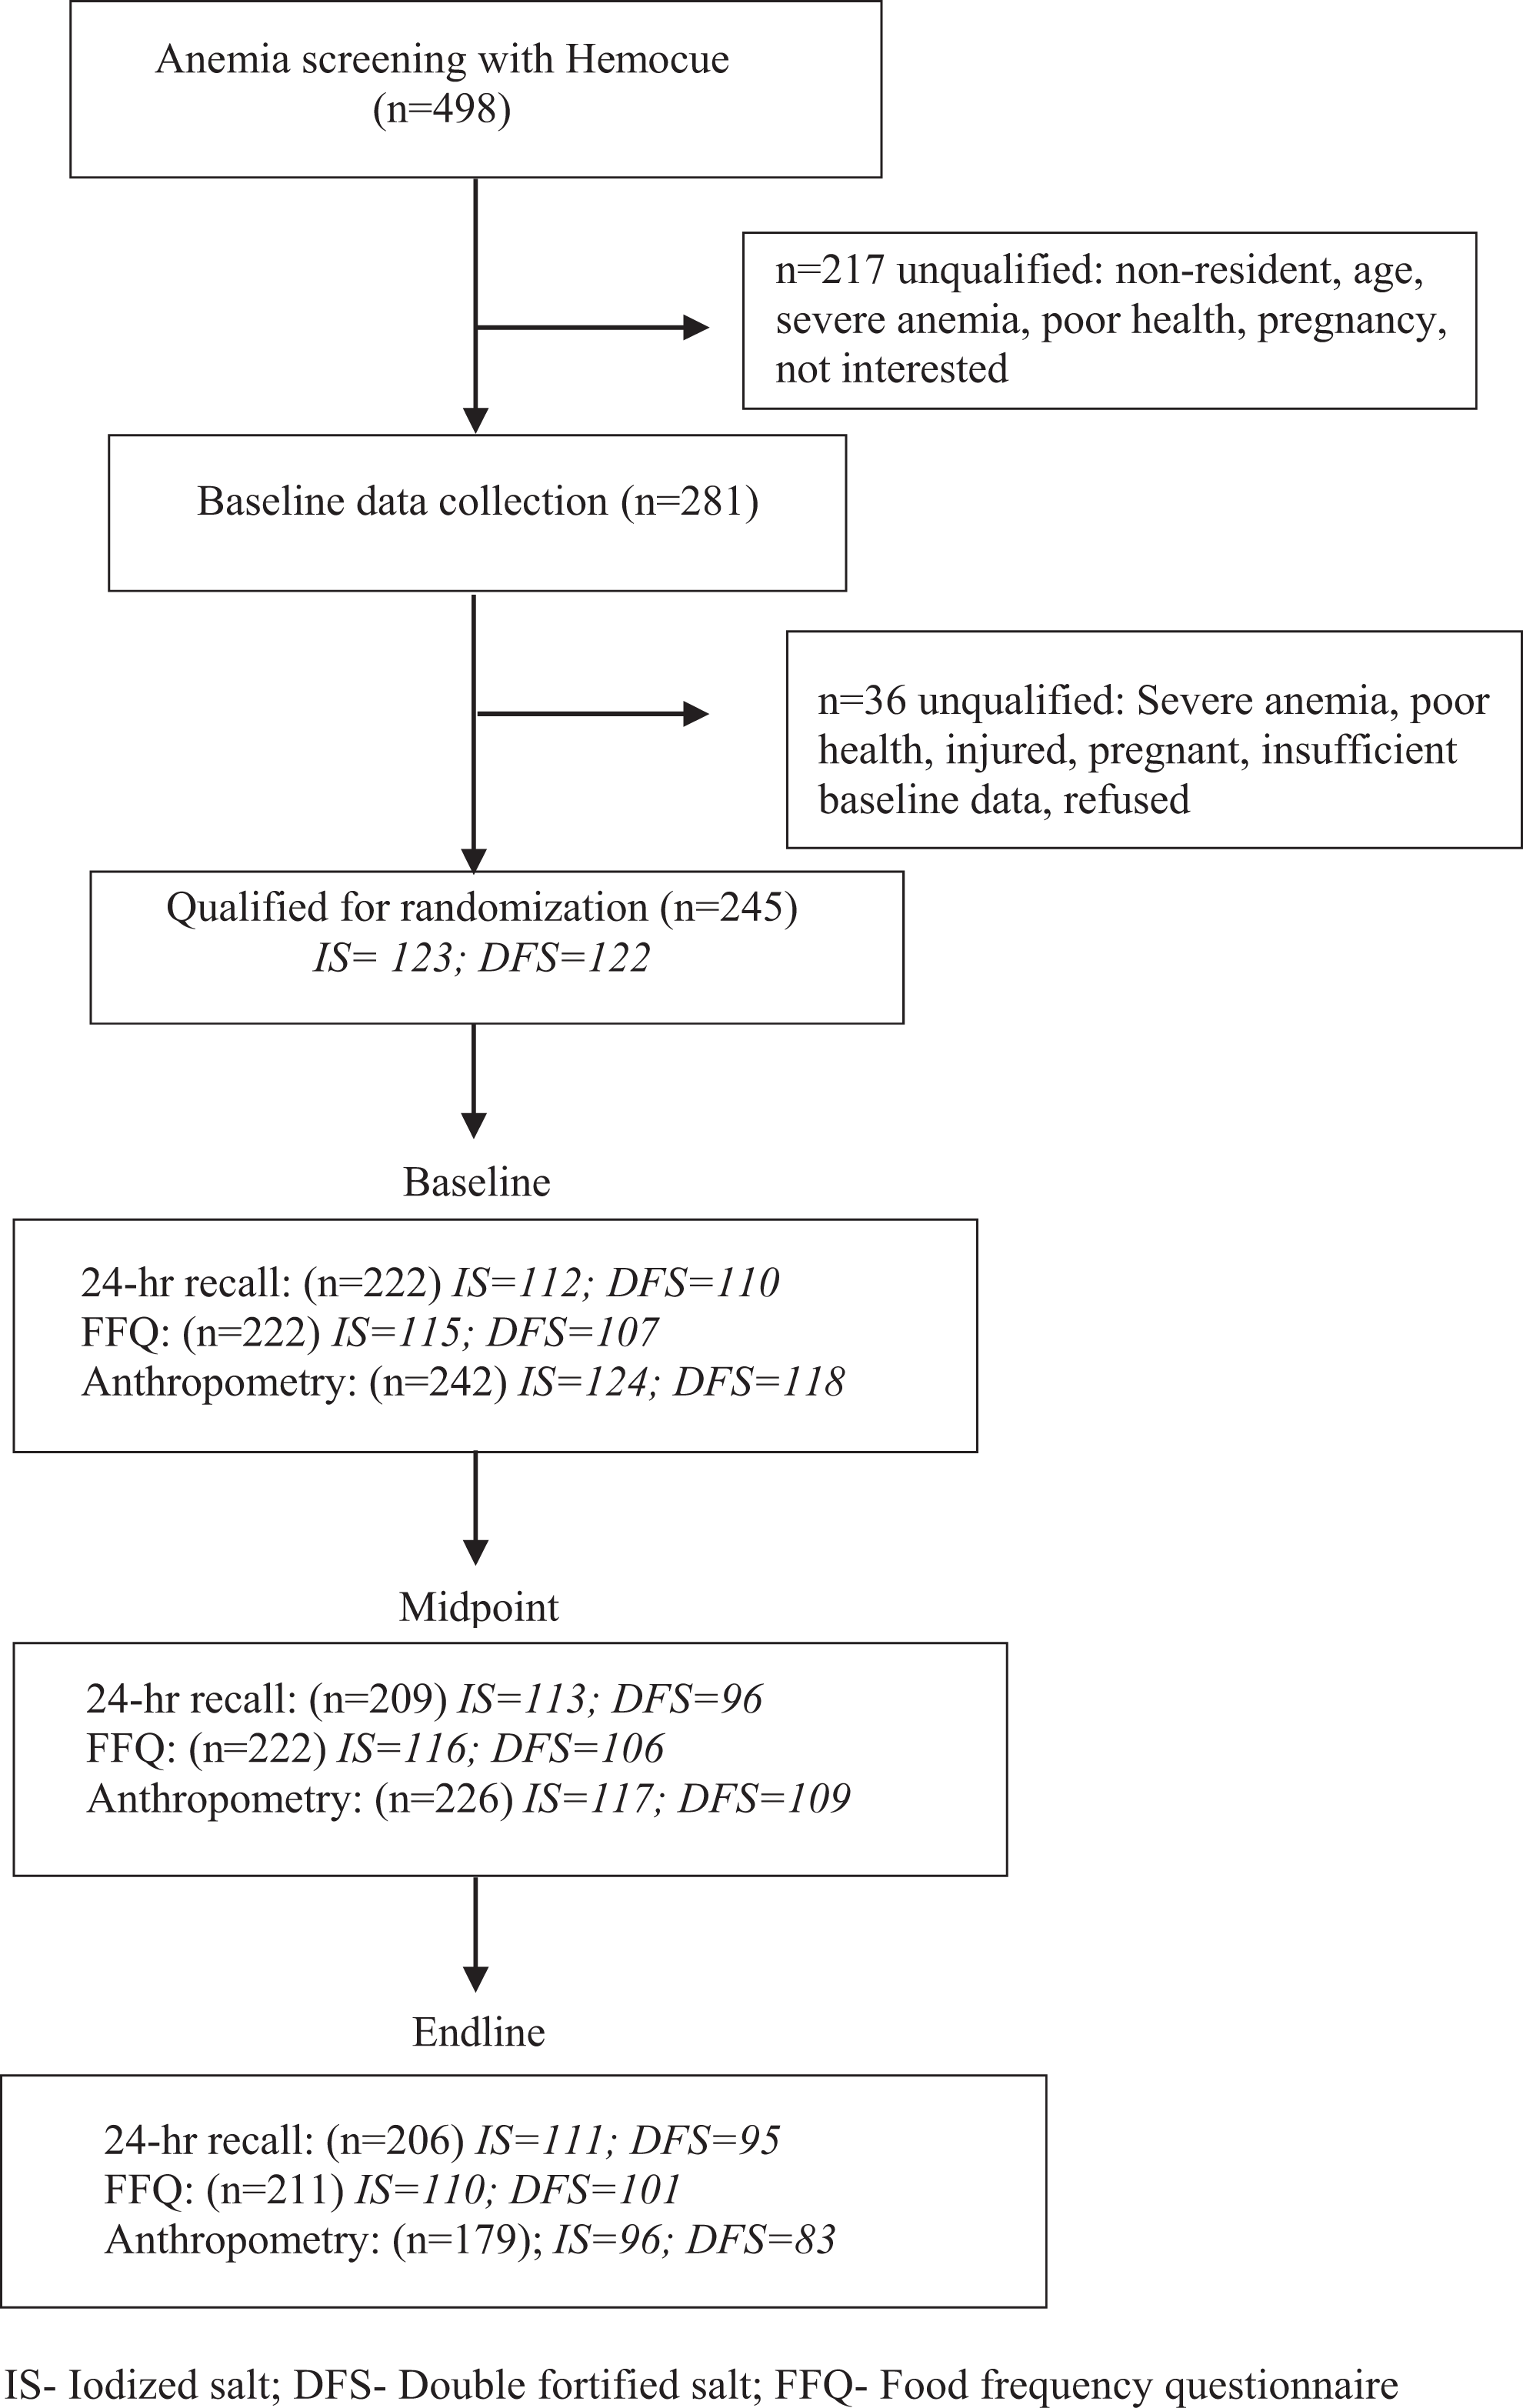
Study flowchart.
Study Salt
The double fortified salt used in the present study was comprised of 47 mg/kg of potassium iodate and 3300 mg/kg microencapsulated ferrous fumarate (1106 mg/kg elemental iron). 21,23 Salt iodization and the processing were carried out at Ankur Chemfoods, Gujarat, India. Refined salt of particle size <1 mm iodized with potassium iodate was purchased and blended with microencapsulated ferrous fumarate premix at Ankur salt factory. The microencapsulated ferrous fumarate premix was manufactured at Pam Glatt Pharma Technologies in Mumbai, India.
Salt Distribution
The study participants visited the field office every month to pick up the respective color-coded salt. Study salt was distributed to the entire household (500 g per month for every two-family members) and the salt was used for all meals prepared in home. Non-study participants including the other members of the tea estate received IS through the existing pubic distribution system at the tea estate office.
Compliance of Salt Intake
No other salt was sold in the local shops or kiosks in Panighata. All the local shopkeepers in the tea estate were approached for a yearly compensation of the profit lost by not selling the IS on the estate. The field staff periodically conducted random spot-checks at the households to document salt intake. Salt intake was also measured through the 24-hour dietary recall and weighed food intake at three time points.
Dietary Intakes
Dietary intakes were measured at baseline, midpoint, and end line using food frequency questionnaire (FFQ), 24-hour dietary recall, and weighed lunch intake. Baseline and end line data were collected during the summer months (June-September 2009) and midpoint data were collected in winter months (January-March 2010) when there was no tea picking activity and the workers received limited income.
The FFQ
The FFQ was collected at each time point to identify the frequency of food items consumed over the previous seven days. The frequency of consumption (number of times meals with the food group consumed per week) of cereals, pulses and legumes, green leafy vegetables (GLVs), other vegetables, roots and tubers, citrus fruits, other fruits, dairy products, meat and poultry, seafood, sugar, fats and oils, beverages (black tea, milk tea, coffee, soda, and malted drinks), and alcohol were collected. A diet diversity score was generated (range: 0-14) by summing up the number of food groups consumed by the women. 24
Twenty-four-hour dietary recall
Dietary assessment was based on a 24-hour recall of breakfast, snacks, and dinner using the USDA 5-step multiple-pass approach 25 ; lunches were weighed and intake was added to the recall data to estimate the total 24-hour intake. The recalls were carried out at three time points using standard measures of utensils such as glasses, cups, bowls, mugs, spoons, ladles, and plates. 26 When the recalls were conducted at the household level, the actual utensils of the participants were used to estimate the food intake. Detailed recipes were obtained from all the participants. The raw ingredients used in the recipes for all the meals were measured directly at the household at midpoint and end line data collection. Due to logistical reasons, we were unable to measure the raw ingredients at baseline.
Lunches were directly weighed at three time points and contributed to 38% of the total food intake (g). Lunch was the main meal of the day and was consumed in the tea garden during a 2-hour break at baseline and end line. During midpoint or pruning season, lunch intake and recall data were measured at the household level. The data collected included the type of food, recipes with ingredients, food served (g), amount consumed (served food minus leftover food in g), and food shared among the women (g). Sharing lunch was a universal practice in the tea garden culture. All foods were weighed with a Contech portable balance (Navi Mumbai, Maharashtra) with a precision of 0.1 g.
Nutrient composition
A database was developed, comprising 331 food items consumed by Adivasi and Nepali households. The nutrient composition for the food items was obtained from the Nutritive Value of Indian Foods, 27 except for the missing nutritive values that were imputed from the Nepali foods database 28 and the USDA nutrient database. 29 The final energy and nutrient (protein, fat, carbohydrate, vitamins A and C, calcium, iron, and zinc) intakes from the grams of raw foods were calculated using SAS version 9.2. Nutrient intake estimates were compared to the Indian recommended dietary allowances (RDAs). 27 Dietary assessment did not include phytate intake in this population.
Anthropometry
Anthropometric measures of height (cm), weight (kg), and MUAC were taken at the 3 time points: baseline, midpoint, and end line. Height (nearest cm), weight (nearest 0.5 kg), and MUAC (nearest cm) were measured at the field office with a stadiometer (locally made), digital scale (Docbel Group, New Delhi), and a flexible nonstretchable tape, respectively. The field staff was standardized in measurements before initiating fieldwork. The World Health Organization cutoffs for BMI (kg/m2) were used to define underweight, normal, overweight, and obese: underweight: <18.5; normal: 18.5 to 24.9; overweight: 25.0 to 29.9; obese: ≥30.0. 30
Statistical Analyses
Data were analyzed using SAS version 9.2. 31 Descriptive statistics were carried out for the outcome variables. Residuals of each of the outcome variables of interest were tested for normality. Bivariate tests were conducted at each time point between the treatment and outcomes. One-way analysis of variance (ANOVA) was performed for the normally distributed data and Wilcoxon-Mann Whitney test for data that were not normally distributed. χ2 Test was performed for categorical outcomes. The criterion for statistical significance was set at P < .05.
Mixedmodeling repeated-measures approach (PROC MIXED) was used to develop individual models to determine the effects of treatment on dietary and anthropometric outcomes at the three time points. The main effects of DFS treatment, time, and treatment by time interaction were analyzed. Ethnicity (Adivasi and Nepali) and baseline iron status stratification were also tested as covariates for each outcome variable. The model fit was based on the Bayesian information criteria (BIC); the lower the BIC value, the better the model fit. In repeated-measures modeling, measures on the same individual over time are likely to be correlated with each other. One way to address the effect of autocorrelation is by modeling the covariance structure. Compound symmetry structure assumes the same covariance and variance between measurements, autoregressive covariance specifies homogenous variance, and unstructured matrix is the general covariance structure with no constraints. The variance and covariance matrices are heterogeneous and offer the best fit. 31 For the model predicting BMI, a compound symmetry covariance structure was chosen based on the lowest BIC values. For the models predicting MUAC, body weight, food frequency intakes, total food intake, and nutrient intakes, an unstructured covariance matrix provided the best fit. Multiple comparisons were corrected using the Bonferroni method. 31
Results
Subject Characteristics
On average, the study participants were 39.5 ± 4.0 years from two main ethnic groups, Adivasi and Nepali. The percentage of Adivasi and Nepali study participants were 52% (N = 127) and 48% (N = 117), respectively. The main source of income was plucking tea leaves, and the women were paid based on the amount of tea leaves they plucked.
Dietary Intake
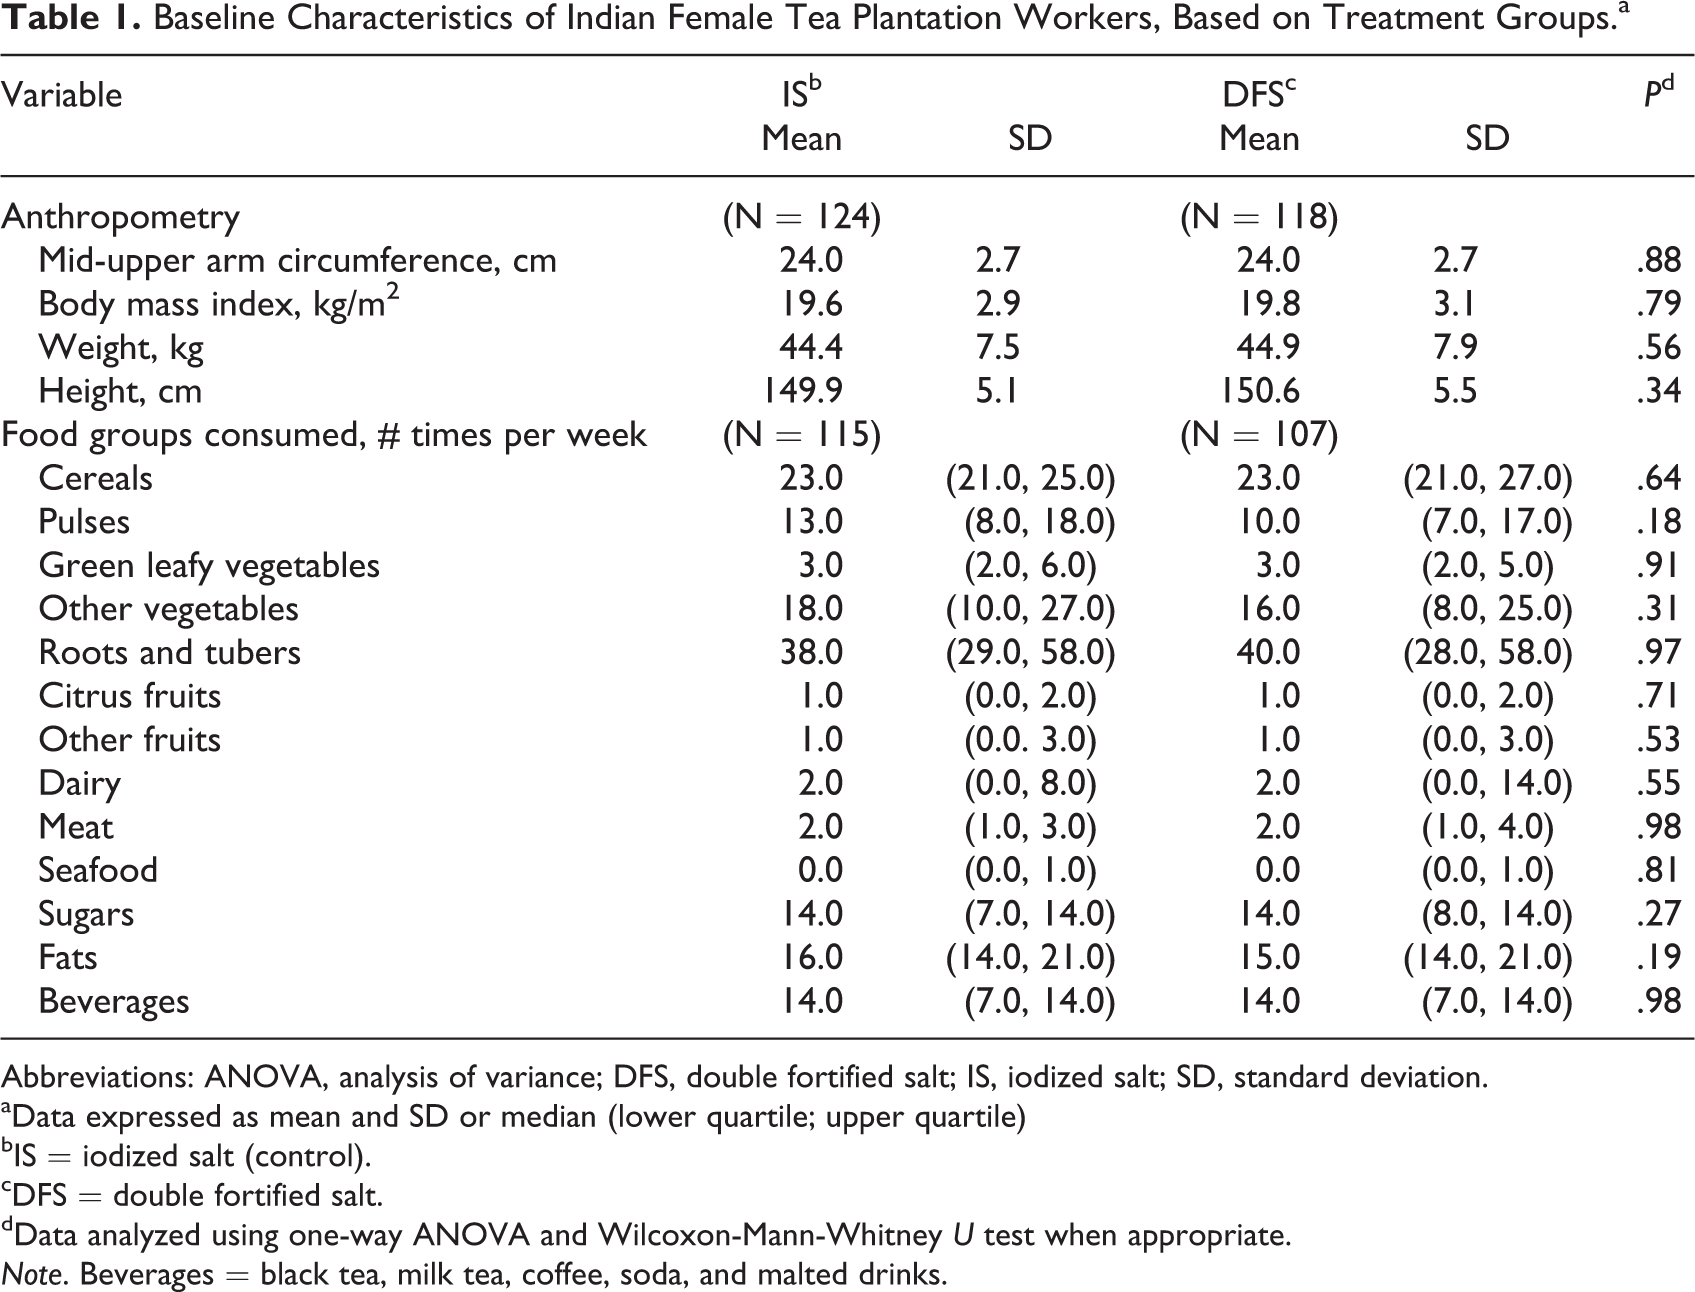
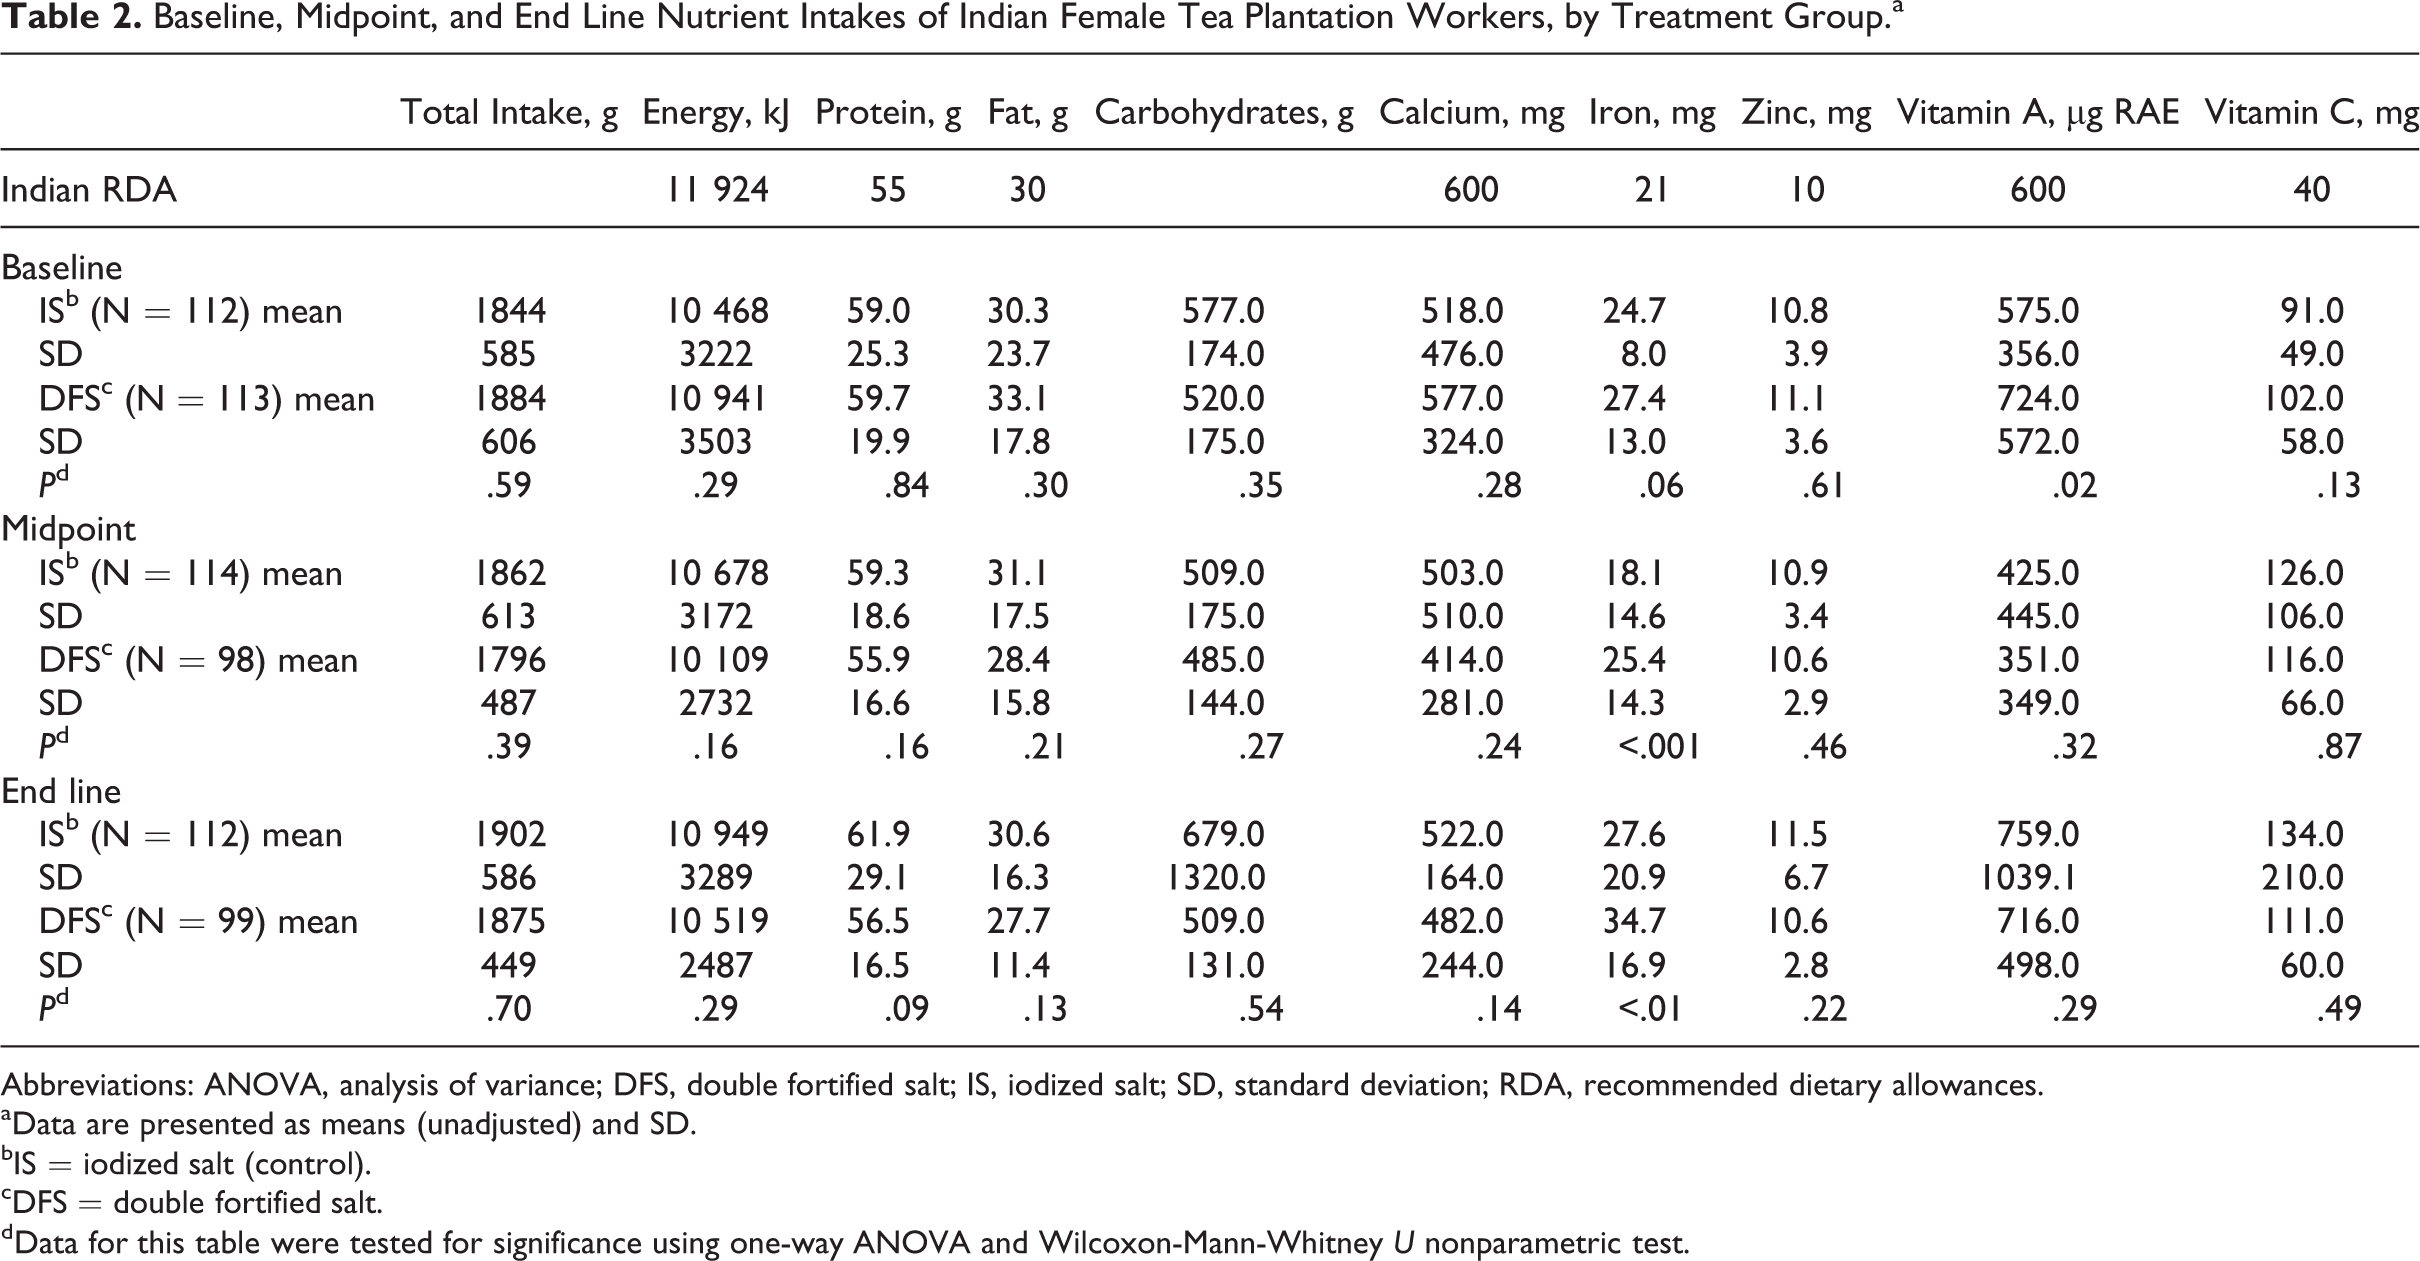
The predominant diet among the participants was nonvegetarian (89%); 11% of women followed a vegetarian diet. At baseline, no significant treatment group differences were observed in the frequency of consumption of the food groups (Table 1). The intake of energy was less than the Indian RDA in 69% and 71% of women from IS and DFS groups, respectively 27 (Table 2). The iron intake at baseline in both the IS and DFS groups met the RDA in more than 70% of the tea plantation workers.
Baseline Characteristics of Indian Female Tea Plantation Workers, Based on Treatment Groups.a
Abbreviations: ANOVA, analysis of variance; DFS, double fortified salt; IS, iodized salt; SD, standard deviation.
aData expressed as mean and SD or median (lower quartile; upper quartile)
bIS = iodized salt (control).
cDFS = double fortified salt.
dData analyzed using one-way ANOVA and Wilcoxon-Mann-Whitney U test when appropriate.
Note. Beverages = black tea, milk tea, coffee, soda, and malted drinks.
Baseline, Midpoint, and End Line Nutrient Intakes of Indian Female Tea Plantation Workers, by Treatment Group.a
Abbreviations: ANOVA, analysis of variance; DFS, double fortified salt; IS, iodized salt; SD, standard deviation; RDA, recommended dietary allowances.
aData are presented as means (unadjusted) and SD.
bIS = iodized salt (control).
cDFS = double fortified salt.
dData for this table were tested for significance using one-way ANOVA and Wilcoxon-Mann-Whitney U nonparametric test.
The overall mean salt intake during the study was 7.6 ± 4.8 g/d (range: 0-30 g/d) with no significant group differences. The energy and nutrient intake from the bivariate analyses demonstrated a significant effect of treatment only on the total dietary iron intake at midpoint and end line compared to the control (Table 2). The increase was from DFS which contributed to approximately 8.4 mg of iron per day and 0.36 mg of iodine per day.
Repeated-measures ANOVA
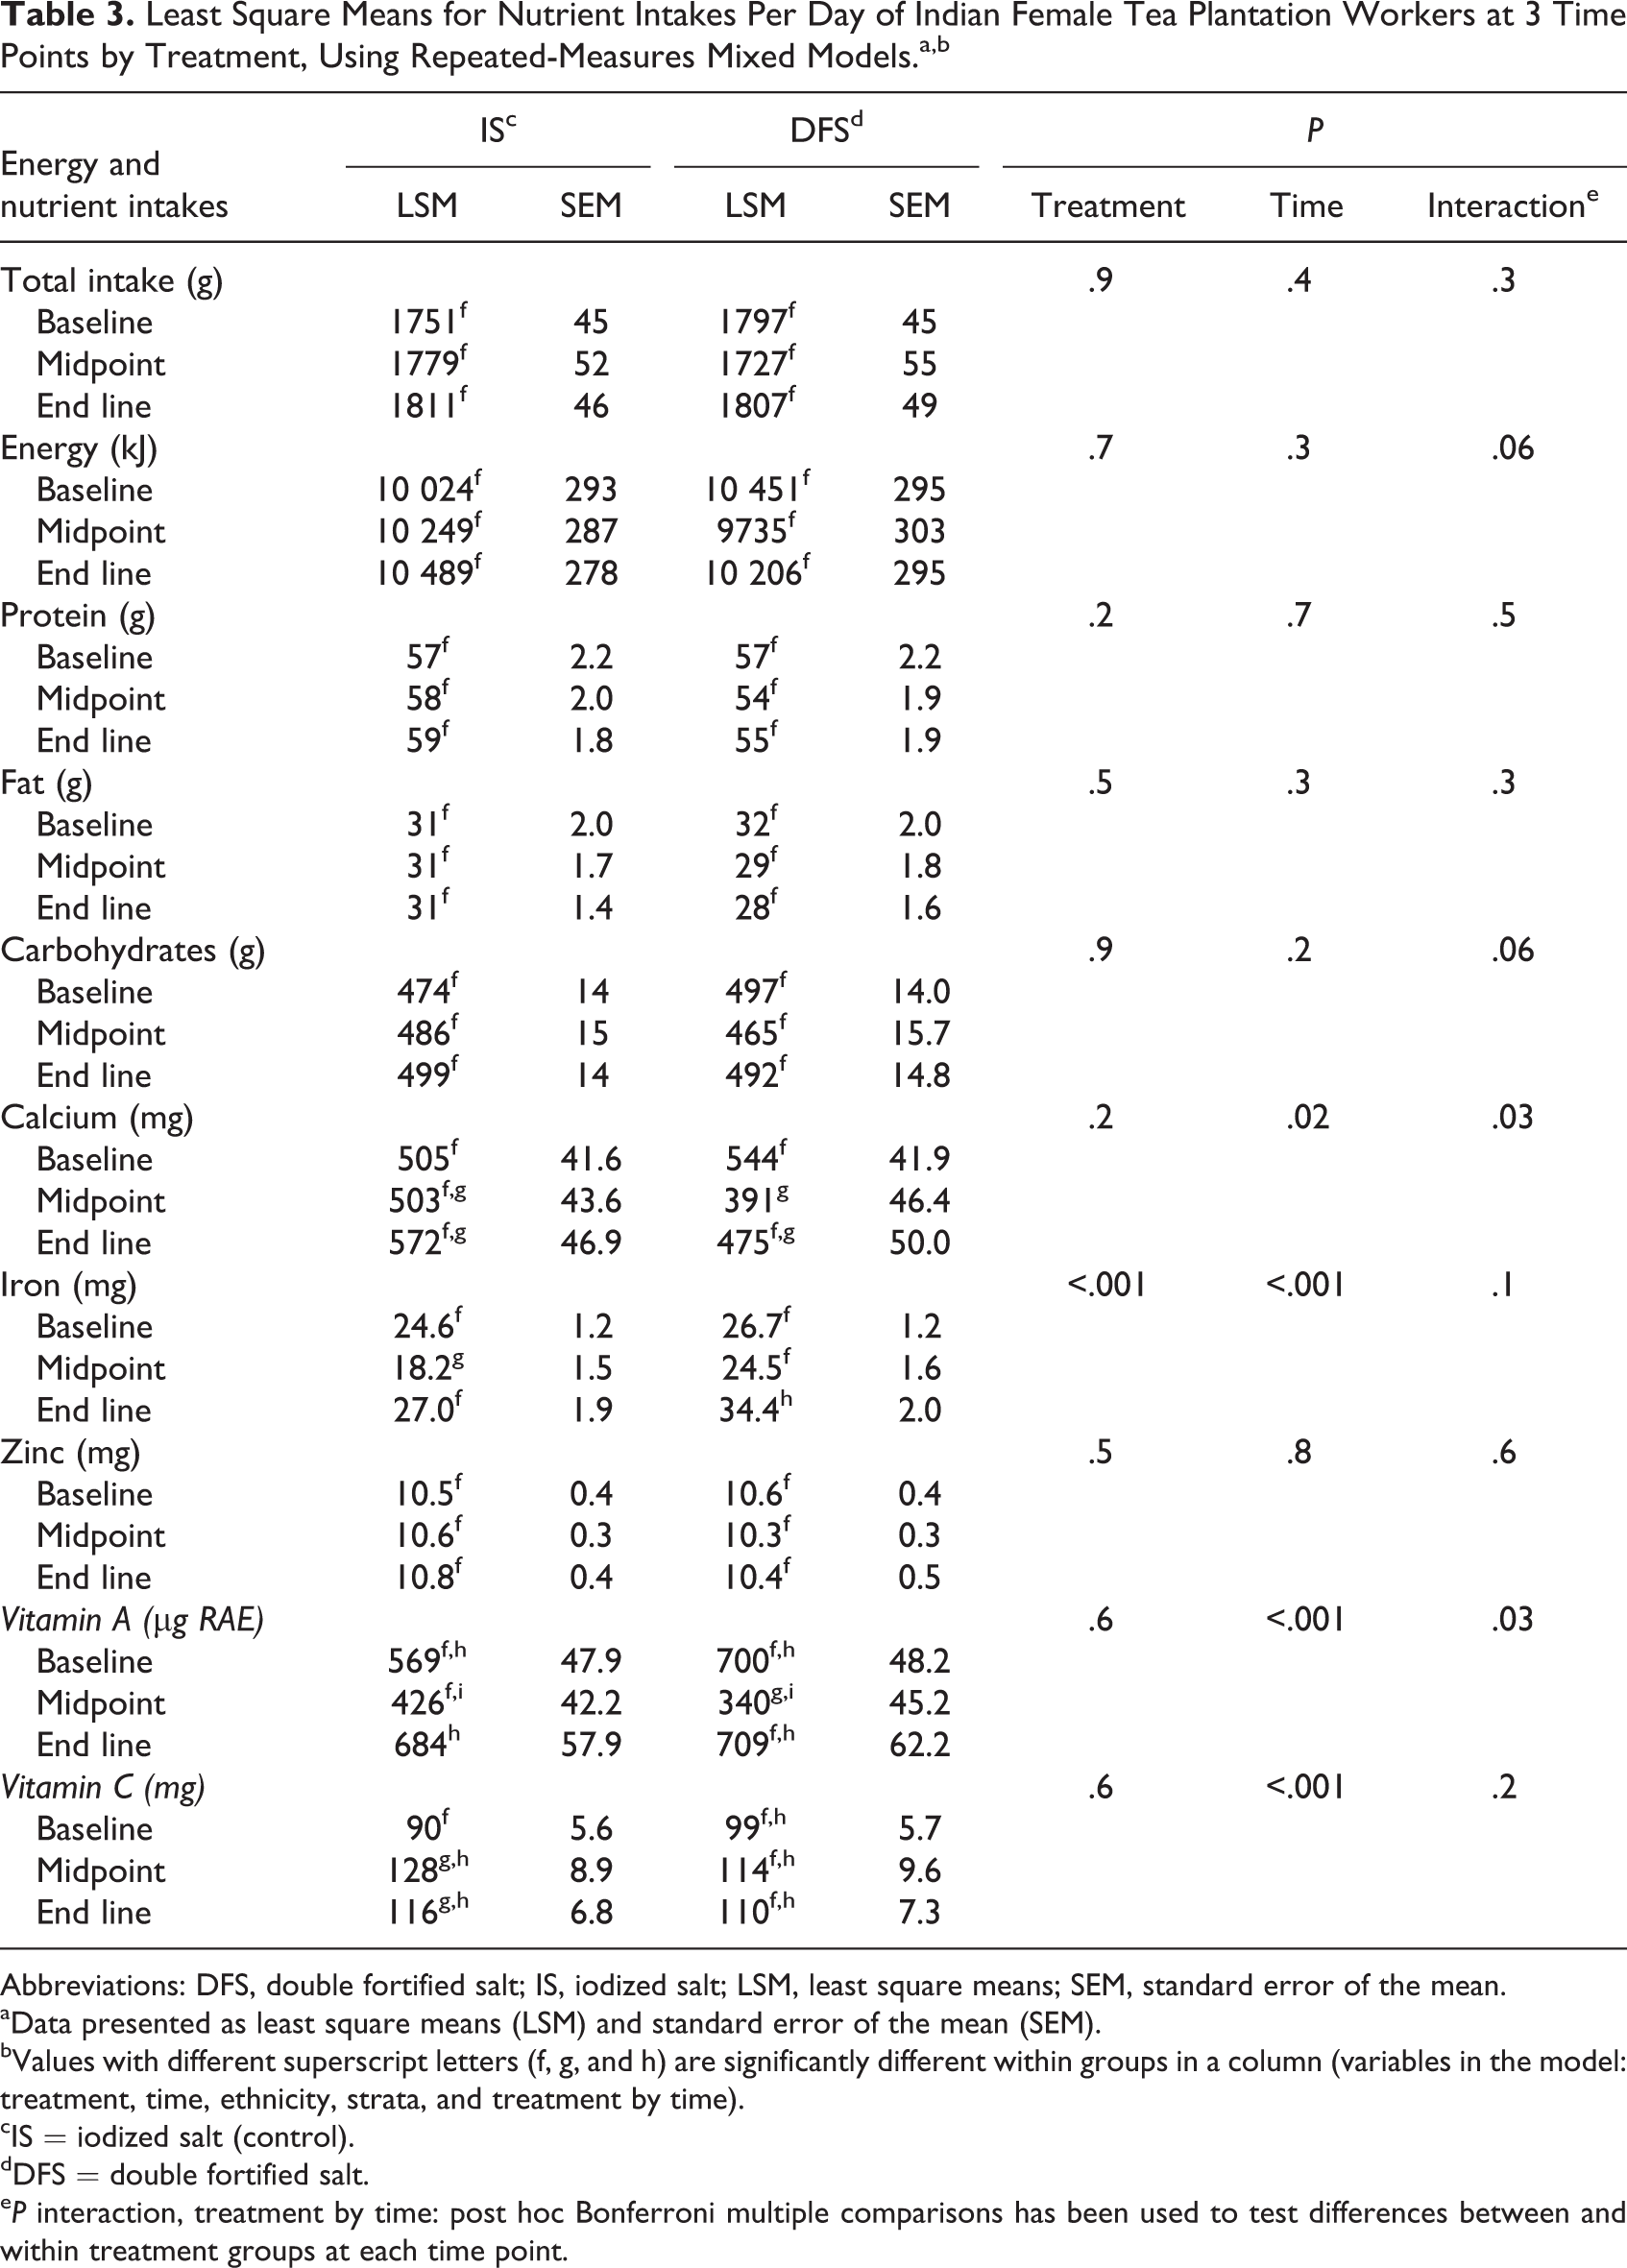
The mixed-effects models for macro- and micronutrient intakes are presented in Table 3. The mixed model analyses for energy and macronutrient intakes did not show significant interaction of treatment by time. Among the micronutrients, a significant treatment effect was observed for iron intake from diet and DFS, with an increase of 7.7 mg/d of iron in the DFS compared to 2.4 mg/d in the control group (P = .05 post Bonferroni correction). Consistent with our findings on dietary iron intakes, the biomarkers of iron status previously published elsewhere reported significant improvements in iron status indicators (adjusted for inflammation) including serum ferritin and transferrin receptors after nine months of intervention. 21 The prevalence of iron depletion based on serum ferritin levels (<20 μg/L) significantly reduced from baseline to end line in the DFS group (45%-22%) compared to the control (44%-35%, P < .05). 21 Similarly, a significant decline in ID based on the transferrin receptors >8.6 mg/L was observed in the DFS (25%-13%, P < .05) compared to the iodized control (19%-16%). 21 The prevalence of median urinary iodine (<100 μg/L) deficiency significantly reduced from baseline to end line in both DFS (43%-28%) and control (44%-31%), P = .05 for both groups. 21 The main source of iodine in this population was from the study salts.
Least Square Means for Nutrient Intakes Per Day of Indian Female Tea Plantation Workers at 3 Time Points by Treatment, Using Repeated-Measures Mixed Models.a,b
Abbreviations: DFS, double fortified salt; IS, iodized salt; LSM, least square means; SEM, standard error of the mean.
aData presented as least square means (LSM) and standard error of the mean (SEM).
bValues with different superscript letters (f, g, and h) are significantly different within groups in a column (variables in the model: treatment, time, ethnicity, strata, and treatment by time).
cIS = iodized salt (control).
dDFS = double fortified salt.
e P interaction, treatment by time: post hoc Bonferroni multiple comparisons has been used to test differences between and within treatment groups at each time point.
Marginal interactions were observed in energy and carbohydrates intake (P-interaction for both = .06). Over time, the energy and carbohydrates intake increased in the control group compared to the DFS group, which declined. The mixed models for calcium and vitamin A intakes also showed a significant association of treatment by time (P = .03 for both) without any significant multiple comparisons. The calcium intake decreased at midpoint in the DFS group compared to the control. Similarly, vitamin A intake decreased at midpoint (during winter) and improved in summer in both the treatment groups.
No significant treatment effect was observed on the frequency of intake of food groups (Table 4). Time had a significant effect on the frequency of intake of major food groups. Over time, there was a change in the frequency of intake of GLVs, vegetables, roots and tubers, vegetables, and fruits in both the treatment groups, suggesting a seasonality effect (Table 4).
Frequency of Intake of Food Groups of Indian Female Tea Plantation Workers, by Treatment at 3 Time Points (#/week).a,b
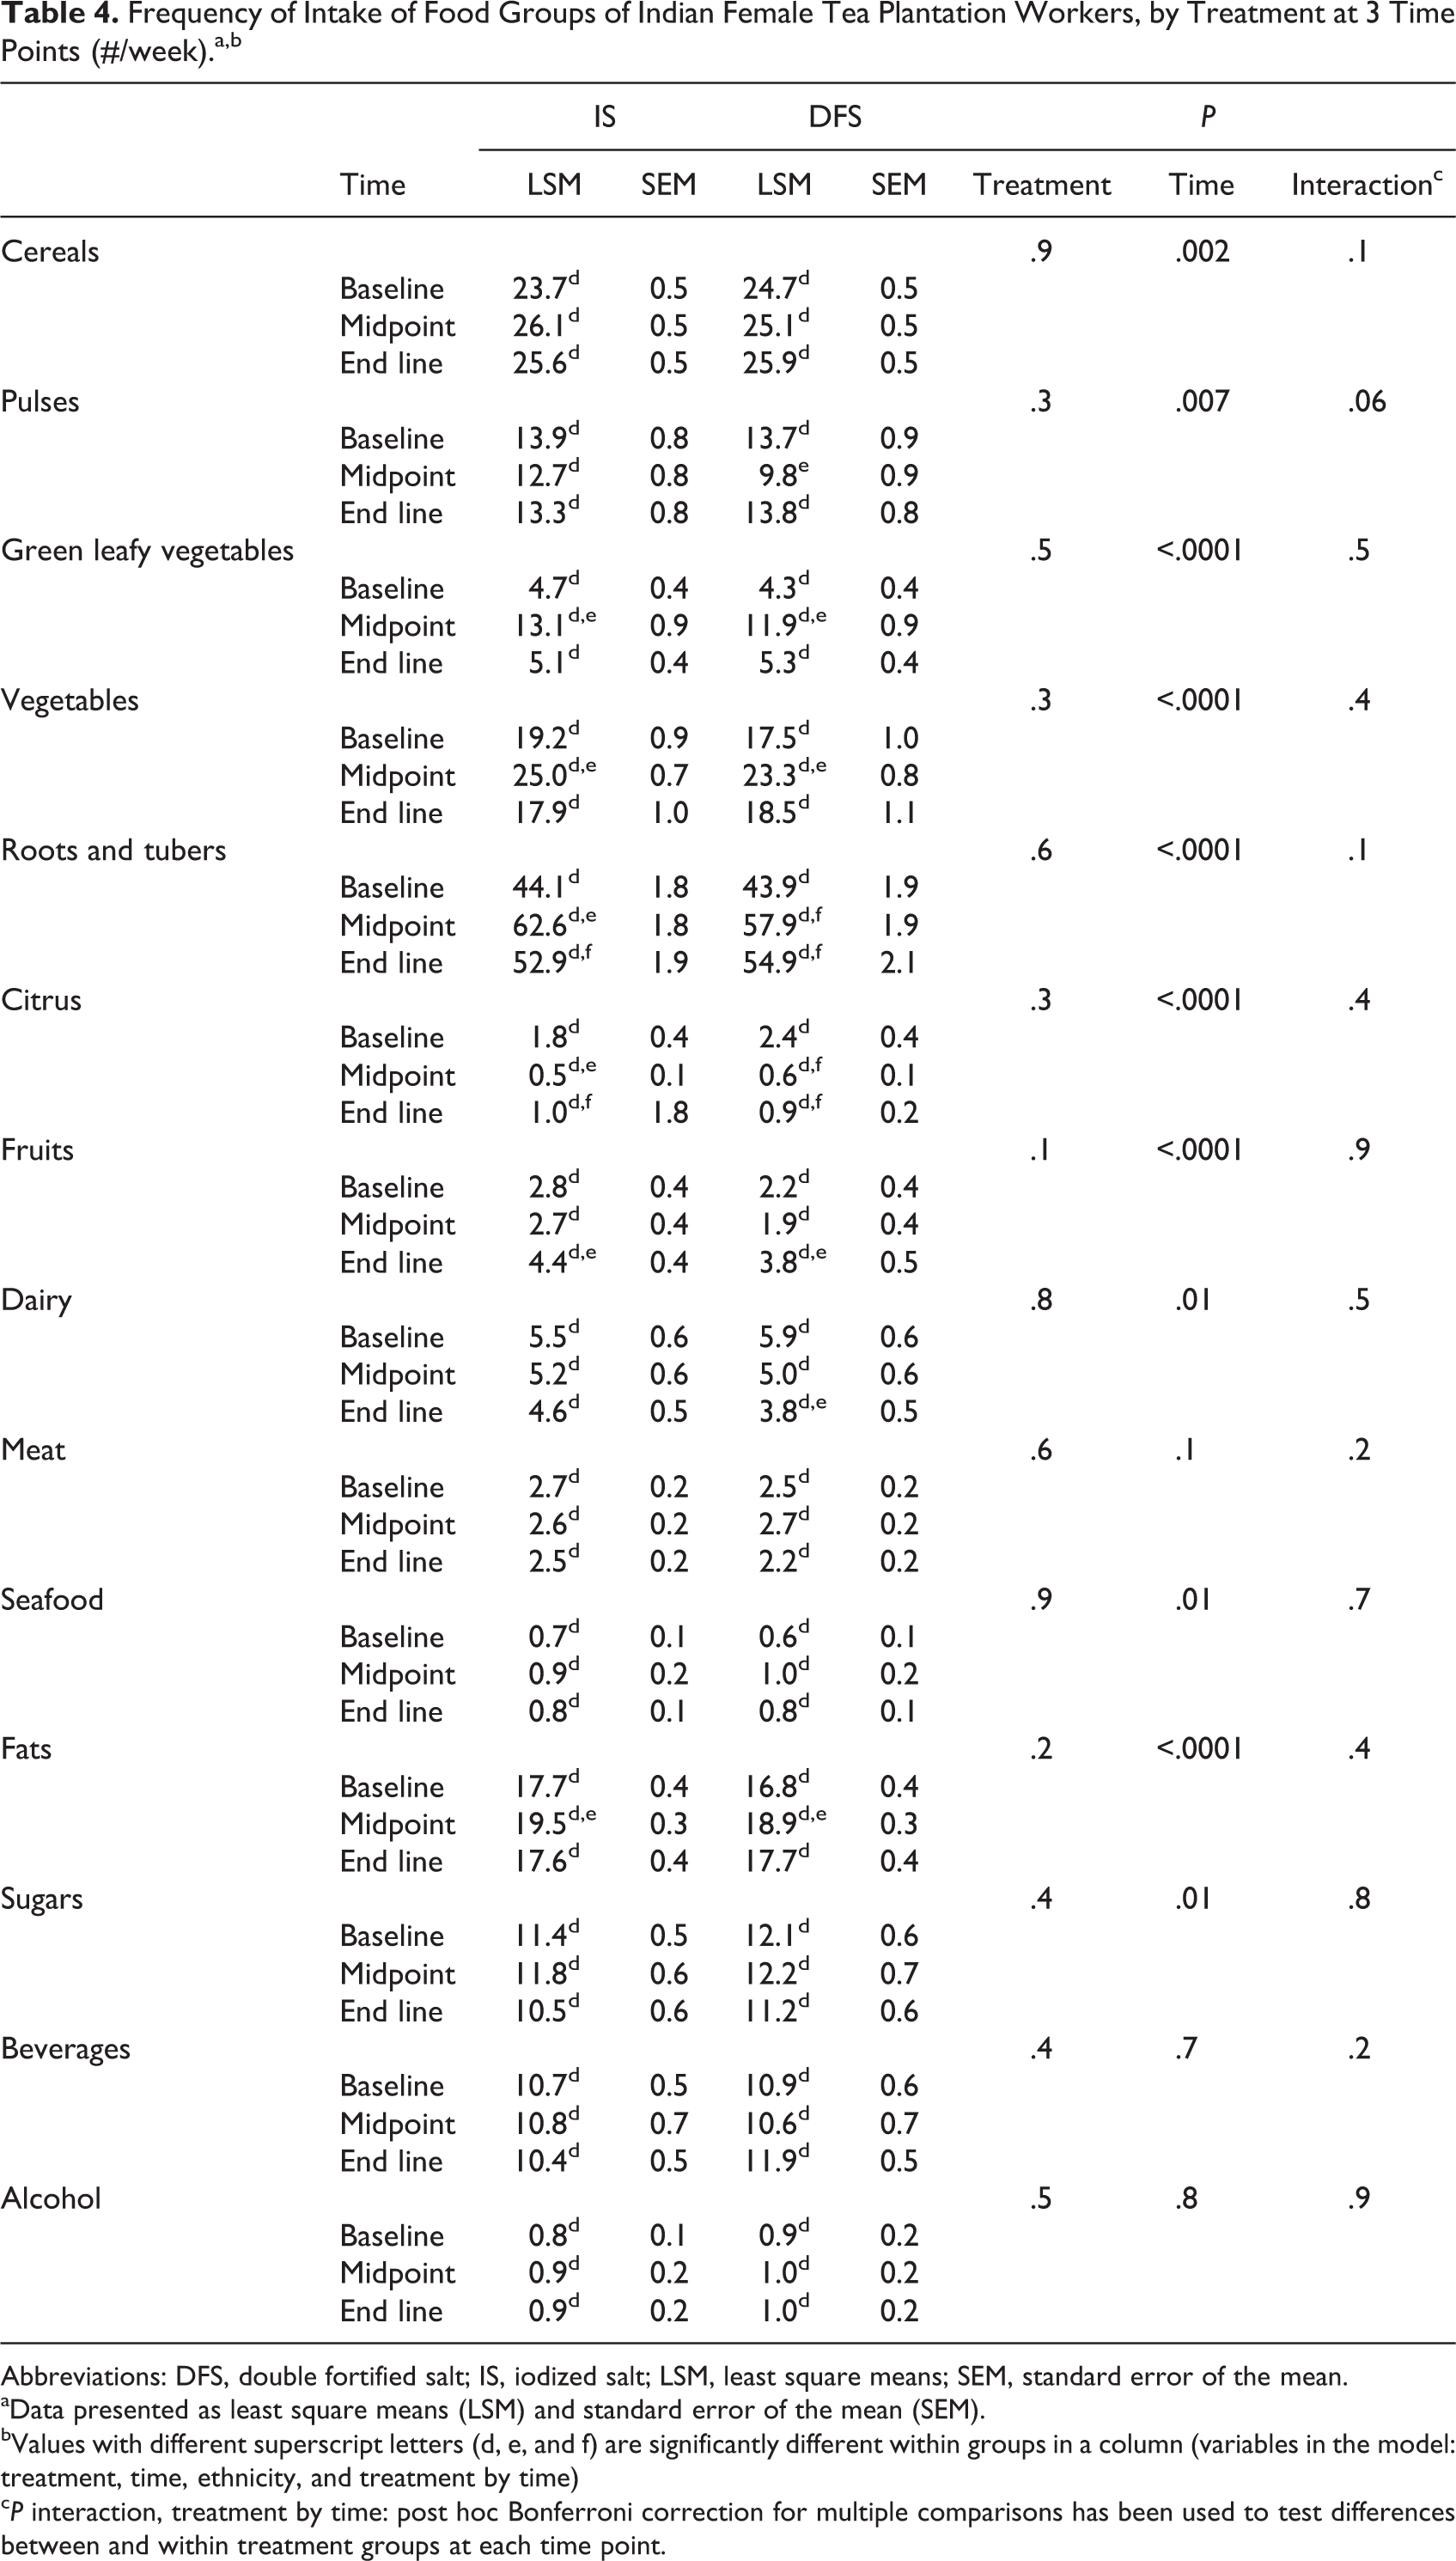
Abbreviations: DFS, double fortified salt; IS, iodized salt; LSM, least square means; SEM, standard error of the mean.
aData presented as least square means (LSM) and standard error of the mean (SEM).
bValues with different superscript letters (d, e, and f) are significantly different within groups in a column (variables in the model: treatment, time, ethnicity, and treatment by time)
c P interaction, treatment by time: post hoc Bonferroni correction for multiple comparisons has been used to test differences between and within treatment groups at each time point.
Anthropometry
Baseline anthropometric measures were similar between the two treatment groups (Table 1). No significant treatment effect was observed on anthropometric measures (Table 5).
Anthropometric Measures of Indian Female Tea Plantation Workers at 3 Time Points, by Treatment.a,b,c
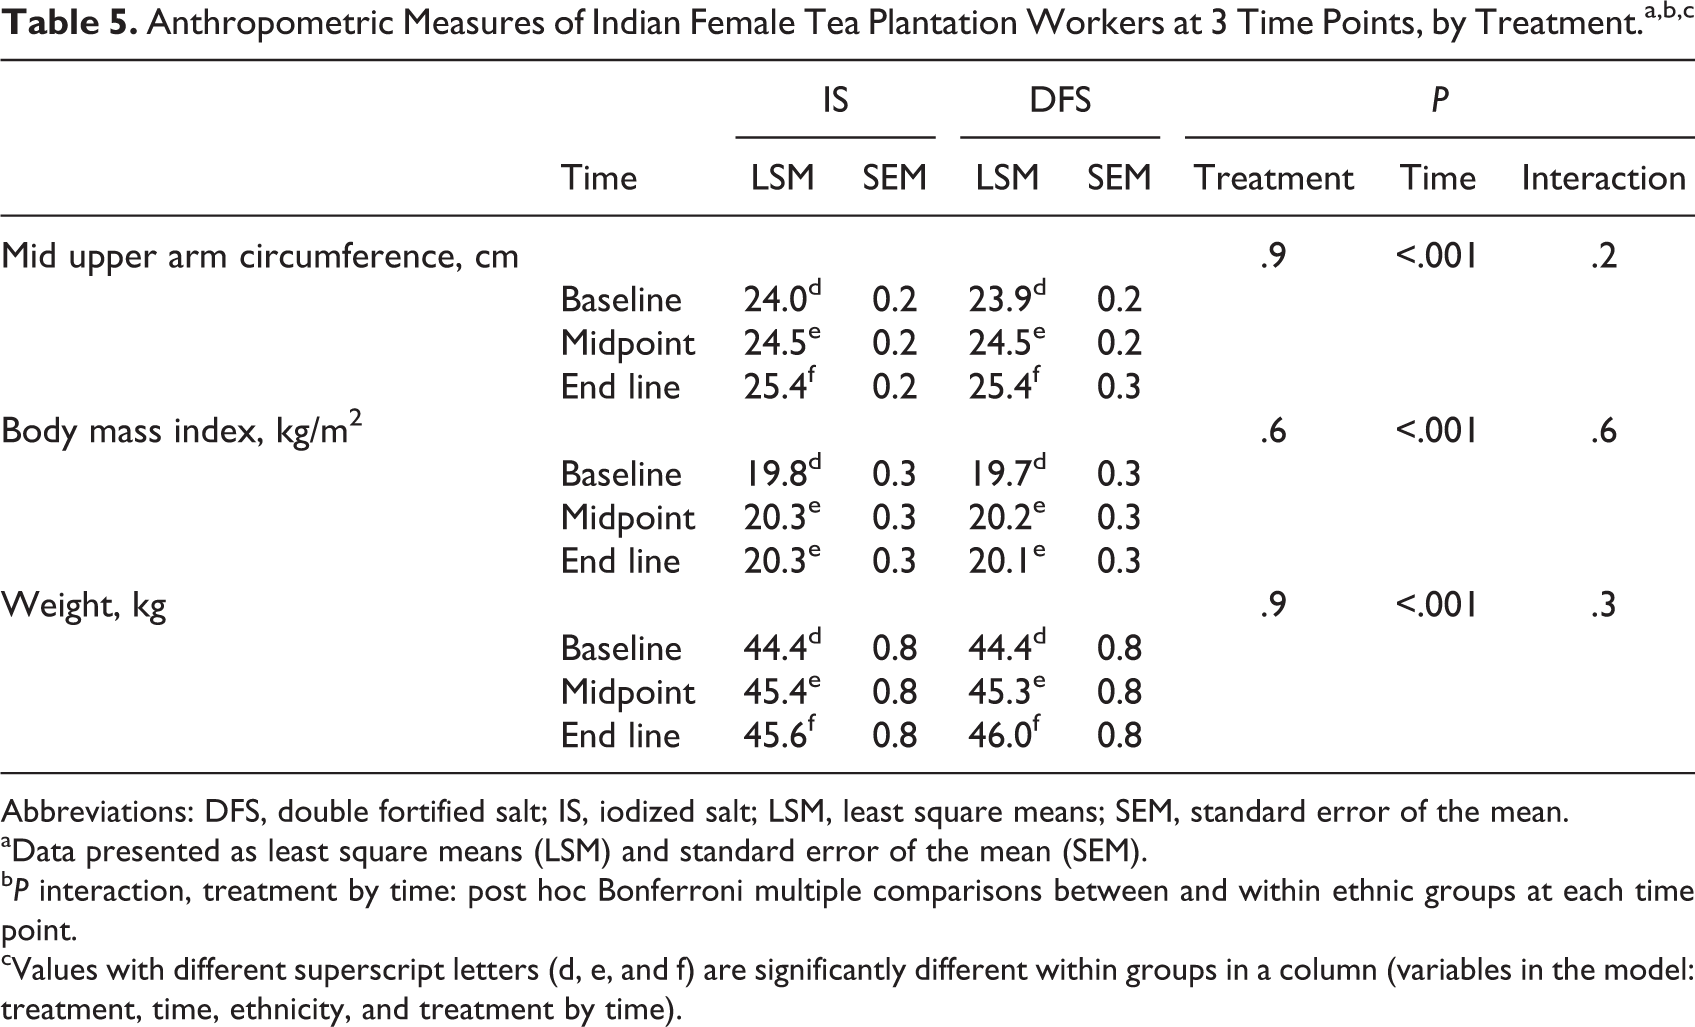
Abbreviations: DFS, double fortified salt; IS, iodized salt; LSM, least square means; SEM, standard error of the mean.
aData presented as least square means (LSM) and standard error of the mean (SEM).
b P interaction, treatment by time: post hoc Bonferroni multiple comparisons between and within ethnic groups at each time point.
cValues with different superscript letters (d, e, and f) are significantly different within groups in a column (variables in the model: treatment, time, ethnicity, and treatment by time).
Ethnicity
A secondary predictor of dietary intakes and nutritional status was the ethnic differences observed between the Adivasi and Nepali women. The frequency of intake of pulses, vegetables, roots and tubers, citrus fruits, other fruits, dairy, meat, and fats was higher and that of beverages was lower in Nepali than Adivasi women (P < .001 for all comparisons except meat where P < .05). The predictive models for total food, energy, protein, fat, carbohydrate, and zinc intake per day showed a significant main association with ethnicity (all at least P < .01). The least square means from the models were all higher among Adivasi compared to the Nepali women except for fat which was higher among the Nepali women. The prevalence of underweight measured by BMI and MUAC was greater in Adivasi (59%) than Nepali (16%; P < .001). There was a greater increase in MUAC over time in Adivasi compared to Nepali women (P-interaction < .001)
Discussion
The DFS intervention significantly improved the dietary iron intake from DFS of female tea plantation workers over the approximately nine months of the study. However, no significant treatment effect was observed on other dietary and anthropometric outcomes.
The marginal trend noted in the opposite direction of the hypothesis, where the energy intake in the treatment group declined compared to the increase in the energy intake in the control group is an important observation in our study. The lack of treatment effect on energy intake in our study is consistent with a worker productivity study from Indonesia. The investigators reported an increase in appetite with iron supplementation, however, an increase in energy intake was not observed. 14 Rice was the main contributor of energy in our study. In a standard Indian diet, grains contribute 70% to 80% of the daily energy intake. 27 In our study, although the women reported anecdotally that they were hungrier, we did not see a difference in intake levels. Economics may have limited our participants’ ability to consume more food at end line. According to tea plantation management, the overall tea production was less at end line compared to baseline. This is important because the plantation workers were paid based on the amount of tea leaves plucked; a lower income during end line could have resulted in fewer financial resources to spend on food and limited their ability to respond to an improved appetite, if it occurred.
We did not observe any differences by the type of diet (vegetarian vs nonvegetarian). Intake of red meat was limited to once or twice a week and was most common on paydays. The iron intake from the Indian diet is predominantly from nonheme sources with a contribution of 90% to 95% of the total daily iron. 27 Heme and nonheme rich foods contributed 0.45 ± 1.59 and 22.04 ± 11.55 mg/100 g food, respectively, in our population. 21 The significant main effect of time observed in iron intake indicates the seasonal effect due to the presence of more varieties of GLVs in summer compared to winter when the midpoint data were collected. Using the Indian RDA, 32 more than 70% of our study participants met the recommended daily intake for iron. However, the biological markers of iron status demonstrated that 45% of our women had depleted iron stores at baseline. 21 The study participants from both treatment groups had a significant increase in iron intake from midpoint to end line. Sharing lunch at the tea garden was a common social phenomenon, which contributed to the increase in iron intake in the control group from foods prepared by coworkers in the DFS group. Food sharing would also result in a dilution of the treatment effect in the DFS group. 21 Consumption of black tea was a common practice in the plantation. The adequate intake of iron does not account for the additional inhibitors of iron absorption such as tannins and phytates that might be a contributor for the high prevalence of ID in this population.
Influence of seasonal availability was a key factor for some of the micronutrient intake. The vitamin A intake depended on the season with a decrease in the intake at midpoint during winter and an increase in the summer months during baseline and end line data collection. The common types of GLV available and consumed in winter were mustard greens and spinach varieties, whereas several wild types of GLV were frequently consumed in the summer. The main sources of vitamin A in summer in the form of β-carotene were GLV, cooked tomatoes, and shared foods at lunch. This is because vegetables and GLV were the main foods that were shared. Both the treatment groups were below the RDA for mean vitamin A. For both calcium and vitamin A, there was a significant decrease in the intake at midpoint which then improved significantly at end line, probably due to seasonal effects and the absence of food sharing at midpoint.
The increase in the frequency of intake of vegetables and GLV in both the treatment groups at midpoint or pruning season is probably due to the increased access to seasonal vegetables from the markets, home garden, and social gatherings such as weddings and other festivals. Similarly, the greater frequency of roots and tubers intake at midpoint in both the treatment groups is due to the seasonality factor. The results from the FFQ seemed to indicate an increase in the consumption of vitamin A in the winter. However, the 24-hour recall contradicted this observation and showed instead a lower intake of vitamin A in the winter months. This discrepancy could be explained by the lower accuracy of the FFQ data, combined with the possibility that participants ate smaller portions more frequently but nevertheless ingesting lower overall quantity.
There were no significant differences in anthropometric measurements of the women in response to the DFS intervention. Most of the iron intervention studies that assessed the anthropometric outcomes were conducted in young children and the results varied considerably. 12,33,34 A possible mechanism on the role of ID on nutritional status outcomes, especially in body weight, could be linked to a reduction in the oxygen carrying capacity and physical work output, inadequate dietary intakes, and infections. 35
The present study had some limitations. The main intervention was powered to show a treatment effect in ferritin levels and not energy and nutrient intakes. An underpowered sample size could possibly have contributed to the lack of treatment effect on energy intake. Post hoc power calculation for energy intake with an effect size of d = .14, α = .05, and a sample size of 206 participants showed that the study was underpowered to detect significant differences between the treatment and control groups (1 − β = 0.18).
Another limitation of the study was related to the lack of sensitive data collection tools. Twenty-four-hour dietary recall can result in intra-individual variability due to dietary underreporting and overreporting. However, direct weighing at lunch and in the home facilitated to mitigate this effect of dietary recall bias. Also, in a rural setting where the availability of market foods is limited and there is poor diet diversity, there may be little opportunity to increase or improve their consumption. 36 The third limitation of the study was related to appetite measurement, which can be difficult to quantify. 12 Though appetite was not a direct aim of the study, one of our objectives was to detect if there was any improvements in the energy and nutrients intake. Measuring food intake is one approach and in this study, we were able to measure the lunch intake directly at three time points. An assessment of the appetite with a scoring system or questionnaire would have provided a subjective measure of appetite by the tea plantation workers.
In this study, only 23% of the participants were clinically iron deficient (ferritin < 12μg/L) and 45% were iron depleted (ferritin < 20μg/L) 21 and would be expected to respond to DFS. The prevalence of vitamin B12 and folate deficiencies in this population was 38% and 85%, respectively. 21 Supplementation of folic acid and vitamin B12 is also associated with an improvement in appetite and food intake. 37 –39 The lack of effect of DFS on dietary intakes may be due to the persistence of vitamin B12 and folate deficiencies in these women. Given the high intake of cereals and legumes in this population, lack of dietary assessment of phytate intake is another important limiting factor.
Ethnicity was an important secondary predictor of dietary intakes and anthropometric outcomes. This indicates that although ID is a cause of concern, there are also other limiting factors, including ethnic differences, inadequate food choices, and other micronutrient deficiencies. It is important for future interventions to account for these factors in order to implement comprehensive health and nutrition programs aimed at improving the health status of women from resource-limited settings.
In summary, the intervention was successful in increasing the dietary iron but not energy and nutrient intakes in women who consumed DFS. The intervention did not improve the anthropometric indicators of the tea plantation workers. This study is unique in reporting the longitudinal observation of food and nutrient intakes in women who received DFS. These findings demonstrate that dual fortification of salt is an effective strategy to improve the iron intake and iron status 21 of the rural Indian population but we were unable to show a change in the dietary intake of other nutrients from the home diet.
Footnotes
Acknowledgments
The authors would like to thank the study participants, field staff, community health workers, and the Panighata tea estate management. The authors thank Dr Annie Wesley and Dr Anand Lakshman from Micronutrient Initiative for valuable assistance in the field implementation of the study. The authors also thank Ms Pasang Lhamu Bhutia (North Bengal Unit) and Mr Nikhil Naskar (Kolkata) from the Child in Need Institute, for providing the logistics support. Thanks to Ms Rula Al-Soueida for her technical expertise in developing the food composition database. The authors also thank Dr Roger Cue and Ms Francoise Vermeylen for their assistance in statistical data analysis.
Declaration of Conflicting Interests
The author(s) declared no potential conflicts of interest with respect to the research, authorship, and/or publication of this article.
Funding
The author(s) disclosed receipt of the following financial support for the research, authorship, and/or publication of this article: The study was carried out with financial support from Micronutrient Initiative, Ottawa, Ontario, Canada and the Mathile Institute for the Advancement of Human Nutrition, Dayton, Ohio, USA.