
Abstract
Background:
Reference intakes for iron are derived from physiological requirements, with an assumed value for dietary iron absorption. A new approach to estimate iron bioavailability, calculated from iron intake, status, and requirements was used to set European dietary reference values, but the values obtained cannot be used for low- and middle-income countries where diets are very different.
Objective:
We aimed to test the feasibility of using the model developed from United Kingdom and Irish data to derive a value for dietary iron bioavailability in an African country, using data collected from women of child-bearing age in Benin. We also compared the effect of using estimates of iron losses made in the 1960s with more recent data for whole body iron losses.
Methods:
Dietary iron intake and serum ferritin (SF), together with physiological requirements of iron, were entered into the predictive model to estimate percentage iron absorption from the diet at different levels of iron status.
Results:
The results obtained from the 2 different methods for calculating physiological iron requirements were similar, except at low SF concentrations. At a SF value of 30 µg/L predicted iron absorption from the African maize-based diet was 6%, compared with 18% from a Western diet, and it remained low until the SF fell below 25 µg/L.
Conclusions:
We used the model to estimate percentage dietary iron absorption in 30 Beninese women. The predicted values agreed with results from earlier single meal isotope studies; therefore, we conclude that the model has potential for estimating dietary iron bioavailability in men and nonpregnant women consuming different diets in other countries.
Introduction
Nutrient reference intakes, known in Europe as dietary reference values (DRVs) and in the United States as dietary reference intakes, are needed to assess the adequacy of nutrient intakes of populations in order to avoid health problems associated with deficiency and excessive intakes, and, where appropriate, to reduce the risk of chronic disease. Reference intakes are used by risk managers for a wide range of other activities, such as planning diets, formulating complementary foods, setting levels of food fortification, implementing biofortification programs, and food labeling. Dietary reference values are derived using published data describing the relationship between dietary intakes and selected health end points. Appropriate sources of evidence include metabolic studies, clinical trials, and, in some instances, epidemiological data. However, in the case of iron, there are no end points on which to base DRVs because dietary intake data cannot be used to predict absorbed iron due to wide variations in bioavailability. Therefore, the approach taken is to derive physiological requirements by the factorial method and apply a bioavailability factor to convert into dietary intakes. However, there is considerable uncertainty surrounding the selection of an appropriate bioavailability value. 1
Dietary iron bioavailability depends firstly on the availability of iron for absorption in the GI tract, determined by the physicochemical form of iron in the lumen of the GI tract, largely dictated by the composition of meals, and secondly by an individual’s absorptive efficiency. The latter is a function of physiological requirements for iron and homeostatic mechanisms designed to maintain null balance. Traditionally, bioavailability factors have been derived from predictive algorithms, based on the intake of enhancers and inhibitors of iron absorption, and results from isotopically labeled single meal absorption studies. Estimates of dietary iron bioavailability for 3 different categories of diet that relate to the amount of meat and iron absorption enhancers and inhibitors (5%, 10%, and 15%) were first introduced by Food and Agriculture Organization (FAO)/World Health Organization (WHO) 2 and were subsequently updated to include a category of 12%. 3 The European Food Safety Authority (EFSA) used values derived from a new approach developed by Dainty et al 4 (updated by Fairweather-Tait et al 5 ) to set DRVs for iron in adults. 6 Equivalent values for dietary iron bioavailability are urgently required for low- and middle-income countries, and it is hoped that these can be used to refine the requirements for iron on a more global basis.
Methods
Data for dietary iron intake, serum ferritin (SF), and C-reactive protein (CRP) concentrations, as well as anthropometric indices were used from the first phase of a follow-up iron absorption study in women of child-bearing age in Benin conducted between June and October 2017. For the follow-up, previous participants of 3 original studies on iron absorption from single cereal-based test meals in Beninese women of child-bearing age conducted from 2009 to 2012 7 -9 were recontacted on their originally stated phone numbers or orally via the recontacted participants. Former participants were invited to come to the district hospitals of Abomey-Calavi (southern Benin) or Natitingou, as well as the health centers in Toukountouna and Parakou (northern Benin) for venous blood sampling every 2 months, and a 3-day home visit for the dietary assessment.
The dietary assessment comprised a 3-day weighed food record to determine dietary energy and nutrient intakes of participants. Whenever possible, the 3-day weighed food records included 2 consecutive weekdays and one weekend day. Trained, local field workers familiar with the local languages and culture carefully recorded quantity and recipe of any food or drink consumed by the participant between 7.00 hours and the time when the study participant has eaten her last main meal (usually between 19.00 and 21.00 hours). Food portions were weighed using an electronic scale (Soehnle, Leifheit AG, Nassau, Germany; accurate to 5 g/500g with a maximum of 5 kg) and recorded. For foods consumed when field assistants were not present (eg, during the night), portions were served and weighed under presence of the field assistant whenever possible and remaining leftovers were weighed the next morning and subtracted from the initial portion. If no portion preparation has occurred, recall using household measures was applied. Recipes for unassisted food preparation that was consumed outside the household, such as food bought from street food sellers or offered by neighbors, were recorded based on recalls and common recipes. Unknown quantities in unassisted food preparations were estimated using average recipes. In order to avoid altering the eating behavior during the visits, participants were explicitly asked to maintain their usual food pattern and their traditional cooking habits.
Food consumption data were later converted to nutrient intakes on behalf of the West African Food Composition Table, 10 the Food Composition Table for Mali, 11 and food composition data directly measured in the frame of former studies and student projects in the ETH (Swiss Federal Institute of Technology) laboratory 12 and the laboratory of human nutrition of Abomey-Calavi University. 13 The nutrition software Nutrisurvey 14 was used for conversions. Mean intakes were calculated using Microsoft Excel 2016 (Microsoft Corporation, Redmond, Washington).
Trained staff collected the venous blood samples (∼8 mL) and recorded body weight and body height. Body weight was measured with a common digital body scale with a capacity of 150 kg and a precision of 100 g. In northern Benin, body height was measured with a stadiometer to the nearest 1 cm, and in southern Benin, it was copied from the participant’s official ID card after double-checking with a measuring tape affixed to the wall. Body mass index was calculated by dividing the mean weight of the 3 visits in June, August, and October 2017 by the mean height of the 3 visits.
For iron status determination, serum was separated the day of blood collection in June, August, and October 2017 and stored at −20°C until analysis. Serum ferritin and CRP were measured with an enzyme-linked immunoabsorbent assay technique. 15 Serum ferritin values from participants with CRP >5 mg/L at a single time point were excluded from the calculation of mean SF concentrations across time points due to underlying inflammation. 16,17
For women of child-bearing age who participated in the study on iron absorption from pearl millet-based test meals (n = 13), 8 isotopically determined fractional iron absorption data assessed during the original study were used for validation of our model. Isotopically labeled pearl millet test meals (Pennisetum glaucum; regular millet extrinsically labeled with 57Fe, iron-biofortified millet extrinsically labeled with 58Fe, and postharvest iron-fortified millet extrinsically labeled with 54Fe) were administered in a series of 10 servings given twice per day (in the morning and at noon) from Wednesday to Sunday for 3 consecutive weeks in July 2012. The serving in the morning, between 06.30 and 09.30 hours and after an overnight fast, was accompanied by a traditional leafy vegetable sauce, and the second serving was administered at least 3 hours later, accompanied by a traditional okra sauce. The participants consumed all of the test meals in the presence of the investigators and were not allowed to eat or drink between the test meals or for 3 hours after the second meal. The shift in the isotopic ratios after a 14-day incorporation period was measured using multicollector inductively coupled plasma-mass spectrometry, and fractional iron absorption was calculated as described by Walczyk et al. 17
The distribution of iron requirements for the sample of Beninese women was generated from calculated physiological requirements, according to 2 different methods: (1) using the IOM (Institute of Medicine) distribution of dietary intake requirements with values interpolated to derive iron absorption requirements for each 0.5th percentile, 18 and (2) using an additional set of physiological iron requirements calculated from the more recent publication of Hunt et al. 19 This study measured whole body iron excretion, which is equivalent to requirements for iron absorbed from the diet. On this basis, values were interpolated to derive iron absorption requirements for each 0.5th percentile for data on premenopausal women only.
Ethics
All original stable isotope studies on iron absorption from single cereal-based test meals in Beninese women of child-bearing age were approved by the ethical review committee at the Ministry of Health in Benin. Studies in northern Benin were further approved by the ethical review committee at ETH Zürich (Switzerland) and the study in southern Benin by the medical ethical committee of the University of Wageningen (the Netherlands). The follow-up study assessing dietary iron intake, SF, and CRP was approved by the ethical committee of the Institute of Biomedical Sciences at the Ministry of Higher Education and Scientific Research in Benin and the ethical review committee at ETH Zürich (Switzerland) as a new study.
Written informed consent was obtained from all women before the original stable isotope studies on iron absorption from single cereal-based test meals and the follow-up study.
Statistical Analysis
The method to calculate iron absorption from SF measurements has been described in previous publications. 4,5 Briefly, iron absorption was estimated from the measured iron intakes along a scale of assumed iron absorption values (1%-40%). Requirements for absorbed iron were predicted using the IOM’s distribution of dietary intake requirements 18 and from the data derived from Hunt et al 19 with values interpolated to derive iron absorption requirements for each 0.5th percentile. These values were compared to each individual’s absorbed iron estimate at each point on the 1% to 40% scale, and the average absorption for the population was calculated. Subtracting these values from 100 gave the estimated percentage of the population who require a higher iron absorption to meet their requirements (ie, the estimated prevalence of inadequate iron intakes). A model was created for the prediction of dietary iron absorption at each level of SF concentration using the assumption that the estimated prevalence of inadequate intakes would be equivalent to the observed prevalence of iron insufficiency, as defined by SF concentrations.
Statistical tests (t tests) were used to examine differences between the IOM and Hunt methods and between Western and African diets. Results were considered significant if P < .05.
Results
A total of 63 Beninese women of child-bearing age participated in the 3 original studies on iron absorption from single cereal-based test meals. Follow-up data were available for 33 women, but 3 women had to be excluded from analyses due to missing SF and CRP values (n = 2) or having reached postmenopausal state (n = 1). Participant characteristics and dietary data are given in Table 1.
Characteristics of Women.a
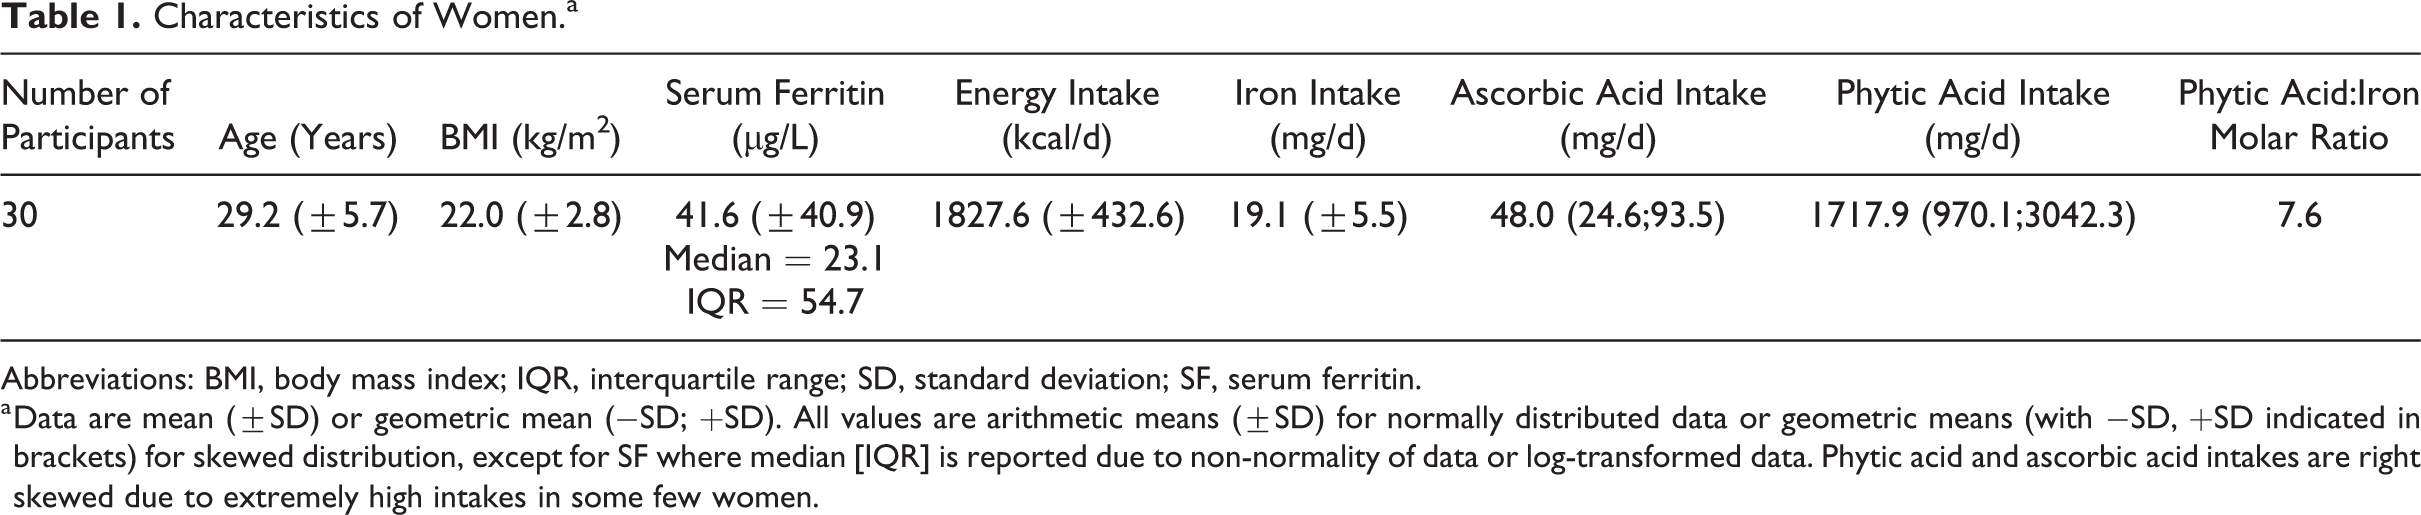
Abbreviations: BMI, body mass index; IQR, interquartile range; SD, standard deviation; SF, serum ferritin.
a Data are mean (±SD) or geometric mean (−SD; +SD). All values are arithmetic means (±SD) for normally distributed data or geometric means (with −SD, +SD indicated in brackets) for skewed distribution, except for SF where median [IQR] is reported due to non-normality of data or log-transformed data. Phytic acid and ascorbic acid intakes are right skewed due to extremely high intakes in some few women.
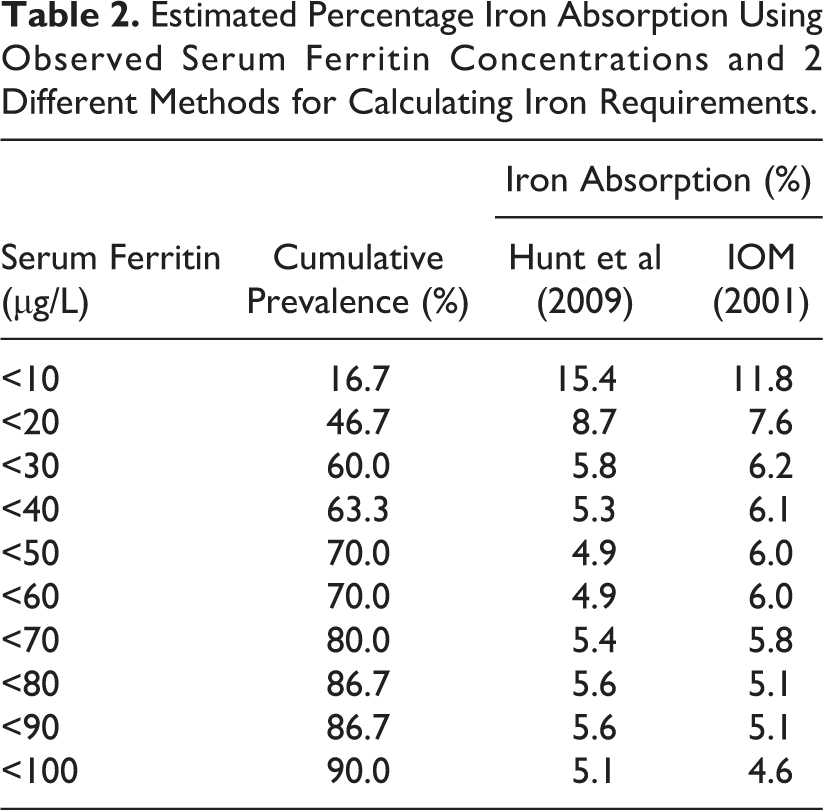
As shown in Figure 1 and Table 2, the results obtained from the 2 different methods for calculating physiological iron requirements 18,19 were similar, except at low SF concentrations. At a SF of 30 µg/L, iron absorption from the African maize-based diet was 6%, compared with 18% from a Western diet, and it remained low until the SF fell below 25 µg/L. Examining the Western diet data, there was no statistical difference (P = .132) between the estimated iron absorption for the Hunt et al 19 and the IOM 18 data. This was also the case for the African diet (P = .604). In contrast, iron absorption from the Western versus the African diet was significantly different for both the Hunt et al 19 (P = .004) and the IOM 18 data (P < .001).
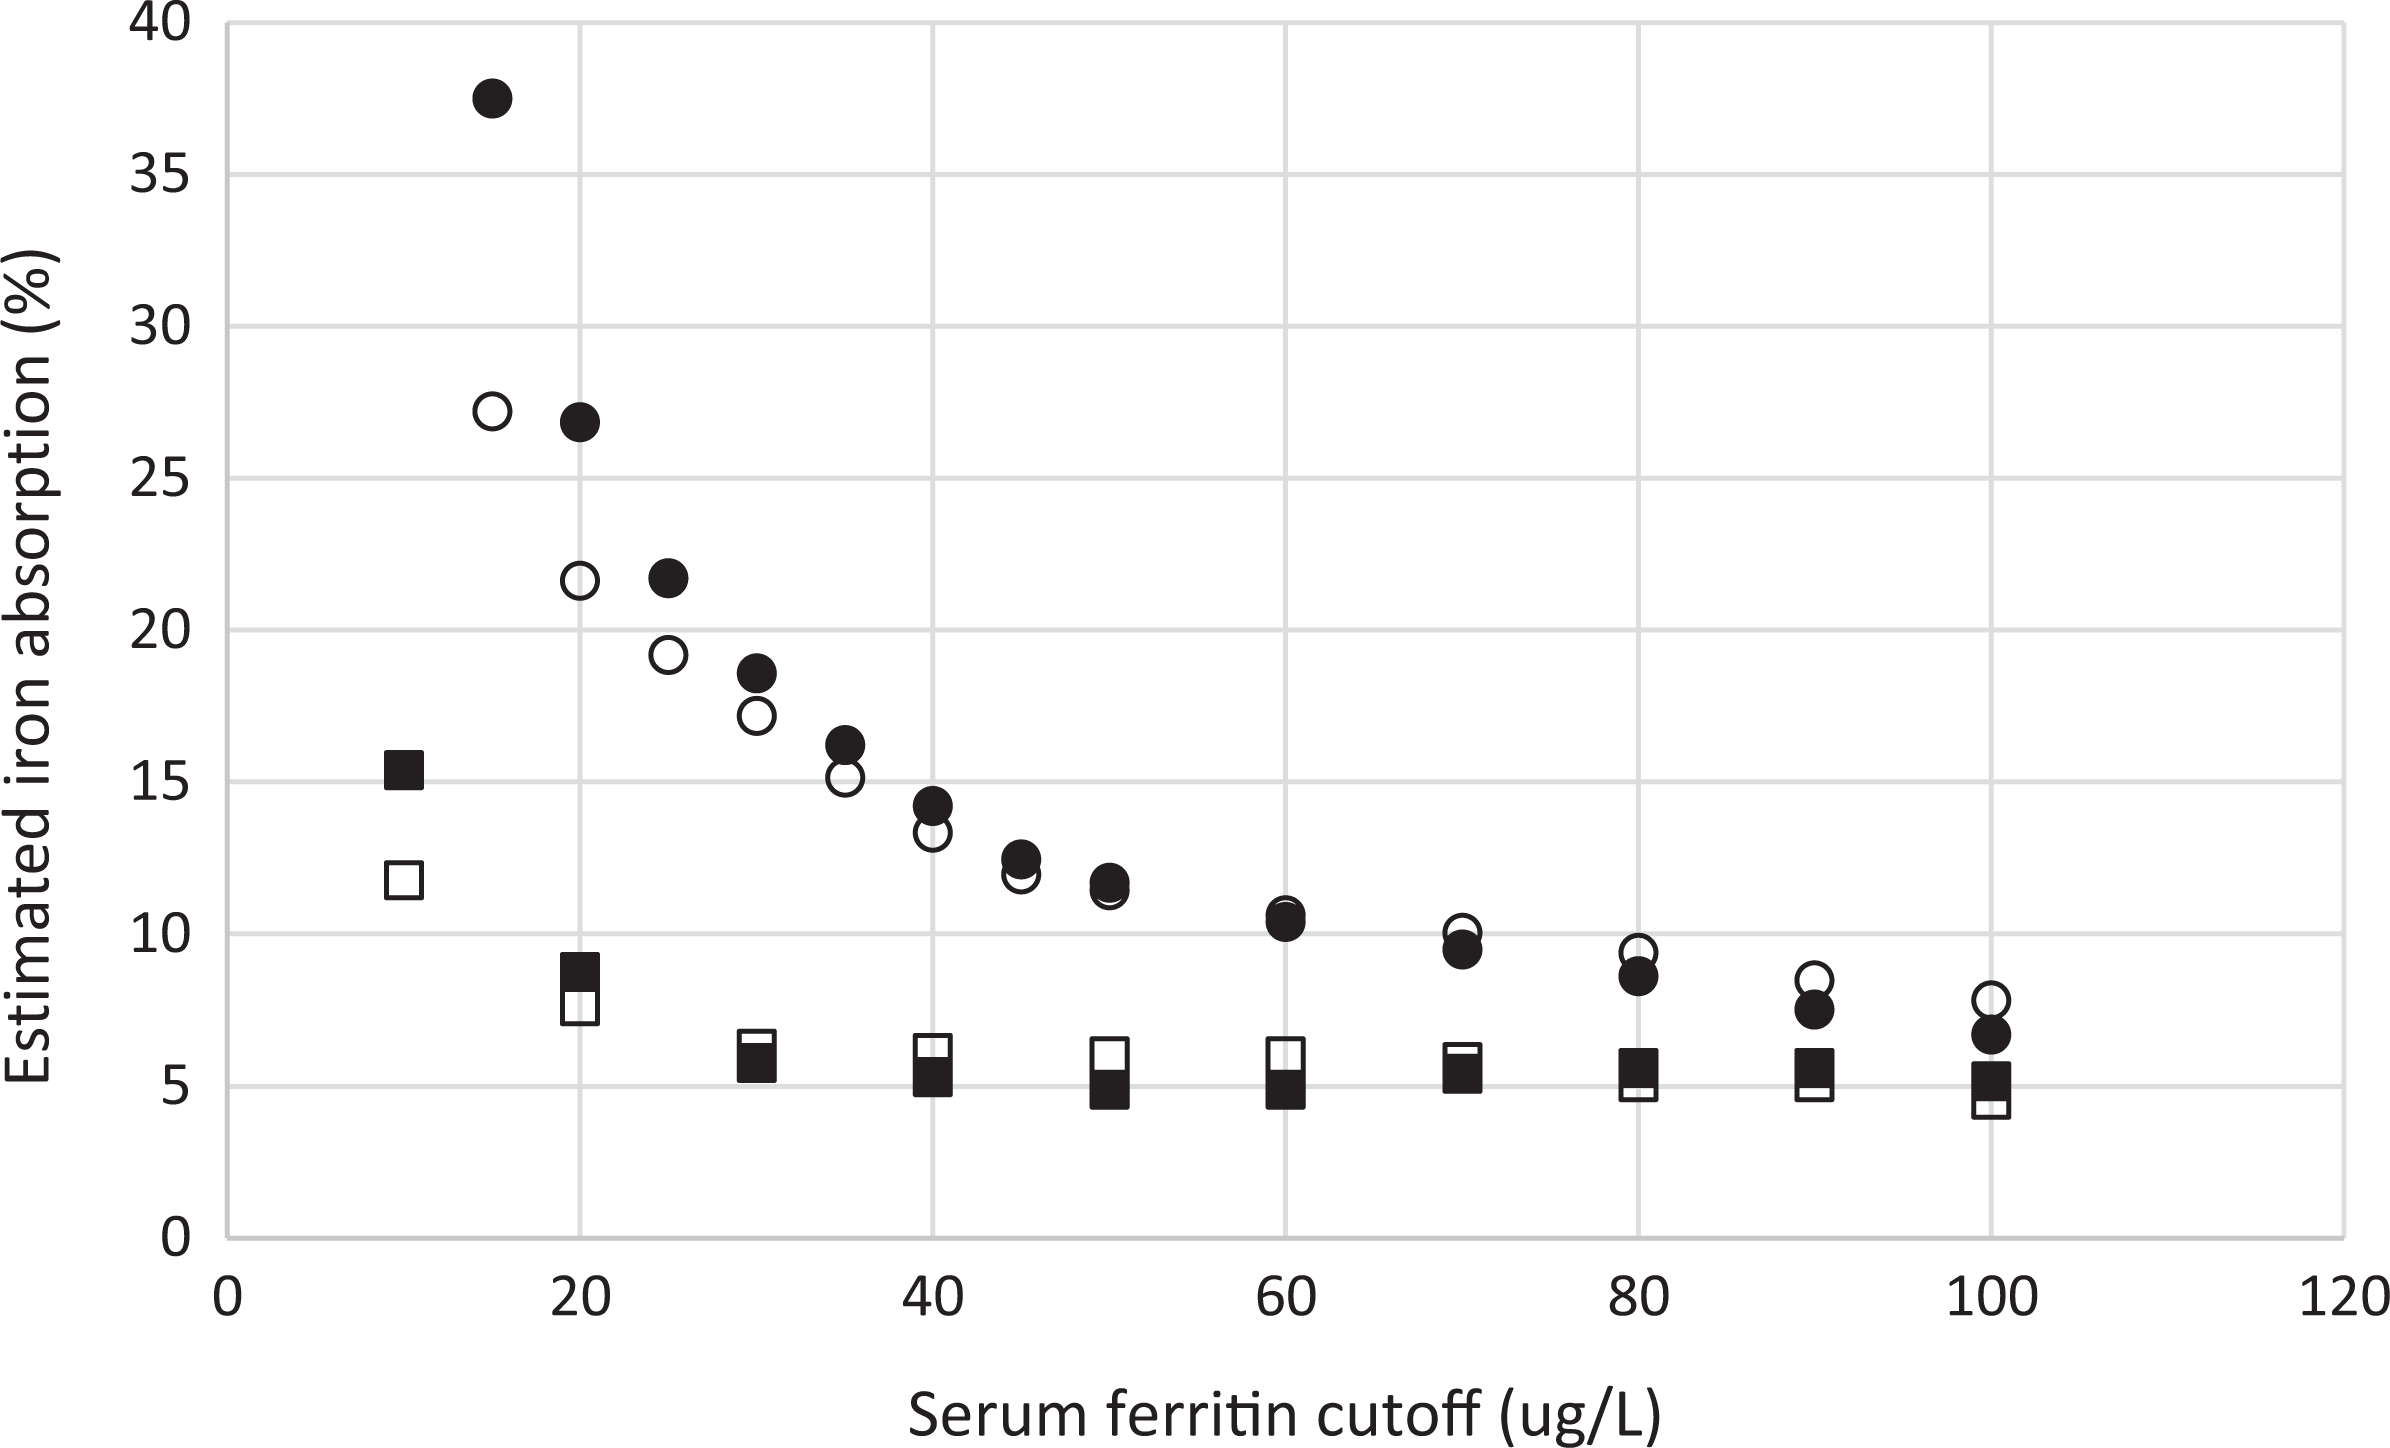
Comparison of percentage iron absorption from African and Western diets. • data from Western diet using Hunt et al (2009); ▪ data from African diet using Hunt et al (2009); ˆ data from Western diet using IOM (2001); and □ data from African diet using IOM (2001).
Estimated Percentage Iron Absorption Using Observed Serum Ferritin Concentrations and 2 Different Methods for Calculating Iron Requirements.
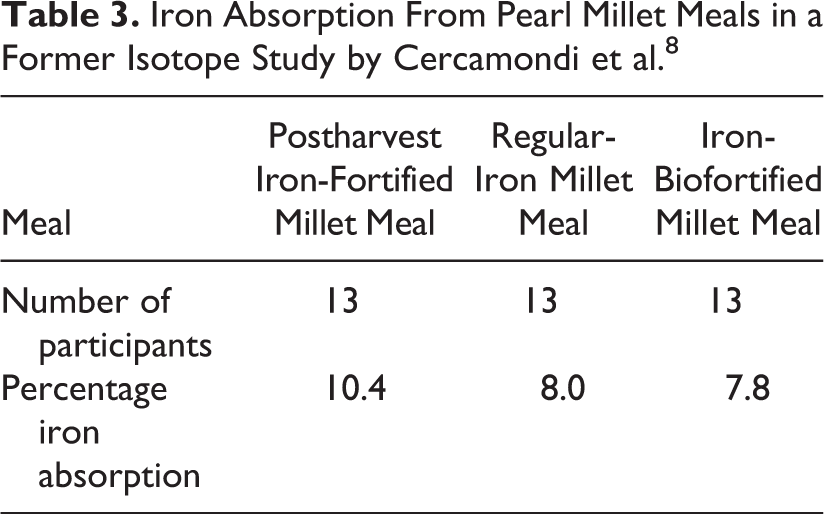
Fractional iron absorption assessed in a multiple meal stable iron isotope study from 3 pearl millet meals in one of the original studies 8 is shown in Table 3. Mean fractional iron absorption was 10.4% from the postharvest iron-fortified millet meal, 8.0% from the nonfortified millet meal, and 7.8% from the iron-biofortified millet meal.
Iron Absorption From Pearl Millet Meals in a Former Isotope Study by Cercamondi et al. 8
Discussion
The Beninese diet is characterized by a high cereal intake (50% of energy intake) and a reasonably high intake of animal products (13% of energy intake), mainly originating from consumption of Benin’s famous cheese (fromage peulh). Pulses and fats are other important energy contributors (10% each). Solid mash or porridge of maize flour (often fermented) consumed with various sauces, for example, okra, green leafy vegetables, tomatoes, or peanuts are the base of Beninese diet. Another important staple is watché, a mixture of rice and cowpeas, and mashed yam eaten with sauce. Fruit consumption is low, but there are higher intakes during the mango season in April to June. 20 Our dietary assessment was not conducted during the mango season; therefore, fruit intake only contributed 1% to dietary energy intake. Cereals and animal products contributed equally to our participants’ iron intake (29% and 30%, respectively), while the remaining iron was mostly delivered by pulses (20%) and vegetables (16%). When there are major seasonal changes to the diet, data on iron intake and SF should be collected at the end of each season and percentage absorption estimated using the model. An average of all seasons will indicate dietary iron bioavailability on an annual basis. Socioeconomic level can be a determinant of changes to the diet and therefore should also be taken into account.
In the present study, the mean dietary iron intake of the group of Beninese women was 19.1 (±5.5) mg/d which is more than twice that of the average requirement (AR) for women of child-bearing age derived by the IOM, 8 mg/d, and EFSA, 7 mg/d. However, the IOM and EFSA values are based on an estimated dietary iron absorption of 18% (in the case of the EFSA value, this assumes a mean SF of 30 µg/L), and absorption from the African diet will be much lower, mainly because of the high phytate content. 21 According to the calculations from our predictive model, dietary absorption is 6% from the Beninese diet when SF is 30 µg/L. This is one-third of the value we predicted from a Western diet, and therefore, the intake in Benin should be 3 times higher to compensate. In fact, the Beninese iron intakes approach this value. However, the mean SF concentration, 41.6 (±40.9) µg/L (median [interquartile range, IQR] = 23.1(54.7) µg/L), after exclusion of SF concentrations from individuals with raised CRP concentrations (CRP > 5 mg/L), is higher in our population than the assumed 30 µg/L. Nevertheless, the range is large: 6.3 µg/L to 167.4 µg/L, as is the standard deviation. When examining the data more closely, the unexpectedly high mean SF concentration in our population is mainly due to 3 participants presenting with SF concentrations >100 µg/L. Serum ferritin concentrations >100 µg/L were already reported for 2 of them in the original studies, while the third participant’s SF concentrations reached a level >100 µg/L due to a doubling of SF concentration in the 8 years between the original study and our follow-up (original value: 50.3 µg/L). Excluding the 3 participants with SF concentrations >100 µg/L brings the mean SF concentration down to 31.4 ± 26.9 µg/L. Eleven participants (one-third) had SF concentrations <15 µg/L and were classified as iron deficient.
Unfermented maize and rice meals have very unfavorable phytic acid to iron molar ratios (>10:1 or even >20:1) which strongly impair dietary iron absorption. In our study, the geometric mean (−SD; +SD) dietary phytic acid intake was 1717.9 (970.1; 3042.3) mg/d, with a phytic acid:iron molar ratio of 7.6. This is very high but comparable to intakes reported for school-aged children in the same area (1690 mg/d 12 ) and lower than estimates for other African countries (2270 mg/d 22 ) Cereal products, mainly maize, contributed 73.6% to all phytic acid intakes in our population, followed by pulses (22.7%), while phytic acid intakes from roots and tubers, vegetables, and seeds were negligible. The mean ascorbic acid intake of 48 mg/d is relatively low compared with the EFSA AR of 80 mg/d for women, but this is because the dietary intake data were collected outside the mango season when fruit consumption was extremely low.
An FAO/WHO expert committee on iron absorption suggested that the average bioavailability from a mixture of heme and nonheme iron is about 5% from a low bioavailable diet, 10% from an intermediate bioavailable diet, and 15% from a high bioavailable diet. 2 The low bioavailability estimate compares favorably with results from our model that indicates iron absorption from the African diet (which is high in phytate, low in heme iron, and therefore, has low bioavailability) is approximately 6% to 7%. We attempted to validate these results with stable isotope data from 13 of the original 30 women in the study. These indicate that iron absorption was between 8% and 10% when the stable isotope labeled iron was added to typical meals eaten by the study population in a multiple meals study with pearl millet. 8 In the original data, no significant difference in fractional absorption from the iron-biofortified and regular-iron millet meals (n = 13, P = .80) was seen, despite the difference in iron content of the millet flour (2.5 and 8.8 mg iron/100 g flour, respectively). However, mean fractional absorption was approximately 30% higher from the postharvest iron-fortified millet meals compared to iron-biofortified millet meals (P = .003) and the regular-iron millet meals (P = .045). Still, it should be noted that the 13 volunteers that consumed stable isotope iron had a median (IQR) SF of 16.3 (30.3) µg/L which was lower than the 23.1 (54.7) µg/L of the 30 volunteers. Given the inverse relationship between SF and iron absorption, there is good evidence for agreement between the iron absorption model and the stable isotope-derived absorption.
The use of Hunt et al 19 or IOM 18 as the reference for the iron requirements does not make a significant difference in the mean iron absorption results (6.7% vs 6.4%; P = .604), although the iron absorption values are predicted to diverge when SF is less than 10 µg/L (15.4% vs 11.8%). This might be an important consideration when approximately one-third of the study population had SF<15 µg/L. A comparison between iron absorption from the African and Western diets does yield a significant difference using either the Hunt et al 19 data (15.1% vs 6.7%; P = .004) or the IOM 18 data (13.7% vs 6.4%; P < .001) at SF = 30 µg/L, but this is not unexpected given that the average Western diet will be highly bioavailable in comparison to the African diet.
Conclusions
It was possible to predict percentage iron absorption from the Beninese diet with data from just 30 women; therefore, this approach could be easily used to derive country-specific values for dietary iron bioavailability. Dietary reference values for iron, which are dependent on the dietary pattern, can then be calculated transparently, without the need to assume values for bioavailability. The data required for this exercise would be accurate measures of dietary iron intake from typical diets, iron status (SF concentration and CRP, to exclude individuals with inflammation/infection, or to correct for this using the method advocated by the Brinda project 23 ), and an estimate of physiological iron requirements. Accurate measures of iron intake and iron status are rarely available in most low- and middle-income countries for any representative population, and it may be a little overoptimistic to assume that data from 30 individuals are sufficient to derive values for dietary iron bioavailability. However, the good agreement between iron absorption measured in isotopically labeled meals and the bioavailability values derived from our model is very encouraging. This new evidence-based approach is a distinct improvement than current less well-documented approaches and may indeed form the basis for some policy actions while awaiting more complete data.
By entering data collected from different countries into our model national/regional values for dietary iron bioavailability can be generated, and these estimates can be used to derive DRVs for iron that are pertinent to the country. These new values, in conjunction with more detailed dietary information, for example, phytic acid and heme iron intakes, can facilitate the development of policies for reducing iron deficiency. We recommend that our model be employed to derive bioavailability values for iron in countries with different dietary patterns and that the country-specific bioavailability values are used to derive DRVs using a harmonized approach. 24
Supplemental Material
Supplemental Material, data_for_Figure_1 - Dietary Iron Bioavailability: A Simple Model That Can Be Used to Derive Country-Specific Values for Adult Men and Women
Supplemental Material, data_for_Figure_1 for Dietary Iron Bioavailability: A Simple Model That Can Be Used to Derive Country-Specific Values for Adult Men and Women by Susan Fairweather-Tait, Cornelia Speich, Comlan Evariste S. Mitchikpè and Jack R. Dainty in Food and Nutrition Bulletin
Footnotes
Authors’ Note
S.F-.T. and J.R.D. initiated the work described in this article. C.S. and C.E.S.M. collected and analyzed the samples and J.R.D. undertook the modeling. S.F-.T., J.R.D., and C.S. drafted the manuscript. All authors participated in the revision and approval of the final manuscript.
Acknowledgments
The authors greatly appreciate the contribution of all the volunteers who participated in the study. The authors also would like to thank Colin I. Cercamondi and Nadia Fanou-Fogny for making original data of the former studies available, and S. Linérolle G. Fassinou and S. Gloria C. Padonou for assistance with dietary data collection and analysis.
Declaration of Conflicting Interests
The author(s) declared no potential conflicts of interest with respect to the research, authorship, and/or publication of this article.
Funding
The author(s) disclosed receipt of the following financial support for the research, authorship, and/or publication of this article: Susan Fairweather-Tait and Jack Dainty receive funding from the Biotechnology and Biological Sciences Research Council (BB/S014039/1). Cornelia Speich and Comlan Evariste S. Mitchikpe receive funding from the Swiss Federal Institute of Technology (ETH Grant-11 15-2).
Supplemental Material
Data can be provided on request.
References
Supplementary Material
Please find the following supplemental material available below.
For Open Access articles published under a Creative Commons License, all supplemental material carries the same license as the article it is associated with.
For non-Open Access articles published, all supplemental material carries a non-exclusive license, and permission requests for re-use of supplemental material or any part of supplemental material shall be sent directly to the copyright owner as specified in the copyright notice associated with the article.