
Abstract
Background:
This study assessed the trend of minimum acceptable dietary practices among children aged 6 to 23 months in India in the past decade.
Methods:
Data collected in the National Family Health Survey during 2005 to 2006 (NFHS-3) and 2015 to 2016 (NFHS-4) were used. The sample size for this study was 11 727 children for NFHS-3 and 61 158 children for NFHS-4. Bivariate and multivariate analyses were done to identify the predictors of feeding practices. We analyzed data of last-born singleton children aged 6 to 23 months who were living with their mother (ever-married women aged 15-49 years).
Results:
In India, a low proportion (10%) of children aged 6 to 23 months received a minimum acceptable diet, and its estimate remained the same in the past 10 years. Older mothers, educated mothers, antenatal care, high economic status, and place of residence were the most consistent predictors of minimum acceptable dietary intake. Over the past decade, however, the minimum acceptable dietary intake has declined among older children (odds ratio [OR] = 0.57, 95% confidence interval [CI], 0.47-0.70; P < .001), children with overweight mothers (OR = 0.40, 95% CI, 0.31-0·50; P <.001), and children of well-off families (OR = 0.29, 95% CI, 0.23-0.37; P < .001). The odds for minimum acceptable dietary intake were significantly higher among children of high (4+) birth order (OR = 1.74, 95% CI, 1.41-2.15; P < .001), rural areas, and children living in the central, eastern, and north-eastern region.
Conclusion:
Results indicate the need for further investigations of poor dietary intake among children living in well-off families and in the northern region. This study suggests policymakers and program managers to address contextual barriers against minimum acceptable dietary intake among children and to reconsider existing strategies in India.
Introduction
The World Health Organization (WHO) and UNICEF have developed the Global Strategy for Infant and Young Child Feeding (IYCF), which recognizes appropriate infant feeding practices that are crucial to improve nutritional status and decrease infant mortality in all countries. 1 However, for people living in low-resource setting—across the globe—affording a diverse diet remains a challenge; main staple foods, such as cereals and starches, usually dominate their daily diet. 2
Dietary inadequacy is a proximate and critical indicator of malnutrition and is associated with illness, poor health, and mortality in infants and young children aged less than 2 years. 3 Malnutrition is a major concern in India. On the one hand, 38% of Indian children—younger than 5 years—are stunted, 29% are wasted, and 36% are underweight, while on the other hand, 2% are overweight. 4 -6 Nutrition-related factors are responsible for about 35% of child deaths and 11% of the total global burden of disease. 7 Other than at individual level, factors at household and community levels such as household food security, income, occupation, and educational status of caregivers, especially of mothers, have an immediate bearing on the child’s nutritional intake. 8 -11
Data from the most recent round of the National Family Health Survey (NFHS) conducted in 2015 to 2016 reveal that the majority of mothers in India are not following the recommended level of IYCF practices, including the timely introduction of solid food, 6,12 which might result in a slow rate of improvement in prevalence of stunting from 52% in 1993 to 38% in 2016. 6,13 Other, population-based studies around the world showed that the highest risk of nutritional deficiency and growth retardation occurs in children between the ages of 3 and 15 months because of poor breast-feeding and complementary feeding practices. 14 Complementary foods are often inadequate in nutritional quality, or they are given too early or too late, in too small amounts, or not frequently enough. 12 It is estimated that 6% of under-5 deaths could be prevented through the achievement of universal coverage of improved dietary practices, especially complementary feeding. 15
Children need age-specific adequate nutrition of acceptable quality and quantity to prevent malnutrition. 12 So far, nutrition programs in India have extensively focused on improving feeding practices and access to supplementary nutrition of pregnant and lactating mothers and children younger than 6 years, but the adequacy of nutritional intake remains a concern 16 ; therefore, periodic evaluation of dietary intake among children is necessary.
Very few studies have estimated the percentage of adequately fed children, aged 6 to 23 months, based on IYCF indicators and identified the determinants of appropriate feeding. 17 -20 Children of this age-group undergo a transition from breast-feeding to complementary feeding, and Indian children, of poor families in particular, often experience the growth failure due to a combination of frequent illness and an inadequate or imbalanced diet. 21 An estimation of the levels and determinants of dietary adequacy for children of this age-group could provide valuable information for health policymakers and program managers. 22 -24
To understand the factors associated with dietary intake among children aged 6 to 23 months, the unit-level data of the NFHS enable researchers to estimate feeding practices in children aged 6 to 23 months using a nationally representative sample of children of that age-group. Therefore, this study aimed to estimate the prevalence of minimum acceptable diet (MAD) and to identify its associated factors in India for young children aged 6 to 23 months.
Methods
Data Sources
The present analysis used the data of the latest 2 rounds of the NFHS: NFHS-3 and NFHS-4 conducted in 2005 to 2006 and 2015 to 2016, respectively, which are the valid sources of information for determining complementary feeding indicators from a nationally representative sample of households. 6,25 In NFHS-3, 109 041 sampled households were visited, and 124 385 women aged 15 to 49 years were interviewed. In NFHS-4, 601 509 sampled households were visited, and 699 686 women aged 15 to 49 years were interviewed.
The analysis was restricted to the last-born singleton children who were alive, aged 6 to 23 months at the time of the survey, and who were living with the mother (ever-married women aged 15-49 years). We excluded the children with multiple births from the analysis because we assumed that the raising twins or triplet will put more stress in the family and that might change the feeding practice. The final unweighted sample size for this study was 11 727 children for NFHS-3 and 61 158 children for NFHS-4. The reason behind the difference in the sample size between NFHS-3 and NFHS-4 is that NFHS-4 assessed various indicators at the district level, while NFHS-3 estimated the indicators only up to the state level. The data from women interview provided information regarding the background characteristics of the mother and child. The household data provided information on socioeconomic characteristics of the household of the child.
Outcome Variable
Intake of MAD
We considered the intake of MAD of children aged 6 to 23 months as the dependent variable in this study. We used the MAD, recommended by the WHO (2010), to assess the intake of MAD for the children. The survey collected data on dietary intake from the mother of the child by a 24-hour recall.
A composite indicator—the proportion of children aged 6 to 23 months who received an MAD in addition to breast milk—was calculated from 2 separate indicators: children receiving minimum dietary diversity and children receiving minimum meal frequency during the previous day. The definitions of these 2 indicators are as follows: Children receiving minimum dietary diversity: the proportion of children 6 to 23 months of age who received foods from 4 or more food groups. Children receiving minimum meal frequency: the proportion of breastfed and non-breastfed children 6 to 23 months of age, who received solid, semisolid, or soft foods (but also including milk feeds for non-breastfed children) the minimum number of times or more. (Minimum is defined as 2 times for breastfed infants 6-8 months, 3 times for breastfed children 9-23 months, and 4 times for non-breastfed children 6-23 months).
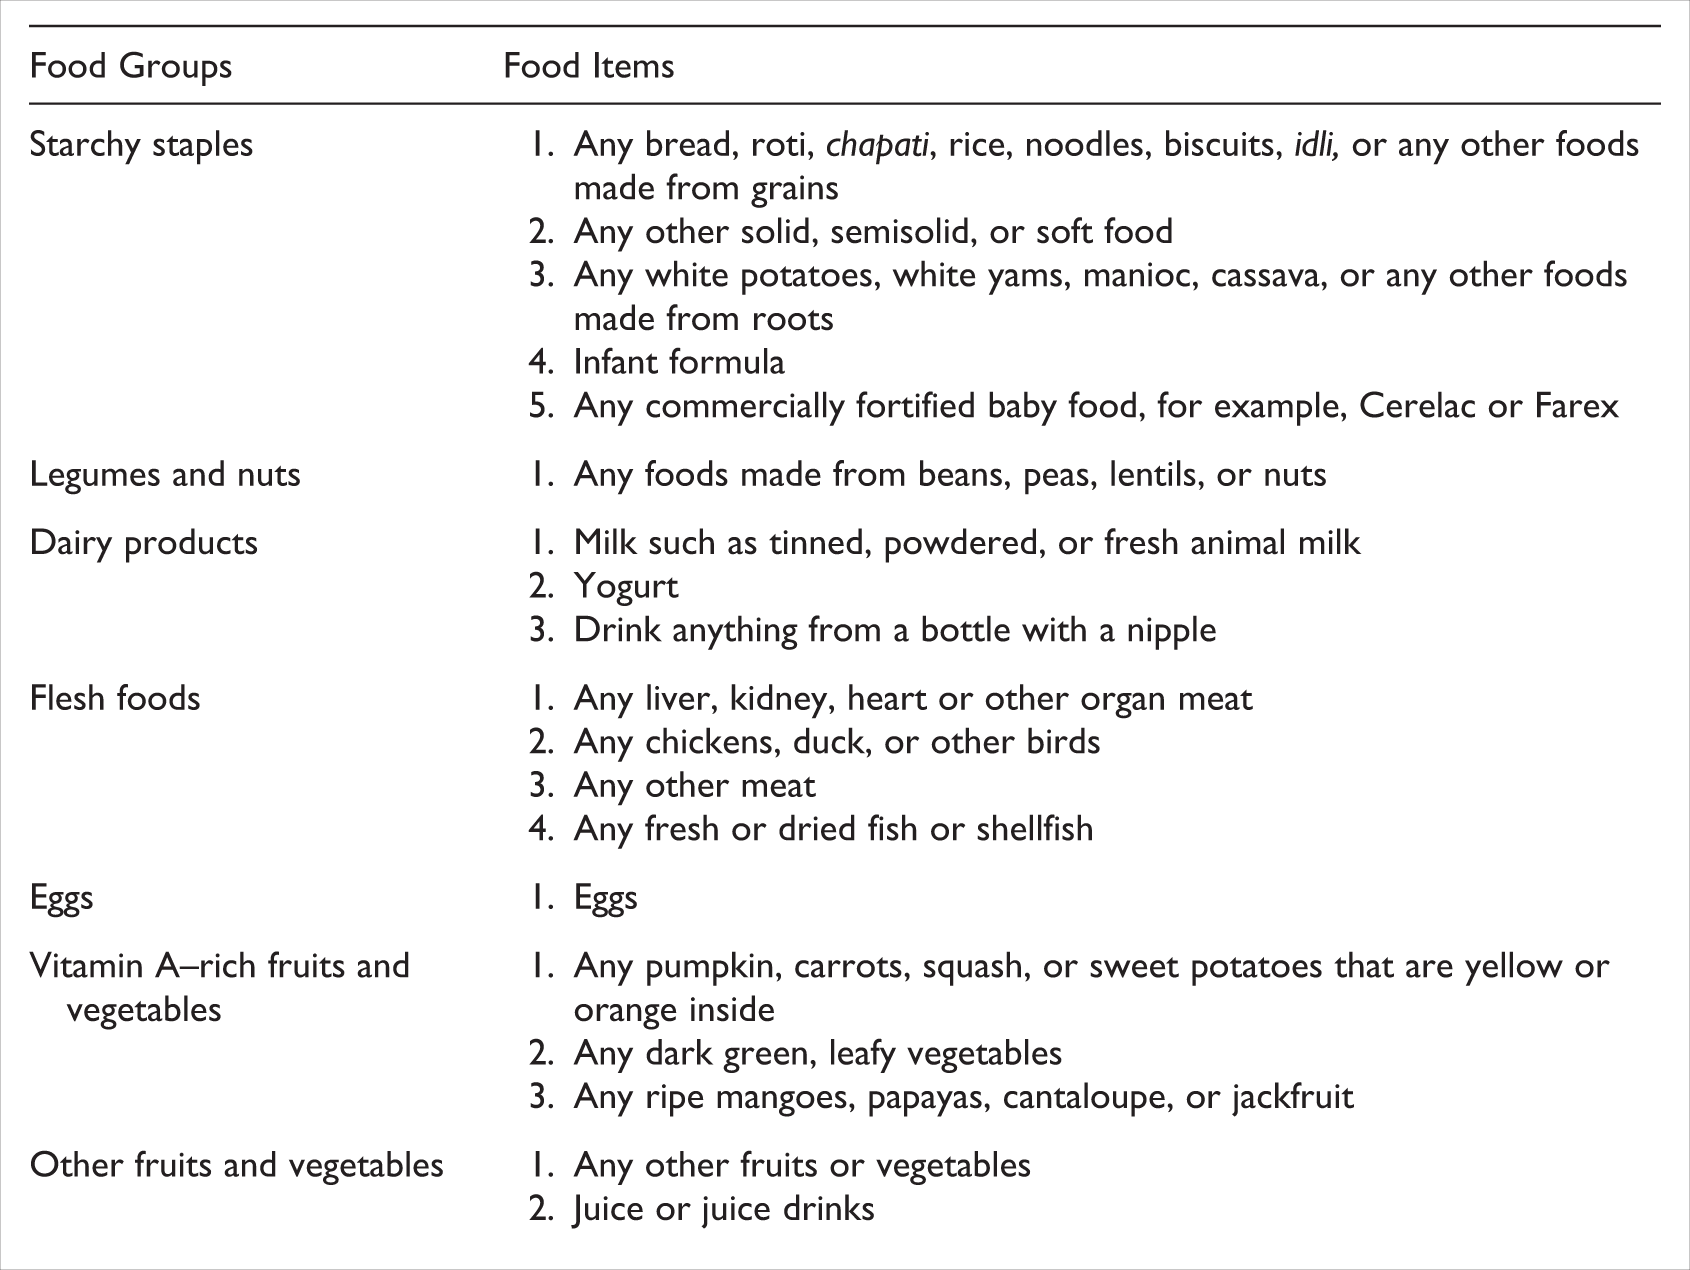
This study assessed the intake of MAD using the food groups given in Box 1; the data on dietary intake of these food groups were collected in both NFHS-3 and NFHS-4. Since in NFHS-3, the dietary intake data were collected only among breast-fed children; therefore, in this study, we estimated MAD only among breast-fed children to make the estimations comparable form both the survey rounds. A child receiving MAD in the last 24 hours, appropriate for their age, was coded as “1” and otherwise was coded as “0.” Indicators for assessing infant and young child feeding practices, asked in both rounds of the NFHS (NFHS-3 and NFHS-4), are shown in Box 1. 26
Type of Foods Classified in Food Groups, Asked in Both Rounds of NFHS (NFHS-3 and NFHS-4)
Explanatory Variables
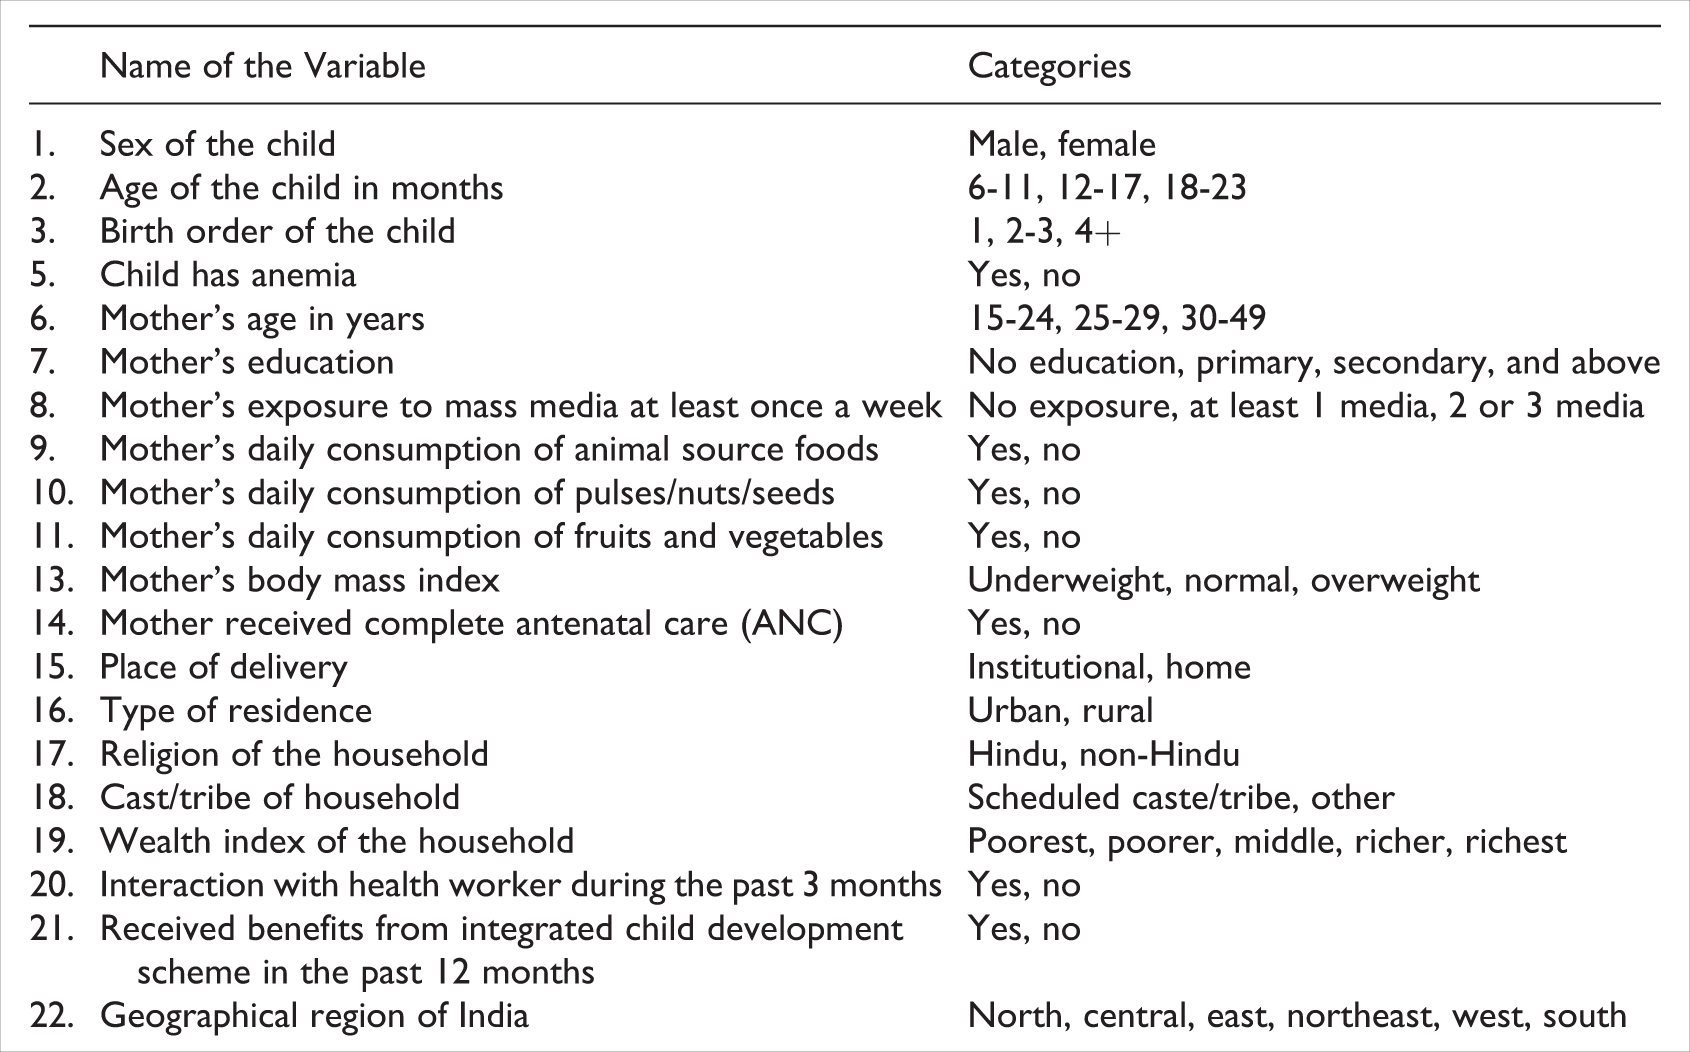
This study considered 22 explanatory variables based on a review of the literature. Box 2 shows each of these explanatory variables and the categories used in this analysis.
List of Explanatory Variables and Their Categories Used in this Study
Statistical Analysis
The outcome indicators were expressed as dichotomous variables, and each variable was coded as “0” for not meeting the indicator criterion and as “1” for meeting the criterion (1 for receiving MAD and “0” for not receiving MAD). Each outcome indicator was examined against a set of explanatory variables (individual, parental, household, health care, and community-level characteristics) to assess the prevalence of the outcome indicator among the women of each of the categories under explanatory variables.
Multiple logistic regression was conducted using stepwise backward elimination of variables. The stepwise regression prevents “overfitting” of the model. We preferred the backward method because the forward method produces “suppressor effects.” The backward regression analysis started with the full least squares model containing all the predictors. The analysis then iteratively removed the least useful predictor, one-at-a-time, until when all remaining variables had a statistically significant (P value <.05) contribution to the model. This analytical approach keeps most of the predictors in the model, which are significantly associated with the outcome variable.
Three logistic regression models were calculated. Models 1 and 2 identified the determinants of MAD in the 2005 to 2006 and 2015 to 2016, respectively. Model 3 identified the determinants of intake of MAD, considering the changes in the determinant variables from 2005-2006 to 2015-2016. Adding interaction terms to a regression model can greatly expand understanding of the relationships among the variables in the model and allows more hypotheses to be tested. The effect of changes in determinants on dietary intake was calculated by creating interaction variables for each of the determinants with a time factor. In that variable, the responses from NFHS-3 were coded as “0” and from NFHS-4 as “1.” Our time interaction regression models take the form of:
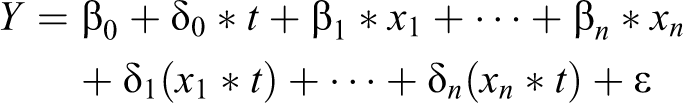
where
Y is the MAD prevalence rate, t is the time, β0 is a vector of coefficients, βn is a vector of explanatory variables, δn is a vector of interaction terms of time factor t, and ∊ is an error term.
Adjusted odds ratios (AORs) showed the strength and direction of the associations between independent variables and MAD. Appropriate sampling weights were applied to maximize the representativeness of the sample. All data analyses were done using SPSS 18.0 software.
Ethical consideration
This article is based on secondary analysis of the NFHS data, available in the public domain with all identifying information removed. The NFHS received ethical clearance from the International Institute for Population Science’s Ethical Review Board from where this survey was conducted. The survey personnel obtained informed consent from each respondent before asking questions.
Results
Profile of the Children
Table 1 shows the sample distribution of children aged 6 to 23 months by selected background characteristics during NFHS-3 and NFHS-4. The results of the t test show that the proportion of children by sex, age, and birth order was similar during both rounds. Prevalence of anemia among children had significantly declined for the past 10 years. Mothers’ educational level improved in the past decade; a higher percentage of mothers had secondary and above education in NFHS-4 compared to NFHS-3. Mothers’ exposure to mass media (reading the newspaper, listening to the radio, or watching television) increased since NFHS-3. Daily consumption of animal source foods among mothers increased from NFHS-3 to NFHS-4, while at the same period, daily consumption of pulses/nuts/seeds or fruits and vegetables declined. The proportion of underweight mothers declined since 2005 to 2006, whereas the proportion of overweight mothers increased. The proportion of mothers who received antenatal care (ANC), had institutional delivery, met health workers in past 3 months, and received benefits from ICDS in the last 12 months preceding the survey, increased from 2005-2006 to 2015-2016. The proportion of women living in urban areas increased from NFHS-3 to NFHS-4. More than half of the children aged 6 to 23 years were from central and eastern regions of the country in both rounds of the NFHS.
Sample Distribution of Children Aged 6 to 23 Months by Selected Background Characteristics, 2015 to 2016, India.a
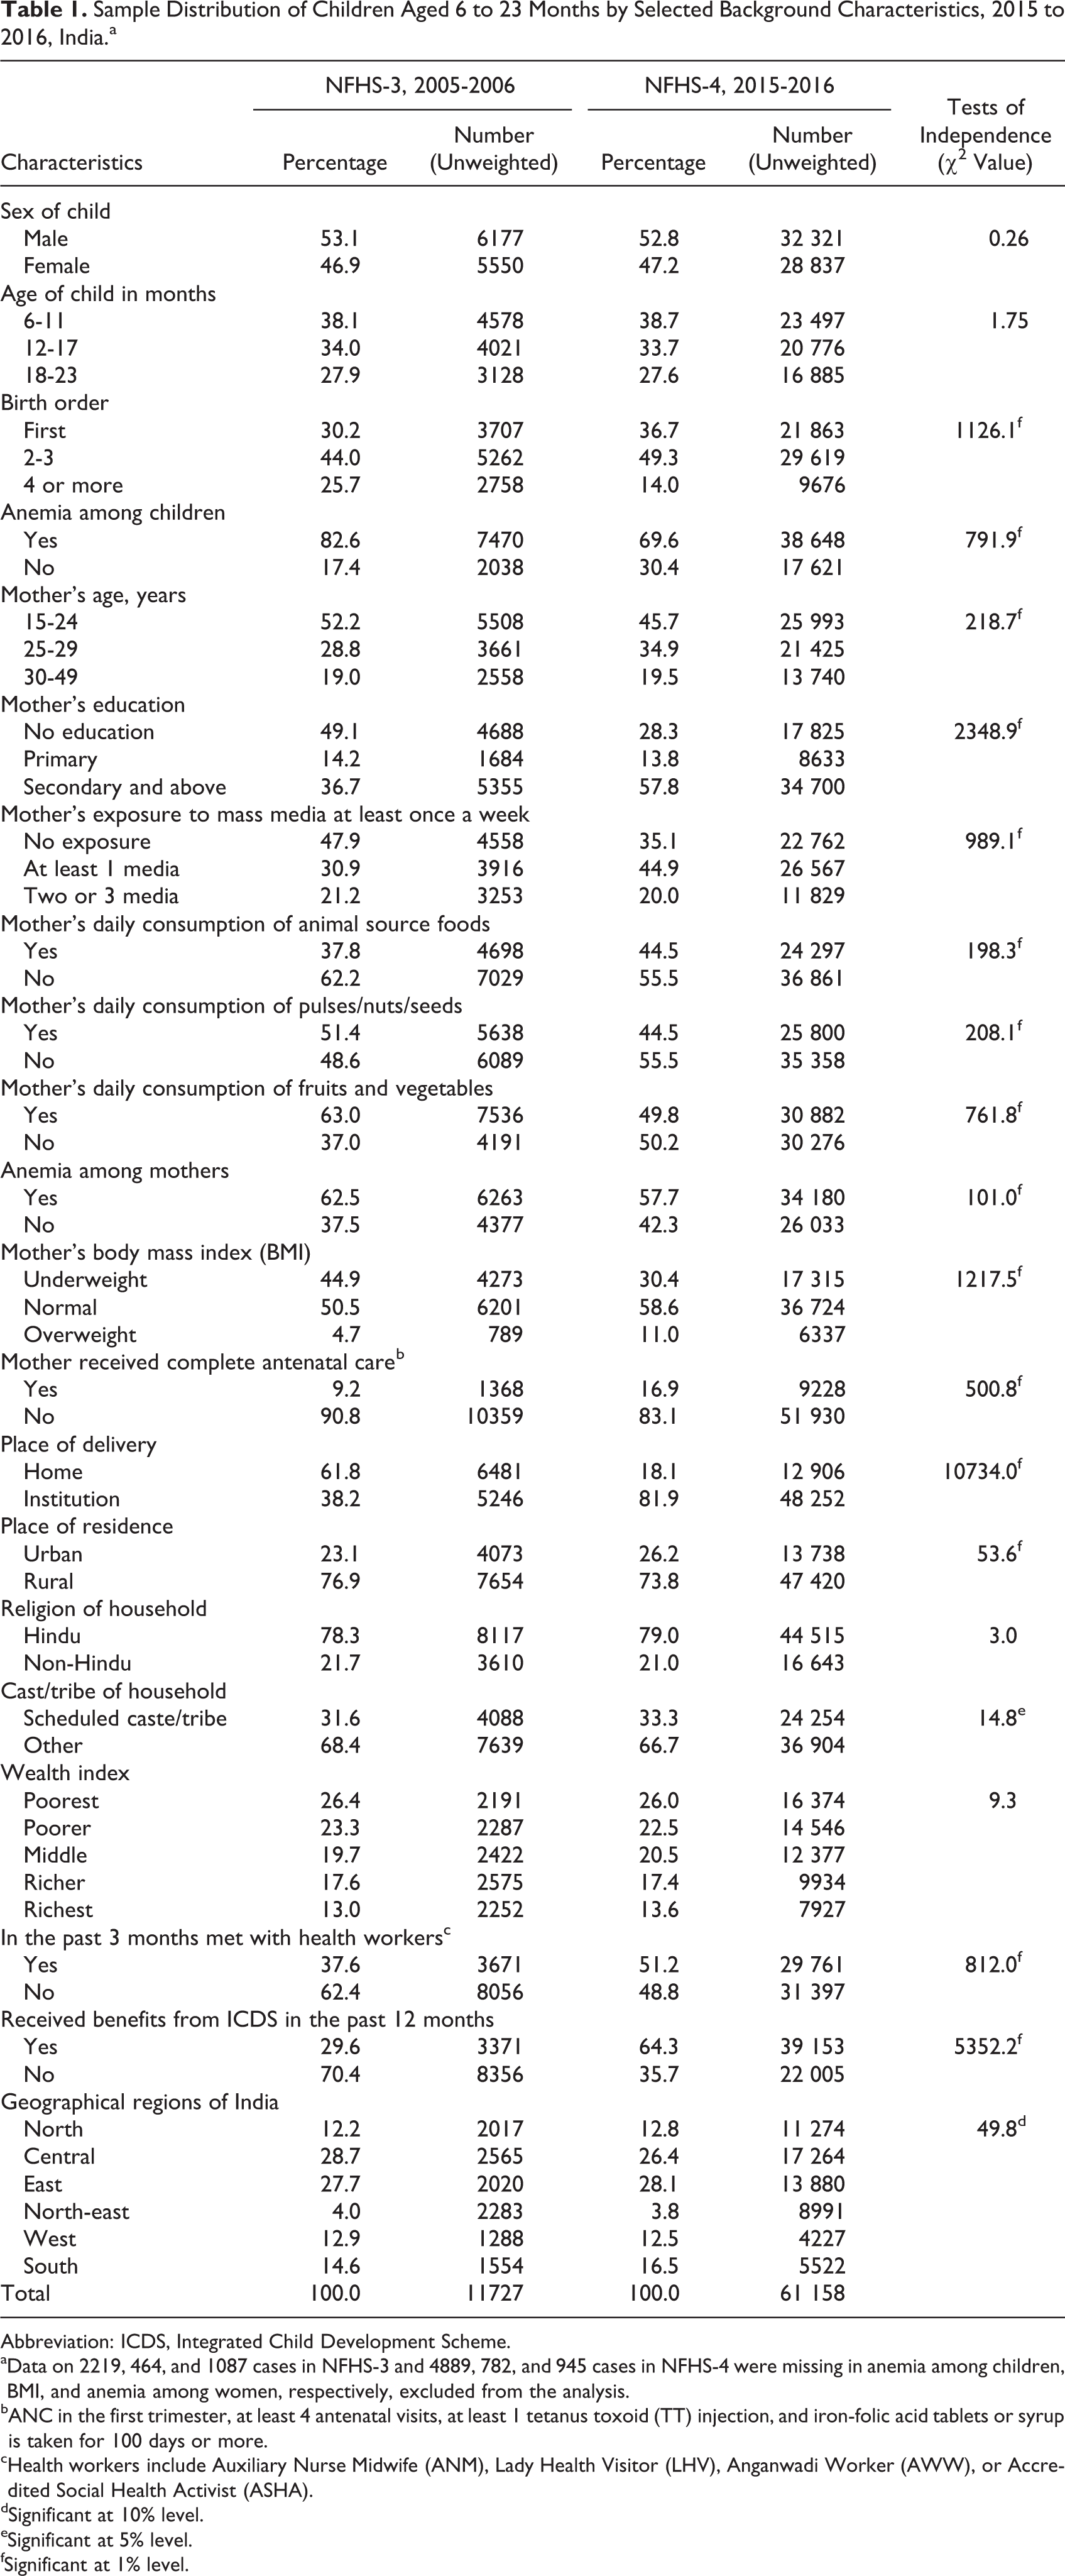
Abbreviation: ICDS, Integrated Child Development Scheme.
aData on 2219, 464, and 1087 cases in NFHS-3 and 4889, 782, and 945 cases in NFHS-4 were missing in anemia among children, BMI, and anemia among women, respectively, excluded from the analysis.
bANC in the first trimester, at least 4 antenatal visits, at least 1 tetanus toxoid (TT) injection, and iron-folic acid tablets or syrup is taken for 100 days or more.
cHealth workers include Auxiliary Nurse Midwife (ANM), Lady Health Visitor (LHV), Anganwadi Worker (AWW), or Accredited Social Health Activist (ASHA).
dSignificant at 10% level.
eSignificant at 5% level.
fSignificant at 1% level.
Food Consumed Among Children
The consumption of different food groups among breast-feeding children aged 6 to 23 months during NFHS-3 and 2015 to 2016 is presented in Table 2. The prevalence of breast-feeding among children aged 6 to 23 months slightly declined from NFHS-3 (86.9%) to NFHS-4 (84.2%; not given in the table). The most common food items were starchy staples (grains/roots, or tubers), followed by dairy products. The consumption of a starchy staple diet (rich in energy-dense carbohydrates) significantly decreased from 2005-2006 (83%) to 2015-2016 (72%). The consumption of dairy products, which are a rich source of animal proteins, also decreased from 2005-2006 (49%) to 2015-2016 (46%). However, the consumption of vitamin A–rich fruits and green leafy vegetables and other fruits and vegetables significantly increased in the past 10 years as observed 32% and 19% in NFHS-3 and 38% and 32% in NFHS-4, respectively. A similar proportion of children (1 in every 10 children) consumed nonvegetarian sources of protein, such as flesh foods or eggs, compared to other food groups in 2015 to 2016. However, the consumption of nonvegetarian foods significantly increased among children from 2005-2006 to 2015-2016. The percentage of children consuming minimum meal frequency significantly declined from 45% in 2005 to 2006 to 31% in 2015 to 2016. One of the major reasons for low MAD among these children could be due to the decline in minimum meal frequency.
Food Group Consumption Among Breast-Feeding Children Aged 6 to 23 Months in India and its Pattern Between NFHS-3 and NFHS-4.
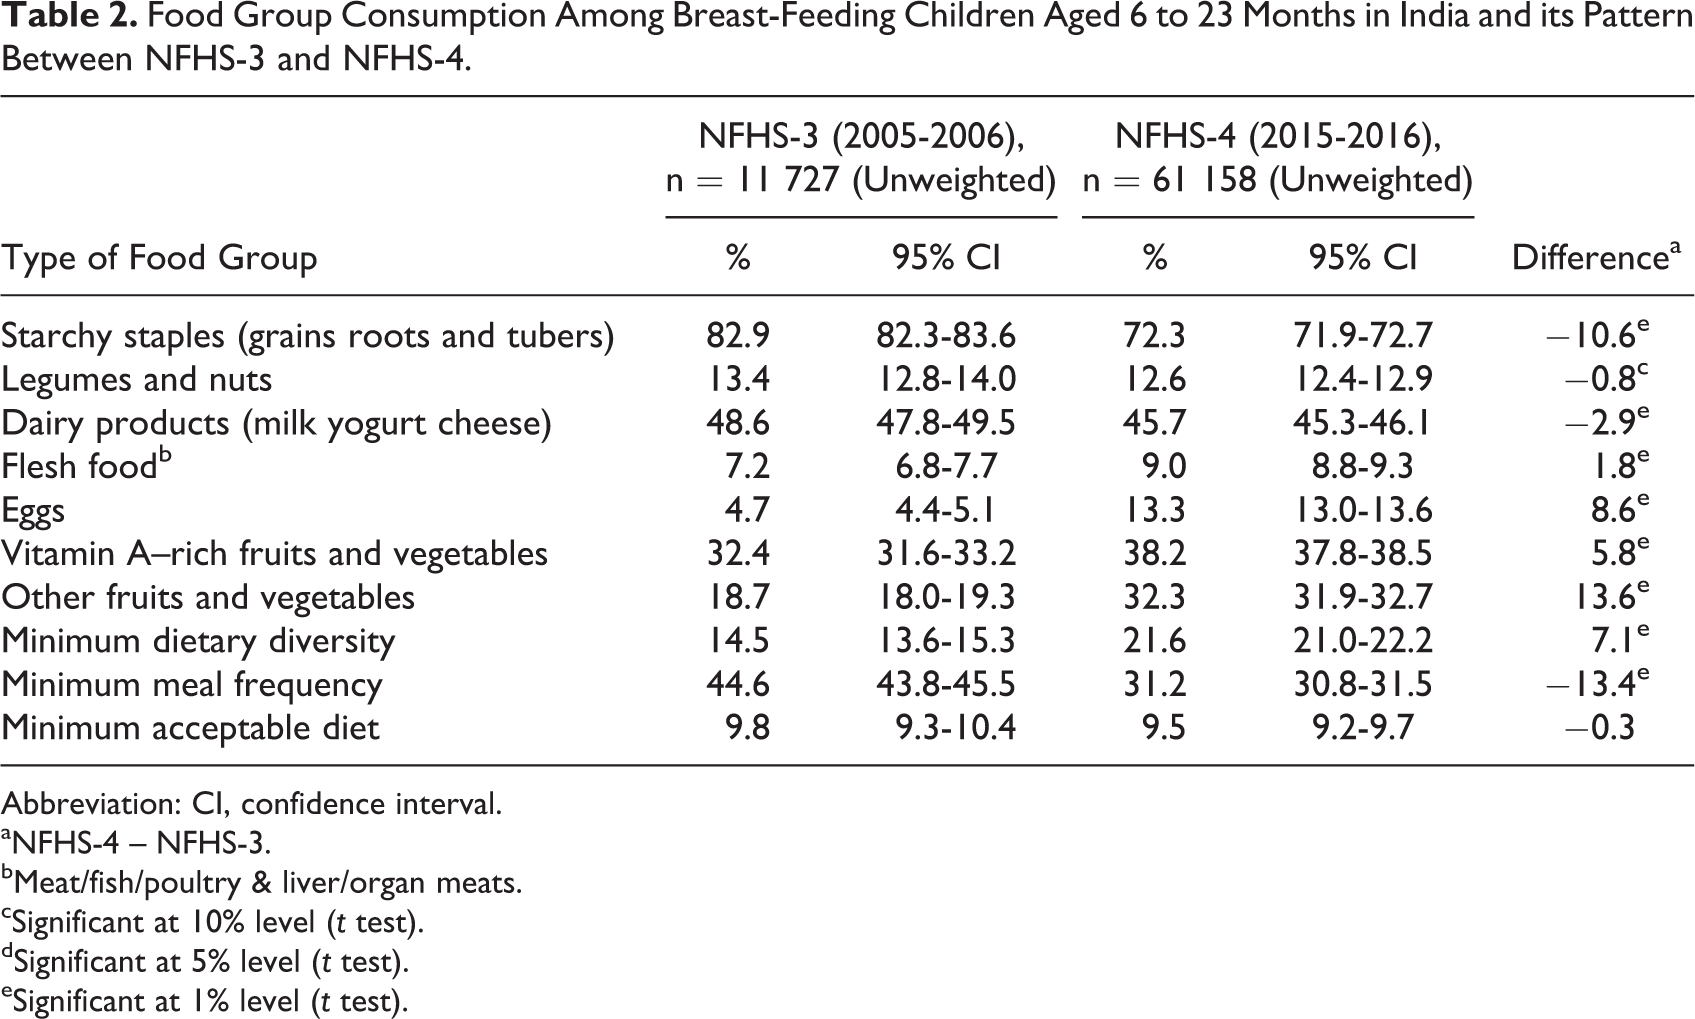
Abbreviation: CI, confidence interval.
aNFHS-4 – NFHS-3.
bMeat/fish/poultry & liver/organ meats.
cSignificant at 10% level (t test).
dSignificant at 5% level (t test).
eSignificant at 1% level (t test).
Association of MAD
Table 3 presents the association of MAD among children aged 6 to 23 months with selected characteristics in India. A direct relation of MAD with increasing age of the children is observed during NFHS-3 and NFHS-4. However, in the past 10 years, the proportion of younger children, aged 6 to 11 months, who received the MAD increased from 4% (NFHS-3) to 6% (NFHS-4), but it decreased among children of older age (12-23 months) during the same period. The percentage of first birth order children receiving MAD declined in the past decade, while no major change was observed among children with anemia during the same period. Consumption of MAD among children of mothers of different age groups did not change much from NFHS-3 to NFHS-4.
Descriptive Statistics of Minimum Acceptable Diet Among Children Aged 6 to 23 Months by Selected Background Characteristics.a
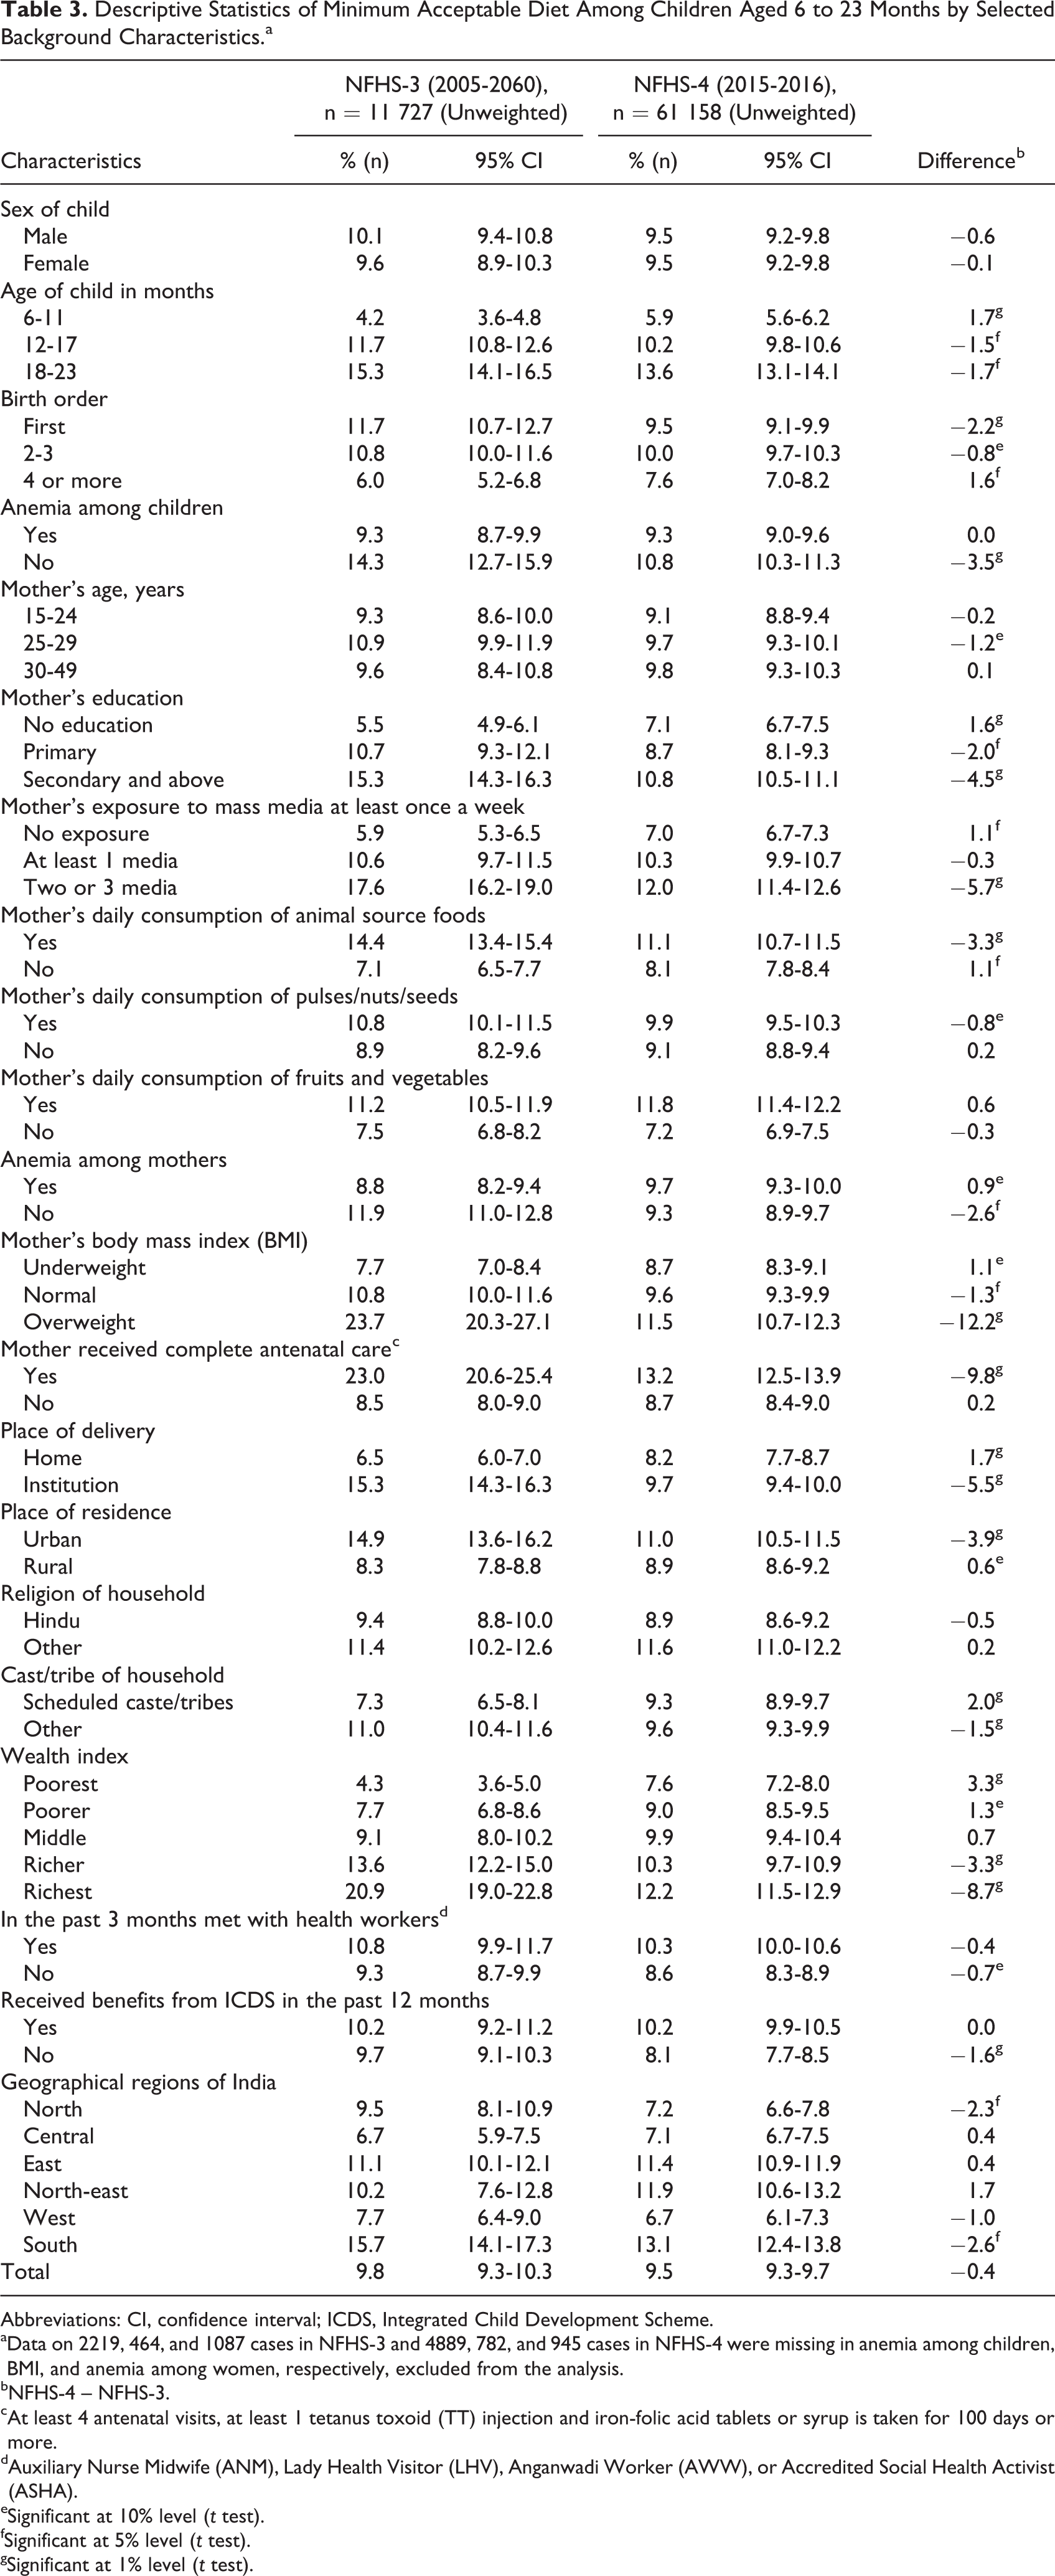
Abbreviations: CI, confidence interval; ICDS, Integrated Child Development Scheme.
aData on 2219, 464, and 1087 cases in NFHS-3 and 4889, 782, and 945 cases in NFHS-4 were missing in anemia among children, BMI, and anemia among women, respectively, excluded from the analysis.
bNFHS-4 – NFHS-3.
cAt least 4 antenatal visits, at least 1 tetanus toxoid (TT) injection and iron-folic acid tablets or syrup is taken for 100 days or more.
dAuxiliary Nurse Midwife (ANM), Lady Health Visitor (LHV), Anganwadi Worker (AWW), or Accredited Social Health Activist (ASHA).
eSignificant at 10% level (t test).
fSignificant at 5% level (t test).
gSignificant at 1% level (t test).
Mothers’ education and exposure to mass media were associated with better dietary adequacy of children at both time periods. A decline in intake of MAD was observed from NFHS-3 to NFHS-4 among mothers with secondary and above education and mothers who were exposed to 2 or 3 mass media at least once a week. Mothers’ consumption of animal protein was associated with MAD intake of the children, but children’s intake of MAD significantly declined from 14% (NFHS-3) to 11% (NFHS-4) in the past 10 years.
Body mass index (BMI) of mothers also had an association with the dietary adequacy of children. A higher proportion of children of obese mothers get MAD compared to children of underweight mothers, and this trend did not change from NFHS-3 to NFHS-4. However, the percentage of children of obese mothers, who were receiving MAD, significantly declined from NFHS-3 (24%) to NFHS-4 (12%).
Antenatal care visits and institutional delivery showed direct relation with dietary adequacy of the child. Intake of MAD by children whose mothers received complete ANC and had institutional delivery was higher than whose mother did not. Also, more children living in urban areas received MAD than children from rural area. However, the dietary adequacy declined from NFHS-3 to NFHS-4 among those children who were from urban areas, had institutional delivery, and whose mother had full ANC. The wealth index showed a positive association with intake of MAD, but the gap in dietary adequacy between poorest and “richest” families reduced in the past 10 years. More children of the “poorest” families received MAD in NFHS-4 (8%) compared to NFHS-3 (4%), and this trend reversed among children of “richest” families.
A significant disparity in dietary adequacy of children was observed across the regions of India. The dietary adequacy was the lowest in Central India and the highest in Southern India throughout the past 10 years. However, in the southern and northern regions of India, the proportion of children consuming MAD significantly declined from NFHS-3 to NFHS-4.
Determinants of MAD
Table 4 summarizes the determinants of MAD in breast-feeding children aged 6 to 23 months in models 1, 2, and 3. Models 1 and 2 identified the determinants of MAD in the 2005 to 2006 and 2015 to 2016, respectively. The odds for the intake of MAD were significantly high among children aged 12 months and above (both in 2005-2006 and 2015-2016). Similarly, mother’s education; exposure to mass media; daily consumption of animal source foods, fruits, and vegetables; ANC; institutional delivery; and well-off families were positively related to MAD as observed at both time periods (2005-2006 and 2015-2016).
Determinants of Minimum Acceptable Diet (MAD) Among Children Aged 6 to 23 Months in 2005 to 2006 (NFHS-3) and 2015 to 2016 (NFHS-4) and Change in MAD From 2005-2006 to 2015-2016.a-c
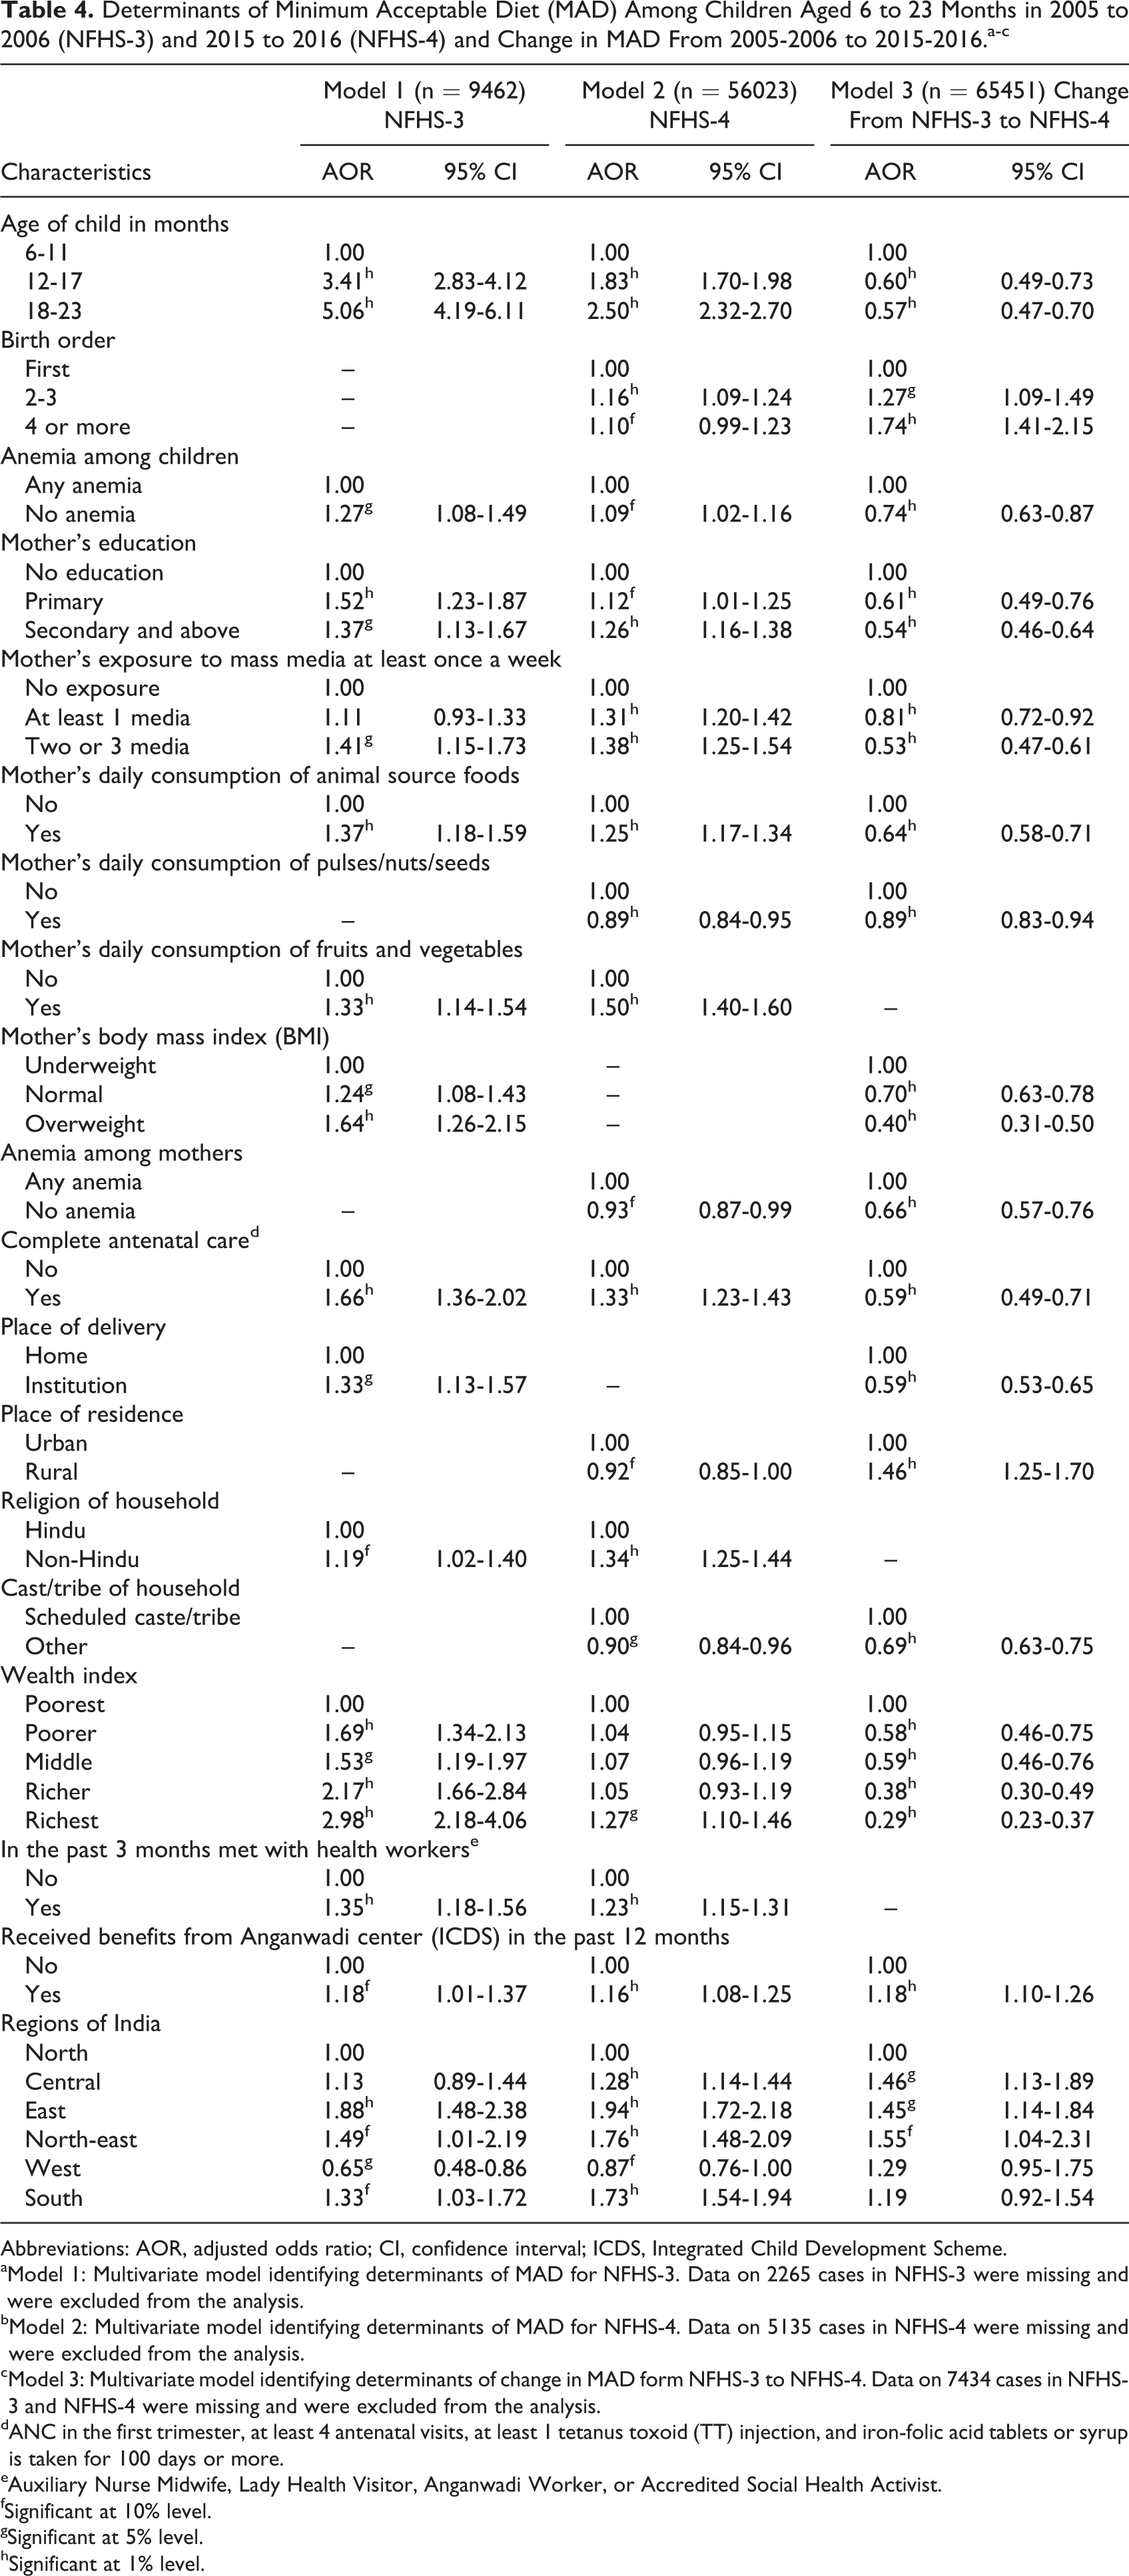
Abbreviations: AOR, adjusted odds ratio; CI, confidence interval; ICDS, Integrated Child Development Scheme.
aModel 1: Multivariate model identifying determinants of MAD for NFHS-3. Data on 2265 cases in NFHS-3 were missing and were excluded from the analysis.
bModel 2: Multivariate model identifying determinants of MAD for NFHS-4. Data on 5135 cases in NFHS-4 were missing and were excluded from the analysis.
cModel 3: Multivariate model identifying determinants of change in MAD form NFHS-3 to NFHS-4. Data on 7434 cases in NFHS-3 and NFHS-4 were missing and were excluded from the analysis.
dANC in the first trimester, at least 4 antenatal visits, at least 1 tetanus toxoid (TT) injection, and iron-folic acid tablets or syrup is taken for 100 days or more.
eAuxiliary Nurse Midwife, Lady Health Visitor, Anganwadi Worker, or Accredited Social Health Activist.
fSignificant at 10% level.
gSignificant at 5% level.
hSignificant at 1% level.
Model 3 identified the determinants of change in MAD intake, considering the changes in the determinant variables from 2005-2006 to 2015-2016. The odds for the intake of MAD were 5 times higher in 2005 to 2006 (OR: 5.1; confidence interval [CI], 4.2-6.1) but significantly declined by half in 2015 to 2016 (OR: 2.5; CI, 2.3-2.7). The odds of a change in intake of MAD in the past 10 years among children older than 12 months was 0.6 (40% less likely to increase) compared to change in intake of MAD among younger children aged below 1 year (model 3). Similar decline in intake of MAD in the past10 years can be noticed with nonanemic childrenversus children with anemia, mothers who had at least primary education versus mothers with no education, mothers who were exposed to at least 2 channels of mass media versus mothers with no exposure to mass media, mothers who consumed animal source proteins daily, had complete ANC, and who lived in better-off households compared to their respective counterpart.
But, on the other hand, intake of MAD had improved in the past 10 years among children of certain characteristics. For example, a higher proportion of children of 2 or higher birth order were given MAD compared to change in intake of MAD among first birth order children (OR: 1.3 times among 2-3 birth order and 1.7 times among 4+ birth order). Similarly, intake of MAD among children of women living in rural areas increased 1.4 times compared to change in intake of MAD among children of women living in urban areas. Change in consumption of MAD among children with anemia when compared to nonanemic counterparts. Also, change in consumption of MAD among children of women who received benefits from Anganwadi centers in the past 12 months and who lived in central, eastern, north-eastern regions of India were more likely to feed MAD to their children compared to change in consumption of MAD among children of women who did not receive benefits from Anganwadi centers and who lived in northern region of India, respectively.
Discussion
We found that the prevalence of MAD (only 10%) was consistently low in the past decade in India among breast-feeding children aged 6 to 23 months. Although MAD did not significantly change from 2005-2006 to 2015-2016, however, minimum meal frequency reduced by 14 percentage points from 2005-2006 (45%) to 2015-202016 (31%), which led to exceptionally low consumption of acceptable diet. Such a low intake of MAD is a public health concern in India because an unbalanced diet could increase the prevalence of malnutrition in the country.
Multivariate logistic regression analysis (Table 4: model 3) showed improvement in intake of MAD among children of higher birth order (4 or more), living in rural areas, who were benefitting from Anganwadi centers and living in central, eastern, and north-eastern regions of the country. The Anganwadi centers provide meals to preschool-going and school-going children throughout the country and especially in rural areas through the government-run Integrated Child Development Scheme (ICDS). The children who are living in urban areas are not only more likely to consume fast food but also have limited access to the Anganwadi center compared to children living in rural areas. 27,28 At the same time, local availability of the food variety and social customs related to dietary habits also cause the geographic variation in intake of MAD. 29
The consumption of different food groups and MAD among breast-feeding children aged 6 to 23 months showed similar results for NFHS-3 to the findings of Patel et al. 19 The literature showed that the consumption of MAD varies with age and it improves as the age increases. 30,31 The present study also found that a higher proportion of older children consumed MAD compared to younger children. However, in the past decade, the consumption of MAD was alarmingly decreased, and the decline was more pronounced among older children (12-23 months) than younger children (6-11 months). Dietary adequacy among children with anemia improved in the past 10 years compared to their nonanemic counterparts. This could be due to various government programs, such as ICDS, that focus on the eradication of anemia in the country 27 ; therefore, the program ensured MAD to the targeted children.
Mothers’ education above primary level, their exposure to mass media, and their daily consumption of animal protein foods were significant predictors of MAD, and this finding corroborates to the findings of Borkotoky et al. 32 The decline in the consumption of MAD among children could be due to a change in lifestyle and eating patterns over the past 10 years. Children might be consuming more in quantity but not in quality and diversity. However, we could not examine this explanation due to lack of data on the quantity of dietary intake in NFHS. The literature showed that selection of foods by children is mainly taste driven rather than based on the nutritional content. 33 Easy accessibility, rising incomes of the family, and increased consumption of junk foods could be the associated factors for poor diet diversity among children. 34
Several technical consultations and documents on complementary feeding recommend that it should be started when breast-milk alone is insufficient to meet all nutritional requirements. 7,30,35,36 This late introduction of complementary foods has been cited as a factor contributing to the downward trend of the growth curves seen among infants after 6 months of age. 34
Nonanemic mothers, maternal obesity, and household wealth had some influence on MAD as the odds of MAD among children of these mothers show a significant decline since 2005 to 2006. Nutritional counseling for mothers about infant and young child feeding options during ANC is an important continuum of care for promoting appropriate infant and young child feeding practices. 20,37
The findings further showed that children were more likely to receive MAD when their mothers receive full ANC (as per the WHO guidelines) and have institutional delivery; this finding aligned with the findings of a previous study in India. 32 The literature showed that complementary feeding practices improved among the mothers who had more exposure to health professionals during their ANC visits, more likely to take appropriate actions to improve the dietary diversity of their children. 3 However, contrary to existing evidence, we found that in NFHS 2015-2016, children, whose mothers received complete ANC and had institutional delivery, received significantly less MAD than those of NFHS 2005-2006. In the past 10 years, India experienced a tremendous increase in maternal health coverage indicators; institutional delivery increased by 40 percentage points and receipt of 4 antenatal checkups by 14.2 percentage points, and these increases were higher among vulnerable socioeconomic groups. For example, the institutional delivery among the lowest wealth index group increased from 13% in 2005 to 2006 to 60% in 2015 to 2016, while the increase for the highest wealth index group was from 84% to 95% during the same period. 6,26 The change in dietary intake among children aged 6 to 23 months did not coincide with an increase in coverage of maternal health services, mostly after initiation of Janai Suraksha Yojana in 2005, across the socioeconomic groups.
This study has some potential limitations. The cause and effect relationships cannot be established due to the cross-sectional design of the NFHS. It also relied on a 24-hour recall of different types of food groups and the frequency but not the quantity of the food which is vital information to estimate dietary adequacy. However, the strength of this study lies with the results from a large nationally representative sample, which can help policymakers and researchers design interventions to improve feeding practices for infant and young children in India.
Findings of the study reveal that a very low proportion of breast-feeding children aged 6 to 23 months received MAD, and this remained the same in the past 10 years in the country. Intake of MAD in India is consistently low among children of a younger age-group, children of 4 or higher birth order, children with anemia, children of mothers having no exposure to mass media, mothers who do not consume animal source foods daily, mothers with low BMI, mothers who did not receive ANC during their last pregnancy, children of urban area, poor household, of mother who did not receive any benefit from ICDS in past 12 months, and children from the northern, central, and western India. In the long term, improvements in higher levels of parental education and media can be used as an effective means of promoting meal frequency practices and nutritional counseling for mothers about infant, and young child feeding options during ANC can result in better practices of MAD in India.
Footnotes
Authors’ Note
All authors contributed to the study concept and design. NK contributed to statistical analysis; SK and AM contributed to interpretation of data; NK and AM drafted the article; NK and SK contributed to the critical revision of the article for important intellectual content; and all authors have approved the final version of the manuscript.
Authors analysed the secondary data accessible from DHS website with a request for use of research purposes only. DHS had no role in the design, analysis, or writing of this article.
Acknowledgments
The International Institute of Population Sciences, Mumbai, and ORC Macro, Maryland, USA, carried out the NFHS series for the Health Sector of the Ministry of Health and Family Welfare, India.
Declaration of Conflicting Interests
The author(s) declared no potential conflicts of interest with respect to the research, authorship, and/or publication of this article.
Funding
The author(s) received no financial support for the research, authorship, and/or publication of this article.
Ethical Standards Disclosure
This article is based on secondary analysis of the National Family Health Survey (NFHS) data available in public domain with all identifying information removed. The NFHS received ethical clearance from the International Institute for Population Science’s Ethical Review Board from where this survey was conducted. The survey personnel obtained informed consent from each respondent before asking questions.