
Abstract
Background:
Good nutrition and appropriate child feeding are vital in early stages of child development, particularly in the first 1000 days of life.
Objective:
To assess the adoption of infant and young child feeding practices of World Health Organization, dietary intake, and level of undernutrition in children <2 years of age.
Methods:
Baseline cross-sectional study was conducted (January-June 2013) in purposively selected rural communities of Halaba and Zeway, Ethiopia (N = 383 mother–child pairs, randomly selected).
Results:
Overall prevalence of stunting, wasting, and underweight was 45%, 9%, and 28% in Halaba, and 33%, 7%, and 15% in Zeway, respectively; higher levels of stunting (54% in Halaba and 36% in Zeway) were observed in 6 to 24 months; stunting and underweight, but not wasting, differed by age (P < .001) in Halaba. Median dietary diversity score in both communities was 2 with 61% to 65% of children consuming 0 to 2 food groupings. Except protein in all age and iron in 12 to 24 months, median intake of energy, iron, zinc, and calcium (and associated nutrient densities) was below the estimated needs that should come from complementary foods in both communities (in subsample). Early initiation of breast-feeding and exclusive breast-feeding was 63% and 86% in Halaba and 92% and 93% in Zeway, respectively (P < .001). Children receiving minimum acceptable diet were 6% and 9% in Halaba and Zeway, respectively.
Conclusions:
The high levels of stunting and suboptimal feeding practices as well as low dietary diversity scores, energy, and nutrient intake in both communities, particularly in Halaba, indicate a need to improve/strengthen nutrition strategies for complementary feeding children in these areas.
Keywords
Introduction
Appropriate feeding of children, per World Health Organization (WHO) recommendations and with control of infectious disease, has been promoted as 1 strategy to combat growth faltering and associated consequences in young children. 1,2 The World Health Organization has provided specific recommendations and a set of indicators of appropriate practices of infant and young child feeding (IYCF). 3 -5 The recommendations emphasize initiating breast-feeding within 1 hour after birth, exclusively breast-feeding infants during the first 6 months as well as timely introducing adequate and safe solid/semisolid foods and complementary foods, while continuing to breast-feed until 2 years or beyond. 3,4 Earlier, exclusive breast-feeding (EBF) alone has been estimated to prevent 1.2 million child deaths yearly worldwide. 6 Continuing breast-feeding until 24 months of age, along with other appropriate foods, was also suggested to further improve health and growth in millions of children with significant reduction in morbidity and mortality. 1,7,8 Recent reviews estimated 823 000 child deaths that could be prevented yearly through scaling up optimum breast-feeding to near universal coverage. 9,10 This makes the first 2 years, specifically the first 1000 days, of life very critical for interventions that aim to avert growth faltering 6 and associated consequences in young children.
Despite significant efforts to combat childhood malnutrition, very high level of child stunting, an indicator of chronic undernutrition, is still prevalent in Ethiopia. In 2009, Ethiopia had one of the highest rates of child stunting in Africa, with an estimated 6.7 million stunted children under the age of 5. 11 Results from the 2011 Ethiopian Demographic and Health Survey (EDHS) were also worrisome as rates of stunting, wasting, and underweight remained high at 44.4%, 9.7%, and 28.7%, respectively. 12 According to the 2014 Mini EDHS, stunting has dropped to 40.1% 13 —a reduction of about 1% per year—but was insufficient to meet the National Nutrition Program target of reducing stunning to 30% by 2015. 14
Since linear growth faltering among infant and young children is the highest in the first 2 years of life, 15 interventions focusing on appropriate feeding practices during this critical period have been recommended as key strategies to prevent stunting and associated mortality and morbidity. To this end, the Ethiopian government, through the National Health Extension Program and the Alive & Thrive project (since 2009), have been extensively promoting appropriate IYCF practices for children <2 years of age. 16 A 2011 IYCF study in part of southern Ethiopia had shown poor compliance to WHO feeding practices and higher rates of impaired growth among complementary feeding children (ie, 43% and 39% stunting in 6-8 months and 9-23 months, respectively, compared with 26.6% in 0-5 months). 17 Studies in other parts of Ethiopia also showed low adherence to the breast-feeding or complementary feeding recommendations of WHO; complementary foods were of low-micronutrient content and below minimum diversity and meal frequency. 18 -21
However, there were no prior studies on IYCF practices in rural communities of Halaba district and Zeway areas. These areas were chosen purposively as part of a collaborative project between Hawassa University and University of Saskatchewan, aimed at improving human nutrition through agricultural productivity. The study communities are both rural but in different administrative regions; Halaba is also traditionally a pulse-growing district unlike the community from Zeway area, which is mainly cereal growing. We therefore conducted the current study to assess the adoption of IYCF practices, per WHO recommendations, and estimate the prevalence of child undernutrition using anthropometric and dietary assessments in these communities.
Materials and Methods
Study Setting and Sample
Between January and June 2013, the baseline data were collected as part of a proposed community-based intervention study in purposively selected rural communities from Halaba and Zeway. Halaba Woreda is 1 of the 8 special Woredas (∼district) in Southern Nations, Nationalities, and People’s Region (SNNPR) and is located 315 km south of Addis Ababa and 85 km northwest of Hawassa, the capital of SNNPR. The Woreda shares border with Oromia Regional State (ORS) in the west, Hadiya Zone in the north, and Kembata Tembaro Zone in the east. The district is known for growing peppers and pulses which are also considered cash crops by the local farmers. The other rural community from Zeway is part of Adami Tulu Jido Kombolcha district in ORS. This district is situated on the main road connecting Addis Ababa to Hawassa. It is also located ∼160 km southeast of Addis Ababa and shares border with Dugda Bora district in the north, SNNPR in the west, Arsi Negelle district in the south, and Arsi Zone in the east. Maize, teff, wheat, barley, and different oil seeds are the major agricultural crops produced in the district.
In consultation with the respective agricultural offices in the 2 districts, 2 rural kebeles (note 1) (communities), Guba-Sherero and Holagoba-Kukie from Halaba, and 1 rural community from Zeway, Edo-Qontola were selected for a bigger interventional study in these areas. However, the current study included data for children aged under 2 years of age (0-24 months) only. Using the formula for estimating sample size for cross-sectional survey design, 22,23 413 and 217 mother–child pairs, with children up to 5 years of age, were randomly selected from eligible households in Halaba and Zeway communities, respectively. Inclusion criteria were the households having at least 1 apparently healthy (able to come out for body measurements) child under 5 years of age, to be resident of the selected community, and the child should be living with the mother. In cases of children >1 under 5 years of age per household, only the youngest was included in the study. In cases of twin (note 2) children, 1 was randomly picked. The exclusion criterion was child experiencing serious sickness (such as diarrhea) in the 2 weeks prior to or at the time of the study. From these 630 mother–child pairs, 383 households (287 from Halaba and 96 from Zeway) with infant and young children <24 months of age and who met the inclusion criteria participated in this study (Figure 1).
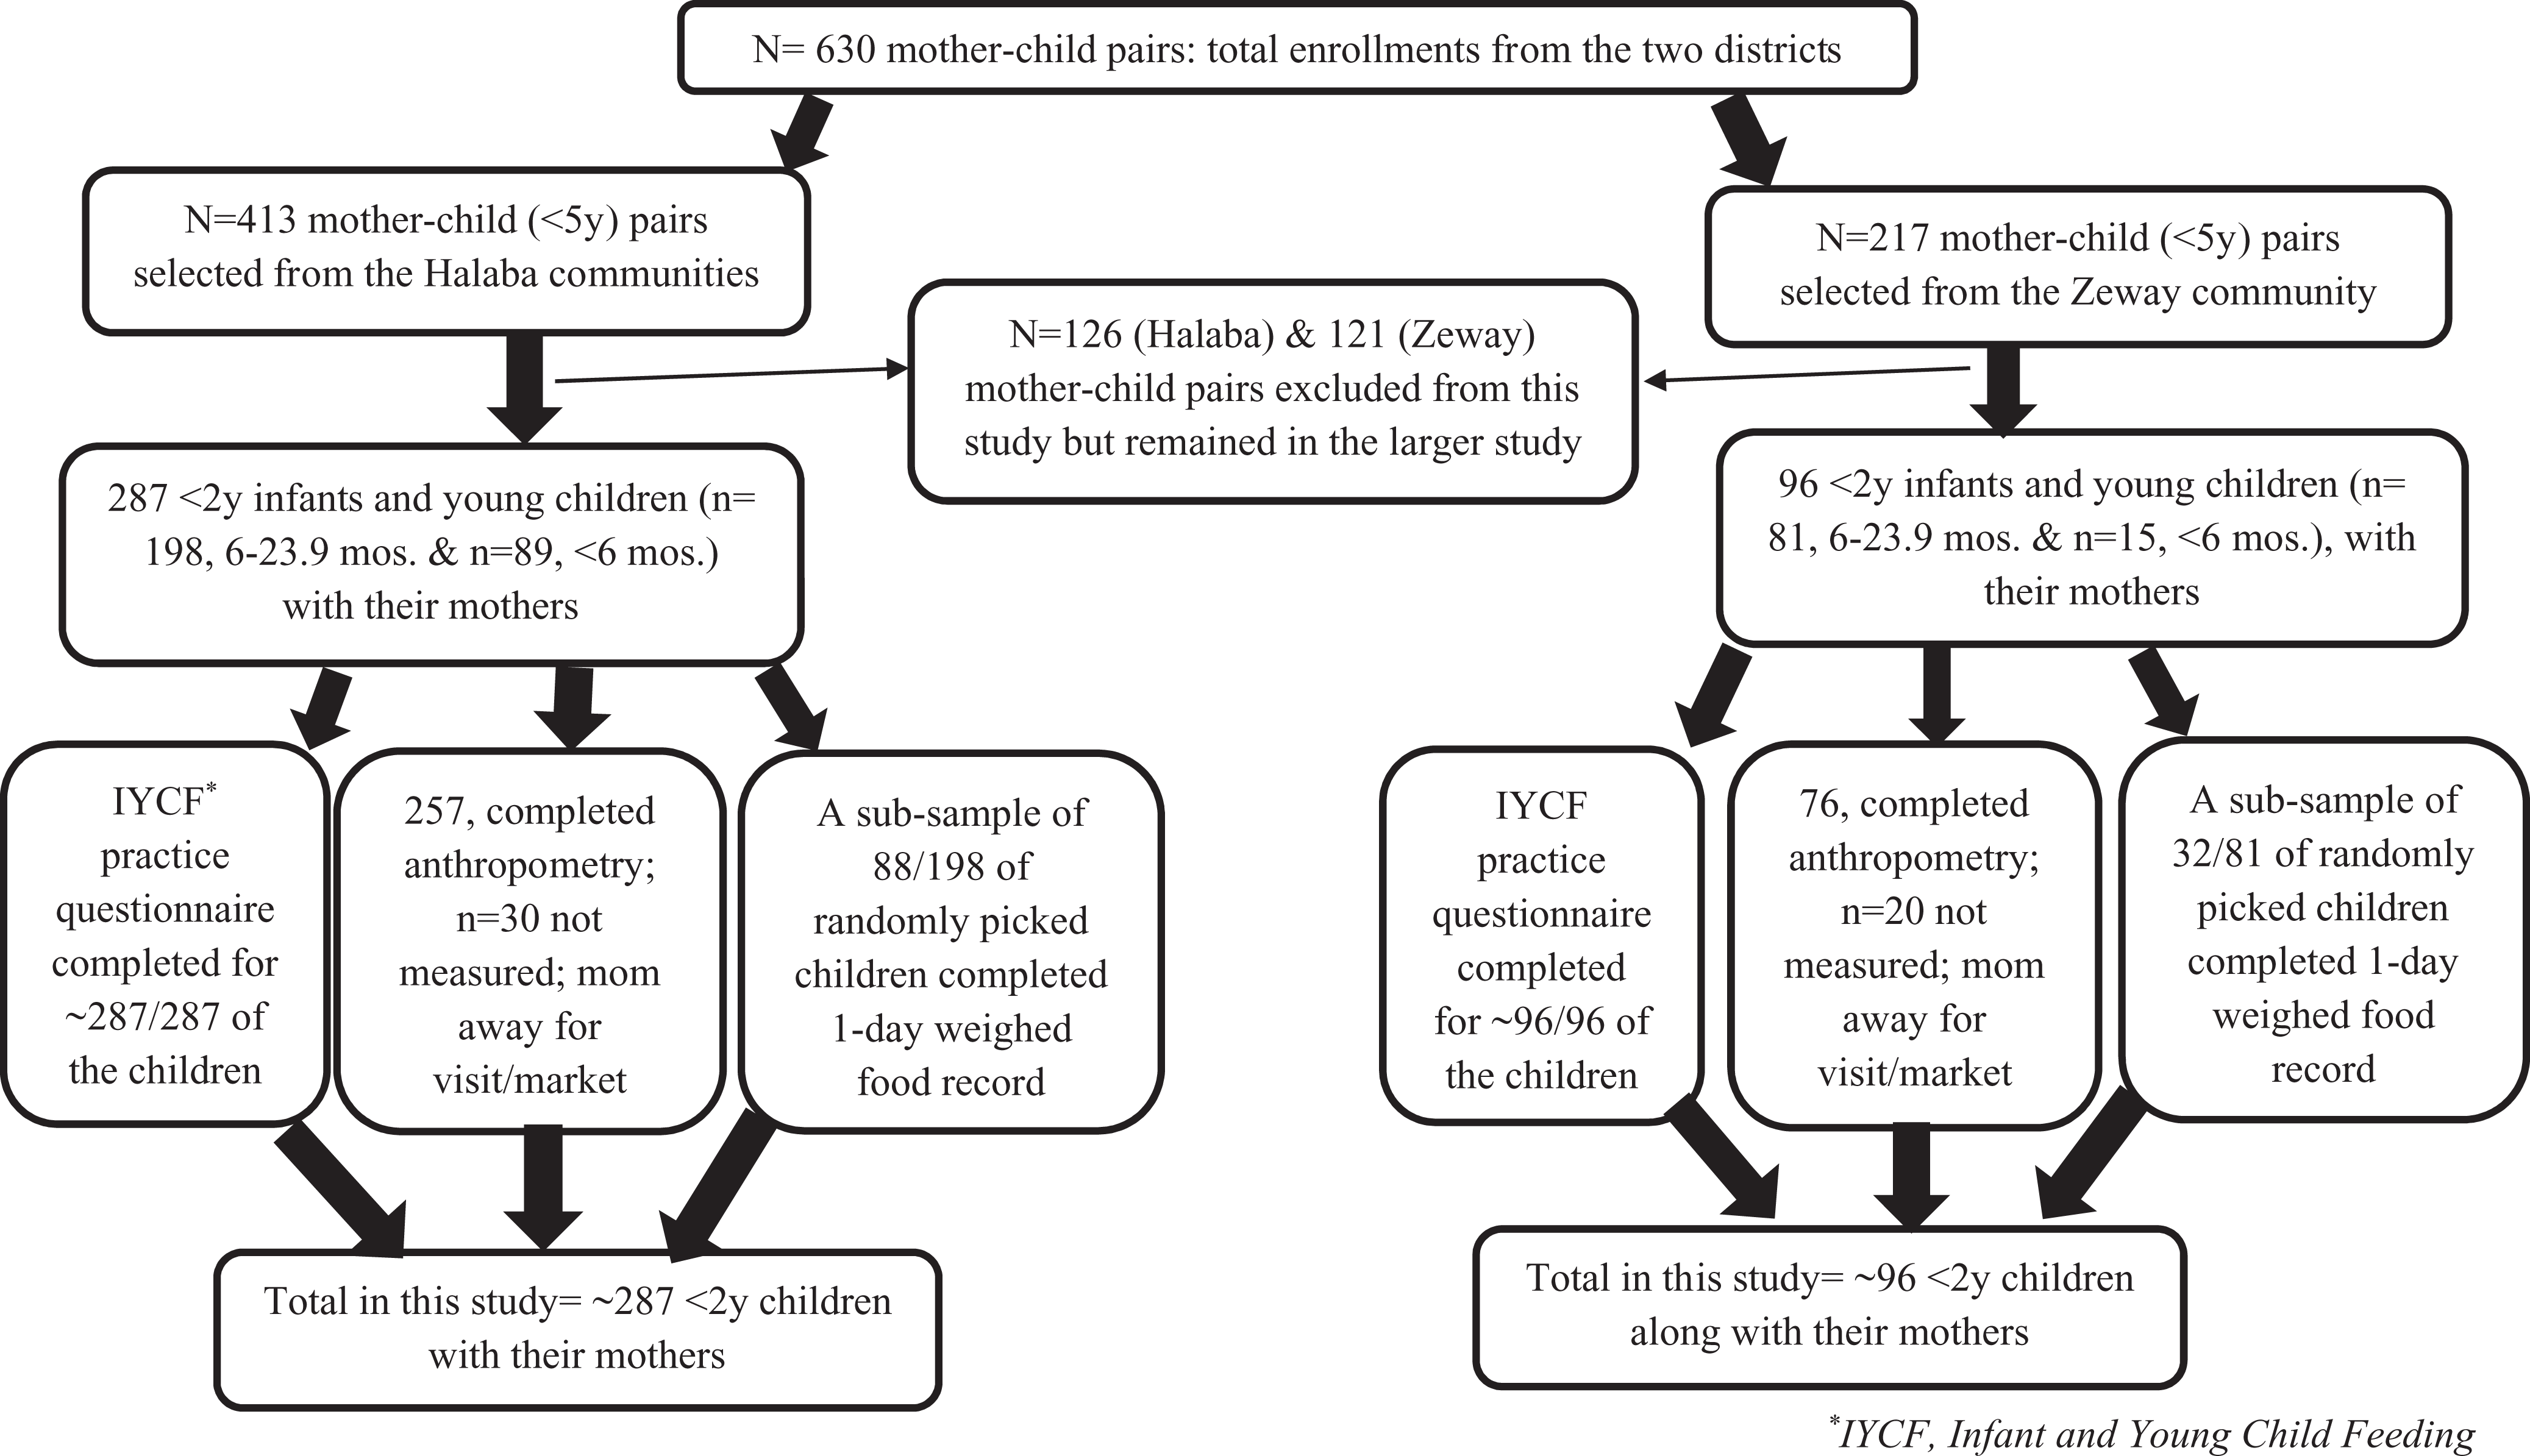
Flow chart showing recruitment of participants in the study.
Demographics and Feeding Practices
Trained female data collectors (mainly nurses) supervised by the lead investigator (G.E.) and nutrition graduate research assistants, collected all questionnaire-based data and a single-day in-house-weighed food record. Questionnaire adapted from a previous similar study in the region 18 was used to collect information on background characteristics and IYCF-specific variables. A 24-hour dietary diversity questionnaire, prepared according to Food and Agriculture Organization (FAO) guideline, 24 was used to gather data for calculating dietary diversity scores (DDSs) based on WHO 7 food groups for complementary feeding children (6-23.9 months). The 7 food groups were “grains, roots, and tubers”; “legumes and nuts”; “dairy products (milk, yogurt, and cheese)”; “flesh foods (meat, fish, poultry, and liver/organ meats)”; “eggs”; “vitamin-A-rich fruits and vegetables”; and “other fruits and vegetables”. 5 Dietary diversity is generally a proxy measure for diet quality and micronutrient intakes.
Dietary Intakes
Intakes of energy, protein, zinc, iron, and calcium were measured in a subsample (n = 88 in Halaba, n = 32 in Zeway) of children receiving complementary feeding (ie, only those between the age of 6 and 23.9 months) from a single-day weighed-food record, collected on both weekdays and weekends to account for day of the week effect. Data collectors randomly walked to participating households in the communities, checked if the child age was 6 to 23.9 months, and if so, the data collector spent the whole day recording everything the child consumed that day. Data collectors were asked to skip all households with children <6 months. Median intake and nutrient densities (amount per 100 kcal of energy) were compared with estimated needs that should be obtained from complementary foods, assuming average composition and intake of breast milk for age. Median energy was compared with estimated needs from complementary foods as outlined in the study of Dewey and Brown 25 based on the Food and Agriculture Organization (FAO)/WHO/United Nations University report, 26 and also with age and weight-adjusted estimated energy needs to account for the size of our study children. 25,26 Estimated protein need was from WHO, 27 and those for iron, zinc, and calcium were from FAO/WHO. 28
The weighed food record was done by trained female data collectors staying in the participant’s home from early morning (before the child had his or her first meal) until evening when the child ate his or her last meal for the day. Each data collector was provided with a digital food weighing scale (2 kg maximum weight: Model CS 2000; Ohaus Corporation, Parsippany, NJ, USA). The data collectors were trained to collect detailed information on type, quantity, and preparation method of each food consumed, including the recipe data. However, no recipe data were collected in our case as diets were simple and monotonous (such as sorghum/maize bread with boiled kale).
To determine the intake of the selected nutrients, a local food composition table was compiled using the Ethiopian Food Composition Tables (EFCT) Parts III 29 and IV 30 and US Department of Agriculture Food Composition Tables. 31 Samples were collected for some local foods (mostly breads made from various cereal staples) for which there were no nutrient values in the EFCT. A small amount of each of these food samples was collected from 3 to 5 households in clean plastic Ziploc bags that were previously unused. Then the samples were immediately transported to Hawassa University Food Science Laboratory (Ethiopia) for hot air oven-drying (within 1-2 hours of sample collection). Samples of the same food item were dried, mixed, and stored together in a clean Ziploc plastic bag to create composite sample. Losses in the weight of cooked food samples (“as eaten”) were calculated as moisture. Dried food samples were then analyzed at the University of Saskatchewan (Canada). Any remaining moisture content was analyzed using air oven following AACC International Method 44-15.02; protein was analyzed using LECO’s TruMac N (Saint Joseph, MI, USA; an equipment that measures protein/nitrogen in food by combustion) following AACC International Method 46-30.01. The inorganic constituents (iron, zinc, and calcium) were analyzed using flame atomic absorption spectrophotometry according to AACC International Method 40-70.01.
Anthropometry
Various body measurements were collected from the children. The measurements included weight, via an electronic scale (Seca 770; Seca Corporation, Hanover, Maryland), recumbent length, via adult/infant length/stature measuring board (Perspective Enterprises, Portage, Michigan), head circumference, via a flexible nonstretch tape, midupper arm circumference (MUAC), via colored MUAC insertion tape for children, and triceps skinfold thickness, via a skinfold caliper (Holtain Ltd, Crymych, United Kingdom), using standardized procedures. 32 All children wore light clothing when measured for height/length and weight. Measurements were conducted at the local health center, health post, or community school compound, depending on physical proximity for the participating households in each community. All measurements were taken in duplicates, and a third measurement was taken whenever the difference between the first 2 measurements exceeded the allowable limits (weight 100 g, circumferences 5 mm, length/height 5 mm, and skinfolds 2 mm). Date of birth for each child was determined from immunization card and/or local events calendar.
Data Quality and Analysis
Data quality was ensured by the following multiple means: we recruited data collectors who were fluent in the local languages and had at least some postsecondary training in nursing or related field; we provided 3 days of training on the questionnaire and weighed food record data collection in the meeting rooms of local health offices; field level data collection was supervised by G.E. and research assistants who have completed their bachelor of science degree in nutrition, and completed questionnaires and forms were checked each night and concerns were addressed at the field setting; to minimize measurer errors, 1 anthropometrist (G.E.), with the help of research assistants, conducted all body measurements. All questionnaire-based data were entered into SPSS (IBM SPSS Statistics, version 20) and cleaned by running simple frequency distributions.
A univariate and bivariate analyses were carried out, and data were presented using descriptive statistics (mean, standard deviations, median with first and third quartiles, and percentages). The IYCF indicator variables were analyzed based on the WHO guidelines. 5 Based on the data gathered, we were able to calculate 7 of the 8 core, and 2 optional, IYCF indicators (note 3) as well as the related feeding practice indicators (ie, “the giving of colostrum,” “prelacteal feeding,” and “frequency of breast-feeding in previous 24 hours”) for breast-fed children aged 0 to 23.9 months. The dietary diversity data were used to calculate median DDS (first and third quartile). In addition, proportions of children consuming from 0 to 2, 3 to 4, or 5 to 7 food groups were calculated using the 24-hour dietary diversity data. These were classified as low, medium, and high DDS, respectively, according to Arimond and Ruel. 33 Data from the 1-day weighed food records were used to calculate the median (first and third quartile) values of energy, protein, zinc, iron, and calcium, which then were compared to the estimated needs from complementary foods, as described earlier. Nutrient densities were also calculated by expressing the median intakes per 100 kcal of energy; these were also compared with the desired levels based on estimated needs. The WHO Anthro (version 3.2.2) 2011 program was used to analyze all anthropometric data. Extreme values flagged by the software were checked and corrected at the field setting. Mean LAZ, weight-for-length z score, weight-for-age z score (WAZ), MUAC-for-age z score, head circumference-for-age z score, triceps skinfold thickness-for-age z score (only for children ≥3 months), and BMI-for-age z score were calculated for each of the 2 age-groups and all age-group children. The prevalence of stunting (LAZ <−2 standard deviation), wasting (WAZ <−2 standard deviation), and underweight (WAZ <−2 standard deviation) were also calculated for each age-group. Results on anthropometric indices, DDS, median intakes of energy, and the selected nutrients were disaggregated into 2 to 4 age categories (0-5 months, 6-8 months, 9-11 months, and 12-23 months [or 6-23.9 months]) in agreement with the different IYCF feeding recommendations by WHO for these age-groups. Independent t test, Mann-Whitney U test (to test differences between groups), and χ2 (for categorical variables) were the statistical tests used, with significance set at a P < .05.
Ethical Approval Process and Informed Consent
Ethical approval was obtained from the University of Saskatchewan Behavioural Ethics Board, in Canada. In addition, a local ethics clearance was also obtained from the Regional Health Bureaus of the SNNPR and ORS, Ethiopia. Permission was also obtained from local health offices from the respective districts and participating mothers for the conduct of the study. Mothers gave oral consent to participate in the study after a local female data collector explained the purpose of the study and everything it involved.
Results
A few of the participating mothers did not bring their children to the anthropometric assessment days or were not present at home during house visits; hence, anthropometric results include 333 participants (87%). Findings on WHO core and optional feeding indicators have variable sample sizes due to the specific age range each indicator required. Results on background characteristics and IYCF practices were disaggregated across the Halaba and Zeway communities.
Participant and Household Characteristics
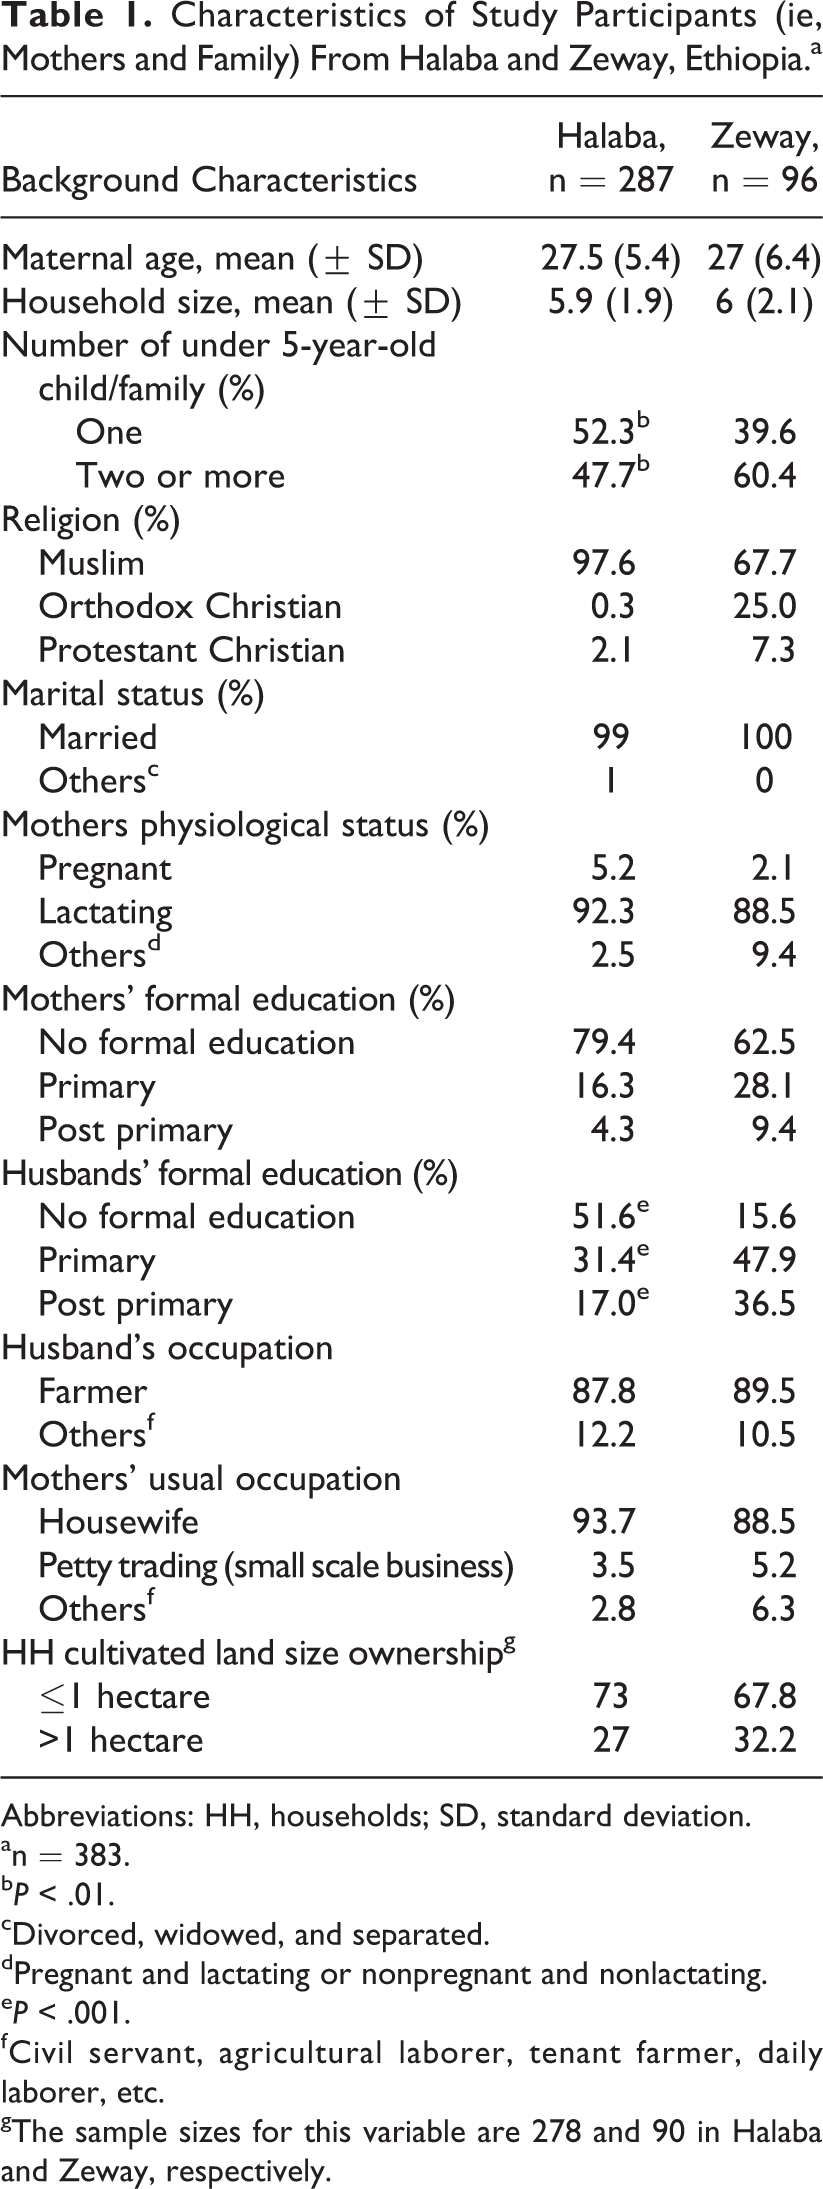
Background characteristics of participants are shown in Table 1. Most mothers in both sites were lactating and 27 years of age in average. Almost all mothers were married, and Islam is the dominant religion in both locations, particularly in Halaba. Family sizes were generally high. Close to half or more households reported having ≥2 children under the age of 5 years, and the difference was significant between communities (P < .05). One in 4 households in Halaba and 1 in 6 in Zeway practiced polygamy (result not shown). Majority of households in either community reported ownership of <1 hectare cultivable land. Farming was the main occupation of the men, and mothers were generally housewives with very minimal or no formal schooling. However, higher proportion of men from the Zeway community reportedly received formal education (P < .001).
Characteristics of Study Participants (ie, Mothers and Family) From Halaba and Zeway, Ethiopia.a
Abbreviations: HH, households; SD, standard deviation.
an = 383.
b P < .01.
cDivorced, widowed, and separated.
dPregnant and lactating or nonpregnant and nonlactating.
e P < .001.
fCivil servant, agricultural laborer, tenant farmer, daily laborer, etc.
gThe sample sizes for this variable are 278 and 90 in Halaba and Zeway, respectively.
Results on IYCF Indicators
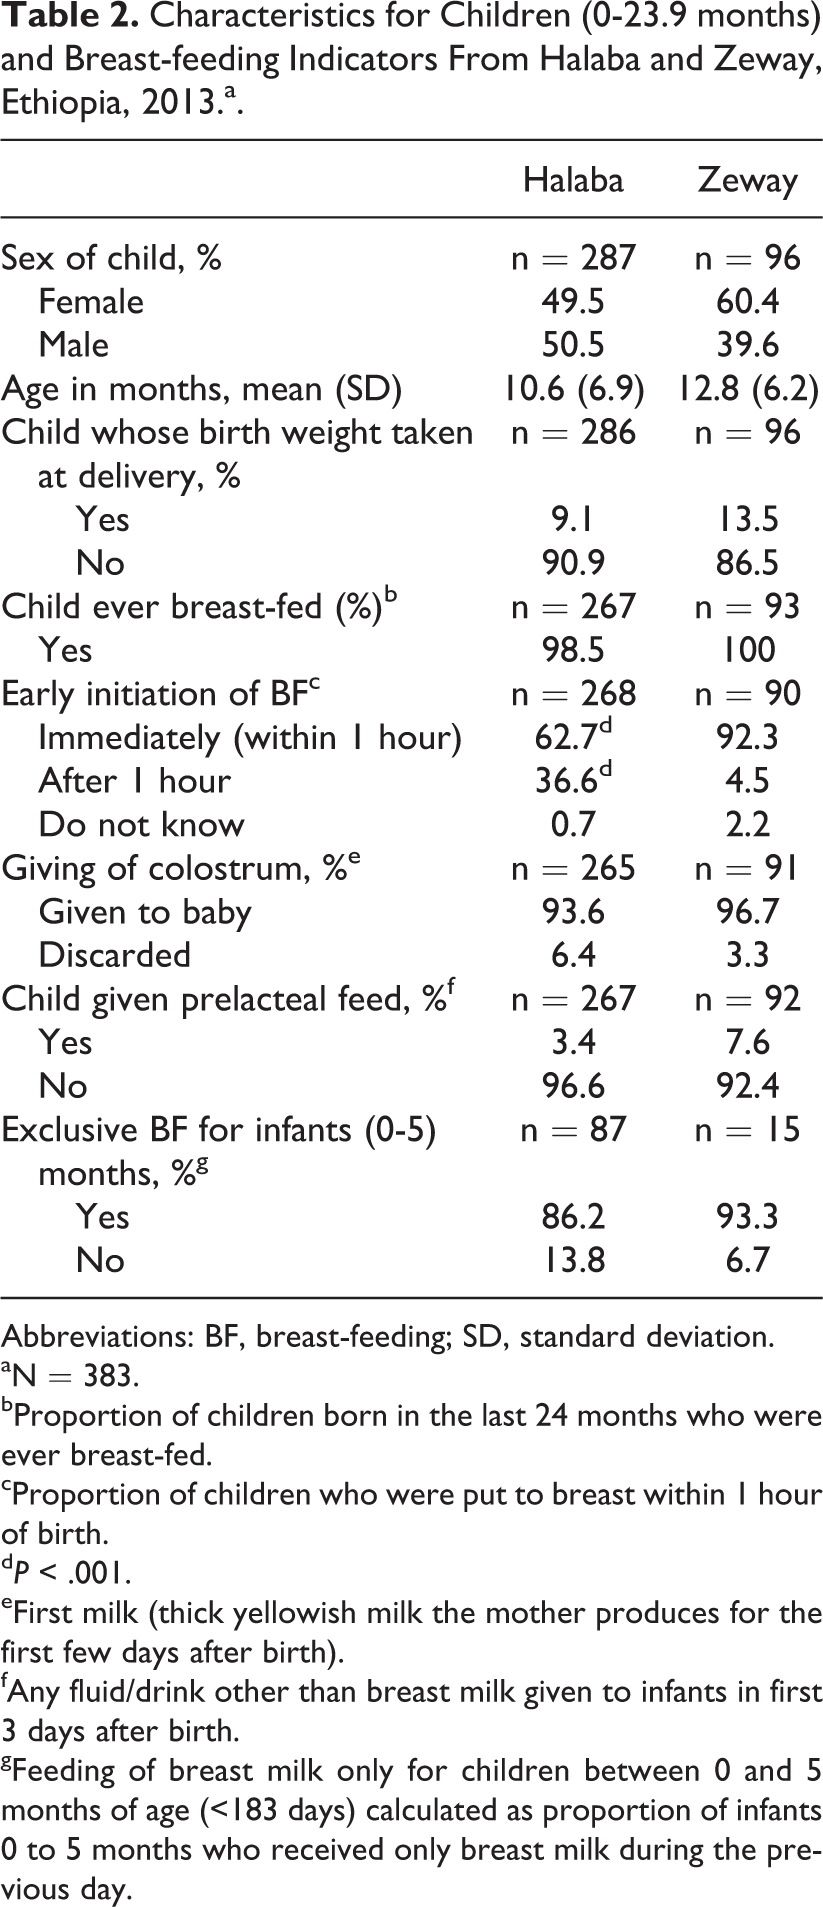
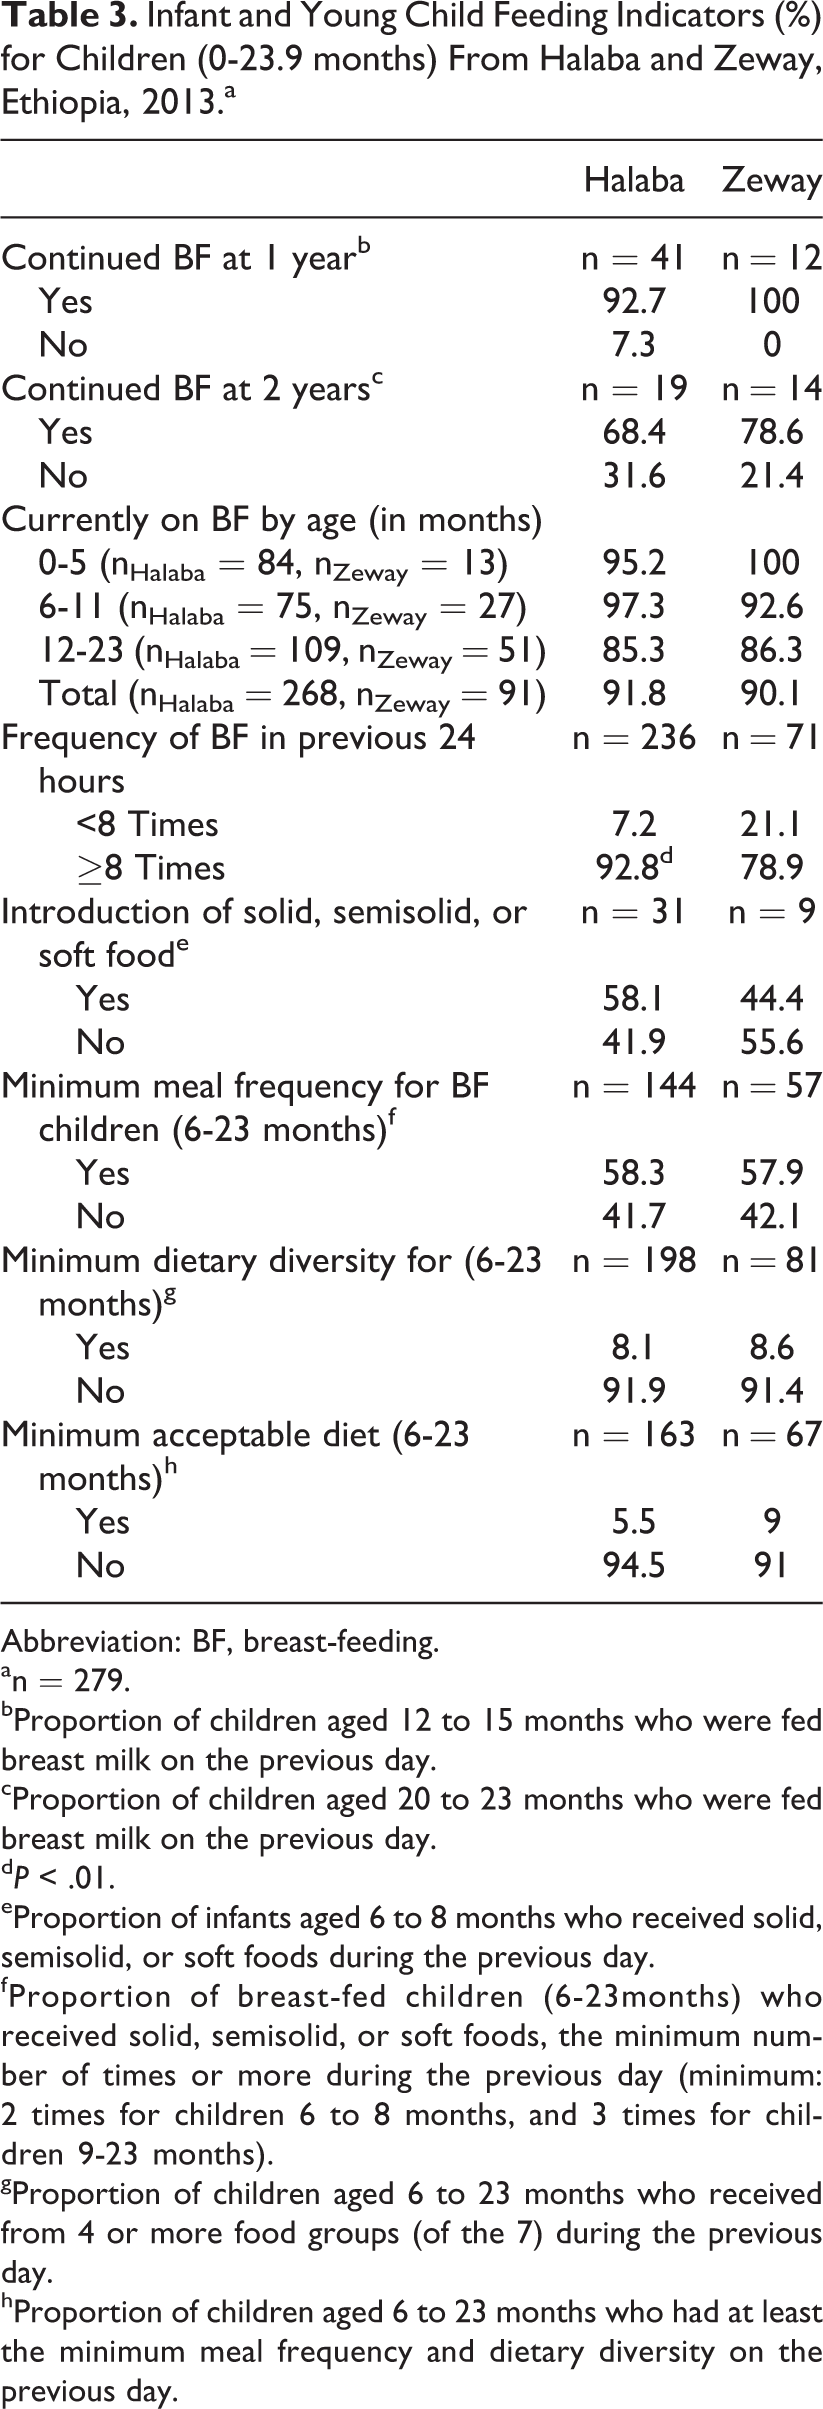
Table 2 summarizes some background characteristics and findings on breast-feeding practices of children aged 0 to 23.9 months. The gender contribution of the children was comparable in both communities. Birth weight for majority of children was not known. Almost all children were reported to have been breast-fed at least once in the 24 months preceding the interview. Also most mothers reported giving colostrum to their babies. Timely initiation of breast-feeding was significantly lower in Halaba (63%) compared with Zeway (92%) children (P < .001). High rates of EBF were also reported in both communities. Table 3 shows additional IYCF indicators. Continued breast-feeding was common at 1 year than at 2 years of age. Most children were still being breast-fed at the time of the study, and majority were breast-fed the minimum number of times (≥8) in the 24 hours preceding the interview—differences were significant between the communities (P < .01).
Characteristics for Children (0-23.9 months) and Breast-feeding Indicators From Halaba and Zeway, Ethiopia, 2013.a.
Abbreviations: BF, breast-feeding; SD, standard deviation.
aN = 383.
bProportion of children born in the last 24 months who were ever breast-fed.
cProportion of children who were put to breast within 1 hour of birth.
d P < .001.
eFirst milk (thick yellowish milk the mother produces for the first few days after birth).
fAny fluid/drink other than breast milk given to infants in first 3 days after birth.
gFeeding of breast milk only for children between 0 and 5 months of age (<183 days) calculated as proportion of infants 0 to 5 months who received only breast milk during the previous day.
Infant and Young Child Feeding Indicators (%) for Children (0-23.9 months) From Halaba and Zeway, Ethiopia, 2013.a
Abbreviation: BF, breast-feeding.
an = 279.
bProportion of children aged 12 to 15 months who were fed breast milk on the previous day.
cProportion of children aged 20 to 23 months who were fed breast milk on the previous day.
d P < .01.
eProportion of infants aged 6 to 8 months who received solid, semisolid, or soft foods during the previous day.
fProportion of breast-fed children (6-23months) who received solid, semisolid, or soft foods, the minimum number of times or more during the previous day (minimum: 2 times for children 6 to 8 months, and 3 times for children 9-23 months).
gProportion of children aged 6 to 23 months who received from 4 or more food groups (of the 7) during the previous day.
hProportion of children aged 6 to 23 months who had at least the minimum meal frequency and dietary diversity on the previous day.
Timely introduction of complementary food showed 58% and 44% prevalence in Halaba and Zeway children, respectively. Proportion of breast-feeding children 6 to 23.9 months who were getting solid or semisolid foods with minimum meal frequency was 58% in both locations. Only about 8% to 9% of these children received a complementary food that met WHO’s minimum dietary diversity of ≥4 food groups. Overwhelming majority did not get the minimum acceptable diet in either community.
Anthropometric Outcomes
Table 4 summarizes nutrition assessment based on anthropometric measurements. Mean LAZ was negative, significantly lower for Halaba than for Zeway and worse in the older age-group. Children aged 6 to 23.9 months scored significantly lower mean z scores for weight-for-age (−1.5 in Halaba and −1 in Zeway; P < .01) and negative scores for most other indicators except head circumference-for-age.
Anthropometric Measurements, Mean (SD), and Prevalence of Stunting, Wasting, and Underweight by Age-Groups for Children Aged Less Than 2 Years From Halaba and Zeway, Ethiopia, 2013.a
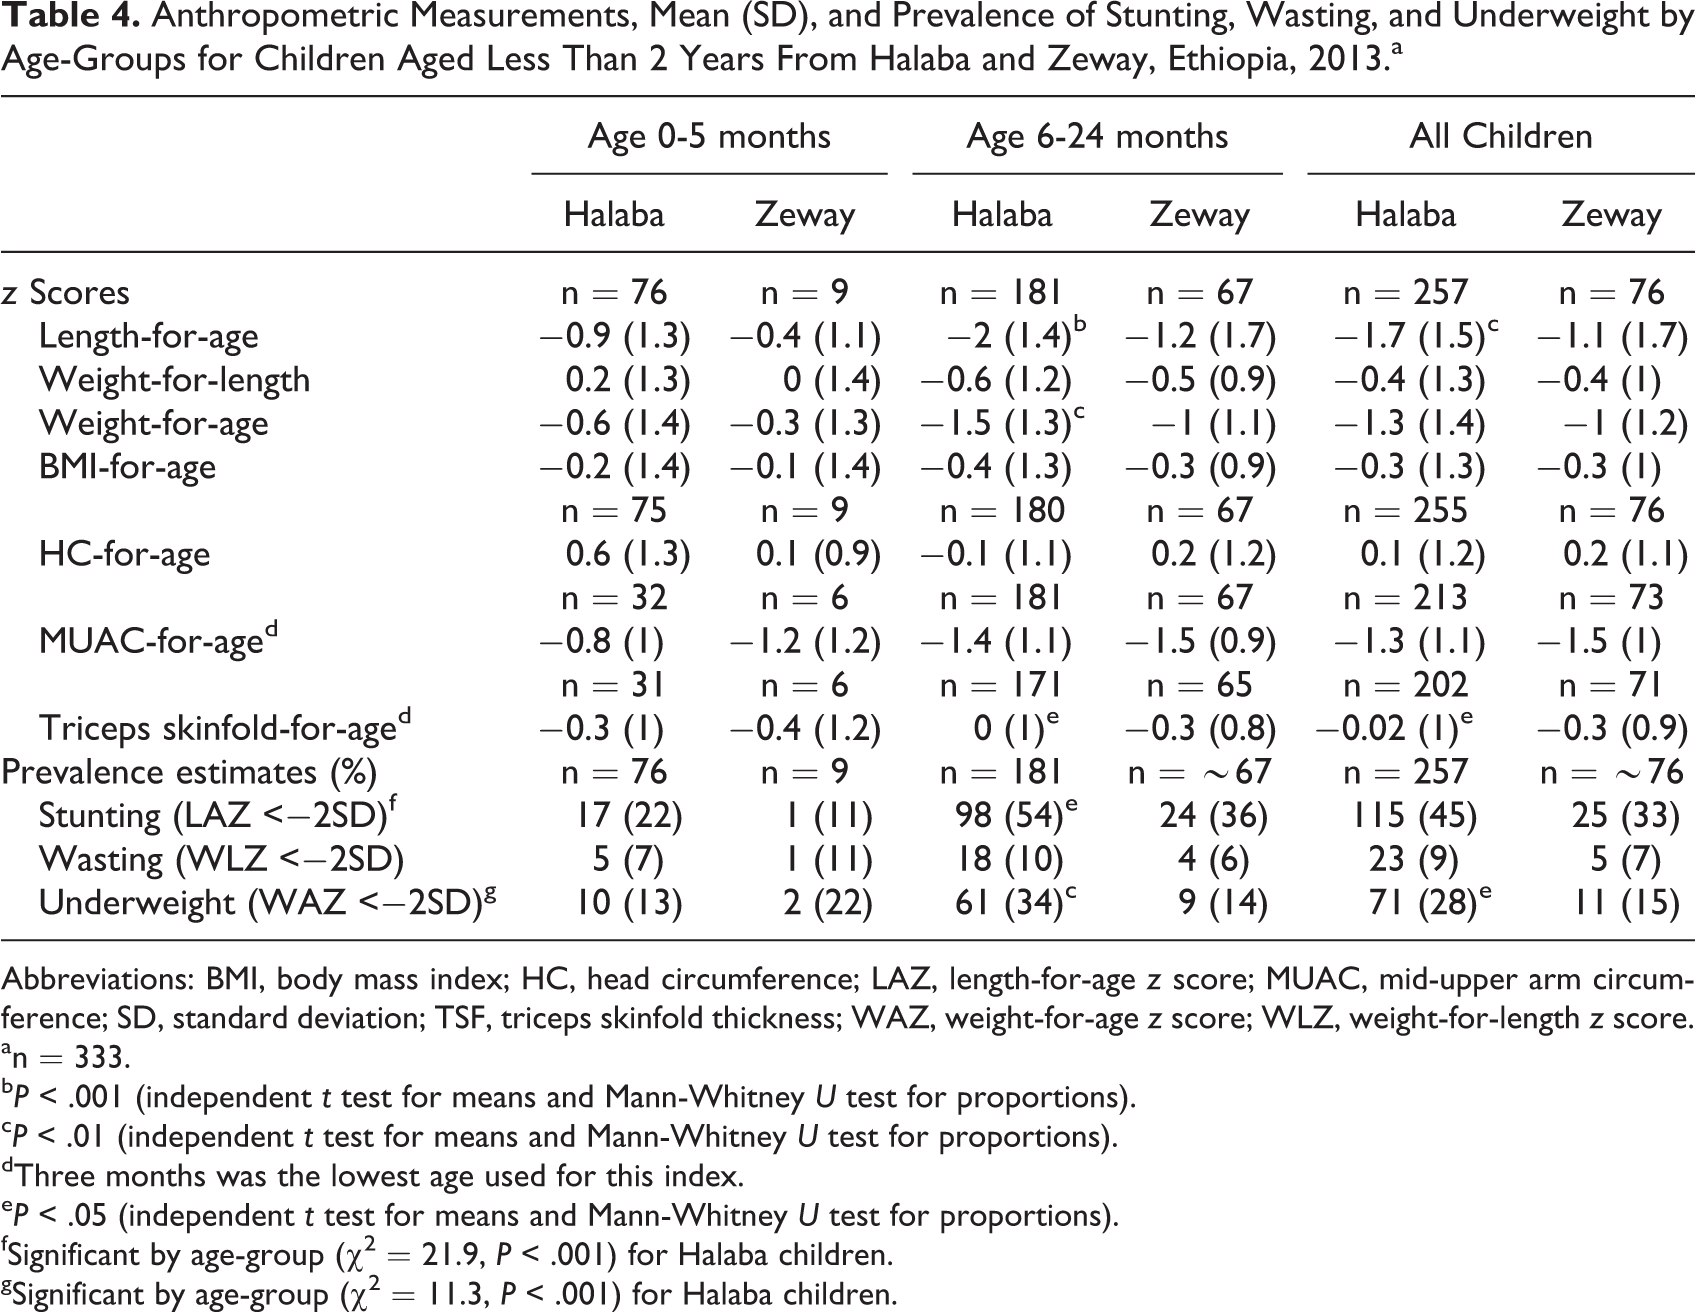
Abbreviations: BMI, body mass index; HC, head circumference; LAZ, length-for-age z score; MUAC, mid-upper arm circumference; SD, standard deviation; TSF, triceps skinfold thickness; WAZ, weight-for-age z score; WLZ, weight-for-length z score.
an = 333.
b P < .001 (independent t test for means and Mann-Whitney U test for proportions).
c P < .01 (independent t test for means and Mann-Whitney U test for proportions).
dThree months was the lowest age used for this index.
e P < .05 (independent t test for means and Mann-Whitney U test for proportions).
fSignificant by age-group (χ2 = 21.9, P < .001) for Halaba children.
gSignificant by age-group (χ2 = 11.3, P < .001) for Halaba children.
Overall prevalence of stunting was high or very high in either of our study community, particularly in Halaba and in the complementary feeding than the EBF age-group. Overall underweight rate was also significantly higher in Halaba than in Zeway children (P < .05). Also, both stunting and underweight were significantly higher (P < .05 and P <.01, respectively) in children aged 6 to 23.9 months, in Halaba than Zeway.
Dietary Diversity
The overall median DDS (Table 5) for all children was 2, and the lowest median DDS was for children 6 to 8 months, in both Halaba and Zeway. In either community, majority of the children fell under the “low” DDS class (ie, consumed only 0-2 food groups), and the proportions were highest in the younger children. Differences were not significant between study communities except in 6- to 8-month group, where 38.5% of Zeway children consumed from 3 to 4 food groups compared to 11% in Halaba (P < .05); also, proportions in low DDS class were lower in Zeway compared with Halaba (P < .05).
Dietary Diversity Scores (DDSsa), and Proportions of Halaba and Zeway Children in Different DDS Classes, Ethiopia, 2013.b
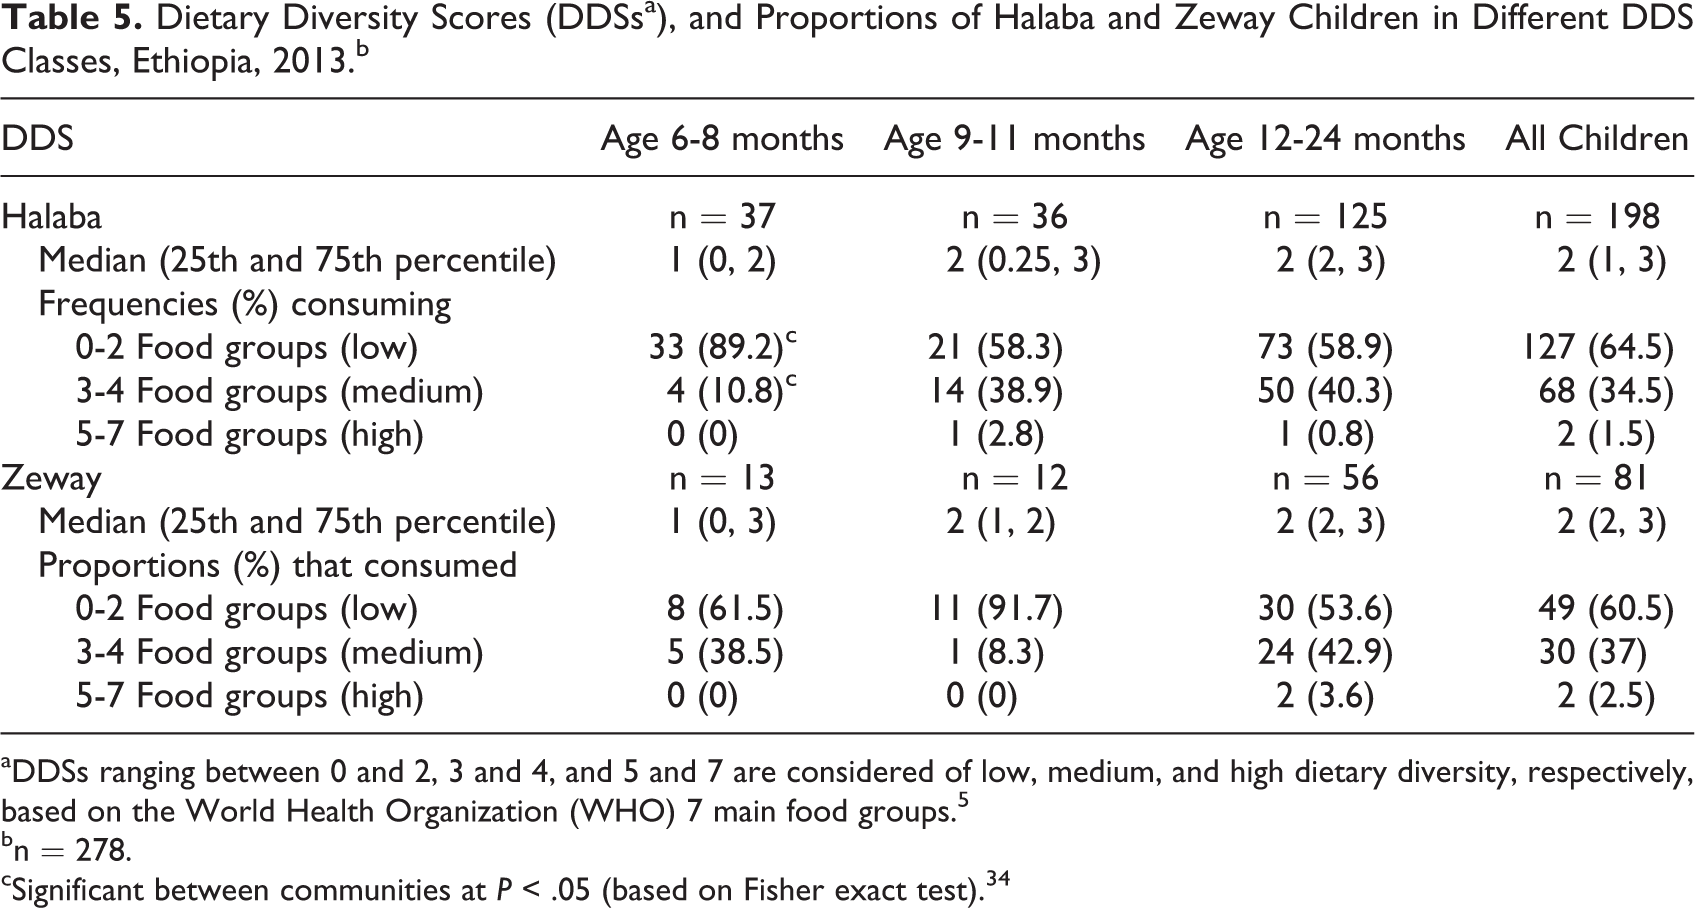
aDDSs ranging between 0 and 2, 3 and 4, and 5 and 7 are considered of low, medium, and high dietary diversity, respectively, based on the World Health Organization (WHO) 7 main food groups. 5
bn = 278.
cSignificant between communities at P < .05 (based on Fisher exact test). 34
Figure 2 shows which specific food groups, by age-group of children, were commonly used for complementary foods in the study communities. Accordingly, food groups consumed by more than 50% of the children in each age-group, in both Halaba and Zeway areas, were grains, roots, and tubers and other fruits and vegetables. Foods from legumes and nuts, and dairy products were consumed by nearly a quarter of children in both locations, except dairy products were consumed by significantly higher (37%) proportion of Zeway than Halaba (24%) children (P < .02). Consumption from flesh foods and vitamin-A-rich fruits and vegetables was very minimal or nonexistent.
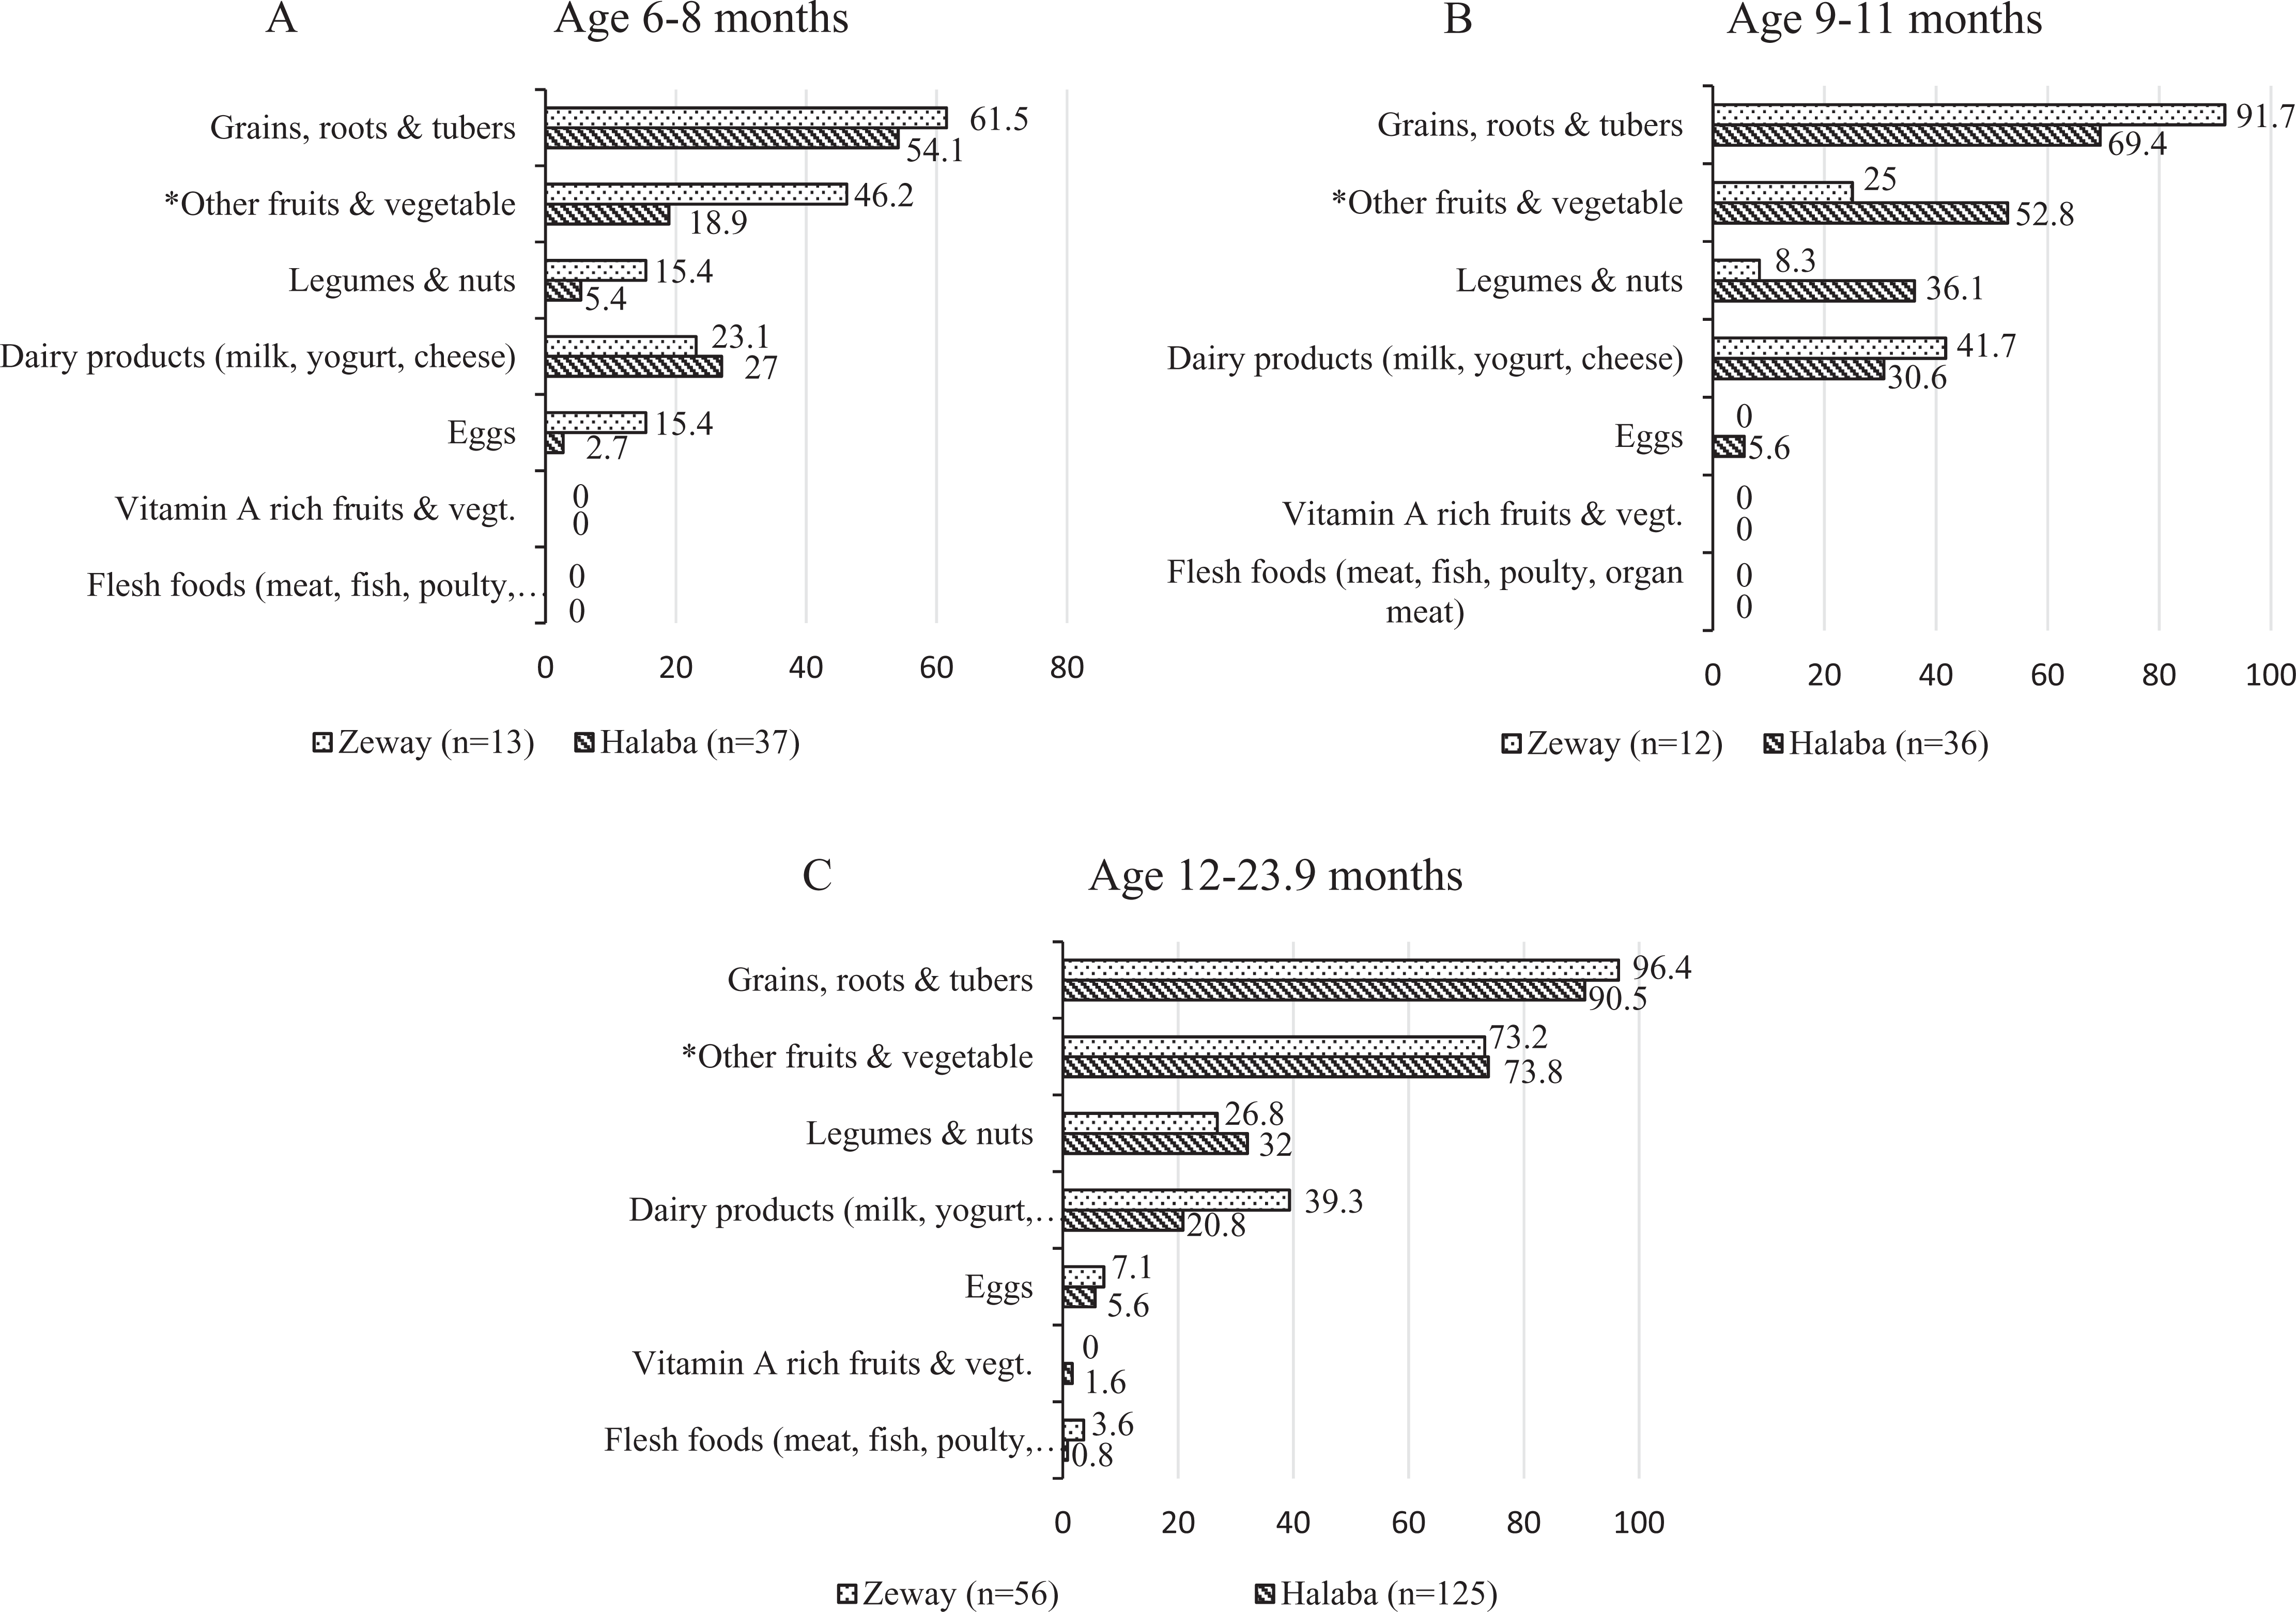
Proportions (%) of children by age-group (A, B, and C) consuming specific food groups based on single 24-hour recalls in rural Halaba and Zeway, Ethiopia. *The food consumed in this group is mostly Ethiopian kale, which is usually boiled and seasoned with salt, onion, and pepper for consumption with starchy staples (grains, roots, and tubers).
Dietary Intakes of Energy and Selected Nutrients From Complementary Foods
Table 6 summarizes the median (first and third quartiles) intake of energy and selected nutrients with associated nutrient density across age-groups and compared with “estimated needs” for breast-feeding children. In both communities, median values of protein were generally higher compared with the estimated needs for each age-group. Median intake of energy, iron, zinc, and calcium, and associated nutrient densities in both communities were lower than the expected estimated needs from complementary foods—the exception was iron in age-group 12 to 13 months, which was higher than the estimated needs. However, parametric and nonparametric independent sample tests did not show significant differences in intake between communities within each age category.
Median (First and Third Quartile) Energy and Selected Nutrient Intakes and Nutrient Density From Complementary Foods Compared With Estimated Needs of Children Based on Age.a,b
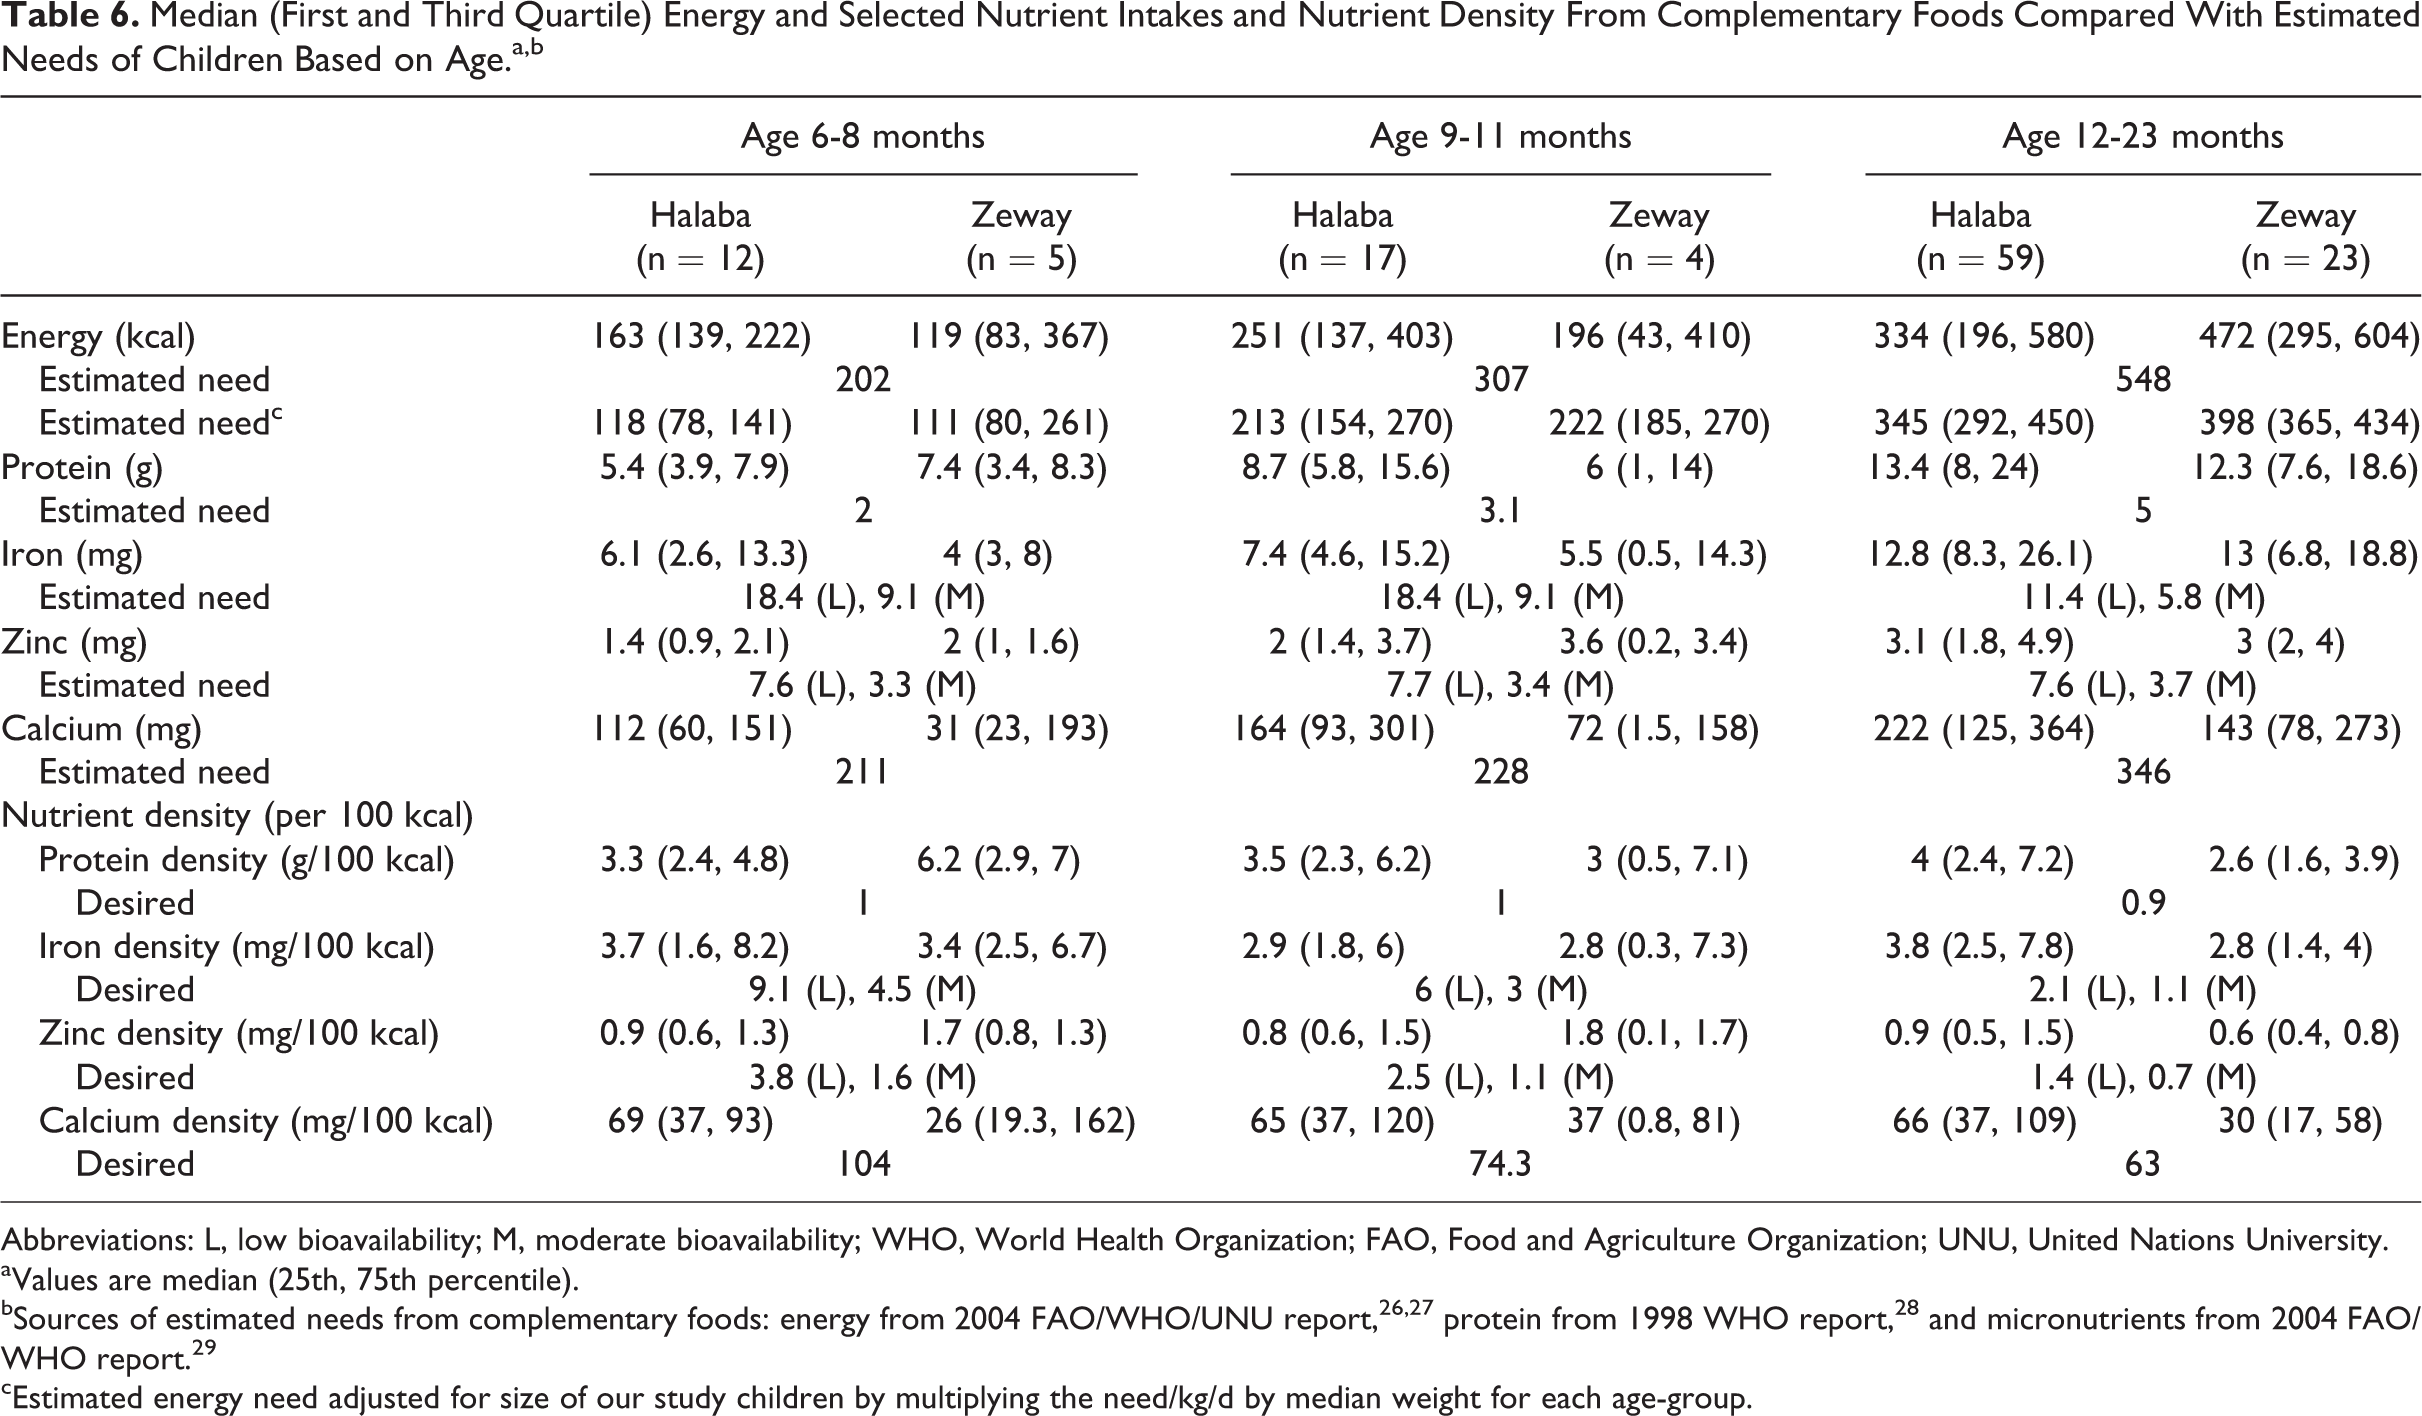
Abbreviations: L, low bioavailability; M, moderate bioavailability; WHO, World Health Organization; FAO, Food and Agriculture Organization; UNU, United Nations University.
aValues are median (25th, 75th percentile).
bSources of estimated needs from complementary foods: energy from 2004 FAO/WHO/UNU report, 26,27 protein from 1998 WHO report, 28 and micronutrients from 2004 FAO/WHO report. 29
cEstimated energy need adjusted for size of our study children by multiplying the need/kg/d by median weight for each age-group.
Our attempt to explore possible associations of stunting with background characteristics and feeding practices using logistic regression analysis did not show any significant association, with the exception of child age, both in bivariate and in multivariate analyses (result not shown).
Discussion
We found that several of the IYCF practices in these communities were suboptimal, falling short of many of the WHO recommendations. 3,5 Overall rates of stunting (45%) and underweight (28%) we found among Halaba children are levels WHO classifies as very high and high public health concerns, respectively. 34,35 We also found high (33%) stunting prevalence among children from Zeway area. These unacceptable high levels of child undernutrition we reported here may have been in part due to the suboptimal feeding practices prevalent in the study areas. However, high levels of undernutrition among children aged less than 2 years were also reported in past DHS 12,36,37 and other IYCF studies conducted elsewhere in the SNNPR. 8,9
Similar to the national and regional trends, 12 breast-feeding was a widely accepted practice as nearly all our study children (0-23.9 months) were breast-fed at some point in their lives. The high affirmative responses in both communities on giving colostrum to infants are encouraging as colostrum is nutritious and contains antibodies that help protect newborns from infection. 6 Better mean z score values were recorded for infants in the younger age-group (0-5 months), which perhaps supports the fact that children do better during the EBF period. Growth faltering is more pronounced, starting at 6 months of age. This is also the time complementary foods are introduced to meet the increased nutrient–energy demands of growing children but often fail to be adequate compared to the completeness of breast milk.
Significant proportion (37%) of mothers in Halaba did not initiate timely breast-feeding. A comparable proportion (33%) of mothers in SNNPR also did not initiate timely breast-feeding, according to DHS 2011. 12 This might have contributed to the overall higher undernutrition observed in Halaba children compared with rural Zeway, where 92% mothers initiated timely breast-feeding. Unlike the Halaba mothers in our study, another study in the adjacent district 17 reported 94% timely initiation of breast-feeding. However, similar to our finding, a breast-feeding study from Jimma area (southwest Ethiopia) 21 also reported 63% rate for timely initiation of breast-feeding; hence, our finding for Halaba was not a unique scenario. The high rates of EBF among infants 0 to 5 months reported here should be interpreted with caution due to the small sample and the indicator’s tendency to overestimate the outcome because it only considers current EBF status in infants. 5 Continuing breast-feeding up to 24 months or beyond is among key IYCF recommendation by WHO. We noticed larger drops in continued breast-feeding practices, going from year 1 to year 2 (25% in Halaba and 21% in Zeway; Table 3), compared with only 14% drop reported in the 2011 DHS, 12 indicating the need to educate adherence to IYCF guidelines in our communities.
Introduction of complementary feeding at 6 months for breast-feeding children is vital to support the rapid growth at this stage. The study by Tessema et al 17 showed that both early (before 6 months) and late (after 6 months) introductions of complementary foods to infants from Sidama communities were associated with higher likelihood of being stunted. Similar IYCF and child feeding studies in Guatemala, India, and Nepal 38 -40 have documented association of suboptimal feeding practices, among other factors, with poorer child nutritional outcome, particularly with stunting. The study by Gibson et al 18 elsewhere in SNNPR also showed impaired growth among children was associated with inadequate feeding practices. In our study, proportion of children aged 6 to 8 months in Halaba and Zeway fed with solid, semisolid, or soft foods was 58% and 44%, respectively, implying the need to strengthen nutrition education programs in these communities. However, due to the narrow age range (6-8 months) of the indictor, only a small number of children were used for calculating this indicator, and, as such, the result should be interpreted with care.
World Health Organization also recommends that breast-feeding children aged 6 to 8 months and 9 to 23 months should be fed solid, semisolid, or soft foods at least 2 times and 3 times a day, respectively, with minimum dietary diversity (ie, consumption from at least 4 food group). 5 In children of our study, significant proportions (42%) were not getting the minimum meal frequency and much more (92%) the minimum dietary diversity in either community.
Our supportive findings (Table 5) also showed a median DDS of just 2 in both communities, with highest proportions of the children being under low DDS group, according to Arimond and Ruel’s classification. 33 Children aged 6 to 8 months were worse, having the lowest median DDS and classed in the low DDS group, compared with older children. Grains, roots, and tubers and other fruits and vegetables were the food groups most relied up on (Figure 2), with minimal consumptions from other groups, especially of animal origin. This meant very few (5% in Halaba and 9% in Zeway) children of our study received the minimum acceptable diet, not much different from what were reported at regional (2.3%) and national (4%) levels in the 2011 DHS or earlier IYCF studies by Gibson et al 18 and Tessema et al. 17 We think the situation is very concerning in light of the country’s health extension program and the supportive IYCF work done by the Alive & Thrive phase 1 project 16 in the 5 to 6 years prior to our study. Reexamining or strengthening the existing nutrition education programs or the delivery strategies in our and similar communities may be of benefit.
Finally, the 1-day weighed food record analysis from a subsample (Table 6) showed that median protein intakes from complementary foods in either location were more than twice the recommendation by WHO. 27 Gibson et al 18 also documented median protein intake that were above the estimated needs across the age-groups of 6 to 8, 9 to 11, and 12 to 23.9 months. This might indicate protein intake from complementary foods may not be of concern for breast-feeding children in these communities. However, parallel to Gibson et al 18 findings and assuming low bioavailability, median intake of iron, zinc, and calcium in either of our study community, except iron for children in the older age-group, were a quarter or less (in Halaba) and less than half (in Zeway) of estimated needs. Deficiencies of these micronutrients, particularly zinc, are known to affect linear growth in children.
Unless diet qualities are improved, efforts to reduce the high prevalence of stunting in these areas may be challenged. The following could be some practical ways the diets of infants and young children could be improved in these 2 settings: Zeway community could take advantage of “Lake Zeway” to produce fruits and vegetables which, with proper nutrition/health education, can improve diet qualities of complementary feeding children. The Halaba communities could take advantage of the tradition of pulse agriculture, commonly produced for cash income, by retaining some of the produce for home consumption and/or using the proceeds generated from pulse sales to procure other nutritious foods (including fruits, vegetables, and animal source foods) for home consumption. Consumptions of animal source foods (flesh foods and egg) as well as vitamin-A-rich fruits and vegetables were very minimal at both locations; hence, the promotion of consumption from these food groups when possible should be encouraged. We also recommend strengthening the education of parents/caregivers on both complementary and optimal breast-feeding practices of children as part of the health extension package or through scaling up the work of Alive & Thrive.
The strength of this study was supplementing the self-reported IYCF practices, which may have been influenced by the behavior change communication messages from Alive & Thrive project or the country’s health extension program, with estimates of dietary intakes and anthropometric assessment. Given the implementation of national nutrition program since 2008, our findings can provide important feedback on IYCF practices to nutrition programs in the region. However, the observational nature of the study limits us from establishing cause and effect relationships. No repeated 24-hour dietary diversity recalls or weighed food record data were taken; therefore, values we reported do not represent usual intake of individual children, nor do they account for seasonal variations. Limited by the objective of the larger study to which the current study was a part, we had data only for analysis of energy, protein, and 3 minerals, and we were unable to analyze vitamin A and other micronutrients. The lack of meaningful association with other variables than child age may have been due to the limited variability in background characteristics and feeding practices and/or due to our small sample size. We believe repeating the study in different seasons, including analysis of all problem nutrients, may provide a more complete picture of IYCF practices in the areas without the confounding effect of seasonal variations.
Overall, this community-based study showed low diversity in the diet of infants and young children, where majority of them (60%-65%) consumed from 0 to 2 food groups. Many of the core and optional IYCF practices were suboptimal. Median intakes of selected micronutrients (zinc, iron, and calcium) from complementary foods were below estimated needs. We also reported unacceptably high levels of stunting and medium to high levels of underweight among the children. The observed very high levels of child stunting and suboptimal IYCF practices, as well as the low DDS and median intakes of nutrients from complementary foods, indicate a need to improve and strengthen nutrition service delivery for complementary-feeding children in rural communities of Halaba and Zeway areas, Ethiopia. We believe the findings and the recommendation are generalizable to other similar rural communities in the respective regions.
Footnotes
Acknowledgments
The research was supported by the International Development Research Centre (IDRC) and the Department of Foreign Affairs Trade and Development (DFATD), Government of Canada, through the Canadian International Food Security Research Fund (CIFSRF). We also acknowledge the technical support offered by University of Saskatchewan and Hawassa University in their collaborations for the implementation of the CIFSRF project. The participation of the data collectors, as well as the mothers and their young children, is greatly appreciated.
Declaration of Conflicting Interests
The author(s) declared no potential conflicts of interest with respect to the research, authorship, and/or publication of this article.
Funding
The author(s) received no financial support for the research, authorship, and/or publication of this article.