
Abstract
Background:
Despite the importance of dietary diversity for nutritional status, studies on issues surrounding ethnicity and dietary diversity in developing countries are limited.
Objective:
We analyzed cross-ethnic differences in dietary diversity and examined the roles of gender and household socioeconomic status (SES) in 3 Indonesian ethnic groups with different kinship systems: Javanese (bilateral), Batak (patrilineal), and Minangkabau (matrilineal).
Methods:
Data were from the Indonesian Family Life Survey 2000-2015 that consisted of 6478 school-aged children (7-12 years of age) born to 3878 mothers. The children’s dietary diversity was measured using a Berry-Index. We used cluster-robust multivariate linear regression models.
Results:
Gendered dietary diversity occurred for ethnic groups with unilineal kinship but was less evident for ethnic with bilateral kinship. Batak and Minangkabau girls, rather than boys, had higher dietary diversity because boys from these 2 ethnic groups consumed low-status foods (eg, tubers and vegetables) less often. Household SES influenced ethnic-related dietary diversity differently, perhaps because of food culture. Batak children from lower SES households consumed fruits and dairy products less often, most likely to enable them to consume the pricier but culturally preferable animal-source foods. This lowered their dietary diversity.
Conclusion:
The overall results indicate gendered and household SES-related effects of ethnicity on dietary diversity. Nutrition interventions targeting boys should be on policy-makers’ agendas. Boys should be advised to consume healthy low-status foods more often to improve their dietary diversity. The Batak case shows that children from lower SES backgrounds should depend less on the pricier foods to enable them varying their diet better.
Introduction
Children who consume a wide variety of foods are found to have better nutritional status than those who have a monotonous diet. This fact has been shown for different age-groups in diverse contexts: for 6 to 23 months old in 7 countries (Ethiopia, Mali, Rwanda, Zimbabwe, Cambodia, Nepal, and Colombia), 1 for children aged 6 to 59 months in Kuotiala (Mali), 2 and for children aged 6 to 12 years in 2 regions in India. 3 This suggests that dietary diversity is an important determinant of child nutritional status.
Despite its importance, practicing dietary diversity in everyday life is not without challenges. Gender and socioeconomic status (SES), for example, may alter children’s dietary diversity through intra- and interhousehold bias in food allocation. In the patrilineal societies of South Asia, where men tend to have a higher status, discrimination against girls and young women in food allocation is not unusual, probably because female contribution to the household economy is perceived to be low. Bose 4 and Das Gupta 5 reported that Indian girls consumed pricier high-status foods such as animal-source foods (eg, meat, fish, and eggs) and dairy products (eg, milk) less often than boys. Recently, Aurino 6 found gender gaps in milk and meat consumption disfavoring school-aged and adolescent Indian girls. In Nepal, adolescent girls and young women ate last 7 and, in Hindu communities, they even had to content themselves with the leftover food. 8 Such discriminations limit female access to nutritious foods and thus may put their diet quality at risk.
Studies in developed countries have shown that dietary quality, of which dietary diversity is the main component, differs by SES. Darmon and Drewnowski 9 found that, because of their limited financial resources, low-SES individuals have a reduced access to healthy, nutrient-dense foods (eg, whole grains, lean meats, fish, low-fat dairy products, fresh vegetables, and fruits) compared to high-SES individuals. Turrell et al 10 found that low-income households in Australia, regardless of the educational level of the household head, were less likely to purchase foods that are high in fiber and low in fat, salt, and sugar. The evidence indicated differential food access by SES may cause low-SES household members to consume a lesser variety of foods.
In the current literature, gender bias in dietary diversity has been studied mostly in South Asian societies where patrilineal kinship prevails. 7,8 Furthermore, socioeconomic differences in dietary diversity have not been examined thoroughly for developing countries. 9,10 This study extends previous literature on food consumption by assessing how dietary diversity in a developing country differs across ethnic groups with different kinship systems and by analyzing how gender and household SES may influence dietary diversity differently for different ethnic groups.
Indonesia is an appropriate site to study such a topic because the developing country is home to multiple ethnic groups with a wide spectrum of kinship systems and food cultures. We used food consumption data from 3 most recent waves of the Indonesian Family Life Survey (IFLS) over the period 2000 to 2015 to compare the dietary diversity of school-aged children (7-12 years of age) born to mothers in 3 ethnic groups with different kinship systems: the bilateral Javanese, the patrilineal Batak, and the matrilineal Minangkabau. We also examined the extent to which gender inequality and household SES affect dietary diversity across these ethnic groups.
This article continues with a brief review of the Indonesian context, focusing on the gender norms, kinship systems, and food cultures of the Javanese, the Batak, and the Minangkabau. We then state our hypotheses before describing the data, measures, and methods. Then, we describe our results. We conclude the article with a discussion of the main findings and their significance for theory building and policy-making.
The Indonesian Context: Gender Norms, Kinship Systems, and Food Culture
Located in Southeast Asia, Indonesia is the world’s fourth largest country in terms of population, with over 250 million people. 11,12 Although Indonesia is an emerging middle-income country, malnutrition, including stunting, is still prevalent, affecting more than 37% of children younger than 5 years of age in 2013. 13 The trend continues into adolescence, and, surprisingly, boys have a lower nutritional status than girls at this life stage. 13,14 During the New Order regime (1966-1998), the National Family Planning Program was established to accelerate economic growth. The program promoted the norm of the small, happy, and prosperous family. 15 Interestingly, its slogan “Two children are enough, whether boys or girls” emphasized not only the small family but also the equality of sons and daughters, in this way attempting to inculcate an egalitarian gender norm. 16
There are more than 1300 ethnic groups living in Indonesia. 11,12 These ethnic groups vary immensely in kinship systems, ranging from the patrilineal Batak, to the bilateral Javanese, and the matrilineal Minangkabau. 17,18 The 3 ethnic groups are the main interest in this study. The Javanese is the largest ethnic group in Indonesia, while Batak is the fourth largest, and Minangkabau is the seventh largest. These ethnic groups comprise 40.06%, 3.58%, and 2.73% of the Indonesian population, respectively. 11,19
Kinship systems govern how gender is stratified within society. Among the patrilineal Batak, for whom inheritance of property and family name are patrilineal, 20 daughters retain no rights in their father’s house once married. As Batak people are traditionally virilocal, married daughters have to enter their husband’s clan and live with the husband’s family, where their status as a daughter-in-law is low. This is different from the bilateral Javanese whose daughters experience a relatively more equal position to sons. The lineage of the father and mother are equally important for the Javanese. 21 Daughters also receive inheritance rights. 22 Given the absence of strict residence rules in their kinship system and influenced by the vast development in Java, the Javanese tend to establish their new household apart from the parental household after marriage (neo-locality). This also contributes to a better position within the household for Javanese married daughters.
In contrast to the other 2 ethnic groups, the social system of the matrilineal Minangkabau is rather enigmatic. Their inheritance of property, family name, and traditional place of living after marriage are determined by the mother’s lineage. However, Minangkabau communities are not completely matriarchal. 18,23 Matrilocality gives senior women the highest authority within the household, but males dominate leadership in the public domain and in religious positions. 23,24 The high status of males in the public sphere conforms with Islam: the dominant religion of the Minangkabau. 11 The “small family” norm of the National Family Planning Program causes many new Minangkabau families to live separately from their matrikin. 18,24 Such neolocal households reduce the authority of senior women and increase the bargaining power of the father of the conjugal family. The tradition of outmigration (called merantau) is common among young Minangkabau males, giving them the means to prove their worth and to improve their position within their ethnic group. 11,17
The 3 ethnic groups have different food cultures. The Batak’s Jambar-Juhut tradition, which regulates how to share meat at cultural events (eg, birth, marriage, and death ceremonies), 25 leverages the importance of animal-source foods among the Batak who often consume cassava leaf along with fish-based dishes (arsik) and meat-based dishes (saksang). The Javanese’s daily diet traditionally includes a lot of vegetables, such as salads with peanut sauce (pecel) and fermented soybean or tempe. People in Java stigmatize cassava negatively as a low-status food and a symbol of poverty. 26 The Minangkabau diet is similar to that of the Batak but with less importance placed on animal-source foods in their tradition. Their famous meat dish, rendang, was historically created to preserve animal-source foods for the long Haj journey. 27 The Minangkabau usually consume rendang along with a small portion of steamed cassava leaf.
Hypotheses
We formulate 3 hypotheses. First, as the Batak and the Minangkabau diets consist of more meat than the Javanese diet, such ethnic-related food cultures may cause differences in dietary diversity between ethnic groups. This leads to our first hypothesis: Dietary diversity differs by ethnic group (Hypothesis 1).
Second, we expect that, particularly among the Batak, conformity to male high status may favor the allocation of the pricier high-status foods to boys in a similar way as in the patrilineal South Asian societies. Therefore, our second hypothesis is: Gender inequality in dietary diversity occurs among the patrilineal Batak, where Batak girls have a lower dietary diversity than boys (Hypothesis 2).
Third, the positive association between SES and dietary diversity may also apply to Indonesia. 9,10 However, given the divergent ethnic-related food cultures, SES effects on dietary diversity may vary across ethnic groups. Animal-source foods are central in the Batak tradition, and therefore, the Batak perhaps spend their money more on meat regardless of SES and even though meat is expensive in Indonesia. 28 This could limit spending on other food types among lower SES Batak households, potentially reducing their children’s dietary diversity. We devised our third hypothesis as follows: The association between household SES and dietary diversity varies between ethnic groups. Batak children from lower SES households might have a lower dietary diversity than those from higher SES Batak households (Hypothesis 3).
Methods
Data were derived from the IFLS: the largest ongoing household panel survey on socioeconomic and health conditions in Indonesia. 29 The first IFLS was conducted in 1993/1994. Subsequently, 4 follow-up surveys were carried out in 1997/1998, 2000, 2007/2008, and 2014/2015. The IFLS sampling scheme encompassed the 13 most populated provinces in Indonesia, representing 83% of the national population in 1993. The original IFLS-1 (1993/1994) interviewed 7224 households. In the later survey iterations, data from newborns and split-off households of these original households were also collected. Any possible bias resulting from data attrition is minimum because the IFLS has high follow-up rates; 92% of IFLS-1 (1993/1994) households participated in IFLS-5 (2014/2015).
Ethical Consideration
Indonesian Family Life Survey data are accessible from the RAND Corporation website. The data are open access for registered users. According to RAND, Institutional Review Boards (IRBs) in the United States (at RAND) and in Indonesia at the University of Gadjah Mada have reviewed and approved the IFLS-3 (2000), IFLS-4 (2007/2008), and IFLS-5 (2014/2015) surveys and procedures. These are the survey waves used in this study. RAND stated that all requirements for consent for adults and children were met and approved by the 2 IRBs prior to fieldwork.
Data Sample
A total of 83 770 individuals participated at least once in the IFLS surveys. However, only 20 261 of them have ever been interviewed at school age (age 7-12 years). We further excluded a number of children from this initial sample for a number of reasons. First, information on food consumption is available only from IFLS-3 (2000) onward. Therefore, 4688 children were excluded because they were interviewed before IFLS-3 (2000). Another exclusion of 218 children followed, because their information on food consumption was incomplete or missing. Second, not all mothers reported which ethnic group primarily influenced their daily household activities. Interethnic marriage probably made such a question difficult to answer. 17 For this reason, this study excluded 1844 children for whom data on ethnicity was missing. Third, the interest of this study is on Javanese, Batak, and Minangkabau children. Thus, we excluded 6833 children born to other ethnic groups. Fourth, additional variables that were included in the analyses reduced the sample further. We excluded 198 children because of missing data on household SES and another 2 children because of missing data on the mother’s education. As a result, the final sample consisted of 6478 children born to 3878 mothers.
Outcome Variables
Starting from IFLS-3 (2000), the IFLS collected data on the number of days on which a child consumed a certain food type in the week before the interview. These were the only food consumption data available in IFLS at individual level. The data collection was carried out in a household setting, where mothers of children younger than 11 years old usually answered the questions. 29
Ten food types were surveyed in IFLS-3 (2000) and IFLS-4 (2007/2008): tubers, eggs, fish, meat, dairy products, green leafy vegetables, banana, papaya, carrot, and mango. The later IFLS-5 (2014/2015) added consumption of 7 contemporary food types: instant noodles, fast-food, soft drinks, hot chilli, fried snacks, rice, and sweet snacks. Most indexes of dietary diversity consider only healthy food types. 30 As the healthiness of those 7 contemporary food types is questionable, we used only the first 10 food types grouped into 5 food groups: (1) tubers; (2) vegetables (green leafy vegetables and carrot); (3) fruits (banana, papaya, and mango); (4) animal-source foods (eggs, fish, and meat); and (5) dairy products.
We designated the highest number of days of consumption of a certain food type from each food group as food consumption frequency. We then harmonized the food consumption frequency measure in IFLS-3 (2000) to a continuous scale similar to that of the later IFLS waves: did not consume = 0; 1 day = 1; 2 to 3 days = 2.5; 4 to 6 days = 5; every day = 7. From these food consumption frequency data, we computed the main outcome variable—dietary diversity.
There is little consensus on how to measure and operationalize dietary diversity because of differences in the number of food groups, the reference periods, and the calculation approaches. 30,31 The methods to validate the dietary diversity index are also far from being homogeneous. 31,32 As we had a limited number of food groups (5) and a 7-day reference period for food consumption frequency, we decide to use a Berry-Index score to measure dietary diversity. This decision was made because this index considers not only the number of food groups (count index) but also the evenness of consumed food groups (distribution index). 30 We were unable to validate the Berry-Index score against nutrient adequacy because there were no data on the portion size of foods that the children consumed. Therefore, we have to rely on external criteria to validate the Berry-Index score. 32 Table A1 shows a significant positive correlation between our proposed Berry-Index score and child’s nutritional status (height-for-age Z-scores), thus indicating some degree of validity in the Berry-Index score.
The basic Berry-Index formula is BI = 1 – Σsi2, where si is the share of consumed food i to the total dietary intake. 30,33,34 We define si as equal to ni/Σni, where ni is the food consumption frequency of food group i. The Berry-Index score varies from 0 to 0.8, with a higher Berry-Index score meaning higher dietary diversity. The food consumption frequencies ni of the 5 food groups are additional outcome variables to understand the children’s dietary composition.
Explanatory Variables
Three sets of explanatory variables were used: ethnic group, gender, and household SES. For ethnic group, we constructed a set of dummy variables indicating Javanese, Batak, and Minangkabau. The dummy for gender was based on the child being either a boy or a girl. We calculated the nominal Personal Consumption Expenditure (PCE) from IFLS data based on Witoelar. 35 We normalized the nominal PCE to a real PCE by taking average prices in Jakarta, the capital city, in 2014 as the baseline. We used real PCE in million Rupiah (1 million Rupiah = US$83.77 in 2014) as an indicator for household SES.
Control Variables
Several control variables were included to correct for potential confounders: (1) child’s age, (2) mother’s education, (3) household composition (sibling size, birth order), (4) food supply (urban/rural, Java-Bali/outside Java-Bali, and dry/rainy seasons), and (5) IFLS fixed-effects. First, we used the child’s age to control for age-related differences in the portion size and the types of food consumed. Second, better-educated mothers might also be able to influence their children’s eating behavior more. 14,36 For this reason, we used the mother’s completed years of schooling (0-12 years) as a control variable. Third, sibling size and birth order might affect intrahousehold food distribution and interhousehold food selection. 37 We included both sibling size (on a continuous scale) and birth order (as dummies) to control for household composition. Fourth, food supply may differ by the child’s place of residence and seasonality. 38,39 This study used residential area (urban vs. rural, Java-Bali vs outside Java-Bali) and seasonality (interviewed in the dry season: May-October vs the rainy season: November-April) as control variables for food supply. Indonesian Family Life Survey fixed-effects, which are dummies indicating the IFLS waves, were included to control for time-variant factors including, but not limited to, macro-level dietary transitions. 40
Analysis
We employed a series of multivariate regression models. We started with a basic regression model specified as follows:
where Yi is the Berry-Index score and food consumption frequencies of child i, ethnici is a vector for the ethnic group dummies, sexi is the child’s gender, PCEi is real PCE, Xi is a vector of the control variables, and residuals ∊i. Model 1 evaluated the main effects of ethnic group dummies on dietary diversity, testing Hypothesis 1 on ethnic group differences in dietary diversity adjusted for sexi, PCEi, and control variables Xi.
In Model 2, we interacted ethnici and sexi. This model tested our Hypothesis 2 about gender differences in dietary diversity by ethnic group.

In Model 3, we then interacted ethnici and PCEi and tested Hypothesis 3 on SES differences (PCE) on dietary diversity by ethnic group.

This study used multivariate linear regression models to estimate Models 1 to 3. As children were nested within the same mother, we used cluster-robust standard errors at the mother level to correct for clustering among children born to the same mother. To show clearly the main effects of ethnic groups and the moderating effects within each ethnic group by gender and PCE, we used 3 figures: (1) predictive margins of dietary diversity by ethnic groups (Model 1), (2) marginal contrasts of dietary diversity by ethnic × sex (Model 2), and (3) marginal effects of dietary diversity by ethnic × PCE (Model 3). In the figures, we assigned labels only for margins that were significant (at least P value <.05). The regression tables for calculating linear combinations of these margins and the complete tables of the margins we used to create the figures are provided in the appendices (see Tables A2 -A7).
Results
Table 1 presents the sample descriptive statistics. Unadjusted analysis of variance and χ2 tests were used to explore differences in sample characteristics by ethnic group. Except for seasonality and IFLS waves, other characteristics in Table 1 varied significantly by ethnic group (P value <.05). Javanese children had a slightly higher average Berry-Index, indicating a marginally higher dietary diversity than the other 2 ethnic groups. Batak children’s diet consisted more often of vegetables (5.33 days per week) and animal-source foods (5.59 days per week) than the other 2 ethnic groups. However, compared to the Javanese, they consumed fruits (1.90 days per week) and dairy products (1.55 days per week) less often, whereas Minangkabau children consumed tubers (0.63 days per week) and vegetables (3.41 days per week) less often. The average nutritional status (height-for-age Z-scores and body mass index-for-age Z-scores) was below the median of the World Health Organization (WHO) growth standards, indicating that children from all 3 ethnic groups were undernourished. The Batak children suffered most from a long-term nutritional problem, as their average height-for-age Z-score was very low (−1.81 SD). Unlike children from the other 2 ethnic groups, the majority of Batak children lived in a rural area (58.49%). More boys than girls were interviewed, particularly for the Minangkabau (boys = 56.54%). On average, Batak children were slightly older (10.08 years) and born to a larger family (average sibling size = 3.40) with a lower average SES (real PCE in million Rupiah = 1.03) than the other 2 ethnic groups. Similar to those of the Minangkabau, mothers of Batak children spent almost 1 year more in school than the Javanese mothers did (Batak vs Javanese: average mother’s education = 7.40 vs 6.52 years).
Sample Characteristics.a
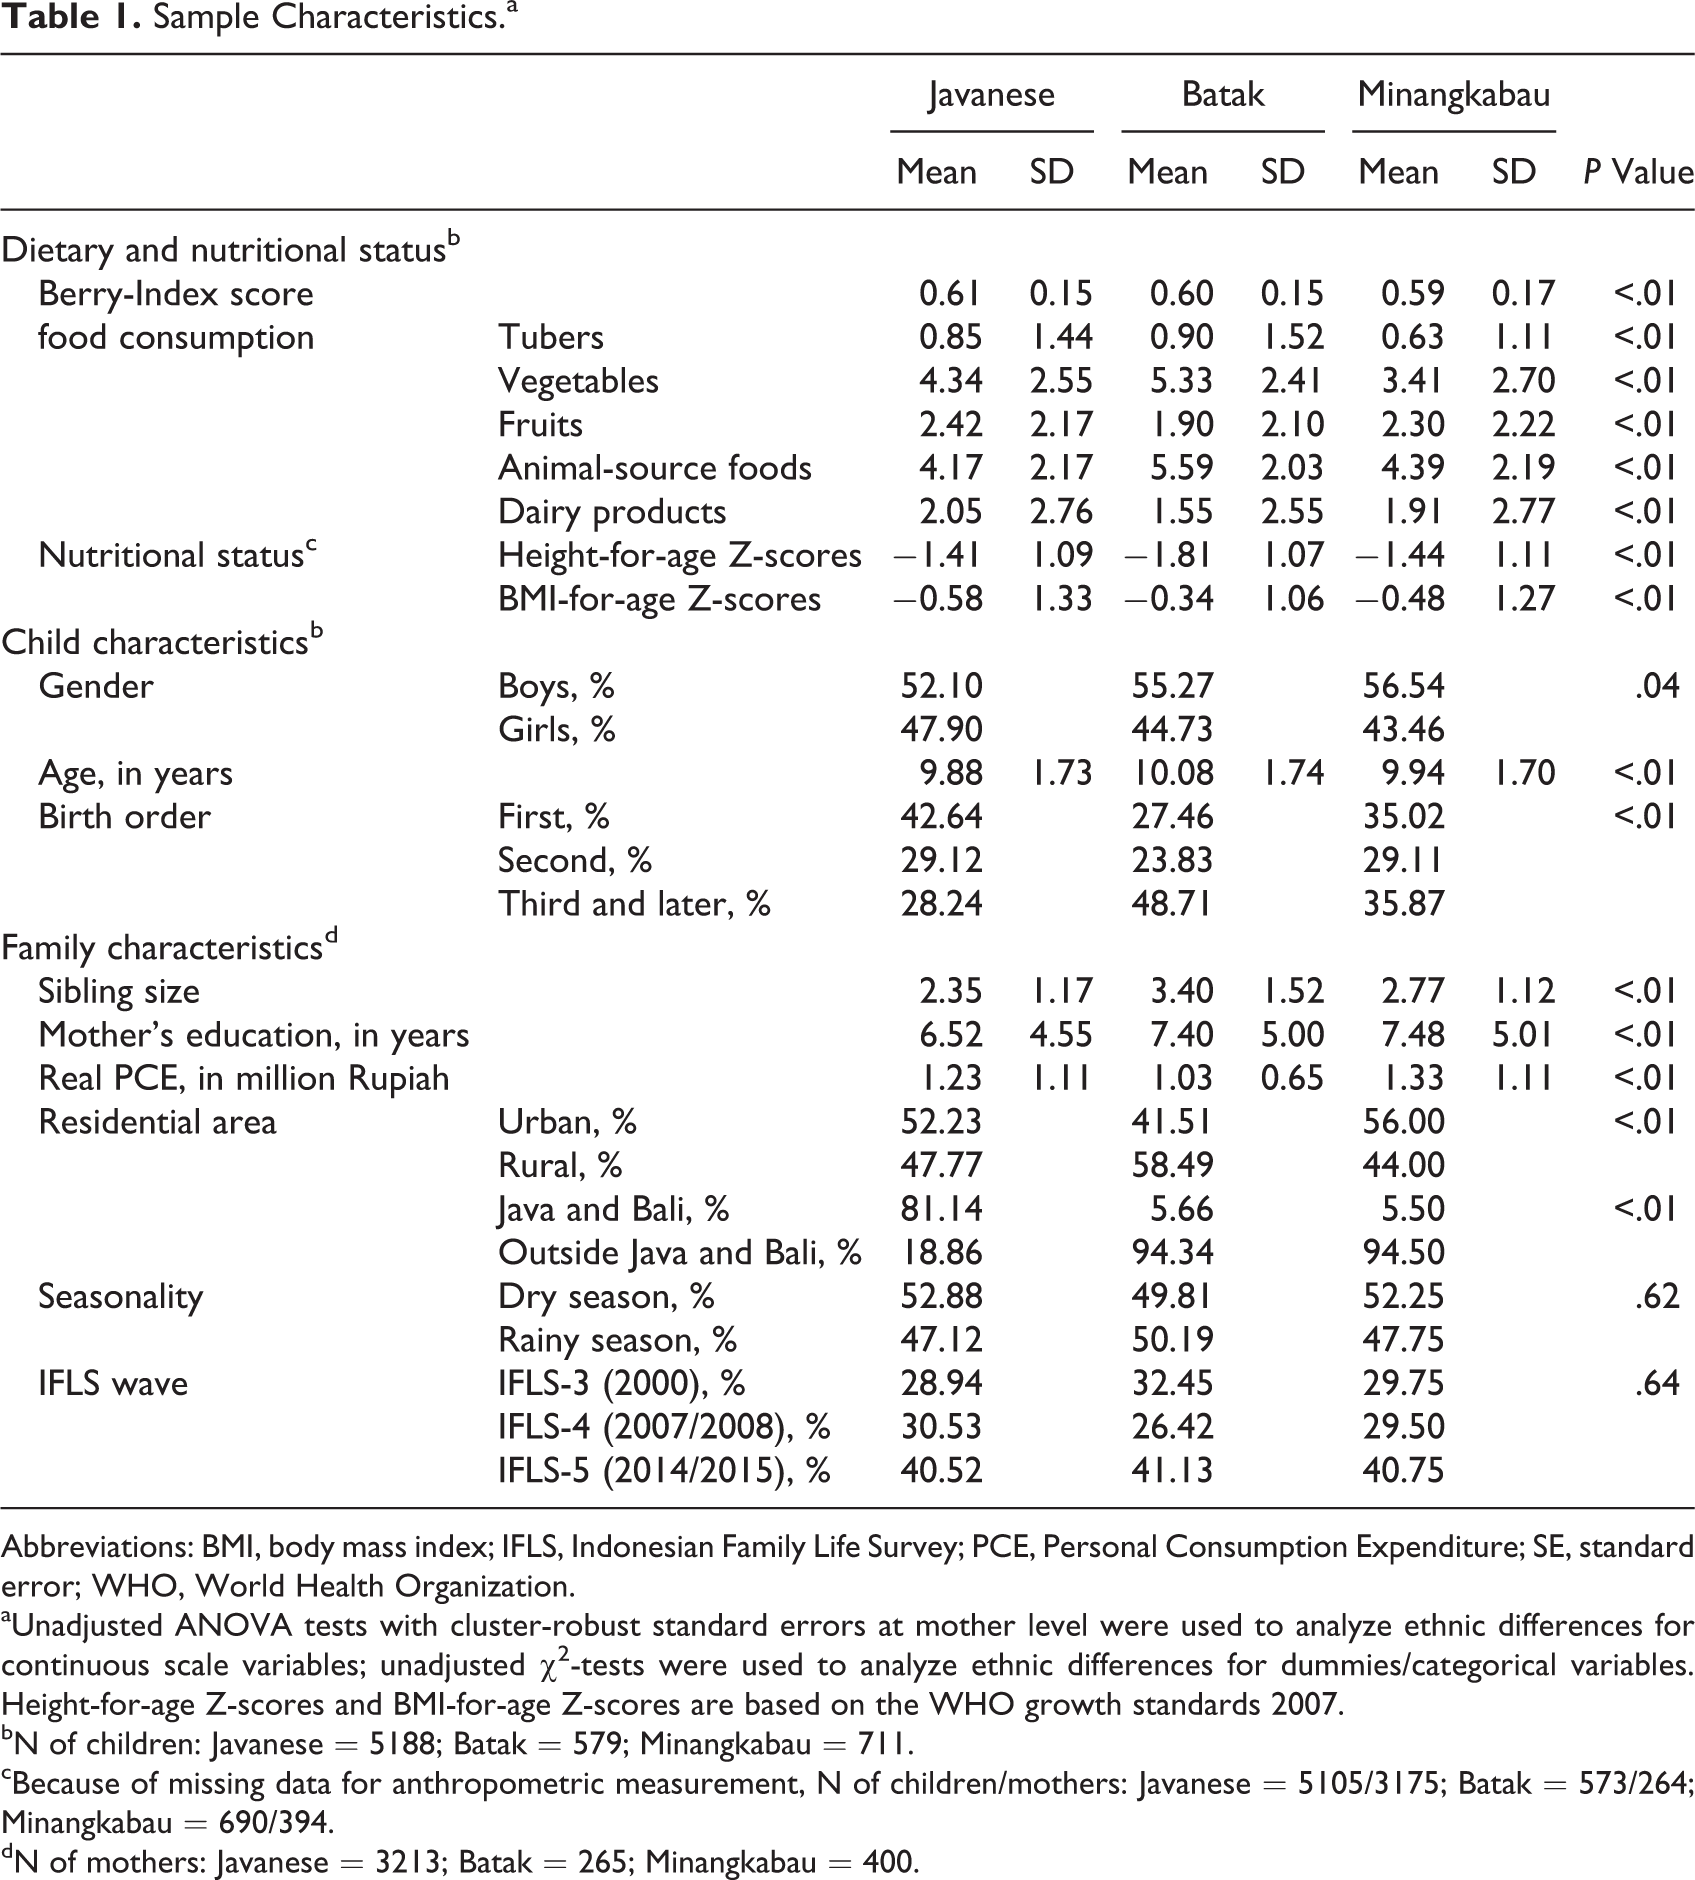
Abbreviations: BMI, body mass index; IFLS, Indonesian Family Life Survey; PCE, Personal Consumption Expenditure; SE, standard error; WHO, World Health Organization.
aUnadjusted ANOVA tests with cluster-robust standard errors at mother level were used to analyze ethnic differences for continuous scale variables; unadjusted χ2-tests were used to analyze ethnic differences for dummies/categorical variables. Height-for-age Z-scores and BMI-for-age Z-scores are based on the WHO growth standards 2007.
bN of children: Javanese = 5188; Batak = 579; Minangkabau = 711.
cBecause of missing data for anthropometric measurement, N of children/mothers: Javanese = 5105/3175; Batak = 573/264; Minangkabau = 690/394.
dN of mothers: Javanese = 3213; Batak = 265; Minangkabau = 400.
Figure 1 depicts predictive margins for cross-ethnic differences in dietary diversity, adjusted for sexi, PCEi, and control variables (see Tables A2 and A3). The main interest is to test Hypothesis 1: differences in dietary diversity by ethnic group (between ethnic groups). With Javanese children as the reference group, the difference in the Berry-Index score was less evident for the Batak but obvious for the Minangkabau (b = −0.031; P value < .01). The adjusted predictive margins for food consumption frequency are similar to Table 1 except for the level-off consumption of dairy products (within ethnic group: Javanese = 1.993; Batak = 2.007; Minangkabau = 1.918). The level-off consumption of dairy products may indicate a linkage between dairy products consumption and household SES. Figure 1 shows that Batak children consumed vegetables (b = 0.436; P value <.01) and animal-source foods (b = 1.204; P value <0.01) more often than the Javanese did. However, compared to the Javanese, Batak children consumed fruits (b = −0.460; P value <.01) less often, whereas Minangkabau children consumed tubers (b = −0.241; P value <0.01) and vegetables (b = −1.336; P value <.01) less often.
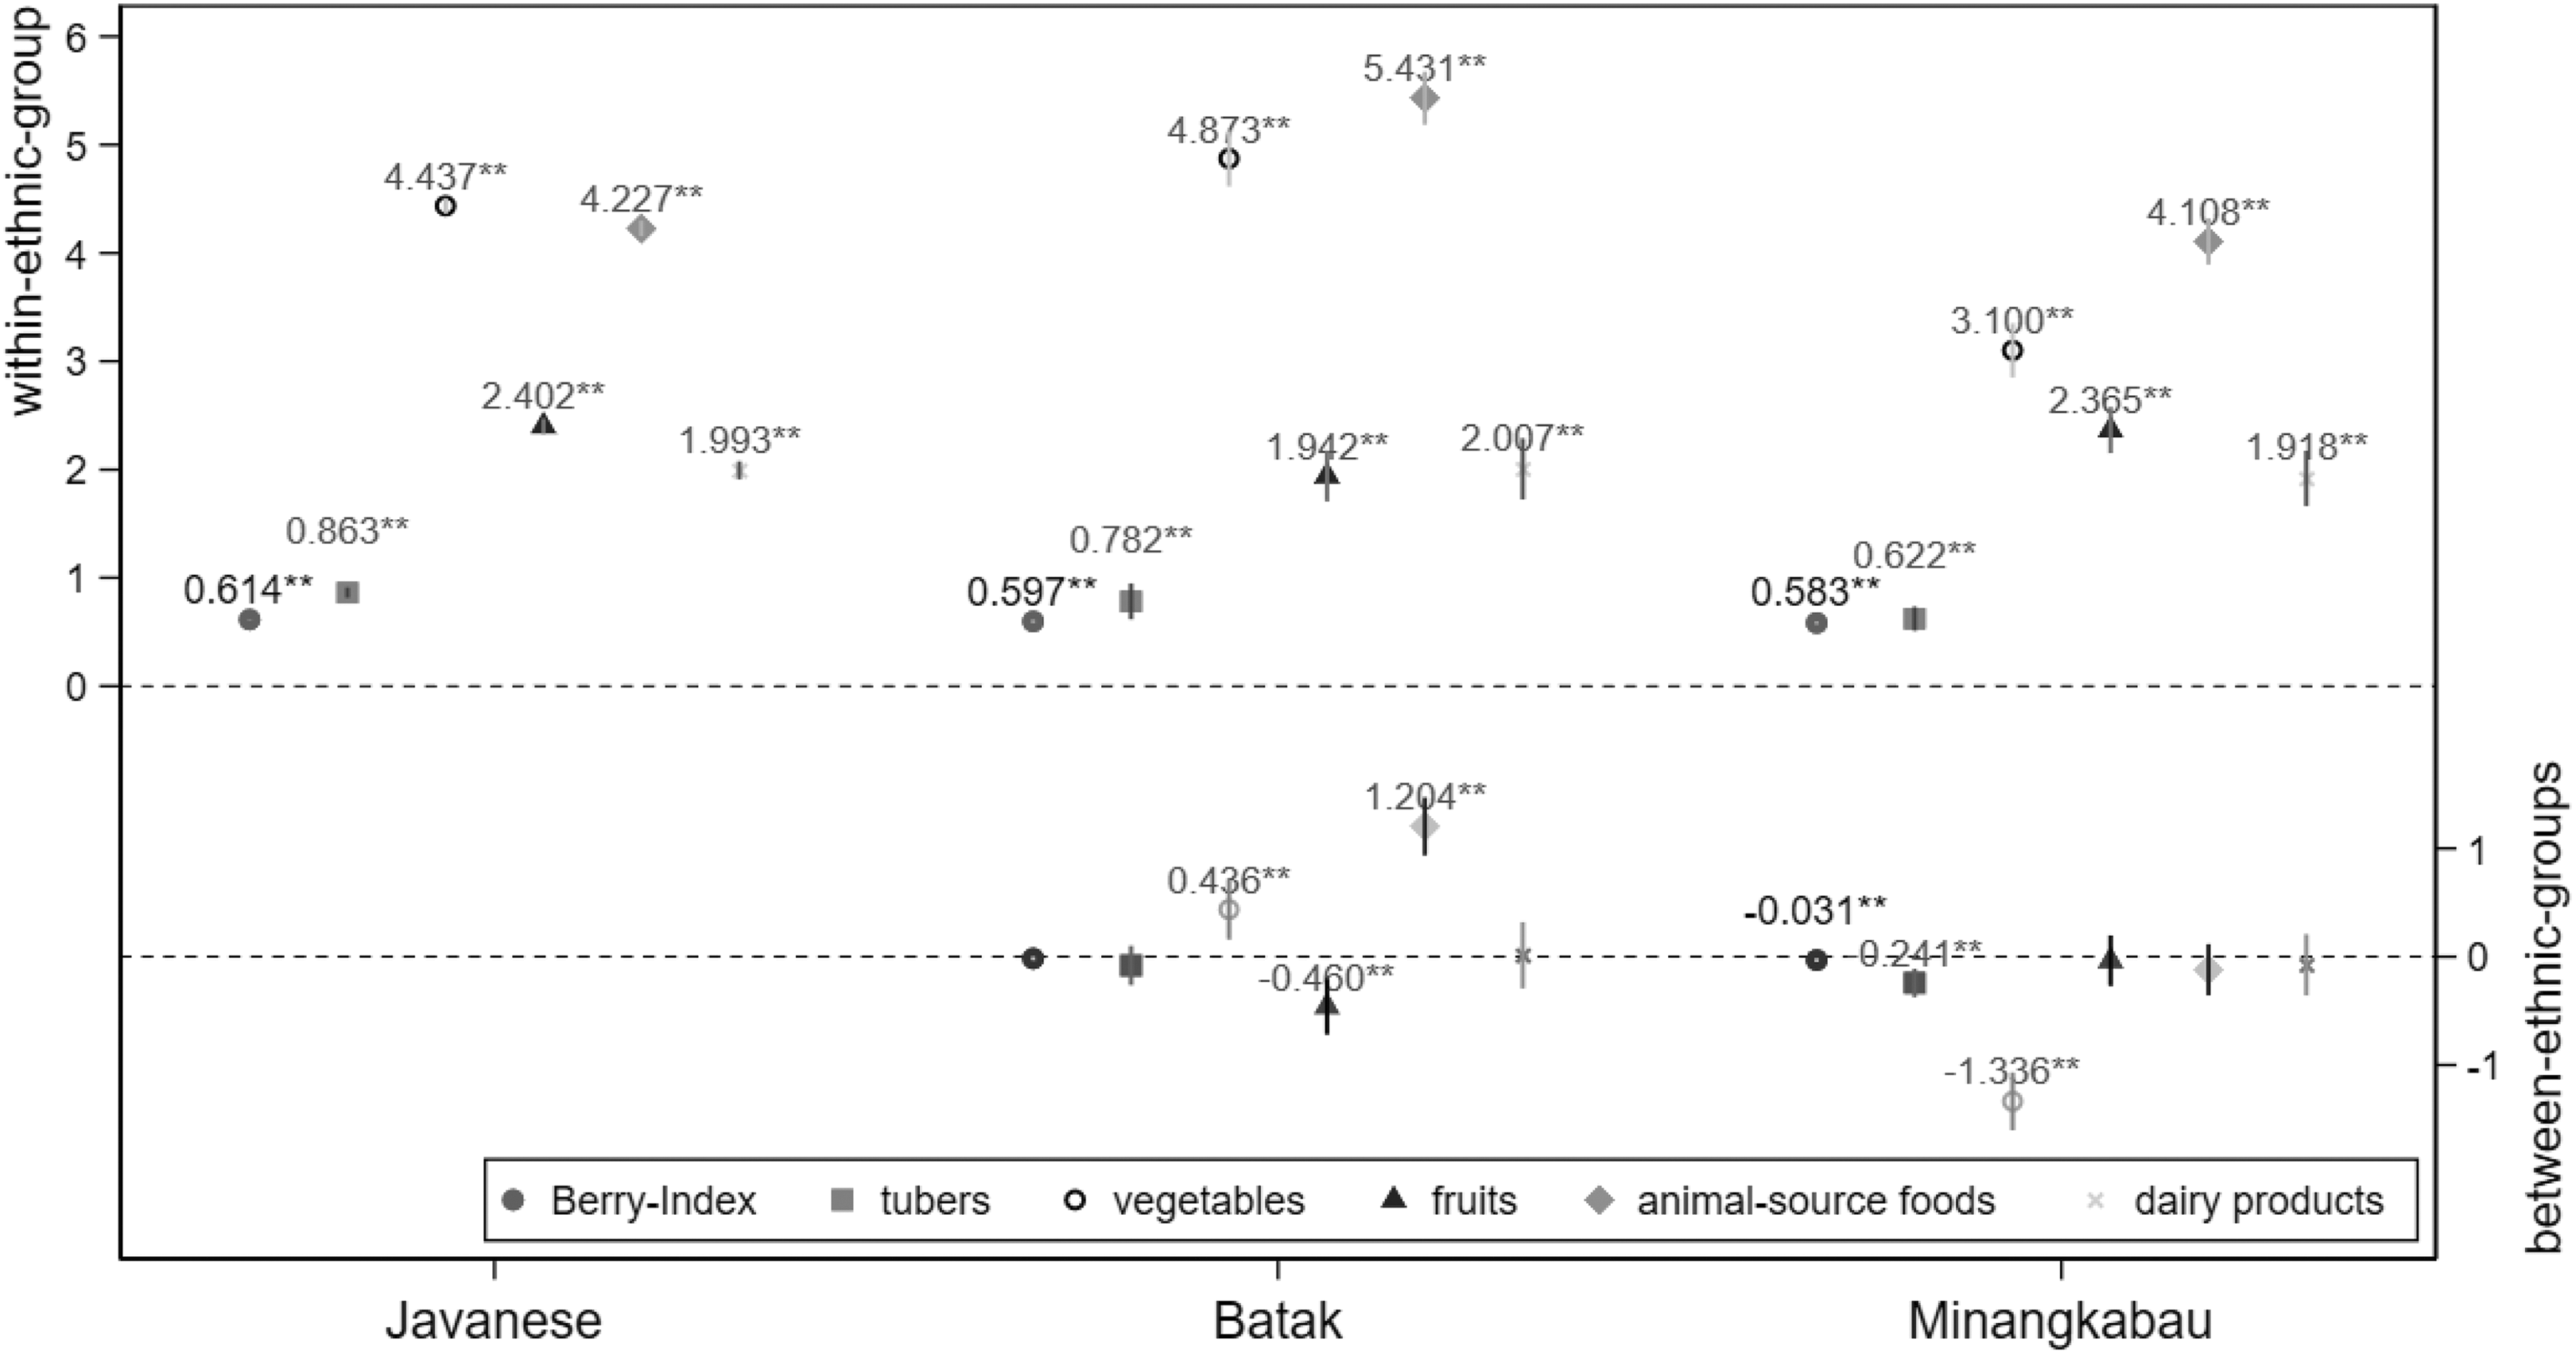
Cross ethnic group differences in dietary diversity. Berry-Index score: 0-0.8; food consumption freq.: 0-7 day(s); CI 95%; *P < .05; **P < .01 between-ethnic-groups: Javanese (ref.); complete predictive margins are in Table A3. CI indicates confidence interval.
Figures 2 and 3 show the test results for Hypotheses 2 and 3. Figure 2 shows adjusted marginal contrasts for cross-ethnic differences in dietary diversity by gender (see Table A4: ethnic × sex and Table A5). The figure indicates that for within ethnic group, gendered dietary diversity was absent for Javanese children but not for the 2 other ethnic groups, as Batak and Minangkabau girls had a higher Berry-Index score than boys (Batak: b = 0.032; P value <.01 and Minangkabau: b = 0.029; P value <.05). Compared to boys of the same ethnic group, Batak girls consumed tubers (b = 0.300; P value <.05) more often, whereas Minangkabau girls consumed vegetables (b = 0.663; P value <.01) more often. These findings are worth mentioning because, although the absence of gender differences in dietary diversity for within-ethnic-group was as expected for the Javanese, the advantage in dietary diversity that both Batak and Minangkabau girls had was surprising considering the large contrast in their kinship systems, that is, patrilineal Batak versus matrilineal Minangkabau. Within ethnic group differences at food group level showed that both Batak and Minangkabau girls consumed fruits and the pricier high-status, animal-source foods and dairy products (P value ≥.05) as often as boys. Comparison of between ethnic groups differences, with the Javanese as the reference category, revealed that gender inequality remained significant for Batak children (Berry-Index: b = 0.025; P value <.05) but became less significant for the Minangkabau. Gendered vegetable consumption was higher among Minangkabau children than among the Javanese (between ethnic groups: b = 0.583; P value <.01).
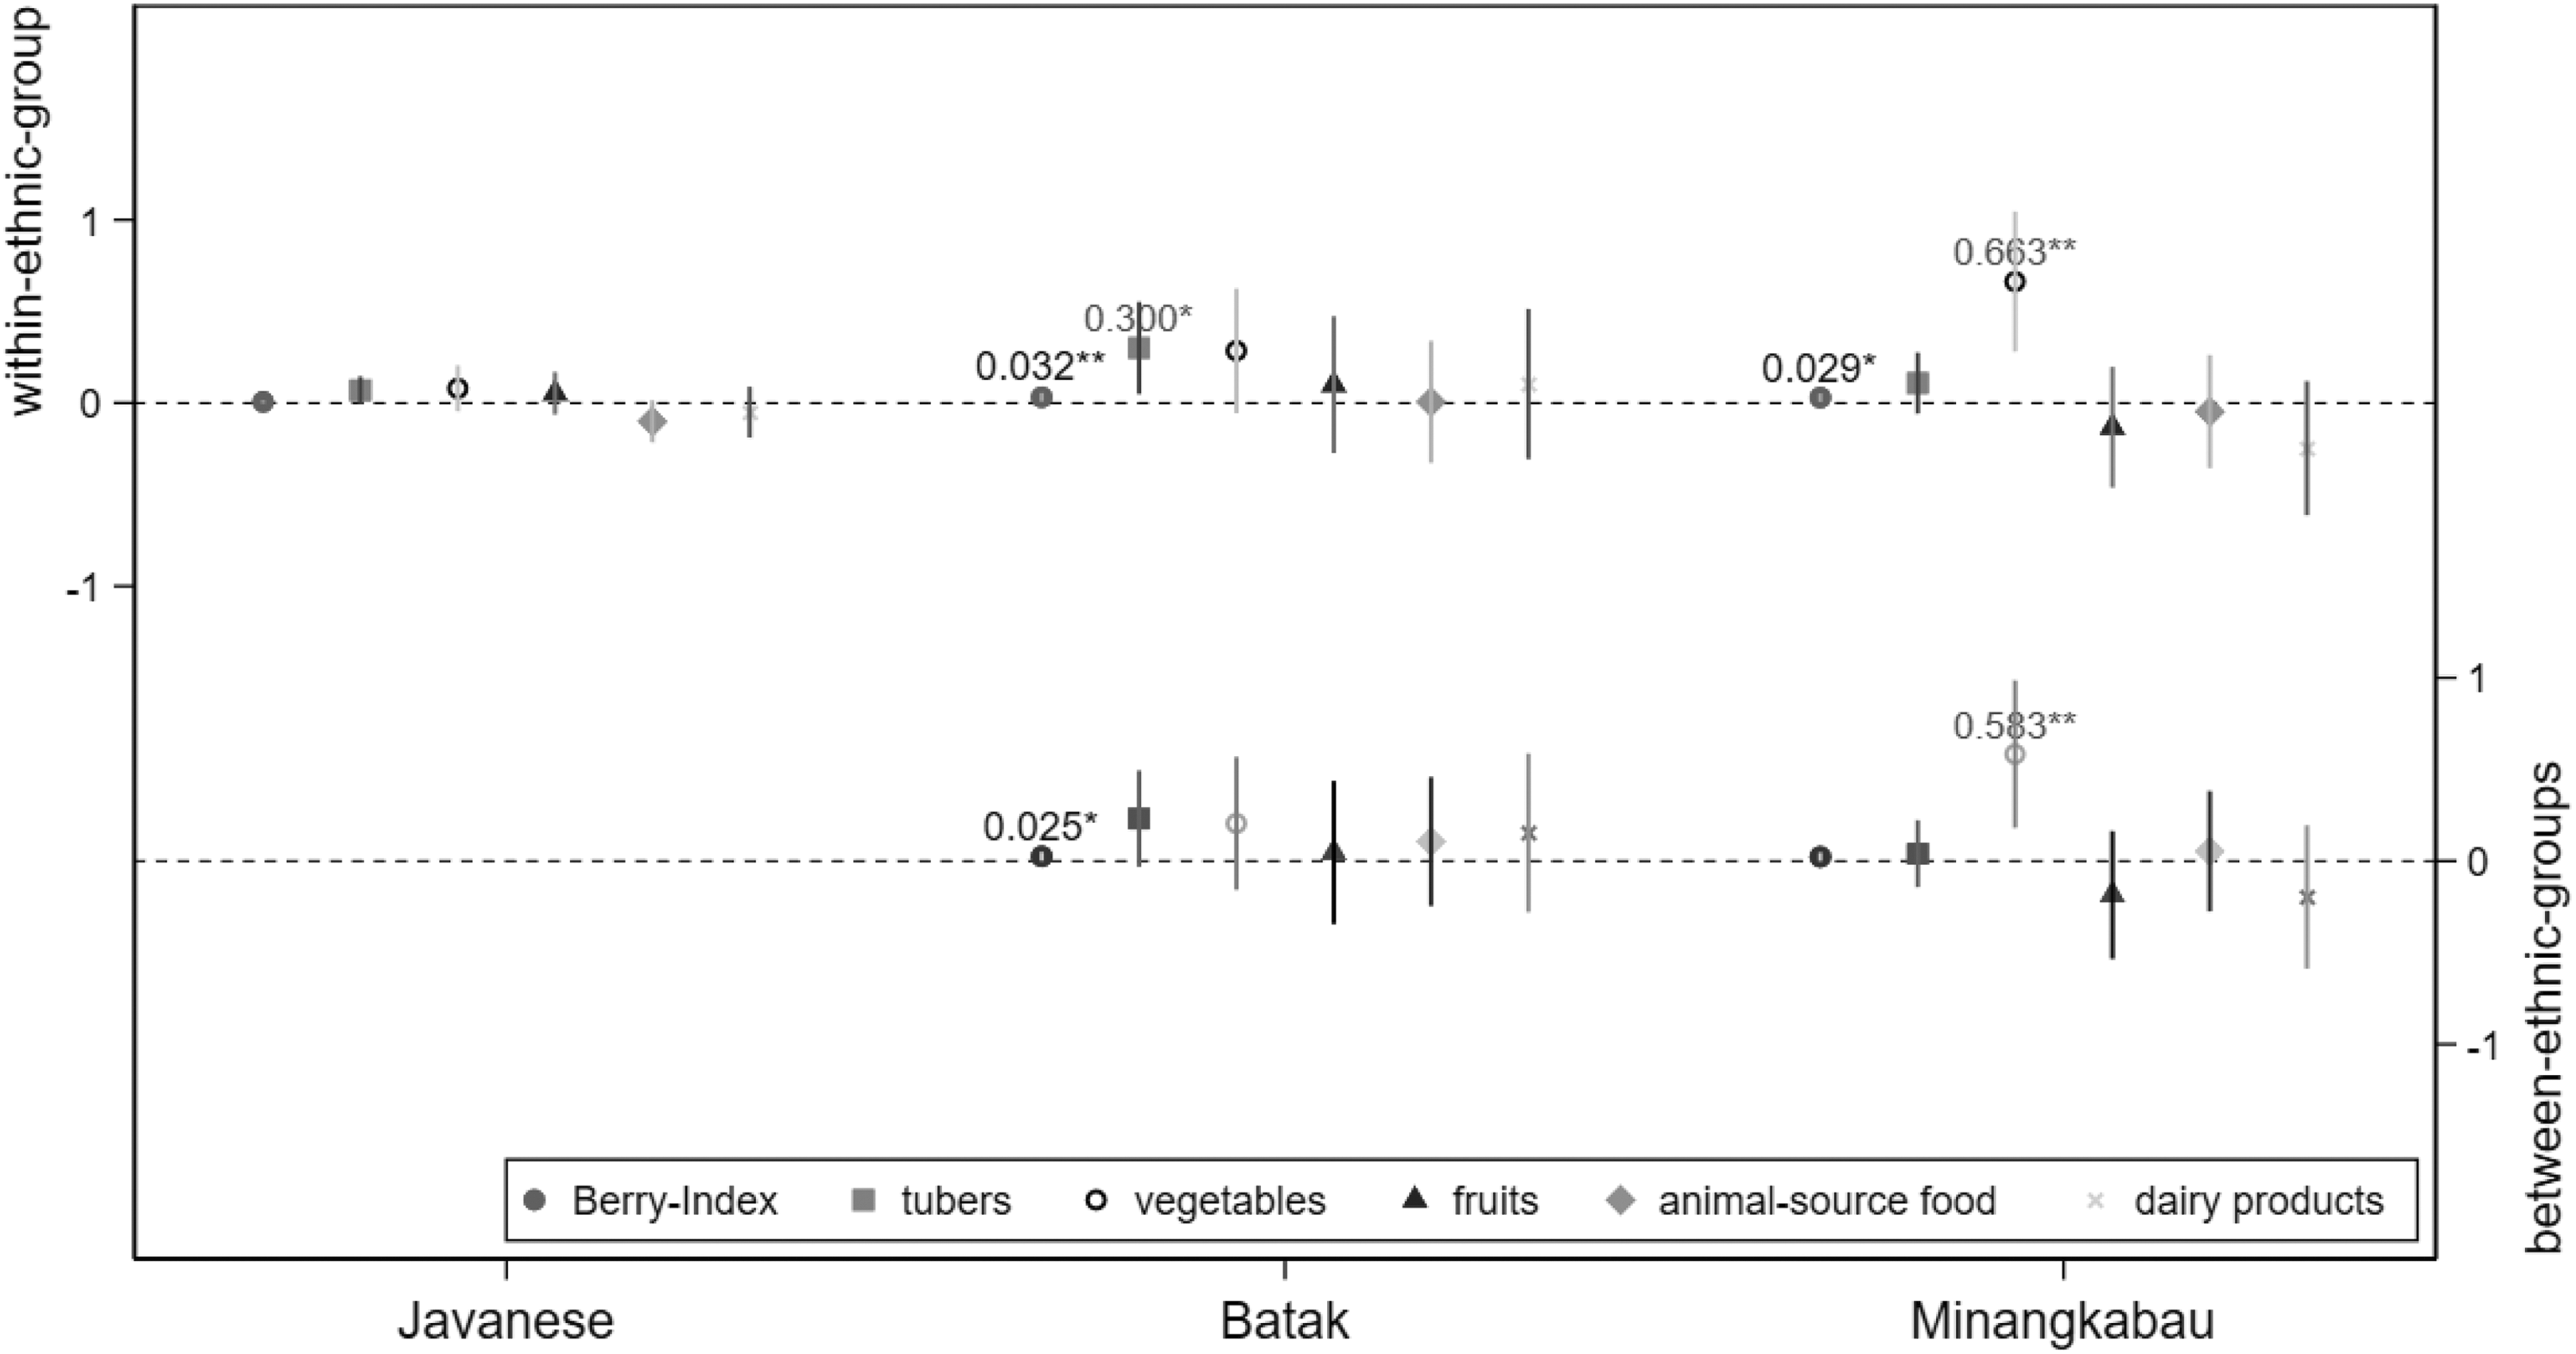
Cross ethnic group differences in dietary diversity by gender. Berry-Index score: 0-0.8; food consumption freq.: 0-7 day(s); CI 95%; *P < .05; **P < .01 within-ethnic-group: boys (ref.); between-ethnic-groups: Javanese (ref.); complete marginal contrasts are in Table A5. CI indicates confidence interval.
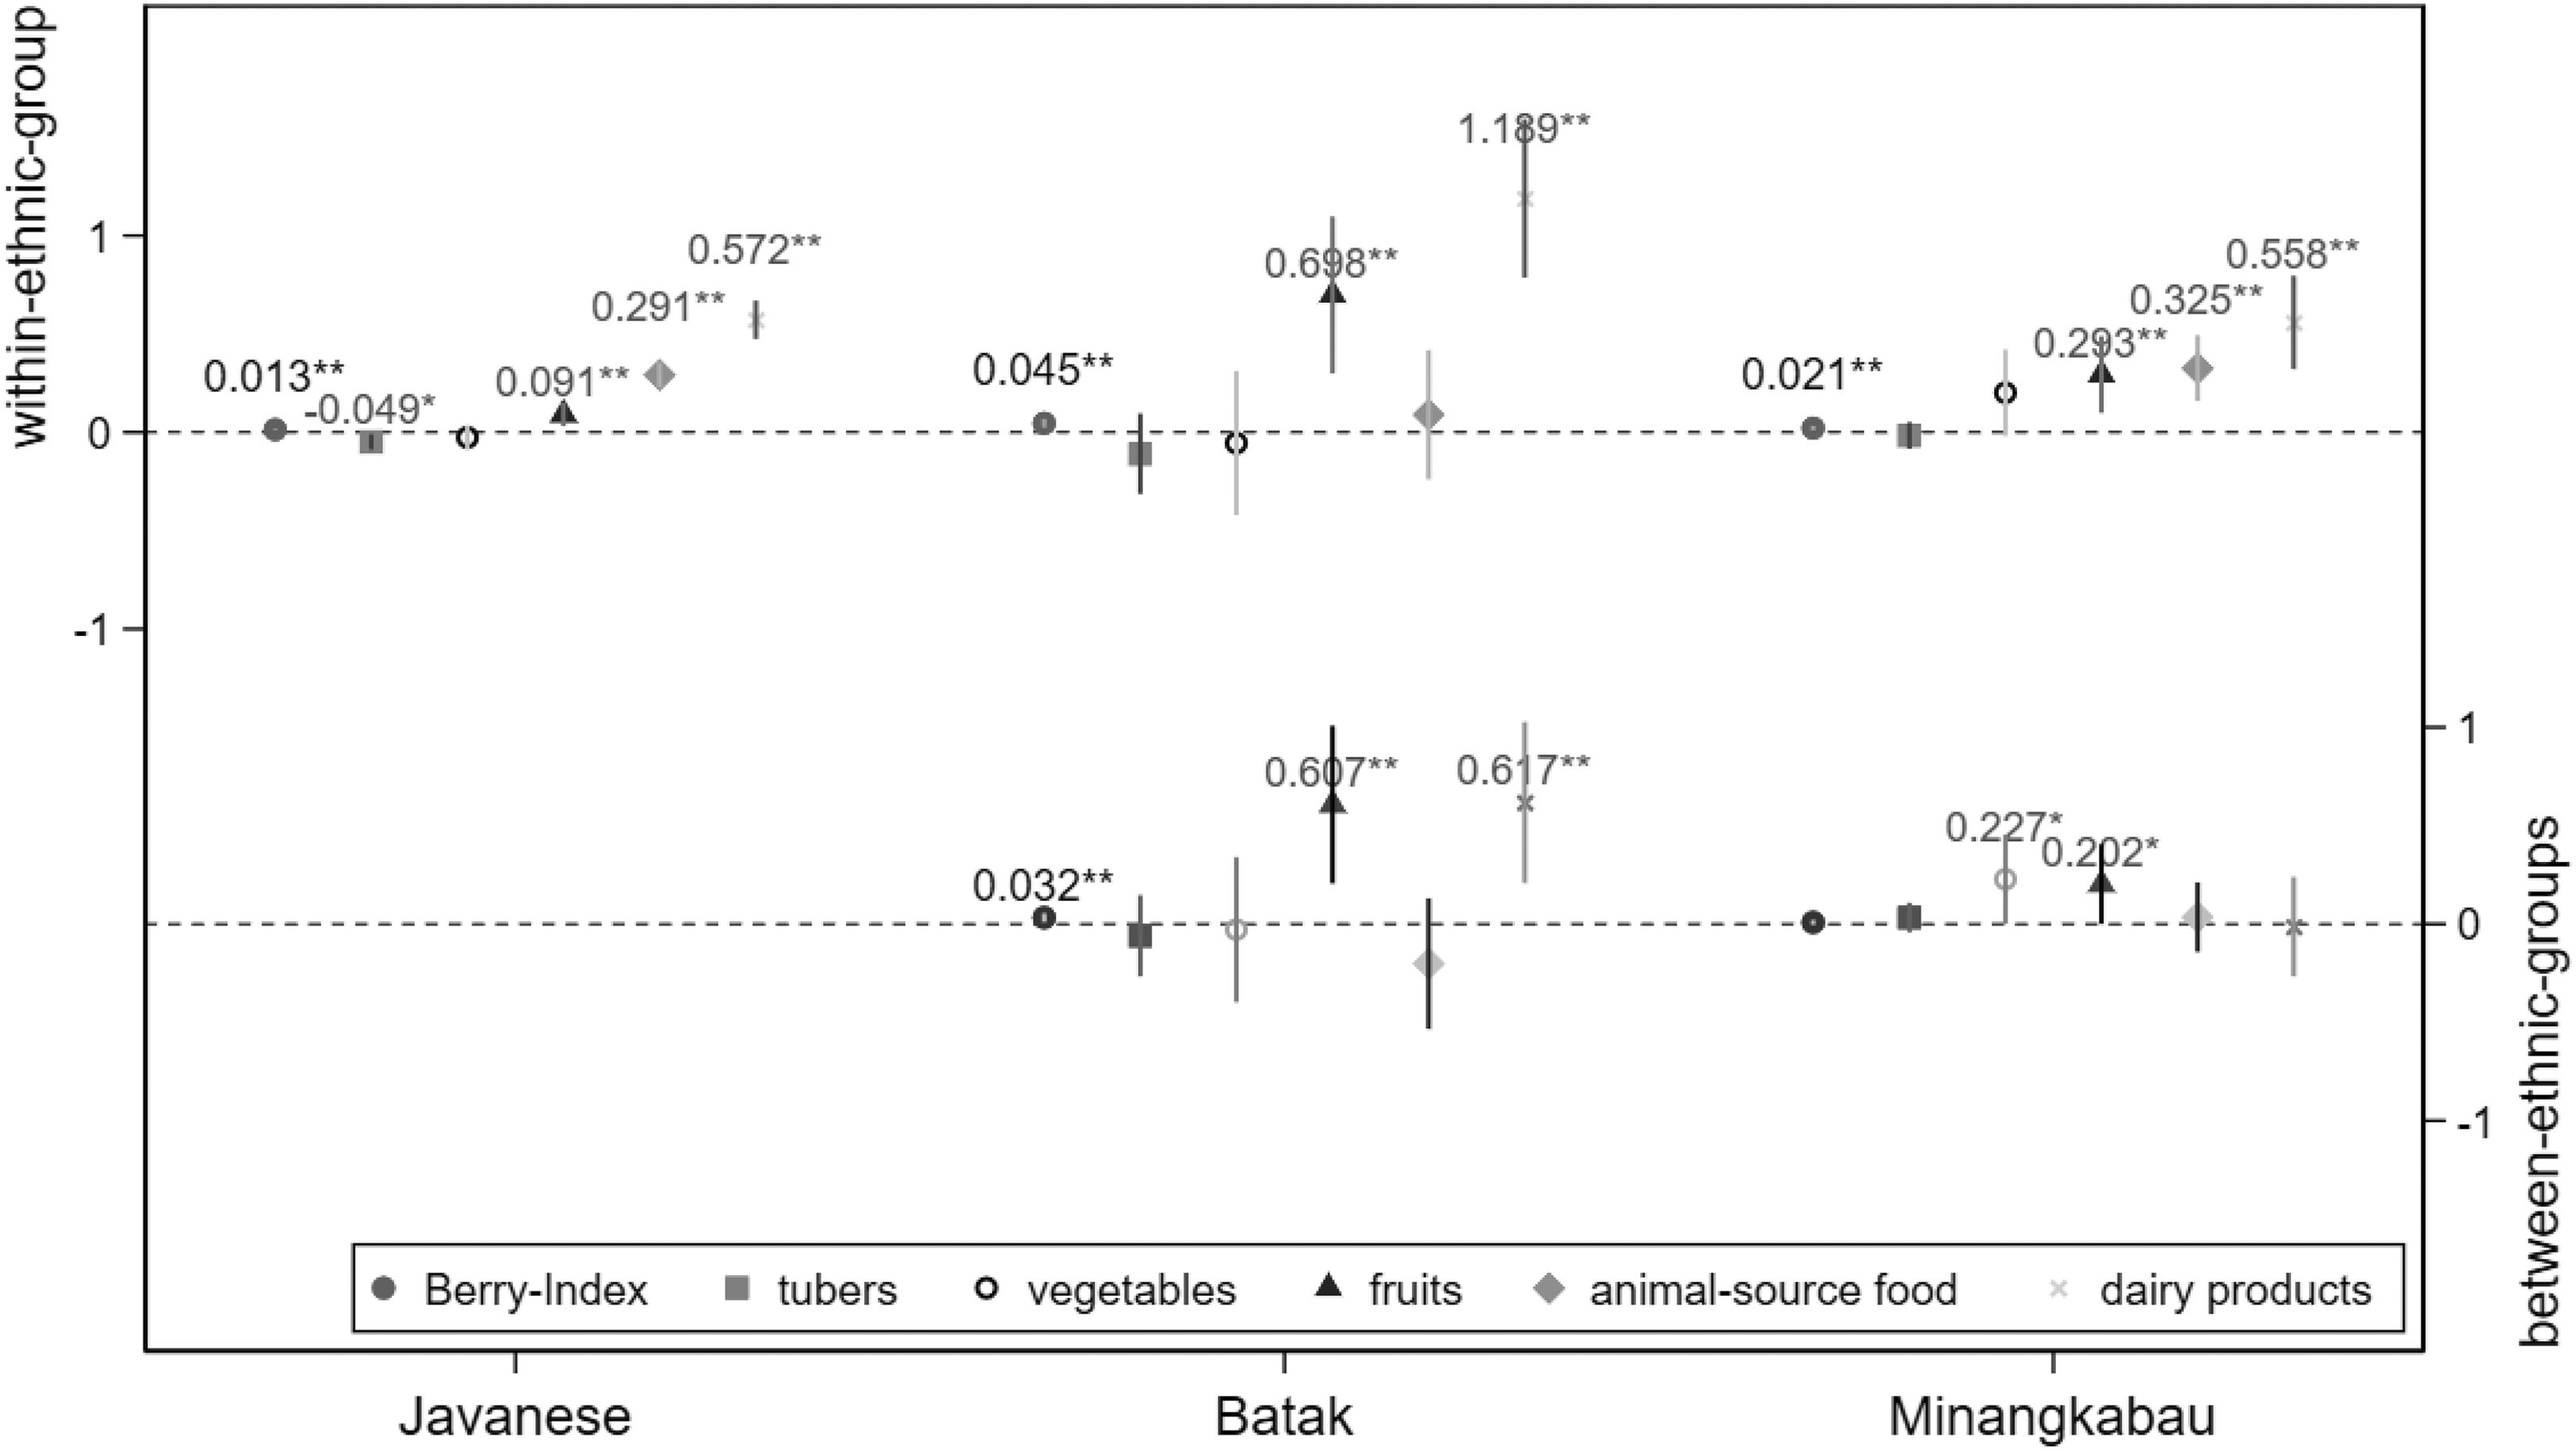
Cross ethnic group marginal effects of PCE on dietary diversity. Berry-Index score: 0-0.8; food consumption freq.: 0-7 day(s); CI 95%; *P < .05; **P < .01 between ethnic groups: Javanese (ref.); complete marginal effects are in Table A7. CI indicates confidence interval.
Figure 3 presents the marginal effects of PCE on cross-ethnic differences in dietary diversity (see Table A6: ethnic × PCE; and Table A7). The figure indicates that living in a higher SES household is positively associated with better dietary diversity, regardless of ethnic group. However, the strength of these associations differs by ethnic group. Dietary diversity was very related to SES for Batak children, as they benefited the most by living in a higher SES household (within ethnic group: b = 0.045; P value <.01); this is significantly greater than for the Javanese (between ethnic groups: b = 0.032; P value <.01). Overall, children from higher SES households consumed fruits, animal-source foods, and dairy products more often than children from lower SES households (eg, Javanese: fruits: b = 0.091; P value <.01; animal-source foods: b = 0.291; P value <.01; dairy products: b = 0.572; P value <.01). Nevertheless, there were 2 exceptions: (a) children from higher-SES Javanese households consumed tubers less often than poor Javanese children (b = −0.049; P value <.05) and (b) the frequency of consuming animal-source foods within Batak children did not vary by SES. It is important to note that the SES effects on fruits and dairy products consumption among Batak children were very high (within ethnic groups: fruits: b = 0.698; P value <.01; dairy products: b = 1.189; P value <.01). The large SES effect among Batak children means that lower SES Batak children consumed fruits and dairy products considerably less often than children from higher-SES Batak households did.
Discussion
Our study offers new evidence on how dietary diversity differs by ethnic group. Using data from Indonesia, we explored not only whether kinship systems may explain differences in dietary diversity across ethnic groups but also whether gender inequality and household SES play a role in ethnic-related dietary diversity. Furthermore, we considered food culture.
Our results showed 3 important clusters of findings. First, we found that dietary diversity differed by ethnic group in association with different kinship systems (Hypothesis 1). Javanese children scored higher in dietary diversity than the other 2 ethnic groups, particularly in comparison to the Minangkabau. This means that Javanese children had a higher dietary diversity among the 3 ethnic groups of interest. The fact that ethnic group differences in dietary diversity remain significant even after adjusting for some potential confounders suggest that ethnicity is an exogenous explanatory variable for dietary diversity.
Second, we found ethnic-related gender inequality in dietary diversity. However, the evidence indicated the opposite to the gender inequality hypothesized in Hypothesis 2. The results indicated that Batak and Minangkabau boys consumed less variety in foods than girls. This gendered dietary diversity was absent among children of the bilateral Javanese. When food consumption frequencies were considered, Batak and Minangkabau girls and boys consumed fruits and the pricier high-status foods (eg, animal-source foods and dairy products) as often as each other, but boys consumed low-status foods less often: tubers for Batak boys and vegetables for Minangkabau boys. Such evidence of girls being better off in terms of dietary diversity in 2 contrasting kinship systems (patrilineal Batak vs matrilineal Minangkabau) unveils interesting, unexpected associations of gendered dietary diversity and kinship systems. Perhaps the explanation for these findings lies in how both unilineal ethnic groups construct gender relations in everyday life. The high status of men characterizes the patrilineal Batak ethnic group, 20 but none of the previous studies designated the matrilineal Minangkabau as a matriarchal society. 18,23,24 In fact, most of the Minangkabau are Muslims, where men dominate the public domain and leadership positions. 23,24 The Minangkabau also have a long-standing tradition of male outmigration, 11,17 where returning successful male migrants receive high social status. Economic development and the nation’s egalitarian gender norms may have helped Batak and Minangkabau girls to have equal access to the pricier, higher-status foods in the same way as boys did. However, men’s high status among Batak people in multiple domains of life and among Minangkabau people in at least the public domain and in religious leadership might have caused boys to be less inclined to consume low-status foods, and this might cause their diet to be less varied than that of girls.
Third, we found that the effects of household SES on dietary diversity differed by ethnic group (Hypothesis 3). Although living in a higher-SES household benefited children’s dietary diversity regardless of their ethnic group, the effect was considerably greater for Batak children than for the Javanese and the Minangkabau. In general, children from higher SES households consumed fruits, animal-source foods, and dairy products more often; these foods are pricier than tubers and vegetables. However, for Batak children, there were no such SES differentials for animal-source foods consumption. Because the Batak’s diet relies more on the pricier animal-source foods, 25 lower-SES Batak households might be left with limited financial resources to diversify their children’s diet. This was well reflected in their children consuming fruits and dairy products considerably less often compared to Batak children of higher SES backgrounds. This may substantially decrease the dietary diversity of lower SES Batak children. We also found that children from higher SES Javanese households consumed tubers less often. Some studies have suggested that the Javanese perceive cassava, which can be classified as a tuber, as a symbol of poverty. 26 Such negative food stigmas may explain the low tuber consumption among well-off Javanese children.
This study advances previous literature in several ways. First, we have shown the importance of ethnicity as a determinant of dietary diversity. Previous studies have reported differences in dietary diversity consequent to food supply factors such as residential location and seasonality. 38,39 We have demonstrated that the association between ethnic group and dietary diversity remains significant even after controlling for these factors. The effects of other confounders, however, might still remain, for example, if the child is vegetarian and if there are unreported food stigmas.
Second, we found that the association between gender inequality and dietary diversity in Indonesia differed from that of other, usually patrilineal, South Asian societies. 4,5,7,8 Many studies in South Asia have documented various forms of discrimination against girls and women in terms of food allocation and nutritional status. The Indonesian context is different. Indonesian girls, including those from the patrilineal Batak, seemed to have equal access to different food groups in similar ways to boys, including for the pricier high-status foods. The gender inequality in dietary diversity in Indonesia was actually reversed, as Batak and Minangkabau boys consumed low-status foods less often, and this was to their detriment.
Third, this study has reaffirmed the significant associations of household SES with food access and food choice reported in a number of studies. 9,10,26,32 We examined the associations further and showed that the effects of household SES on dietary diversity varied by ethnic group. Although further research is required, such differences probably result from food culture related to how households from different ethnic group backgrounds and specific social classes spend their resources on food. In this study, we found that lower SES Batak children consumed fruits and dairy products less often, most likely to enable them to consume animal-source foods more often. We also found that, probably due to the negative food stigma of cassava, the better-off Javanese children consumed tubers, into which cassava can be classified, less often.
Some limitations apply to this study. First, the Berry-Index score that we used was not validated against nutrient adequacy because data on the portion size of foods that children consumed were not available in IFLS. The index that we used consisted of fewer food groups (eg, our study vs Katanoda et al 34 : 5 food groups vs 16 food groups); this might greatly reduce its sensitivity for measuring differences in dietary diversity. Also, it was based on a 7-day reference period, where measurement errors due to recall bias may affect the data quality. Moreover, unlike the FAO’s Dietary Diversity Score 41 and the WHO’s Minimum Dietary Diversity 42 that have been used in many studies, the index that we used has never been tested in a context other than the current study. Furthermore, assessing the dietary diversity of school-aged children is particularly challenging because they might consume foods that may not be reported in household surveys but that could still affect their dietary diversity. These limitations call for future studies aimed at improving the Berry-Index score by collecting data on the portion size of foods that children consumed, a larger number of food groups, a shorter reference period (eg, 24 hours recall or 3-day reference period), different contexts, and cautious measures of foods consumed during school hours.
Second, the current study did not assess the moderating effects of ethnic group on the linkage between dietary diversity and nutritional status. We instead focused on issues relating to kinship systems, gender inequality, and effects of household SES on the dietary diversity of different ethnic groups. Our approach offered insights into the mechanisms relating to ethnic-related dietary diversity. Future studies could further extend our work by analyzing simultaneous evidence on the linkages between ethnic group and nutritional status.
Third, we tentatively suggested that gender inequality in dietary diversity was a result of the higher status of males and occurred even in the matrilineal Minangkabau. Fernandez and Kambhampati 18 have shown that inequality in spousal bargaining power may cause gender inequality in child education expenditure in Indonesia. Taking Fernandez and Kambhampati 18 as an example, further studies could analyze spousal bargaining power as a novel measure for gender relations in each ethnic group and test the associations of such a measure with various life outcomes, including dietary diversity and nutritional status.
Given our results, stakeholders and policy-makers in Indonesia could establish initiatives to improve children’s dietary diversity, particularly for school-aged boys. Boys should be encouraged to consume a wide variety of foods, including the perceived low-status foods (eg, tubers and vegetables) more often. Further action is also required to reduce SES-related differences in dietary diversity. Educational programs, for example, could be instigated to teach children not to rely mainly on the pricier food types (eg, animal-source foods) but to diversify their diets. In the Indonesian context, such programs should be on government nutrition scale-up agendas targeting Batak households with lower SES backgrounds.
Footnotes
Appendix A
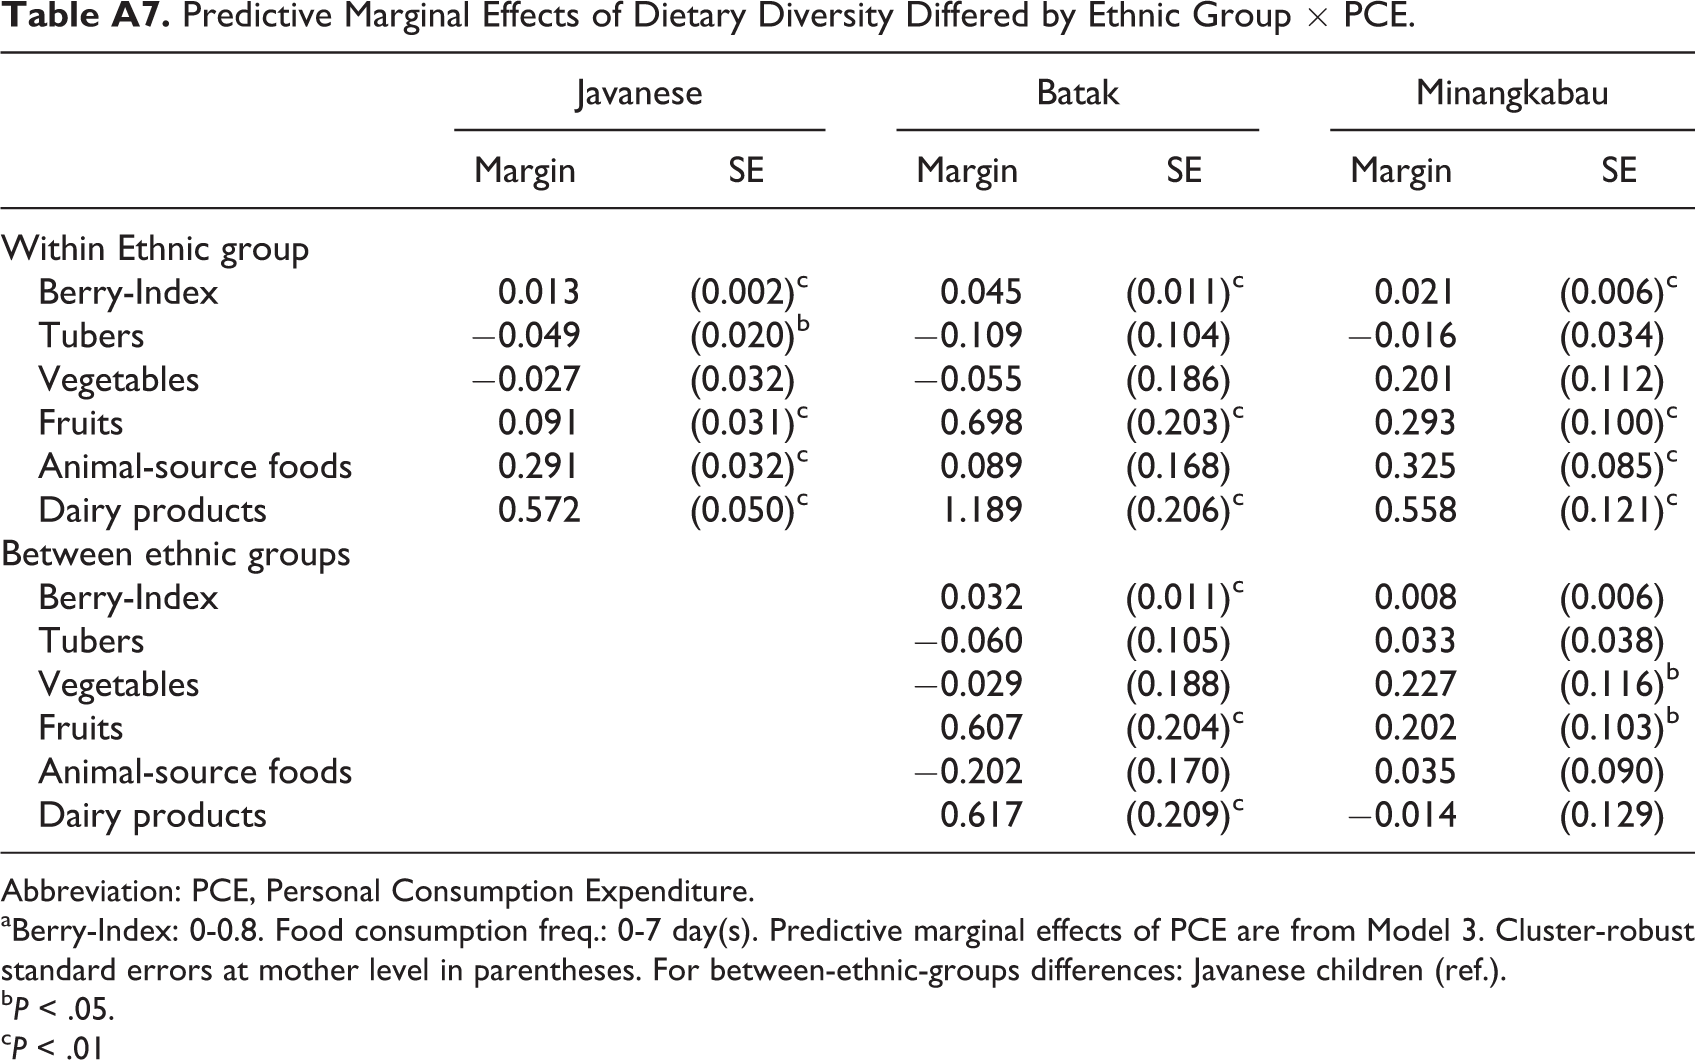
Predictive Marginal Effects of Dietary Diversity Differed by Ethnic Group × PCE.
| Javanese | Batak | Minangkabau | ||||
|---|---|---|---|---|---|---|
| Margin | SE | Margin | SE | Margin | SE | |
| Within Ethnic group | ||||||
| Berry-Index | 0.013 | (0.002)c | 0.045 | (0.011)c | 0.021 | (0.006)c |
| Tubers | −0.049 | (0.020)b | −0.109 | (0.104) | −0.016 | (0.034) |
| Vegetables | −0.027 | (0.032) | −0.055 | (0.186) | 0.201 | (0.112) |
| Fruits | 0.091 | (0.031)c | 0.698 | (0.203)c | 0.293 | (0.100)c |
| Animal-source foods | 0.291 | (0.032)c | 0.089 | (0.168) | 0.325 | (0.085)c |
| Dairy products | 0.572 | (0.050)c | 1.189 | (0.206)c | 0.558 | (0.121)c |
| Between ethnic groups | ||||||
| Berry-Index | 0.032 | (0.011)c | 0.008 | (0.006) | ||
| Tubers | −0.060 | (0.105) | 0.033 | (0.038) | ||
| Vegetables | −0.029 | (0.188) | 0.227 | (0.116)b | ||
| Fruits | 0.607 | (0.204)c | 0.202 | (0.103)b | ||
| Animal-source foods | −0.202 | (0.170) | 0.035 | (0.090) | ||
| Dairy products | 0.617 | (0.209)c | −0.014 | (0.129) | ||
Abbreviation: PCE, Personal Consumption Expenditure.
aBerry-Index: 0-0.8. Food consumption freq.: 0-7 day(s). Predictive marginal effects of PCE are from Model 3. Cluster-robust standard errors at mother level in parentheses. For between-ethnic-groups differences: Javanese children (ref.).
bP < .05.
cP < .01
Acknowledgments
The authors thank B.S. Namugumya for the discussion on dietary diversity and Prof. (Emeritus) A. Niehof for her insights on kinship systems in Indonesia. Preliminary results of this study were presented at the International Conference on Childhood and Adolescence (ICCA) 2018 in Lisbon, Portugal.
Declaration of Conflicting Interests
The author(s) declared no potential conflicts of interest with respect to the research, authorship, and/or publication of this article.
Funding
The author(s) disclosed receipt of the following financial support for the research, authorship, and/or publication of this article: The authors thank the Ministry of Research and Higher Education Republic of Indonesia for funding this study through BPP-LN DIKTI grant number: 124.15/E4/4/2014.
References
Supplementary Material
Please find the following supplemental material available below.
For Open Access articles published under a Creative Commons License, all supplemental material carries the same license as the article it is associated with.
For non-Open Access articles published, all supplemental material carries a non-exclusive license, and permission requests for re-use of supplemental material or any part of supplemental material shall be sent directly to the copyright owner as specified in the copyright notice associated with the article.