
Abstract
Background:
Double burden of malnutrition (DBM) is an emerging public health concern in urban Benin. However, an understanding of the phenomena in rural areas of the country is lacking.
Objectives:
To assess the prevalence of DBM and to investigate the sociodemographic and dietary characteristics that differentiate DBM from undernourished children only, overweight/obese mothers only, and normal households in Kalalé district.
Methods:
A cross-sectional study was conducted on 426 mother–child pairs: nonpregnant women aged 15 to 49 years and children aged 6 to 59 months. Weight-for-age and height-for-age were used to classify underweight and stunted children, body mass index ≥25 kg/m2 to measure overweight/obese mothers, and a 24-hour recall to assess the diet diversity score (DDS).
Results:
Overall, 37.6% of children were stunted, 10.1% wasted, and 22.8% underweight, while the rate of overweight/obese mothers was 15.5%. The DBM was present in 6.1% of the households. Overweight/obese mothers’ households had better socioeconomic status (SES), greater maternal education, less food insecurity, and a more diversified diet, in contrast with undernourished children households. The DBM households shared several features with undernourished children households, except for a greater (not significant) SES, but had the lowest DDS. Logistical regression revealed that high SES, older age child, DDS, mother education, and ethnicity were associated with DBM.
Conclusions:
The study highlights the importance of addressing the DBM at the community level in rural Benin. However, multicenter studies in various rural parts of the country are needed to substantiate the present results, so that appropriate strategies to reduce the DBM can be planned.
Introduction
The double burden of malnutrition (DBM) is defined by the World Health Organization (WHO) as the coexistence of undernutrition along with overweight/obesity or diet-related noncommunicable diseases, within individuals, households, and populations and across the life course. 1 Several studies examining DBM in low- and middle-income countries (LMICs) indicate that DBM is not only exclusive to urban areas but also present in rural areas. 2 Indeed, although remarkable improvement in nutrition status has been achieved in the past decades, undernutrition remains a public health problem in many LMICs, causing 3.5 million preventable maternal and child deaths, 35% of the disease burden in children younger than 5 years, and 11% of total global disability-adjusted life years. 3,4 One of the worst affected regions is sub-Saharan Africa where about 20% of children are undernourished. 5 At the same time, the prevalence of obesity is increasing substantially across LMICs, with some of these countries approaching the same prevalence as that of developed countries. 6 Ng et al 7 report that the prevalence of overweight in developing countries increased by 11% from 1980 to 2013, approximately 2% higher than the rate in developed countries. In 2014, Wise 8 estimated that 62% of the world’s obese people live in developing countries.
Benin is no exception as the prevalence of stunting, wasting, and underweight was, respectively, 37%, 5%, and 17% among children aged 6 to 59 months in the 2006 Benin Demographic and Health Survey (DHS), 9 while 9% of women had chronic energy deficiency (body mass index [BMI] <18.5 kg/m2) in the 2012 DHS. 10 Greater rates were observed in rural areas where stunting was found in 40% of children, underweight in 19%, and wasting in 5%, while 10% of women had chronic energy deficiency. 11 Additionally, according to the 2015 Benin STEPwise approach to chronic disease risk factor surveillance, 29% of adults (18-69 years) including 38% of women were overweight/obese. Alarmingly, female obesity prevalence for Benin was 14.2%. Between 1997 and 2015, female obesity prevalence of the country grew substantially from 6.6% to 14.2%, rising at an increasing annual rate that reached a maximum of 5.3% in 2001 and then decreased to 3.6% in 2016. This DBM situation poses a significant challenge for Benin and will pose a new threat to the health system, future economic growth, and human well-being. For this reason, government, United Nations agencies, and nongovernmental organizations in Benin recognize the urgent need of interventions that address the underlying causes of maternal and child nutritional status. 12
Until recently, only 2 studies have reported DBM at the household level in Benin. 13,14 In the first study, Deleuze et al 13 assessed the magnitude of the overlap of child protein-energy malnutrition and maternal overweight within households in 2 poor urban neighborhoods of Cotonou, the capital city of Benin. The DBM was found in 16.2% of 148 recruited households while 35.5% of children were undernourished, and the rate of maternal overweight was 39.1%. The authors also found that maternal and child nutrition was strongly associated with economic factors, maternal education, food insecurity, lack of sanitary conditions, and diversification of food. The second study was carried out in 2015 on 357 mother–child pairs in the city of Comè and its surroundings. 14 The authors found that 19.3% of mothers were overweight and 5.7% were obese, while 46% of children were stunted. The prevalence of DBM was 11.5%. The main factors associated with DBM were child’s age, mother’s occupation, ethnicity, social status and educational level, and the size, economic level, transportation means, and food insecurity of the household. These studies have focused on urban areas of Benin, whereas the presence and determinants of DBM have not been explored in rural areas where evidence suggests an increasing prevalence of overweight and a shift in dietary patterns. 2
The objectives of this study were (1) to examine double burden structure specifically for the mother–child pair in Kalalé, a rural district of northern Benin and (2) to compare the sociodemographic and dietary characteristics of double burden households and nondouble burden household members. Our hypothesis was that DBM was associated with poor living conditions and poor quality of food, as resources were not sufficient to ensure balanced food rations even if the amount of food was sufficient. 1 Specifically, in Kalalé district where families rely on subsistence farming for their livelihood, agriculture is constantly threatened by natural phenomena such as droughts, which force people to migrate toward nearby urban centers in search of alternative opportunities for income generation. 15,16 Several studies have shown the influence of large cities on the food security of rural areas, 17,18 and such interaction can result in change of the quality of household diet. 19 Furthermore, there is little literature on the nutritional status of children below 5 years old in rural communities of Benin, as child nutritional data were only documented in 2006 Benin DHS. 9,10 As such, this study is essential for evidence-based intervention modalities.
Methods
Study Design and Setting
This study presents baseline findings of nutritional status of a study population (January to March 2014) participating in an expansion of a solar-powered drip irrigation (Solar Market Garden [SMG]) project. 20,21 The general objective of the proposed project was to improve food security, maternal and infant nutrition status, and women empowerment in the Kalalé district of northern Benin. In the area, rain-fed-dependent agriculture is the mainstay system, directly affecting food production and subsistence-sourced dietary diversity. 22 The expansion included 16 villages (8 intervention villages and 8 matched-pair comparison villages) across Kalalé district. In intervention villages, SMGs were installed in conjunction with preexisting local women’s agricultural groups engaged in horticulture. Each SMG is used jointly by 30 to 35 women in an agricultural group, each of whom farms her own 120 m2 plot. The comparison villages that did not utilize the SMGs were chosen for matched-pair comparison with intervention villages, based on similarity along several variables, including location along the same roads, administrative status, and size. Women’s agricultural groups in the comparison villages grow vegetables in hand-watered plots, as had the groups in the intervention villages before intervention.
Details relevant to the design and conduct of the survey are described elsewhere. 21 Briefly, in each village, all households represented in women’s groups were surveyed, along with a random sample of non-women’s group households from the same village; the goal was to select a maximum of 30 non-women’s group households. In each investigated household, only 1 mother or caregiver of childbearing age (15-49 years) and her young child (6-59 months of age) were chosen. Delegates/leaders of the selected villages were contacted to obtain a complete listing of all non-women’s group households with a target mother–child. From that list, a single household was selected as a starting point, using a random number between 1 and the required number of households in the village. If there were more than 1 woman/child in the house, only 1 mother–child pair was selected. Overall, 426 woman–child pairs were successfully assessed.
Data Collection
Information on socioeconomic and demographic characteristics, health status, and diet factors was collected, while anthropometric measurements were taken from the selected mother–child pairs to determine the nutrition status of both populations. The selection of these variables was based on analysis of causative framework of malnutrition developed by United Nations Children’s Fund, 23 which covers a wide range of physiological, cultural, sociological, economic, and political causes (Figure 1).
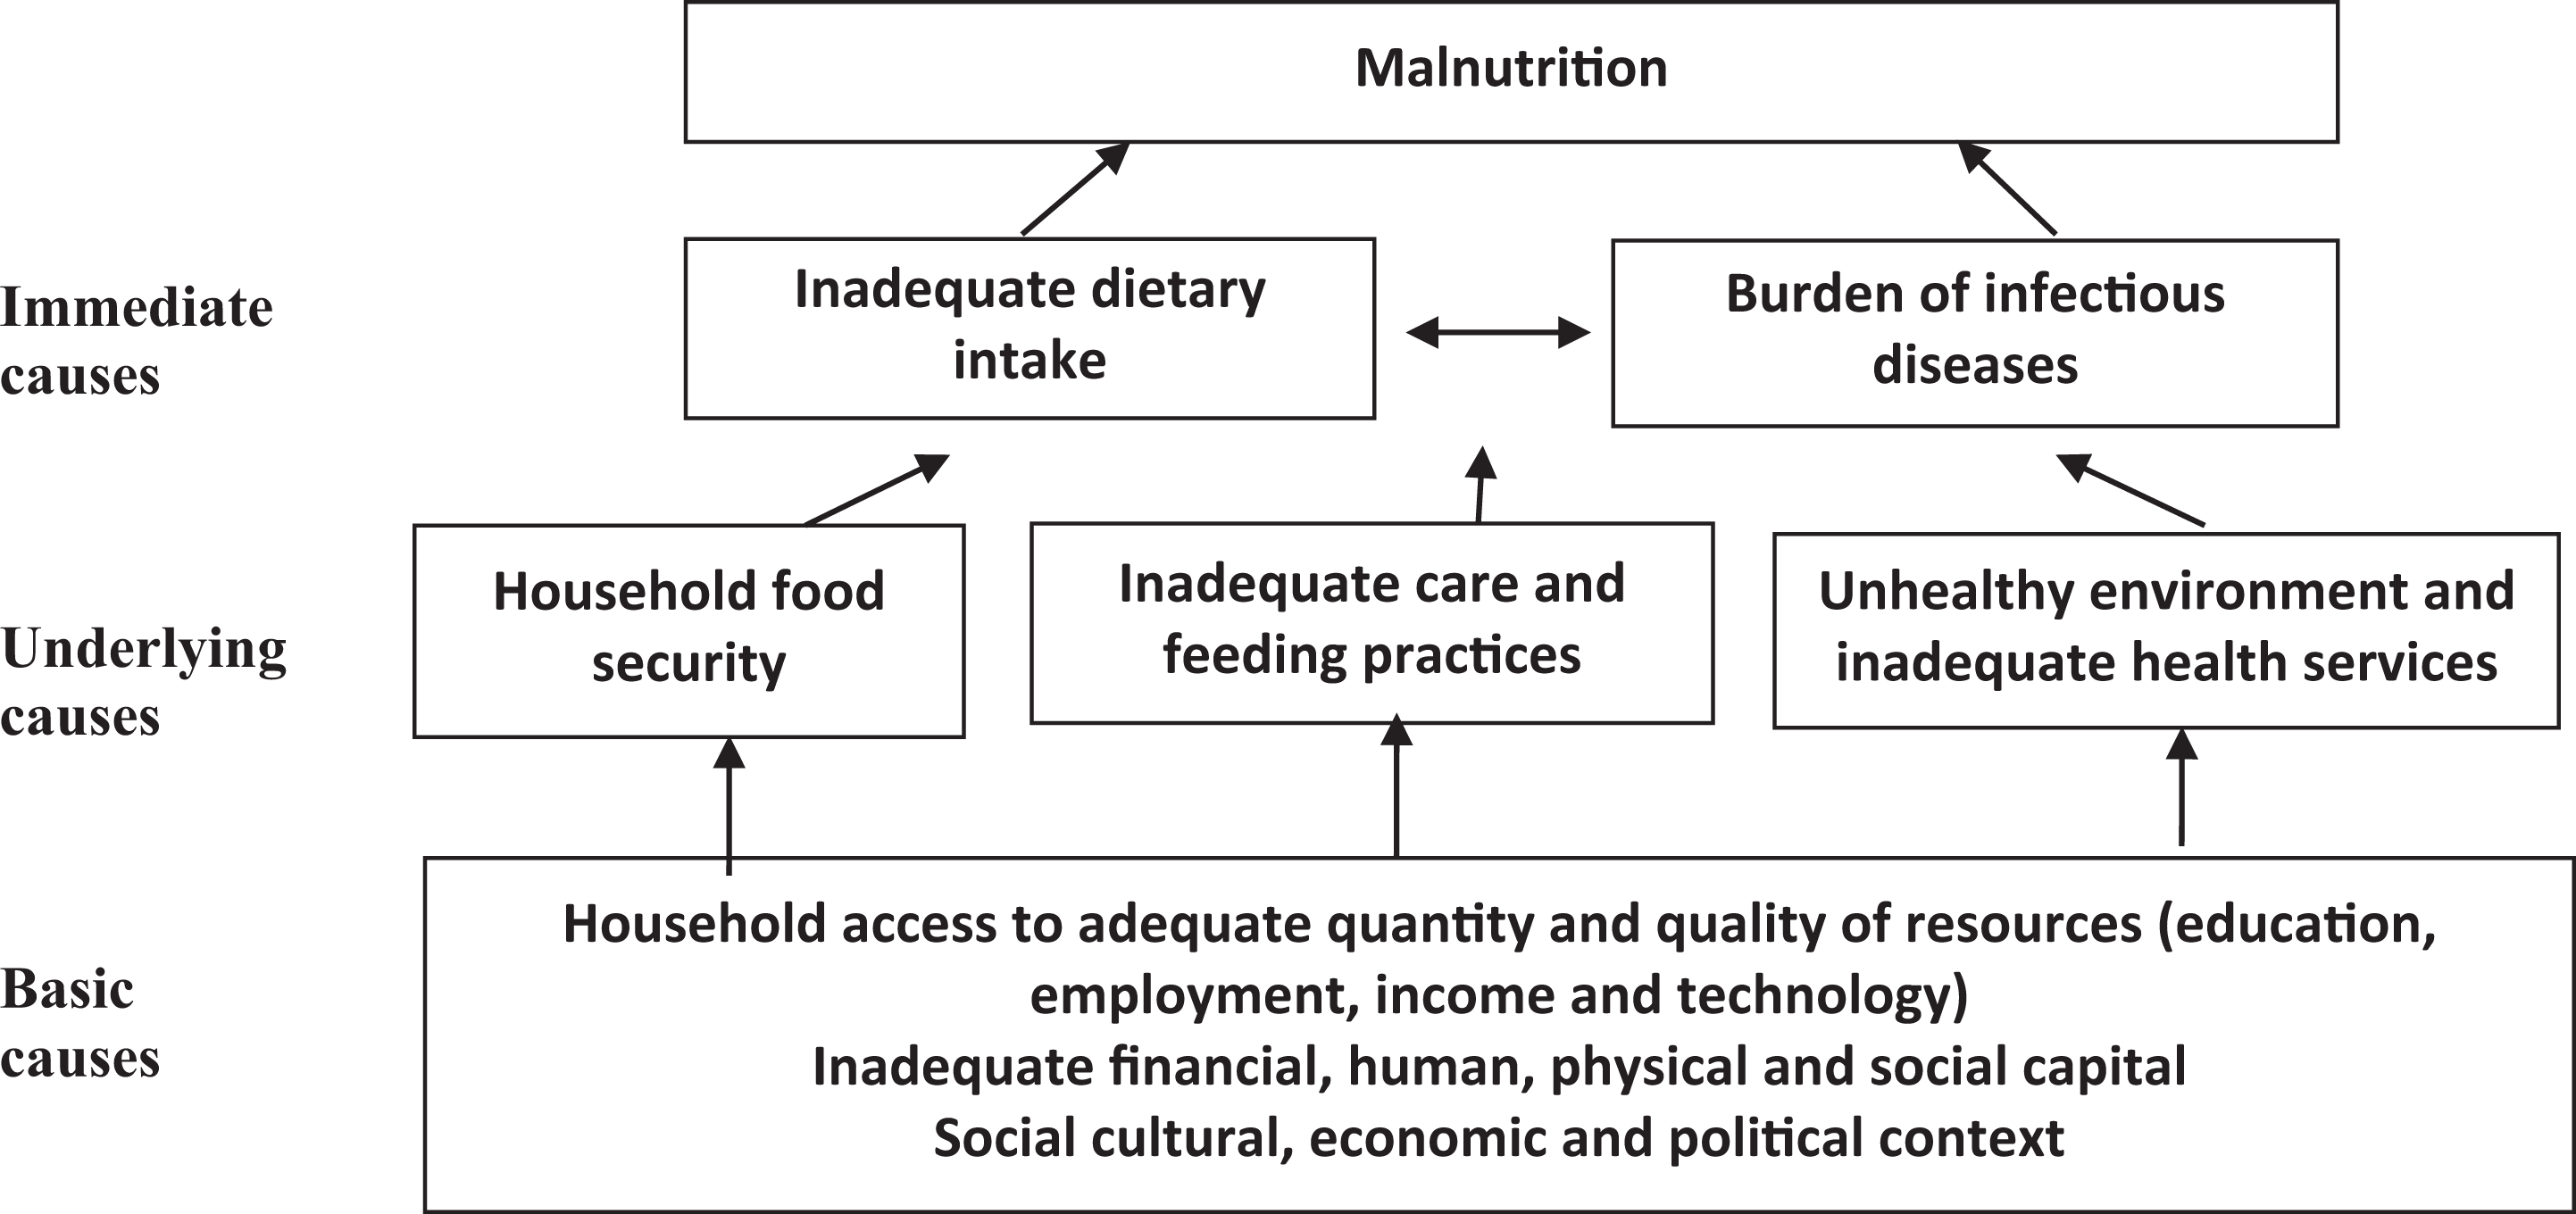
United Nations Children’s Fund conceptual framework for the causes of malnutrition. 23
Demographic and socioeconomic characteristics
Information on maternal characteristics (maternal age in years, level of education completed, and occupation and type of group), child characteristics (age in months, sex), and household characteristics (socioeconomic status [SES], self-reported food insecurity in the past 12 months, self-reported access to health care in the past 12 months, family size, ethnicity, safe water, and frequency of TV listening) was obtained from household heads (mainly fathers) or mothers, using a set of pretested administered questionnaire. Parents or guardians were asked to provide information on child’s age, which was confirmed using child immunization cards or birth certificates. Where cards were unavailable, the caretakers/guardians were asked to recall or use references to calendar events. The SES was examined using household asset data, such as ownership of consumer items and home attributes. Factor scores derived from the first factor (which explained 27.8% of the variance) were then used to characterize the SES of each household. 24,25 Households were categorized into SES quartiles based on their individual SES index score.
Anthropometric measurements
Weight and height measurements were taken using the standard recommended procedures of the WHO. 26 Specifically, weight and height were collected in duplicate by 2 trained nurses, and anthropometry standardization sessions conducted throughout the data collection period with the aim of identifying and correcting measurement problems. Body composition monitor Scale Seca 750 and Shorr Board stadiometer (Vogel and Halke & Co, Hamburg, Germany) were used to measure weight and height of children (2 years and above) and adults, to the nearest 0.1 kg and 0.1 cm, respectively. In addition, the stadiometer was calibrated with a 140 cm aluminum rod before each measurement session or every time the instrument was moved. The scale was calibrated with a 4.5 kg weight before each measurement session or every time the scale was moved. A Shorr Board infantometer was used to measure the recumbent length of infants and young children (less than 2 years), to the nearest 0.1 cm, respectively. Infant or young child was weighed using a taring scale, which was checked before each weighing to ensure that the mark returned to 0. For children, weight-for-age z score (WAZ), height-for-age z score (HAZ), weight for height/length z score (WHZ), and body mass index-for-age z score (BMIZ) were calculated using the National Center for Health Statistics/WHO growth reference data of 2006. 27 For women, BMI was calculated as the body weight (in kilograms) divided by the square of height (in meters).
Classification of nutritional status
In children, wasting (based on WHZ), stunting (based on HAZ), and underweight (based on WAZ) were defined and classified as global (<−2 standard deviation [SD]), moderate (−3.0 to <−2.0 SD), and severe (<−3.0 SD). Overweight was defined as WHZ/BMIZ >2SD: WHZ for children <2 years old and BMIZ for children ≥2 years old. 26 For women, underweight was defined as BMI <18.5 kg/m2, overweight as BMI ≥25 but ≤29.99 kg/m2, and obesity as BMI ≥30 kg/m2. 28 Additionally, each household was classified into one of the following 4 nutritional phenotypes. Double burden households were defined as the coexistence of an overweight/obese mother and an underweight/stunted child within the same household. Households with undernourished children only were defined as the coexistence of underweight/stunted child and normal weight mother. Households with overweight/obese mothers only were defined as the coexistence of overweight/obese mothers and normal weight/height child. Normal households or households without undernourished children or overweight/obese mothers were defined as the coexistence of a normal weight mother and normal weight/height child.
Dietary assessment
Dietary diversity data were collected with reference to the child’s mother/caretaker. Respondents were requested to list all the foods consumed both at home and out of the home in the 24 hours preceding the interview. Distribution of scores is then used for analysis. 29,30 Dietary diversity consisted of 10 food groups for women: (1) starchy staples, (2) beans and peas, (3) nuts and seeds, (4) dairy, (5) flesh foods, (6) eggs, (7) vitamin A-rich dark green leafy vegetables, (8) other vitamin A-rich vegetables and fruits, (9) other vegetables, and (10) other fruits. 31 For the classification of diet diversity score (DDS), 3 categories were used: low (0-3 food groups), medium (4-6 food groups), and high (≥7 food groups). For the children, details about children’s dietary intake were collected from their mothers or caregivers, and 7 food groups were used: (1) milk products; (2) cereals; (3) vitamin A-rich vegetables; (4) other fruits and vegetables; (5) eggs; (6) meat, poultry, and fish; (7) legumes; and (8) oil/fats. 32 Three categories were also used for children: low (0-3 food groups), medium (4-5 food groups), and high (≥6 food groups).
Ethical Considerations
The study was approved by the National Ethics Committee for Health Research of Benin. Ethical clearance was obtained from the institutional review boards (IRBs) charged with the protection of human research participants of the University of Arizona. The analysis portion of the project was additionally approved by the IRB of the University of California, San Diego. All women were informed verbally about the aims and procedures of the study, and informed consent was obtained from all women and children, via their mother or guardian approval for these latter, before enrollment.
Statistical Methods
All statistical analyses were carried out using STATA statistics (version 14; StataCorp, College Station, Texas). Descriptive statistics such as mean and standard deviation, as well as frequency and proportion, were used to describe the sample. Analysis of variance was used to compare continuous variables, while logistic regression was carried out to compare categorical factors between the 4 nutritional phenotypes. 33 Univariate and multivariate logistic regressions were then performed to identify the demographic and socioeconomic factors associated with undernourished children, overweight/obese mothers, and DBM households. The reference group for all analyses was normal households. All independent variables in bivariate analyses with P <.25 were considered important and were thus included in the multivariable analysis. However, important factors were also included in the multivariate regression model despite their insignificant associations with nutrition status. Adjusted odds ratios (AORs) with corresponding 95% confidence intervals were estimated, and model fit was determined by the Hosmer-Lemeshow test. 34 For all statistical analyses, the results were deemed significant if the obtained P values were less than .05.
Results
Nutritional Status of Mothers and Their Children
Among the 426 surveyed mother–child pairs, 8.2% of mothers were underweight while 15.5% of them were overweight including 3% of obesity (Table 1). In addition, high proportions of children were stunted (37.6%) and underweight (22.8%). Stunting (43.9% vs 31.7%; P = .009) and underweight (25.8% vs 19.9%; P = .01) were significantly more prevalent in boys than girls. The percentage for wasted children (10.1%) was similar to that for overweight/obese children (11.3%).
Nutritional Status of Mothers and Their Children.
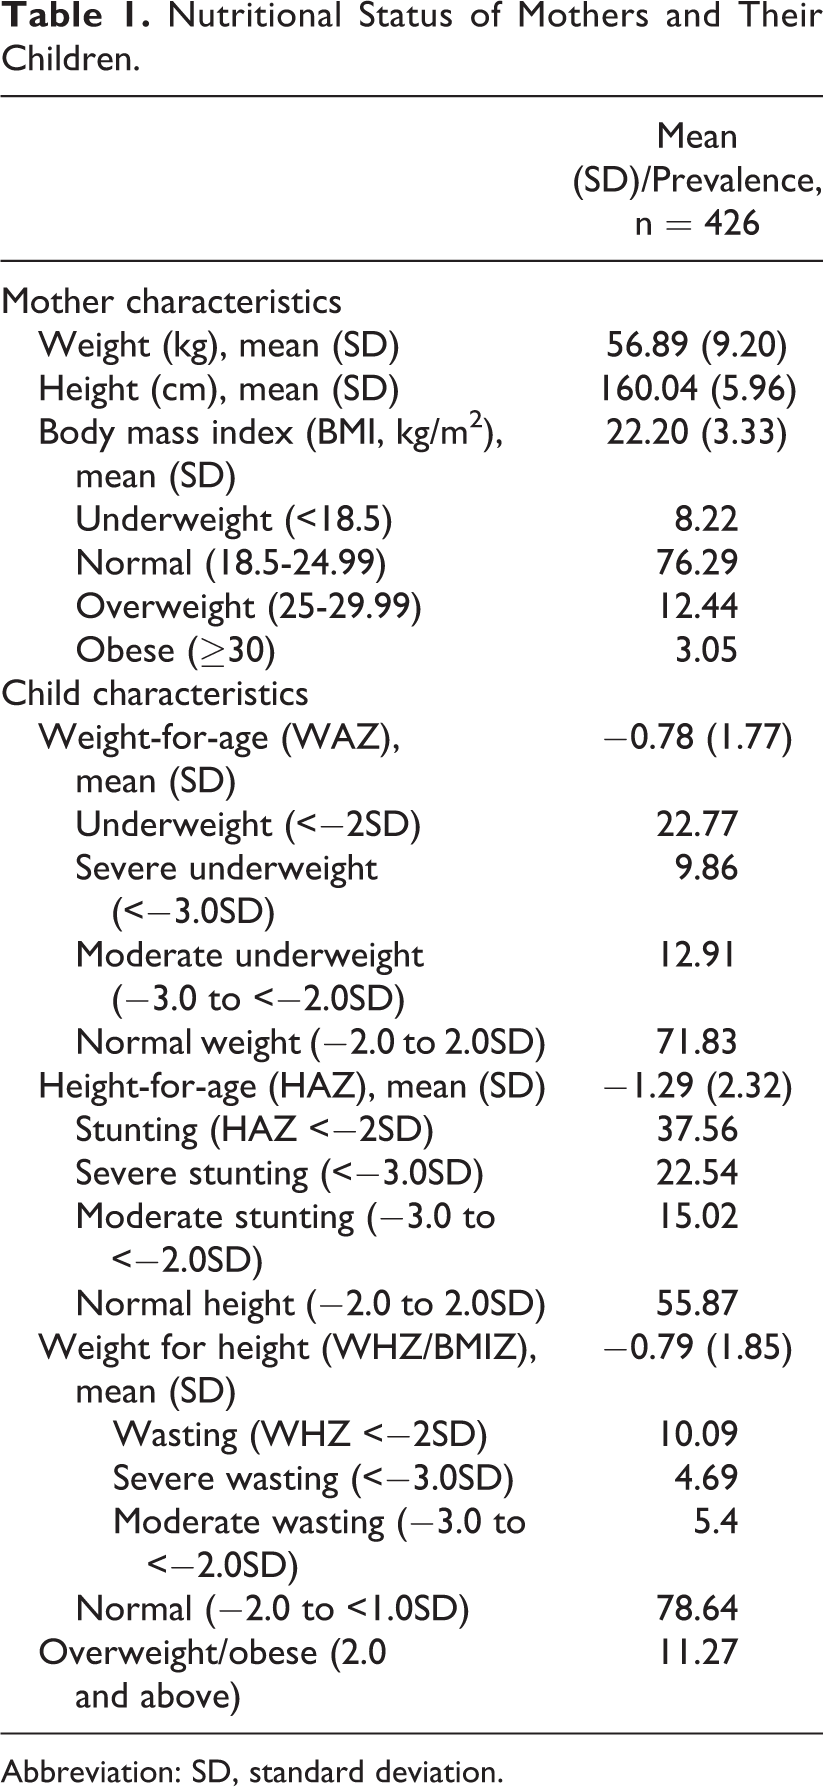
Abbreviation: SD, standard deviation.
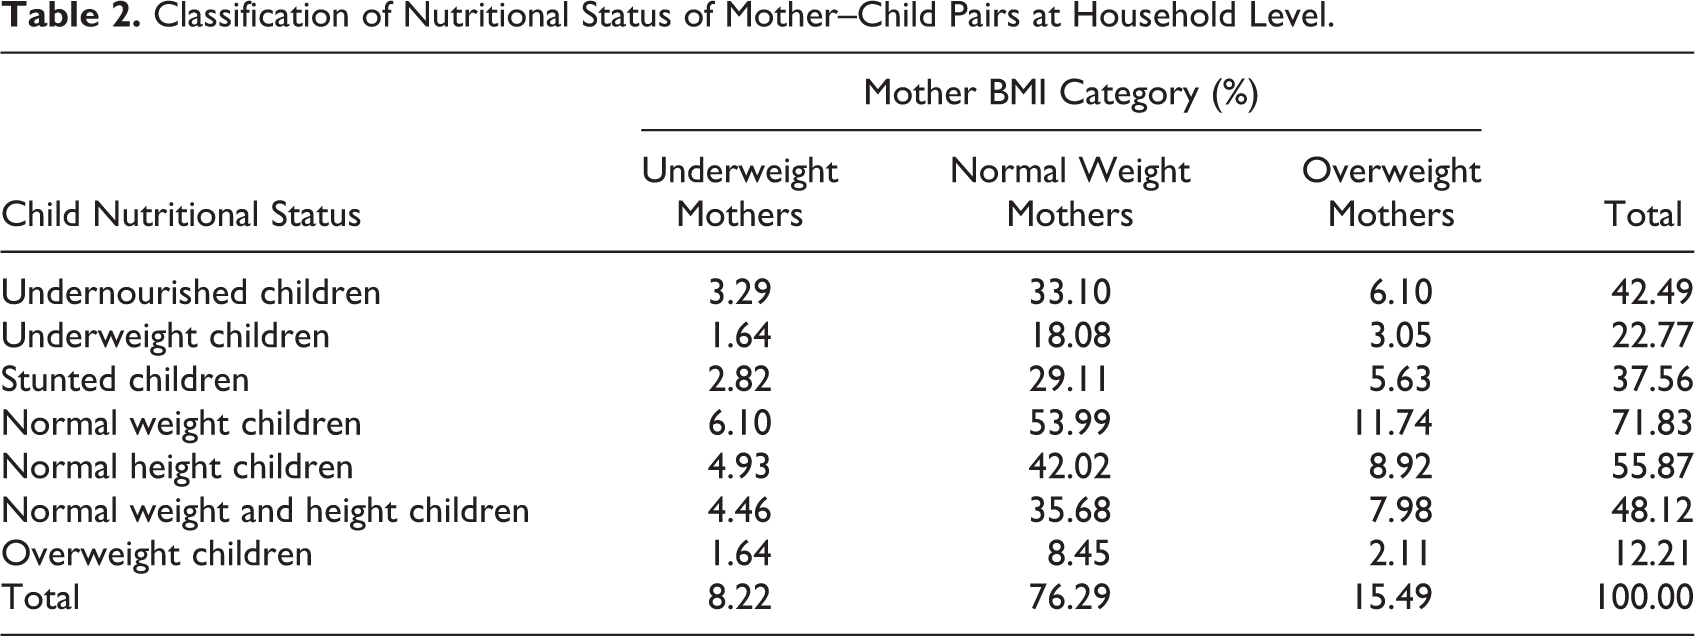
Households with a normal mother paired with normal weight child (54%) were found to be the most prevalent in the study area (Table 2). The coexistence of overweight/obese mother and undernourished child was observed in 6.1% of surveyed households. However, there was a higher prevalence of households with overweight/obese mother–stunted child (5.6%) than households with overweight/obese mother–underweight child (3.1%). Overall, there were 6.1% of DBM households, 33.1% of undernourished children-only households, 10.1% of overweight/obese mother-only households, and 35.7% had no undernourished children or overweight/obese mothers (Figure 2).
Classification of Nutritional Status of Mother–Child Pairs at Household Level.
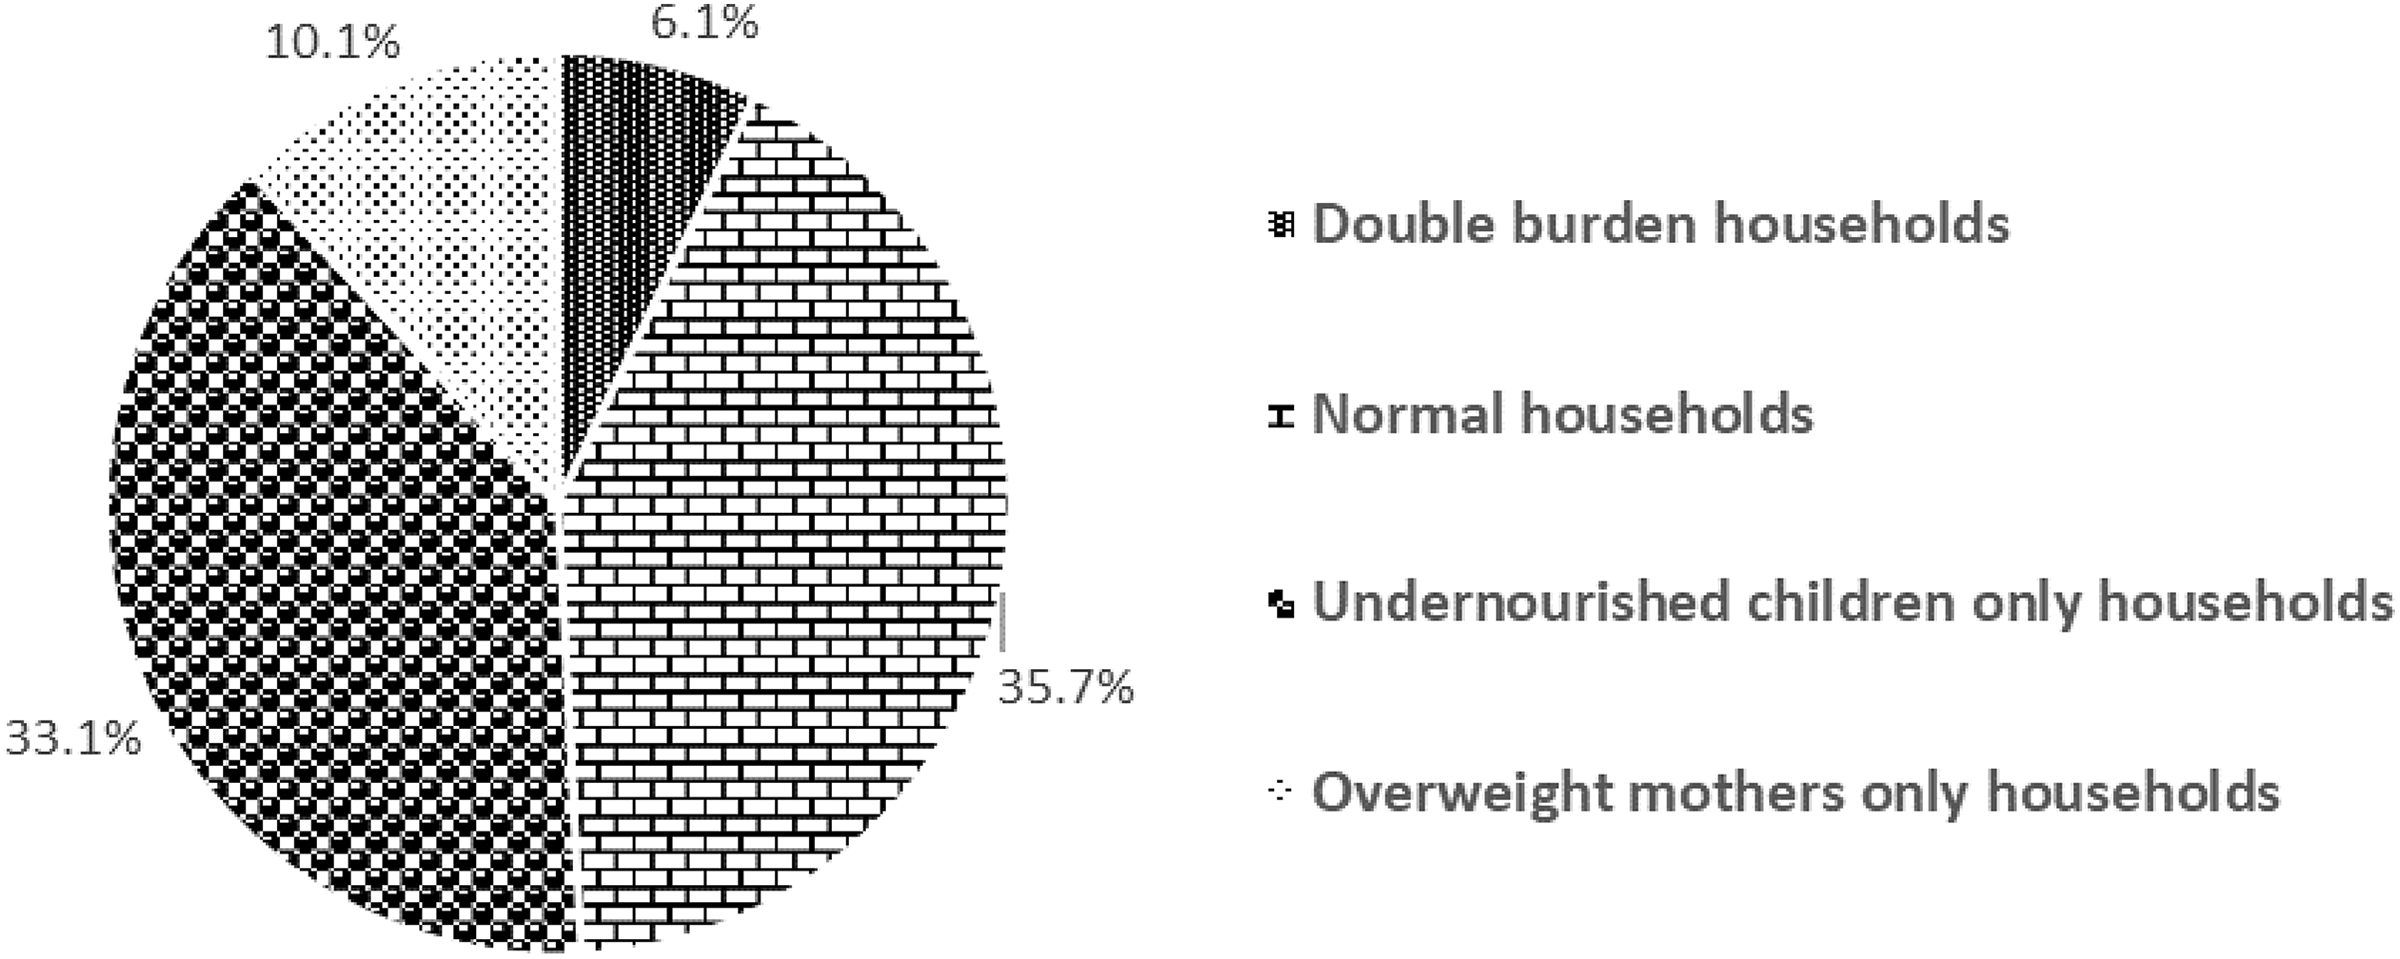
Prevalence of different nutritional phenotypes of households.
Socioeconomic and Nutritional Profile of Households
In Table 3, overweight/obese mothers households tended to have greater SES (high SES 37.8%; business/service 28.2%), greater maternal education (15%), less food insecurity (15%), and better household health and sanitation (latrine 25%; unsafe water 64.1%), although there were no significant differences between the 4 households groups (P > .05). This is in contrast with undernourished children households: low SES (30.1%), education (9.8%), and sanitation (latrine 13.5%; unsafe source of water 77.1%). The DBM households shared several socioeconomic features with undernourished children households, except for a greater (not significant) SES score. Finally, when considering ethnicity, Gando ethnic groups had a greater prevalence of DBM (46%), Boo for undernourished children (29%) and overweight/obese mother (27%), Peulh for undernourished children (20%) and DBM (19.2%), and Bariba ethnic group for overweight/obese mother (20%).
Sociodemographic Characteristics of Households by Nutritional Phenotype.
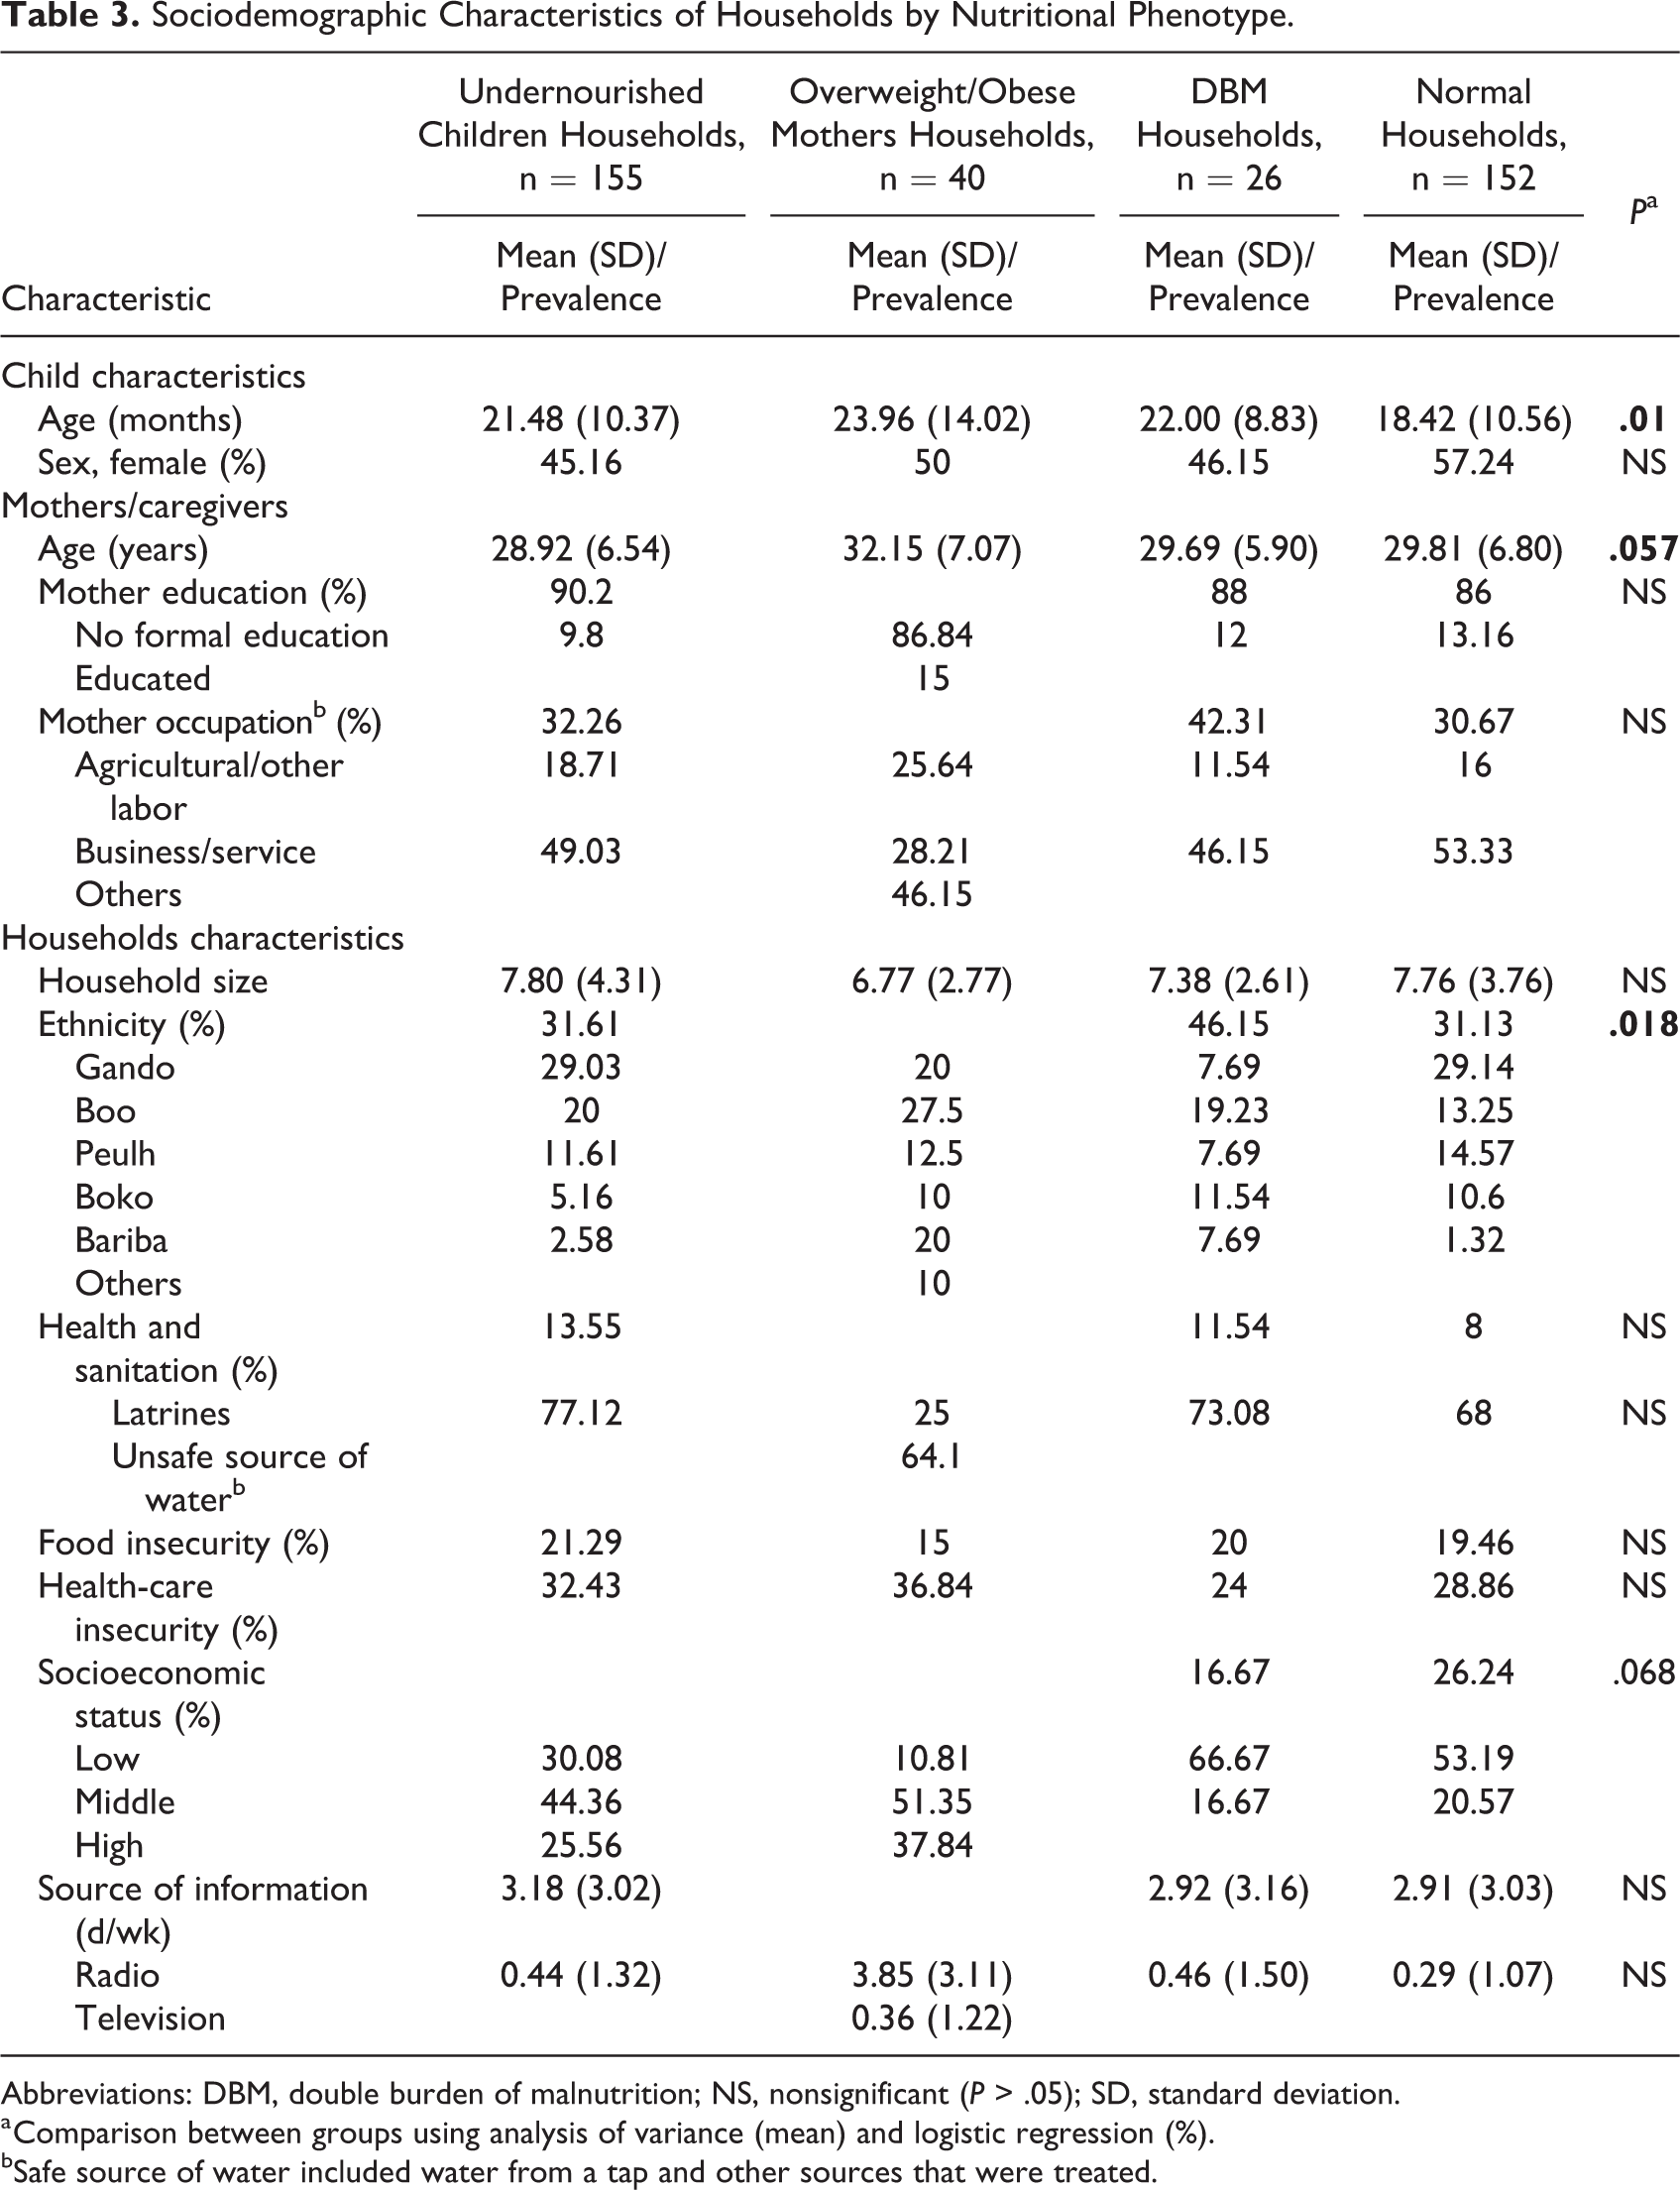
Abbreviations: DBM, double burden of malnutrition; NS, nonsignificant (P > .05); SD, standard deviation.
a Comparison between groups using analysis of variance (mean) and logistic regression (%).
bSafe source of water included water from a tap and other sources that were treated.
In Table 4 where food-related characteristics of mothers and their children were presented, there were no significant differences in DDS between all 4 of households (P > .05). However, when considering food groups, a greater proportion of mothers in undernourished children or DBM households reported the consumption of roots and tubers (P = .048). In overweight/obese mother households, mothers consumed a greater proportion of meats (45%, P = .04), fish (22.5%, P = .04), and fruits (5%, P = .09). However, mothers in DBM households tended toward less frequent consumption of meat (26.9%), fish (7.7%), and fruit (3.8%). Similar to their mothers, children in overweight/obese mother households consumed more meat, poultry and fish, and fruits. Interestingly, children in DBM households had low consumption of fruits and vegetables (15.4%; P = .03) while consumed more legumes (15.4%, P = .04) compared to other groups.
Food-Related Characteristics of Mothers and Their Children by Nutritional Phenotype.
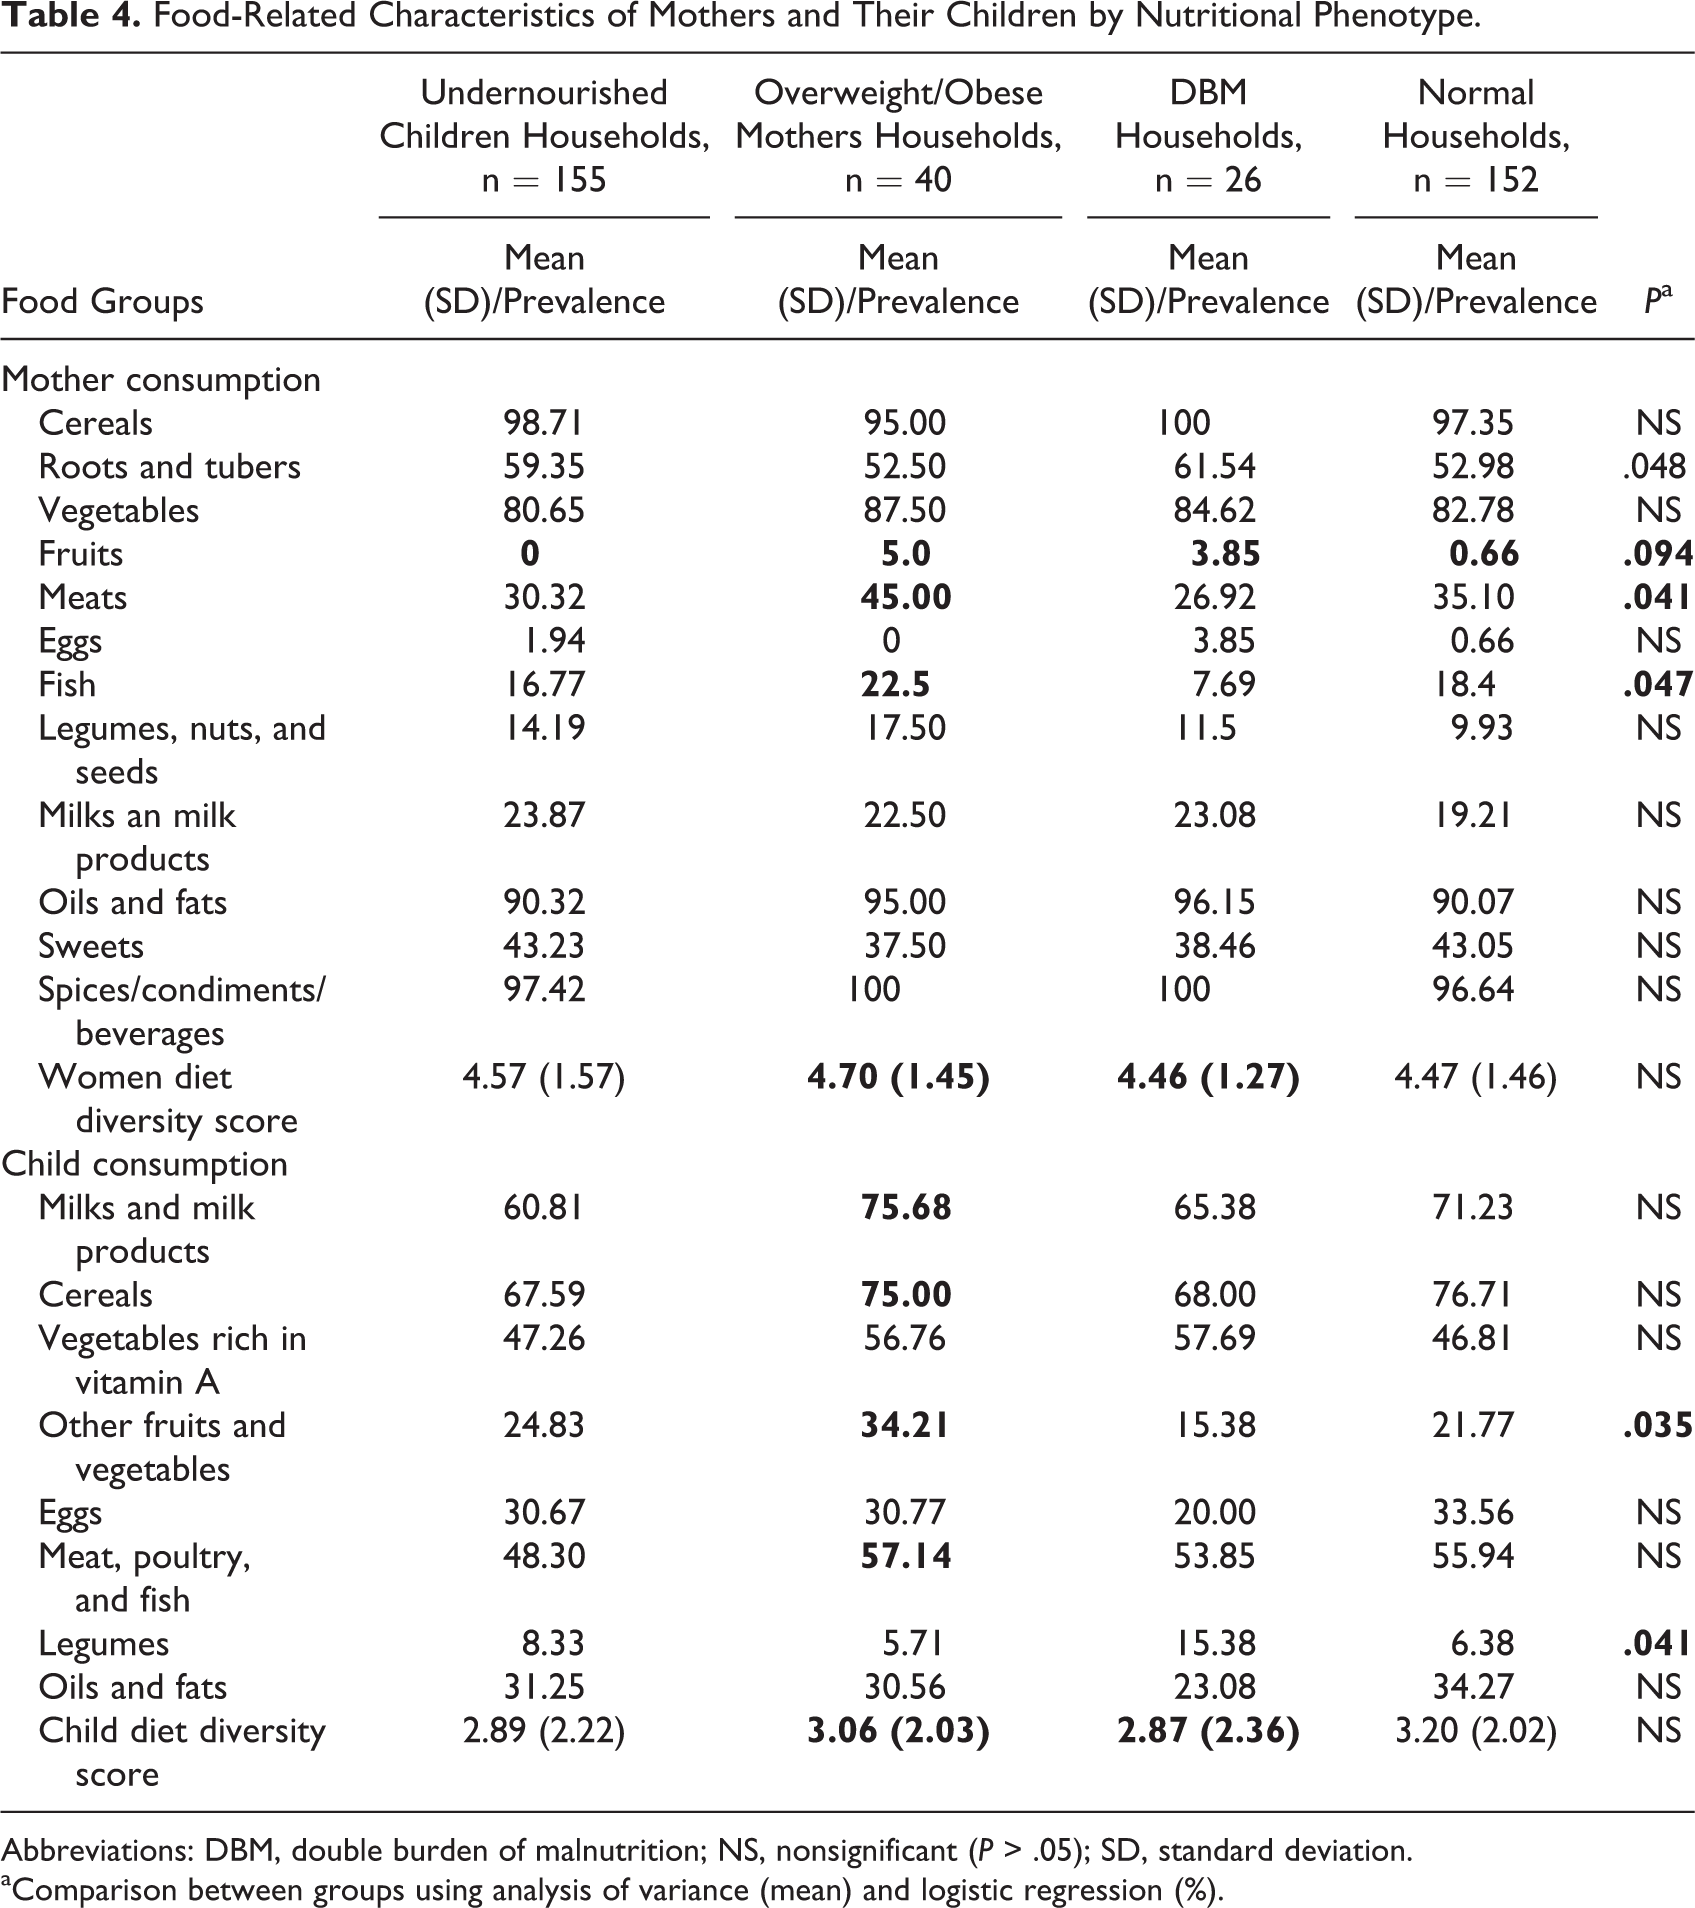
Abbreviations: DBM, double burden of malnutrition; NS, nonsignificant (P > .05); SD, standard deviation.
aComparison between groups using analysis of variance (mean) and logistic regression (%).
Demographic and Socioeconomic Factors Associated With Different Nutritional Phenotypes Among Mother–Child Pairs
In multivariate analyses (Table 5), maternal occupation (business/service) and high DDS were strongly associated with increased odds of overweight/obese mother households, whereas educated mothers were negatively associated with undernourished children (AOR = 0.39; P = .047) and DBM (AOR = 0.94; P = .036) households, and maternal older age (40-49 years) was associated with a lower odds of undernourished children households (AOR = 0.31; P = .022). Child characteristics, such as older age (24-59 months), were associated with increased odds of undernourished children, overweight/obese mother, and DBM households, whereas low/median child food diversity was positively associated with undernourished children (AOR = 2.06; P = .048) and DBM (AOR = 2.18; P = .045) households compared with normal households.
Determinants of Undernourished Children, Overweight Mothers, and Double Burden of Malnutrition in Southern Benin.
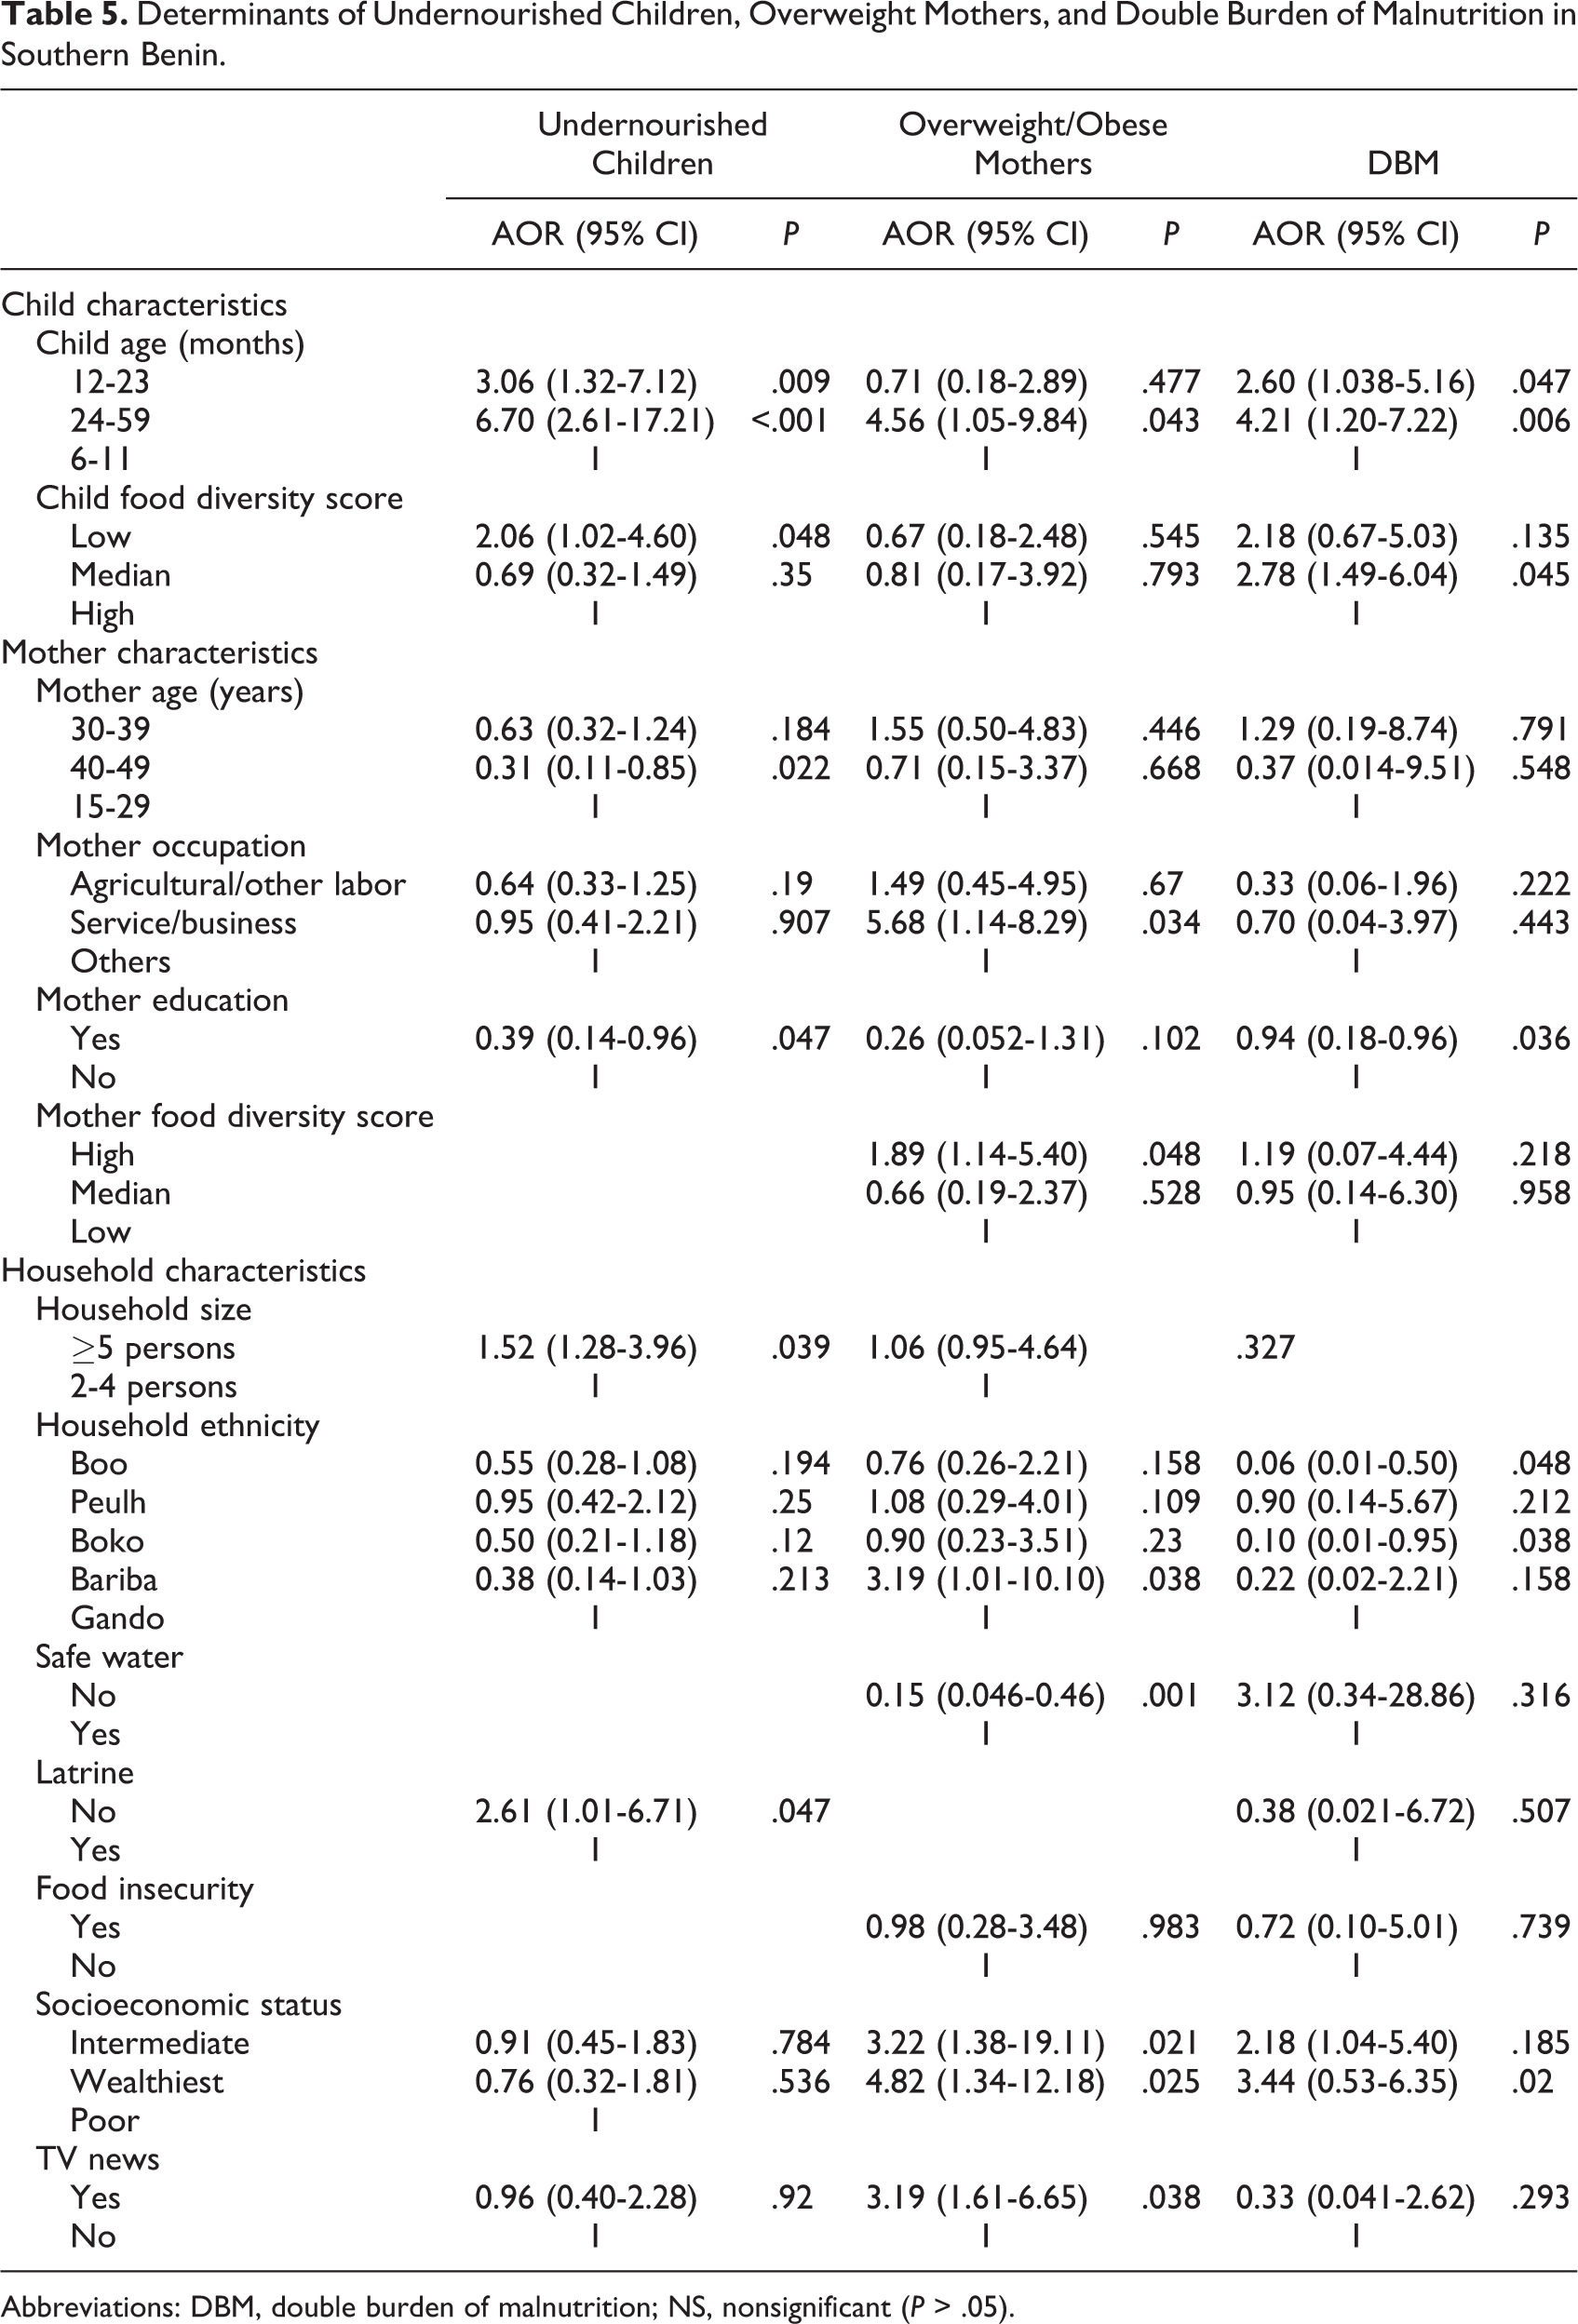
Abbreviations: DBM, double burden of malnutrition; NS, nonsignificant (P > .05).
Among household characteristics, large family size was significantly associated with increased odds of undernourished children households, lack of latrine was associated with increased odds of undernourished children households (AOR = 2.61; P = .047), whereas safe water was negatively associated with overweight/obese mother households (AOR = 0.15; P = .001). Household ethnicity, such as Bariba ethnic group, was significantly and positively associated with overweight/obese mother households (AOR = 3.19; P = .038), while Boo and Boko ethnic groups were negatively associated with DBM households compared with Gando ethnic groups. High SES also predicted overweight/obese mother (AOR = 4.82; P = .025) and DBM (AOR = 3.44; P = .020) households. Surprisingly, greater TV listening was associated with increased odds of overweight/obese mother (AOR = 3.19; P = .038).
Discussion
Similar to Benin DHS, 9,10 DBM occurs in Kalalé district, with a high prevalence of overweight/obese women (15%) coexisting with a very high prevalence of child undernutrition (underweight 22.7%, stunting 37.6%, and wasting 10.1%). This DBM phenomenon at community level could be partially due to high proportions of stunted children. There was indeed a significant correlation between maternal height and their children’s height z score (r = 0.18, P = .0003) that could be due to the intergenerational transmission of stunting from mother to child, in which poor intrauterine growth brought on by a undernourished/stunted mother is associated with low birth weight and stunting in early childhood. 35,36 Another possible explanation for DBM is that, during dry season, rural populations are particularly vulnerable to the nutrition transition because they are more likely to experience hunger and are often reliant on inexpensive hyperprocessed foods that contain high amounts of saturated fat, sugar, and salt. 37,38 Consequently, even without the presence of Western fast-food chains, they experience a shift from highly mobile lifestyle (subsistence farming and hunting–fishing gathering) to Westernized diets and sedentary lifestyle. 39
In comparison to a recent study in Malaysia that reported 29.6% of rural households with DBM, 40 we found a lower intrahousehold DBM in Kalalé district of northern Benin (less than 10%). However, as expected, in poor urban areas of Benin, the prevalence of DBM households was 16.2%, 13 probably due to the concentration of female overweight in urban areas. This difference might also be a reflection of the different environmental, cultural, and socioeconomic situations in both areas of Benin which further implicates the important role of poverty, food insecurity, and infectious disease burden in maternal and child undernutrition. 41,42 According to Doak et al 43 and Jehn and Brewis, 44 the proportion of DBM households was low in poor countries and at an early stage of nutritional transition. In our study, 14.4% of households with undernourished child also had an overweight mother, while 39.4% of households with overweight mother had an undernourished child. These numbers demonstrate an early stage of nutrition transition and the severity of child undernutrition in rural areas of low-income countries, suggesting that efforts at achieving effective control of maternal and child undernutrition need to continue with a focus on rural areas. 12
Our findings also identified a significant link between dietary scores and nutritional outcomes, which mean that improved food variety may indeed reflect a greater likelihood of meeting daily energy and nutrient requirements that can result in improved nutritional status. 45,46 However, these relationships have not been consistent. For example, Vandevijvere et al 47 did not find a relationship between women DDS and BMI, while Savy et al 48 found a significant association between DDS and women’s nutritional status. In contrast, Azadbakht and Esmaillzadeh 49 found an inverse association between DDS with obesity in young females. A possible explanation could be related to different definitions of DDS. In addition, public policies related to nutrition have historically recommended a diverse diet because multiple food items are needed to contain all the nutrients. Varied diet reduces the risk of developing nutritional deficiencies, as shown in many studies, 50,51 but dietary variety is also associated with higher energy intake, overweight, and obesity. 52 These results highlight the importance of nutrient density that allow the consumption of diets that cover nutritional needs without increasing the risk of becoming obese. 53
In addition to diet, some sociodemographic characteristics such as older age child, maternal older age and education, large family size, and lack of latrine were associated with undernourished children households. High SES, older age child, work status of the mother, ethnicity, safe water, and information through TV were also associated with overweight/obese mothers, while high SES, older age child, mother education, and ethnicity were associated with DBM. Similar results were found in LMICs for undernourished children, 54,55 overweight/obese mother, 56,57 and DBM households. 58 The significant relation between older children (12-59 months) and undernutrition indicated limited diversity in complementary foods, suggesting that attention should continue to be paid to these groups of populations. The finding on large family size is instructive if one considers the low standard of living in Kalalé district and living in large family size can translate to more financial burden and less food to eat. 59 As for older age mother, adolescent childbearing has been closely linked to poor child feeding. 60 Access to latrine was also a significant predictor, indicating that promoting hygiene could improve child’s health. 61 Finally, like our study, Tuoyire 62 found that TV viewing is a contributing factor of obesity, possibly because mothers who had TV in their households inherently spent a lot of time viewing TV in place of engaging in physical activities, resulting in an overall decrease in energy expenditure.
The significance of ethnicity in explaining nutritional status indicated the need for further analysis of cultural factors such as food taboos among and within ethnic groups. 57 Since water is calorie-free and therefore can reduce the risk of obesity, our finding is probably due to the household’s capability to acquire safe water in the study area. Indeed, Mulenga et al 63 found that access to improved water is concentrated among the wealthier households in rural areas. A possible explanation of the association between high-income households and DBM is that households with higher income may enter the nutrition transition. Producing changes in dietary and activity patterns increases the risk of overweight and obesity, whereas many of the risk factors for undernutrition remain. 64 Finally, contrary to studies that found that mother’s knowledge did not translate into healthy practice, 65 the current study reported that undernourished children and DBM households were negatively associated with the mothers’ education. Evidence indicates that the association between education and obesity in LMICs is complex and may even vary within the same country. 64 Discordant results for education related to obesity in women suggest that traditional primary and secondary education may not be sufficient to reduce the risk of DBM, but rather that specific education on nutrition and child feeding practices may be a more effective intervention strategy to reduce DBM in rural populations.
Although the present study provides useful data on prevalence of nutritional indices in connection with dietary, socioeconomic, and demographic factors in vulnerable populations, it nevertheless has limitations. First, our study findings should be interpreted with caution due to being a cross-sectional study. In addition, dietary data were collected for only one qualitative 24-hour recall. This can potentially limit the true dietary diversity on different days of the week. It is, however, important to note that in Kalalé district where diets are relatively monotonous, a 1-day recall reflects usual intakes at population level better than it does in situations where dietary diversity is higher. 66 Self-reporting of dietary data in a food insecure population where respondents might assume that underreporting of consumption offered a possible opportunity for food support could also introduce a potential bias. Another limitation is the survey was undertaken in one season so changes could be measured during the same time period. A DDS based on an annual pattern done in different seasons may better explain the true DDS of the study population. Finally, this study was restricted to one geographic region; thus, the results of our study cannot be generalized to the rural Beninese population.
In conclusion, although the DBM was low at the household level, it coexisted at community level among women and children of Kalalé district in northern Benin. Dietary diversity scores demonstrated the link between dietary quality and maternal and child nutritional status. This study also supports the relationship between mother and child dietary nutritional status and that anthropometric indices reflect the social, cultural, and economic contexts of the populations concerned. Given the paucity of previous data in rural populations in Benin, our results represent a starting point for future research. These call for a coordinated study in various parts of the country to substantiate the current data so that appropriate and beneficial strategies can be planned to reduce the DBM.
Footnotes
Authors’ Note
H.A. led the data collection activities and designed the evaluation. I.A. analyzed data with input from H.A.. All the authors participated in drafting and revising the manuscript.
Acknowledgments
The authors thank the participants and the village delegates, nurses, and enumerators for their support in carrying out this research. They wish to express their very special appreciation to ADESCA-ONG team, Drs Douglas Taren, Jennifer Burney, and Rosamond Naylor whose contribution was central to this project.
Declaration of Conflicting Interests
The author(s) declared no potential conflicts of interest with respect to the research, authorship, and/or publication of this article.
Funding
The author(s) disclosed receipt of the following financial support for the research, authorship, and/or publication of this article: This work was supported by the University of Stanford, Hellman Fellows Program at UC San Diego, and the University of Arizona.