
Abstract
Background:
Kwashiorkor is a major classification of severe acute malnutrition whose etiology remains elusive. It is estimated to affect hundreds of thousands of children annually, but no accurate global prevalence figures are available. Little is known how prevalence varies within populations, an important undocumented aspect of kwashiorkor obscured by the aggregation of prevalence or incidence of the condition across large populations and geographic areas.
Objective:
To estimate the prevalence of kwashiorkor in select neighboring villages of the eastern Democratic Republic of the Congo (DRC) and assess if prevalence can vary dramatically among neighboring villages.
Methods:
An anthropometric census survey evaluated 1328 children aged 12 to 59 months within all 19 villages in one health area of eastern DRC, recording all cases of kwashiorkor, diagnosed by bipedal pitting edema.
Results:
Village-level prevalence of kwashiorkor in the study area varied from 0% to 14.9%. Interviews with health services staff in the study area and across 2 provinces confirmed that current differences in prevalence reflect a long-term pattern and are a common feature of kwashiorkor throughout this region.
Conclusions:
Aggregation of kwashiorkor prevalence and incidence data across large populations or geographic regions poses several risks to understanding the epidemiology of kwashiorkor. If clustering of kwashiorkor is not taken into account, (1) nutritional crises in particular villages may go undetected; (2) the real effect of interventions may be underestimated; (3) interventions may be inappropriately targeted, leading to reduced coverage, efficacy, and cost-efficiency; and (4) important insights into the root causes of kwashiorkor may be lost.
Background
Severe acute malnutrition (SAM) is classified into marasmus, kwashiorkor, or marasmic–kwashiorkor (a mix of the two; note 1). 1,2 Kwashiorkor was first documented as a specific syndrome in the 1930s, 3 –5 yet despite more than 80 years of research, the specific causes and mechanisms leading to the onset and progression of kwashiorkor remain elusive. 6 –10 The epidemiologic distribution of kwashiorkor cases at a local level has not been thoroughly explored yet may be a key component to understanding the nature of the disease and its treatment, prevention, and etiology. This article examines the geographic distribution of the prevalence of kwashiorkor in one health area (note 2) of eastern Democratic Republic of the Congo (DRC) and hypothesizes that the aggregation of prevalence data at a high level may mask communities in nutritional crisis.
Although the term “kwashiorkor” describes a syndrome of signs such as edema, hair and skin changes, lethargy or anxiety, and a fatty liver, World Health Organization guidelines on the management of SAM use bipedal pitting edema as the sole diagnostic criterion for treatment. 4,11 Therefore, the term “edematous malnutrition” is often used in relation to therapy, while the term “kwashiorkor” is used to refer to the wider syndrome. This article will follow this usage of terms.
It is estimated that “hundreds of thousands of children” suffer from kwashiorkor annually, but there is a lack of accurate estimations of its global prevalence. 4 According to Briend, this has allowed kwashiorkor to become a neglected disease. 6,10 Although Sustainable Development Goal 2.2 aims to “end all forms of malnutrition,” the targets measure wasting and stunting, but not kwashiorkor. 12 Neither the initial 2008 Lancet Series on Maternal and Child Nutrition nor the 2013 update to the series addresses kwashiorkor. In 2008, when 2 contributors expressed concern at this omission, the authors of the series pointed to the fact that “there are no reliable data available at country level to quantify the number of children with edematous malnutrition”. 13 –15
The Community-Based Management of Acute Malnutrition (CMAM) forum has attempted to increase recognition of the scale of the problem of kwashiorkor as well as to illuminate its geographical distribution by conducting a review of 2515 data sets representing more than 1.7 million children, calculating the proportion of SAM cases identified which were edematous, that is, either kwashiorkor or a mix of kwashiorkor and marasmus. 4 Although the data are broken down by country, there can be large differences within a country and the aggregate figures can hide areas where kwashiorkor is especially common. Courtright and Canner showed prevalence varied greatly between neighboring districts in Malawi, 16 and Fonaroff noted in 1969 that in Jamaica kwashiorkor tended to cluster in villages of a particular typology related to childcare habits, presence of parents, adequacy of landholding, and other similar factors. 17 The CMAM forum calculated from prevalence data that 32% of SAM cases in the DRC were edematous. Focusing on individual portions of the country, data from the Ministry of Health (MoH) in North Kivu Province, DRC showed that in 2012 more than 55% of children treated for SAM in that province were edematous, and a prevalence survey in one Health Zone of North Kivu reported that all cases of SAM in the sample were edematous and not mixed with wasting. 18,19 At about the same time, surveys in other parts of the country reported only 4% to 6% of SAM was edematous. 20,21 The national figure of 32% therefore hides large areas of the country with a much higher proportion of SAM prevalence attributable to kwashiorkor.
The most common nutritional survey method uses a cluster sampling design based on assumptions about the level of clustering among cases of wasting and gives a single prevalence figure for the entire sample population. 22 Sampling strategies in standard nutrition surveys do not allow comparisons of survey subpopulations and cannot identify pockets where cases cluster, leaving communities experiencing nutritional crises undetected. Additionally, studies to detect risk factors leading to kwashiorkor also do not currently take into account the potential for chronic, uneven distribution of kwashiorkor at the local level. They are therefore unable to detect community-level factors that may increase the risk of kwashiorkor.
This study provides evidence of a highly clustered distribution pattern for kwashiorkor common in eastern DRC and highlights the potential opportunities and risks associated with understanding or ignoring that pattern. The analysis presented here aims to provide evidence to improve the design of studies on factors leading to high risk of kwashiorkor through a better understanding of its distribution within populations.
Methods
The study design was a cross-cutting census survey, screening all children 12 to 59 months old in one health area. The DRC MoH uses provinces as its largest administrative unit, then health zones that are further broken down into health areas. The study area was the Murambi/Malehe Health Area of Kirotshe Health Zone, North Kivu province. This health area was selected because the MoH estimated there was a relatively high general prevalence of kwashiorkor, it was easily accessible, and there was sufficient physical security for study staff.
Children 12 to 59 months old were eligible regardless of the child’s nutritional status but excluded if they were under treatment for an illness lasting more than 6 months as this could have affected height and weight. If there were more than 1 eligible child in a household, all were included. This age population was selected because it contained the highest proportion of all cases treated, according to provincial MoH records. In this region, cases younger than 12 months are relatively rare. It is also much more difficult to diagnose pitting edema among these younger children and their inclusion would have increased measurement error. Eight children were missed where the caregiver was absent or unwilling to give consent. A total of 1328 children, 99.6% of the total population of 12 to 59 months old, were registered and screened. The figure given includes 96% of available children and therefore is considered a census or population measurement rather than a sample measurement. If this was a sample, the number of children would be large enough to detect a difference in proportions between 4.5% and 3% with a power of 0.8.
The survey was conducted in June 2016, at the start of the one short, 2-month dry season. The “dry season” is drier only relative to the “rainy season” and does receive enough rain throughout to continue cultivation. Many crops continue almost without seasonal variation, and there was no indication whether from secondary data, interviews with health-care staff or with parents, that incidence of kwashiorkor varied seasonally in the study area.
Using the normal admissions protocol, only bipedal pitting edema was used in the classification of cases of edematous malnutrition. 2,23 Other signs, such as hair changes, lethargy, and sometimes skin changes were observed to accompany the edema, but were not recorded. Following standard diagnostic methods, edema was detected by pressing the skin at particular points for 5 seconds, then releasing to see if a dimple remained. 2 Age was recorded to the nearest month and middle upper arm circumference (MUAC) was recorded to the nearest millimeter with the cutoff for severe wasting being 11.5 cm. 1 Measurements from 3 participants were discarded as either having an age outside of the inclusion range or a physically improbable measurement.
The prevalence of edematous malnutrition was calculated as the number of children with bipedal pitting edema divided by the total number of children screened. The prevalence of wasting was calculated as the number of children with MUAC less than or equal to 11.5 cm divided by the total number of children screened. The prevalence of SAM was calculated as the number of children with either kwashiorkor or MUAC less than or equal to 11.5 cm divided by the total number of children. If a child had both edema and wasting, he was counted in both the edema and wasting prevalence, but only once in the SAM prevalence.
Ethical Reviews and Consent
Ethical reviews of the study protocol were conducted by the Tufts University Social, Behavioral, and Educational Research Internal Review Board in Medford, Massachusetts, and the Université Catholique de Bukavu Commission Institutionnelle d’Ethique in Bukavu, DRC. Informed consent was obtained from the caregivers of all registered children. Although no local treatment for SAM was available, parents of children with SAM were counseled to present their children to the local health clinic for referral to the Kirotshe Hospital for treatment.
Results
A total of 1328 children 12 to 59 months old were registered and screened. Because we evaluated all but a few children present, we were able to calculate the prevalence of edematous malnutrition at the village level. Table 1 provides a summary of the results.
Population Characteristics.
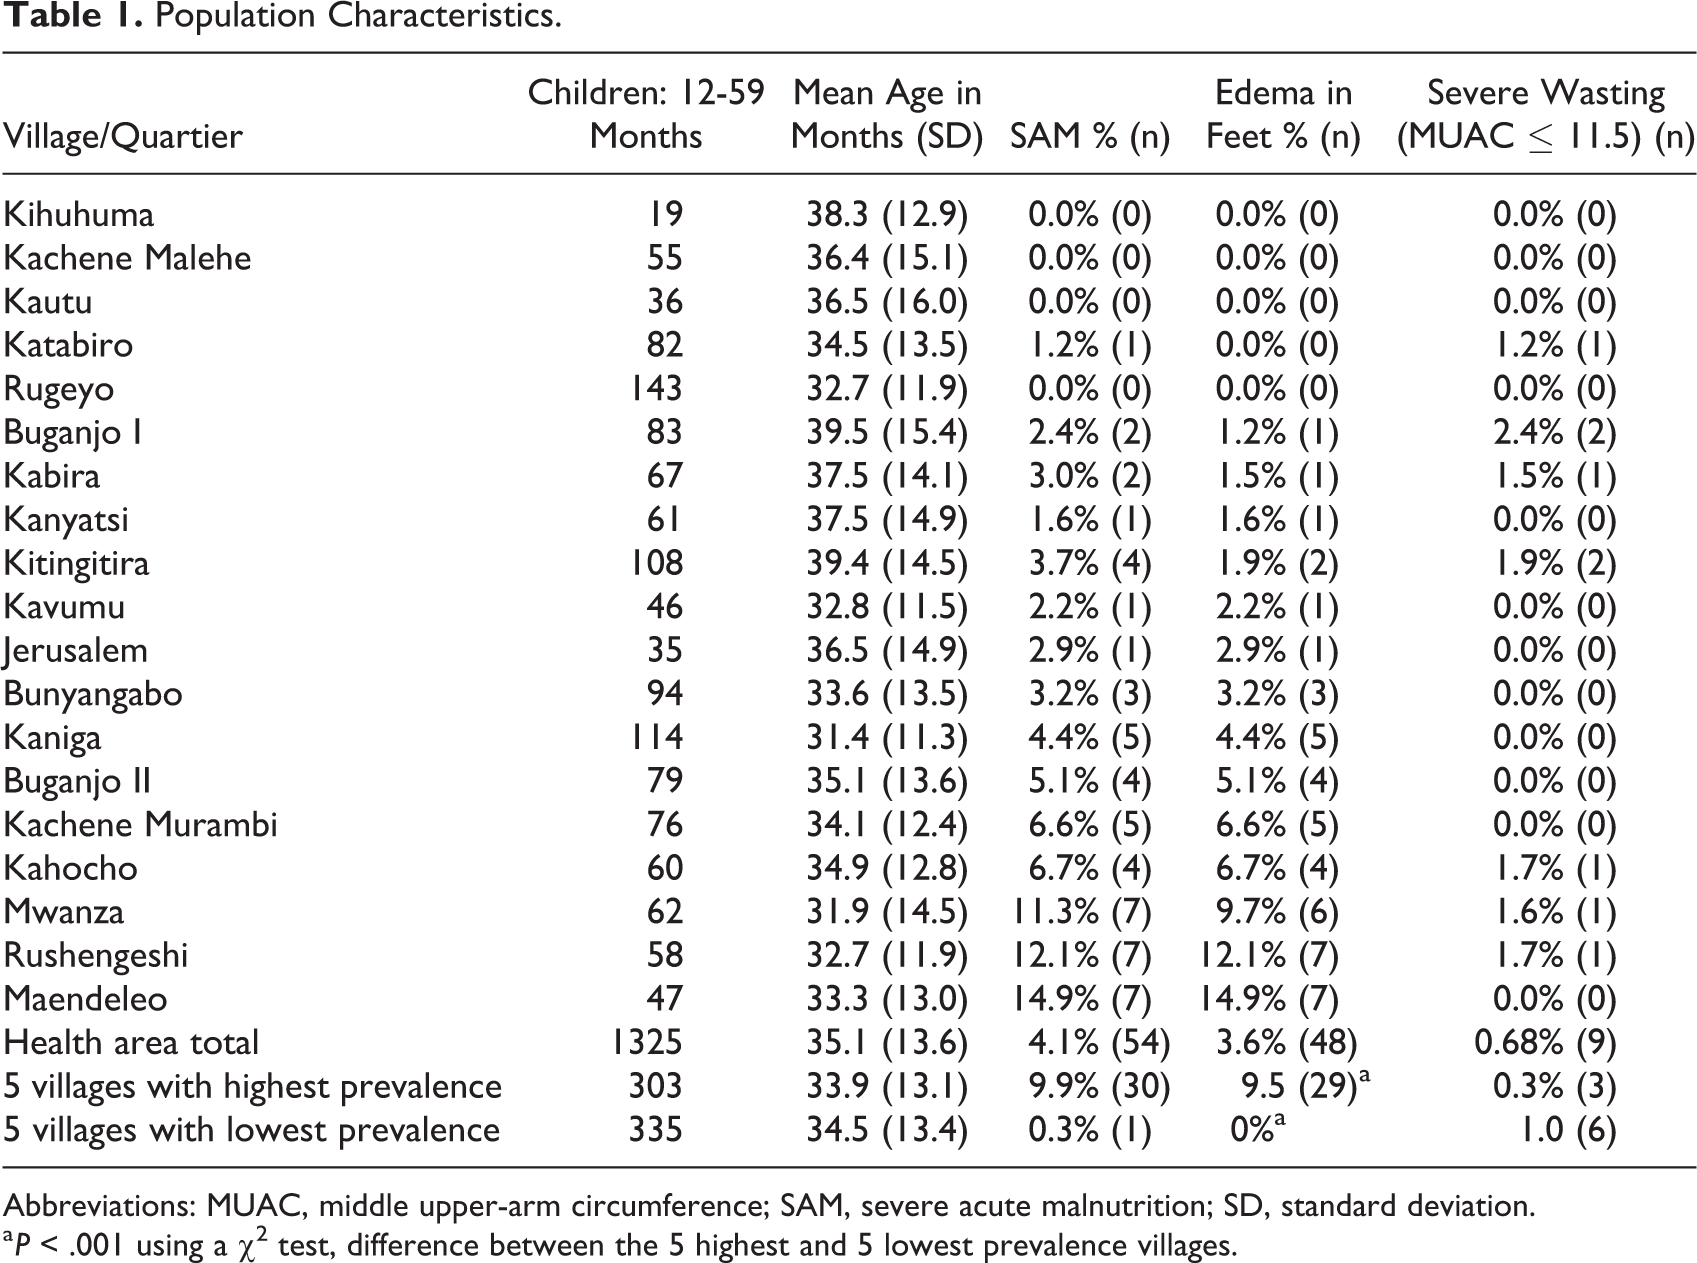
Abbreviations: MUAC, middle upper-arm circumference; SAM, severe acute malnutrition; SD, standard deviation.
a P < .001 using a χ2 test, difference between the 5 highest and 5 lowest prevalence villages.
The overall prevalence of edema for this population was 3.6%, but within that area, village prevalence ranged from 0% to 14.9%. A prevalence of 3.6% for SAM would generally be considered high but not a crisis and would not attract unusual attention. 24 A prevalence of 14.9%, on the other hand, indicates a community under extreme nutritional stress. 24
Kwashiorkor is usually found in populations where wasting is also found, but both wasting and edema are not always found in the same child and its distribution within a population can be very different. Although the correlation between wasting and edema among children was statistically significant (P < .003) using the Fisher exact test, only 9 children were severely wasted. Of the 48 children with edema, only 3 (6.2%) of these children were also severely wasted (MUAC ≤ 11.5) and 6 children had severe wasting but no edema. The correlation between prevalence of wasting and edema by village was very small (.063) and not significant (P < .798).
The map in Figure 1 provides an idea of the proximity of these villages and their respective prevalences. The total health area with its 19 villages can be contained within a box 4 km × 4 km. The region is mountainous and houses run roughly in 1 or 2 rows to either side of a road or path that follows either a ridge or a valley. GPS coordinates taken at either end of a village and perhaps the center of a curve in the road with a line connecting the points and a buffer to either side of the line give a close approximation of the residential areas of each village. The villages are shaded according to their kwashiorkor prevalence, with lighter shades indicating lower prevalence and darker shades for higher prevalence.
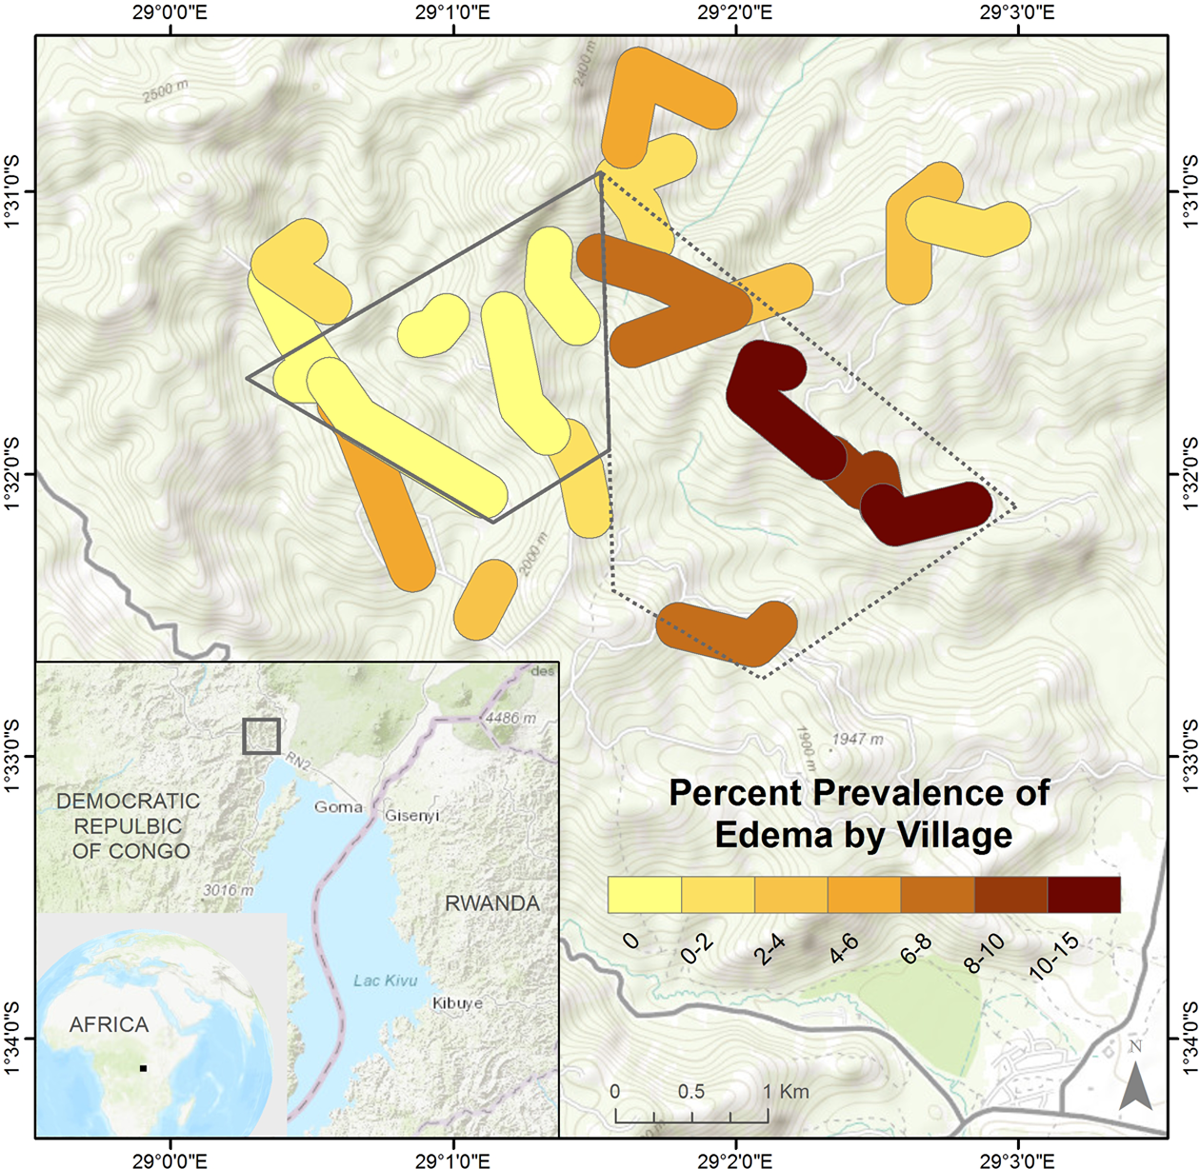
Map of villages in the study area, colored by prevalence of kwashiorkor, with clusters of high and low prevalence indicated.
When the villages are listed in rank order by their prevalence of edema, the differences appear to be gradual. But a visual inspection of the map shows there are definite spatial trends to the distribution of the cases. The map clearly shows one area (outlined with a solid line) with the 5 villages devoid of cases. The area indicated by the dashed line encompasses the 5 villages with the highest prevalence, containing 29 of the 48 cases screened in the entire study area. Taken as subpopulations, these groups had similar numbers of total children screened, 335 and 303 respectively, with prevalence of 0% and 9.5%, respectively (P < .0001).
Interviews with health-care staff in 10 health areas across 5 health zones in 2 provinces suggest that the presence of high and low pockets, as shown on this map, may be generalizable at least to eastern DRC. In each health center, staff members were able to easily name villages or groups of villages that consistently produced the greatest and least number of cases and often did so before the question was asked.
Discussion
The 5 highest-prevalence villages, with 29 of the 48 cases identified, are clustered together, while immediately adjacent another 5 villages with a similar size population had no cases (Figure 1). The tight grouping of kwashiorkor cases may be more common than the 2 documented contexts (Jamaica and Malawi) and the DRC but has gone unnoticed because it is continually obscured by standard nutritional survey techniques. Nutritional surveys in areas where kwashiorkor is most prevalent are generally carried out by agencies with very limited resources. To minimize the staff, time, and transportation needed to conduct a survey, most use a standardized approach in which about 30 randomly positioned clusters of about 30 children each are measured, for a total of around 900 children. 23 This method produces a single prevalence estimate for the entire survey area. That area is often vast, representing tens of thousands of children, but this sampling method is widely accepted as effective for providing a single but accurate aggregate figure of prevalence of wasting for such large populations. 25 –27 It is, however, insufficient to allow comparisons of subpopulations within the full survey population, 26 hiding the fact that there may be communities with crisis levels of malnutrition within the larger sample population and leading to the conclusion that the nutrition situation of a population does not warrant a nutritional intervention.
The last nutrition survey conducted in the Kirotshe Health Zone, the zone in which the Murambi/Malehe Health Area is located, was conducted by Action Against Hunger (ACF) in August 2014. It gave a prevalence estimate of 0.3% (confidence interval [CI]: 0.1%-1.3%) SAM (all edematous) for the entire health zone and was similar to the previous survey in March 2011 which gave a prevalence estimate of 0.2% SAM (CI: 0.0%-0.7%; all edematous). 19 This consistency and the lack of major changes in the area between 2014 and 2016 make this a reasonable estimate for the current prevalence in Kirotshe Health Zone as a whole. Progressing from the more highly aggregated figures to the more disaggregated figures, we have 0.3% kwashiorkor prevalence for the health zone, 3.6% for the Murambi health area within that zone, and a range of 0% to 14.9% by village within that health area. Each figure gives a different impression of the nutritional status of the population, largely due to the clustering of cases.
These different impressions have a direct impact on resource allocation. With an estimated general SAM prevalence of 0.3%, ACF withdrew from the Kirotshe Health Zone in 2014. The health zone reports aggregated data from all 15 to 20 health areas within the health zone to the Provincial MoH level. Provincial MoH officials stated they were unaware of the clustering of kwashiorkor and unaware of the gravity of the situation in the high prevalence communities prior to the anthropometric survey conducted for this study. Several MoH staff from the provincial office participated in this survey and were so shocked by these concentrated pockets of kwashiorkor that they immediately reallocated resources to the Murambi Health Area to treat them.
Most kwashiorkor study samples are taken from children admitted to treatment programs with kwashiorkor and are compared to children without kwashiorkor, some from nonmalnourished hospital patients, without regard to their communities of origin, 28 –31 or the studies compare children from within the same community (or even the same family). 32,33 These sample selection methods imply 2 assumptions that this article challenges: (1) that only those children currently affected by kwashiorkor are exposed to key risk factors and (2) risk factors for kwashiorkor must lie at the household or individual level because not all children in a community or family have kwashiorkor at the same time.
This article provides a case study in which certain communities consistently generate many more cases than other nearby communities, not always from the same households. It is therefore likely that there are factors common within high-prevalence communities that increase the risk of kwashiorkor or other factors common in low-prevalence communities that are protective against kwashiorkor. In essence, all children in the high-prevalence communities (both those currently with and without kwashiorkor) may be subject to heightened risk. If so, comparisons of children from within the same community or household may not detect differences in particular factors because the 2 study populations have more similar risk than assumed.
The area studied was small, contained within a 3 km radius, and presents a single case study. Although interviews with health-care staff indicate that its generalizability very likely extends throughout North and South Kivu provinces, the general tendency to aggregate nutritional data throughout the world limits our ability at this point to determine how generalizable these results are. Nevertheless, understanding that this clustering effect exists, at least in some regions, provides an opportunity to increase the effectiveness of treatment through better targeting in those regions and to explore potential risk factors for kwashiorkor.
Another limitation of this study arises because the data analyzed in this article were collected as part of a larger study; the study was not specifically designed to investigate this clustering effect and therefore did not specifically record the observations of the clinic staff in detail prior to the collection of the data to test the accuracy of their observations. Even so, the villages to which the health center staff initially took the study team to show examples of areas with high and low prevalence were those later shown by the data in the prevalence survey to be the high- and low-prevalence clusters.
All villages in this survey shared the same climate, watershed, markets, language, health center, religion, and schools. Understanding why certain villages or groups of villages continually generate large numbers of cases of kwashiorkor, while others sharing the same general environment and services do not, allows us to control naturally for many potential confounders while not losing the ability to detect risk factors that may be common to households within a community. Such across-village comparisons will also avoid the risk of spurious associations introduced when comparing children with kwashiorkor to children hospitalized for different reasons who may not be representative of the general population. 34 A detailed examination of childcare practices, diets, and other factors that are common in low-prevalence communities, but not in high-prevalence communities, may be able to guide us toward new, durable, low-cost, socially acceptable solutions to prevent kwashiorkor. By first recognizing that certain communities may have a high burden of kwashiorkor while neighboring communities do not, then comparing the differences between those communities, we may gain new insights into the etiology of kwashiorkor and make steps toward its prevention.
Footnotes
Authors’ Note
M.F. conceptualized the study, led the data collection, analysis, interpretation of the data, and writing. D.M., A.K., S.G., and C.D. participated in the analysis, interpretation, and writing.
Acknowledgments
First and foremost, we are grateful to the many mothers who took time from their very busy days to make themselves available in support of this study. The Programme National de Nutrition (PRONANUT) was especially helpful in providing countless forms of support. The local humanitarian agency Rebuild Hope for Africa provided excellent administrative and logistical support. The MoH health staff and community health workers from the Murambi-Malehe Health Area were constant allies, providing information, connections to the communities, and helping build trust with so many mothers. Finally, René Balume and Martin Mulamba were instrumental in a thousand ways, every step of the way.
Declaration of Conflicting Interests
The author(s) declared no potential conflicts of interest with respect to the research, authorship, and/or publication of this article.
Funding
The author(s) disclosed receipt of the following financial support for the research, authorship, and/or publication of this article: The majority of the funding for this study was provided through almost 100 generous private donors who gave from their personal funds. Supplemental funding was provided by USAID/OFDA through a subgrant from Action Against Hunger and from the Dignitas Foundation through a subgrant from the Feinstein International Center at Tufts University. C.D. was supported in part by NIH K24 DK104676 and P30 DK040561. S.G. was supported in part by AID-OAA-L-10-00006.