
Abstract
Background:
Evidence-based nutrition programs depend on accurate estimates of malnutrition derived from data collected in population representative surveys. The feasibility of obtaining accurate anthropometric data as part of national, multisectoral surveys has been a debated issue.
Objectives:
The study aimed to evaluate changes in anthropometric data quality corresponding to investments by the Kenya Ministry of Health and nutrition sector partners for the 2014 Kenya Demographic Health Survey.
Methods:
Anthropometric data collected during the 2008 to 2009 and 2014 Kenya surveys were reanalyzed to assess standard parameters of quality: standard deviation, skewness, and kurtosis of z-score values for 3 anthropometric indicators (weight for height, height for age, and weight for age), percentage of children with missing measurements and outlier values, digit preference, and heaping of age.
Results:
A total of 9936 households were selected in 2008 to 2009, and 39 679 households were selected in 2014. Standard deviation of z-scores for all 3 indicators was smaller in 2014 than in 2008 to 2009. Applying original Demographic and Health Survey exclusion criteria, weight for height z-scores were 1.16 in 2014, 10.1% narrower than 2008 to 2009. The percentage of outlying values declined significantly from 2008 to 2009 to 2014 for both height for age and weight for height (P < .001). Digit preference scores in 2014 improved for both weight (P = .011) and height (P < .001) suggesting less rounding of terminal digits.
Conclusions:
All tests of data quality suggest an improvement in 2014 relative to 2008 to 2009, despite the complexity implied by the larger sample. This improvement corresponds with efforts to enhance training and supervision of anthropometry, suggesting a positive effect of these enhancements.
Introduction
Addressing undernutrition is a key priority in both global development and humanitarian agendas. The last decade is marked by a substantial increase in commitment to scaling up nutrition interventions. 1 In 2014 alone, nearly $937 million in nutrition-specific programs was disbursed by global donors, more than double 2010 levels. 2 The scale of the funding and efforts demand rigorous information for evidence-based decision-making around nutrition interventions.
Anthropometric indicators, particularly prevalence of acute and chronic malnutrition, are closely monitored by national and global actors as primary indicators of the overall food and nutritional status of a population and are generally considered essential information for public health and nutrition planning. However, gathering nationally representative estimates can be a costly and technically challenging endeavor. The Demographic and Health Surveys (DHSs) often represent the main source of nationally representative information that a country has to inform their national planning and prioritization. Since 1984, over 300 DHS surveys have been organized in over 90 countries. 3 Given the globally standardized questionnaires, data from these surveys are also widely used for secondary, global analysis. In 2012, Fabic et al estimated that DHS data have been used in over 200 peer-reviewed publications. 4
Although these assessments are often considered the gold standard of field surveys, implementation of these large surveys, which involve months of planning and data collection, hundreds of enumerators, and thousands of households, is a major technical and logistic challenge. Even under the best conditions, achieving high-quality data for all indicators in such large surveys requires rigorous training and supervision. The challenge is even greater for anthropometric indicators, which involve calibration of equipment and specific training for tens or hundreds of teams of anthropometrists on proper measurement technique. Consequently, the quality of anthropometric data including weight, height, and age can be substandard even in otherwise rigorous surveys. The DHS Program published an assessment of data quality in 81 DHS surveys conducted between 1993 and 2003. The report concluded that, “data on maternal and child health are generally of very high quality;” however, “relatively speaking, missing or otherwise questionable data are only an issue for height and weight, particularly of children.” 5
Some of the challenges in collecting quality anthropometric data are inherent to the design of these large-scale surveys. For example, given the large number of indicators collected, teams often spend hours in a household conducting a survey that can result in fatigue of both enumerators and interviewees. In the current phase, the sixth, standard DHS surveys contained 131 questions, down from a peak of 226 in phase 5. 4 However, a quality of anthropometric data in DHS surveys does vary notably by country despite similarities in the survey design, suggesting that some of the challenges in collecting accurate anthropometric data also relates to modifiable factors such as training and supervision. 6 A recent review by the DHS Program focused on anthropometric data in DHS surveys from 2005 to 2014, in which the authors highlight several statistical tests which taken together suggest the data vary substantially in the quality of measurement by country. 6
The DHS Program has called for improvements in training and supervision related to anthropometry. However, many of the procedures applied in small surveys and research to ensure supervision and quality training, such as standard tests of enumerator’s accuracy and precision in measuring children, have been perceived by some as too cumbersome and expensive in a context with hundreds of enumerators. As a result, there remains a question among field practitioners whether it is possible to achieve high-quality anthropometric data in these large surveys. 7
This study uses the case study of Kenya, a context where nutrition sector partners invested additional technical and financial resources during the planning and implementation of a DHS survey, to assess the feasibility and influence of these investments on anthropometric indicators. We document the enhancements made in 2014 during survey planning and data collection and evaluate whether they translated into any measurable differences in the quality of anthropometry data in the Kenya Demographic Health Survey (KDHS) 2014 compared to the previous survey, KDHS 2008 to 2019.
Analysis Methods
Anthropometric data of all eligible children from KDHS 2008 to 2009 and 2014 were reviewed in this analysis. Human participants research oversight and approval for the KDHS is provided by the Kenya Medical Research Institute and Centers for Disease and Control (CDC IRB #3308). According to DHS protocols for both 2008-2009 and 2014 surveys, children were eligible if they were de facto household members, defined as the members who slept in the household the previous night, and if they were 0 to 59 months of age. For eligible children, measurements were taken according to standard DHS protocol—height or length was measured to the nearest 0.1 cm, and weight was measured to the nearest 100 g on an electronic scale with a digital screen. 8
For this analysis, data quality was assessed according to the metrics outlined in the 1995 World Health Organization (WHO) guidance document, Physical Status: the Use and Interpretation of Anthropometry. 9 The expert group recommended using several indicators, which taken together indicate the quality of anthropometry data, including (1) standard deviation of z-scores, (2) heaping of weight and height measurements, (3) estimation of age, and (4) proportion of missing or extreme values.
Mean and standard deviation for weight for height (WHZ), height for age (HAZ), and weight for age (WAZ) z-scores were calculated using original sampling weights. Heaping of weight and height measurement is a test of rounding the final digit of each measurement. Heaping is assessed using a Digit Preference Score, calculated using the procedure outlined in Kuulasmaa et al for the WHO monitoring trends and determinants in cardiovascular disease (MONICA) Project. 10 Lower values suggest high agreement with the theoretical uniform distribution. Heaping of age was also assessed. Age heaping is assessed using the same procedure assuming uniform distribution of children by age in months.
In both the DHS surveys, the outcome of the interview for all eligible children is recorded as measured, not present, refused, other, or missing. 6 Missing is also recorded individually for each anthropometric variable. In our analysis, percentage missing is calculated as the number of children who are missing an anthropometric variable among all children who were present and consented (eg, reported as measured).
For this analysis, we considered 2 methods of defining extreme values. First, original DHS exclusions were applied consistent with the published reports. Using this criteria, children were excluded if they were missing any anthropometric data (height, weight, age, or sex), height was out of range (<45 cm or >110 cm for children under 24 months and <65 cm or >120 cm for children 24 months and older), or if the z-score value for any of the 3 nutrition indicators fell outside the cutoffs recommended by the WHO (HAZ below –6 or above +6, WAZ below –6 or above +5, or WHZ below –5 or above +5). 11 Second, the exclusions labeled as “WHO” utilize all of the same exclusions as the original DHS exclusions but are applied by indicator rather than by child such that, a child with a missing weight value would be excluded in calculations of underweight and wasting but not stunting.
Anthropometric indicators for HAZ, WAZ, and WHZ were calculated using the WHO Growth Reference population, consistent with all DHS surveys conducted after 2006. 11 All analyses were performed using STATA/IC version 14.1. Original sample weights for each survey were applied. All data used for the analysis are publicly available from the DHS Program.
Kenya Case Study
Kenya suffers from chronic food insecurity and regular, acute nutritional emergencies, particularly in the arid and semi-arid regions of the country. 12 These northern regions, bordered by Ethiopia, South Sudan, and Somalia, experience frequent droughts, high food prices, and high rates of malnutrition. Given the nutrition situation in Kenya, anthropometric data are routinely collected from many sources and assessments at sentinel sites by the National Drought Management Authority, at health centers through the Kenya District Health Information System, and through small-scale cross-sectional surveys using the Standardized Monitoring and Assessment of Relief and Transitions (SMART) methodology. Anthropometric data are also included in many national assessments including the DHS (2003, 2008-2009, 2014), national and subnational Multi-indicator Cluster Survey (2000, 2008, 2009, 2011, 2013-2014), the Kenya Integrated Household Budget Survey (2005-2016, 2015-2016), and the National Micronutrient Survey (2011). 13 -15
Given both the importance of nutrition programs in Kenya and the many efforts assessing nutritional status, ensuring quality anthropometric data has been a long-standing priority. The 2011 Horn of Africa drought renewed attention on these efforts. The Kenya Nutrition Sector acknowledged that existing sources of nutrition information were not able to provide reliable, actionable information. Different sources provided widely varied estimates for the same indicator, resulting in confusion among implementing partners in the absence of a technical body that could review and help explain where differences were best attributable to methodology, data quality, seasonality of data collection, or otherwise. Additionally, data collection and analysis efforts were uncoordinated such that there were multiple sources of data in some regions and a lack of information in others.
In response, in the years since 2011, Kenya has dedicated considerable resources to enhancing nutrition information systems. Efforts have focused on identifying opportunities for data improvement in all existing surveys and surveillance systems. Key to the effort was the formation of the national nutritional information technical working group (NITWG), a standing group coordinated by the Ministry of Health (MoH), Nutrition and Dietetics Unit supported by the United Nations Children’s Fund (UNICEF), and other partners focused on nutrition data quality, coordination, and utilization. Efforts were made to train NITWG members and collaborators, including UN, MoH, and international nongovernmental organization (INGO) staff, to collect high-quality anthropometry data and assess the quality of data as part of the SMART initiative. 16 The NITWG has built a searchable, national repository of data and worked to make data sharing and review the norm. Currently, for any assessment conducted in country which collections nutrition data, the NIWG approves protocols and questionnaires prior to the beginning of the assessment and reviews both raw data and reports after the assessment. A brainstorming of interventions to ensure data quality is a routine part of protocol review.
It is in this context of heightened attention to nutrition indicators and sustained efforts to build capacity to collect quality nutrition data that the 2014 KDHS was organized in Kenya. The KDHS is a key source for most nutrition indicators used by the sector, including stunting, wasting, underweight as well as information on infant and young child feeding. As in 2008, the Kenya National Bureau of Statistics (KNBS) alongside ICF International conducted the survey with technical support from the MoH and partners.
Ensuring quality of nutrition data in the KDHS was of particular interest of the NITWG partners, given widespread utilization of KDHS data in addition to the large cost of the survey. As a result, several investments aimed at improving anthropometric data quality were funded and technically supported by the NITWG. These included 3 key activities: Commitment of 5 dedicated technical officers from the MoH, including 1 from the Nutrition and Dietetic Unit, for nearly a year, the duration of the KDHS, to support planning, training, and supervision during field work. Commitment of staff time from several nutrition section partners including UN and INGOs to assist with classroom training on proper measurement technique and organization of a standardization tests to allow for practical training on measurements (coordinated by a dedicated nutrition officer from UNICEF in collaboration with the MoH technical officer). Financial investment by UNICEF and the nutrition section to support key components of the training and standardization.
The first enhancement, commitment of a nutritionist from the Ministry staff, was facilitated by the formation of a technical committee to review a protocol to redesign the KDHS methodology to allow for county, rather than province, level estimates. Following the ratification of the 2010 constitution, Kenya went through a governance change, whereby authority shifted from a more centralized system of governance organized into 8 provinces to a devolved system organized into 47 counties, each with distinct budgets and decentralized functions. The restructuring created a need for county-level health and nutrition data to facilitate county-level planning and policy making, critical for the government to support the devolution process. This decision necessitated a larger planned sample size (40 300 households in 2014 vs 10 000 households in 2008-2009) and therefore had large implications on budgets, staffing, and duration of the survey. Core funds, at levels comparable to 2008 to 2009, were previously allocated by the Government of Kenya and United States Agency on International Development (USAID). However, overall costs were projected to be between 3 and 4 times higher than the 2008 to 2009 KDHS under the new scenario. There were also large concerns about maintaining data quality. A larger survey would necessitate more teams and a longer duration of field work, which complicated training and required additional supervision.
In 2014, the KNBS collected data at the county level for the first time. A technical committee was formed to review the decision, provide technical oversight, and mobilize the supplemental funds. The committee was led by KNBS and ICF International but included representatives from throughout the Kenyan government and international partners including the World Food Program, UNICEF, USAID, Micronutrient International, and the Department for International Development. One technical staff member from each of 5 MoH sections involved was delegated full time for 10 months to support the KDHS. For the nutrition sector, this was the first time technical staff had been committed to provide technical support and supervision for the duration of a KDHS survey. The nutrition section delegated their Manager of Monitoring and Evaluation for Nutrition to work on the KDHS. The decision to commit someone of relatively high prominence helped emphasize the challenges of collecting anthropometric data early on in the planning and training process. This nutrition staff provided substantial inputs during the budgeting process (eg, ensuring a line item for training on measurement and questionnaire design and training).
Technical and financial support from nutrition sector partners, the second and third investments, were facilitated by the nutrition sector representatives on the technical committee together with the Head of the Nutrition and Dietetics Unit. Most partners, primarily INGOs, had not been previously involved with the KDHS. From UNICEF, a technical officer from the Nutrition Section with expertise in nutrition surveys was appointed to support the KDHS; traditionally, only the Planning and Monitoring Unit of UNICEF supports the assessment. The NITWG organized partner support. Involvement of nutrition partners translated into many small but meaningful enhancements. In 2014, partners advocated for purchase of top of the line equipment previously not used, Shorr boards for height and electronic Seca scales for measuring weight.
The key partner contribution was the organization of a standardization test. After classroom training on proper measurement techniques, a standardization test is used to assess the ability of survey teams to measure weight and height with accuracy and precision. During the standardization exercise performed in 2014, all 336 team members individually measured 10 healthy children twice. Staff from the Nakuru County health department helped recruit 220 children and caregivers to participate in the exercise. Four standardization exercises were organized, each containing measuring stations in several rooms for measurements by up to 50 pairs of enumerators at a time. The exercise flagged several enumerators that needed additional training and highlighted for all enumerators the rigor and attention required for proper measurement.
Although direct costs for the exercise were relatively small (less than $3000 USD), proper organization required significant staff time to organize and supervise. Staff time of personnel with expertise in anthropometry was provided in kind by Action Against Hunger, International Medical Corps, Islamic Relief, Save the Children, World Vision International, and Concern Worldwide; CDC Atlanta staff offered remote technical support throughout the exercise. Funding for the exercise was a separate allocation, in addition to core funds allocated from the core UNICEF country office to ICF-Macro for the DHS survey. A standardization test is recommended in the global DHS guidelines; however, the original KDHS budget did not include a line item for direct costs or supervision. In 2008, anthropometry training included a classroom training on measurement techniques as outlined in the DHS Biomarker Field Manual as well as demonstrations but no standardization exercise. 8 The collective time and funds from nutrition sector partners were essential in 2014 to organize and supervise the exercise.
Nutrition sector support continued beyond the standardization test. In collaboration with the KDHS survey managers, the nutrition sector also coordinated field supervision of data collection by technical staff with expertise in nutrition working for INGO partners. Partners allocated staff time to field supervision in areas where they had ongoing nutrition programs, primarily arid and semi-arid lands of northern Kenya, as well as in adjacent counties with UNICEF financial and logistic support.
Two other notable changes were made to the KDHS protocol in 2014. First, the sampling frame for the 2008 to 2009 KDHS used the Fourth National Sample Survey and Evaluation Programme (NASSEP IV) developed in 2002 (based on the 1999 census), whereas the 2014 KDHS used the NASSEP V developed in 2012 (based on the 2009 census). Differences in the sampling frame may have implications for the representativeness of the sample but should have had no direct bearing on the quality of measurements. Second, the questionnaires were not identical. The 2008 to 2009 survey included collection of blood samples for HIV sampling not done in 2014. Also, in 2014, 2 versions of the women and household questionnaires—a long version and a short version—were administered, a modification to account for the larger sample size. The short version was a subset of the long questionnaire. Both versions included anthropometry of children under 5. Households were randomly assigned to either the short or the long version. Inclusion of blood samples may have prompted a higher refusal rate in 2008 but should have had no direct impact on the quality of anthropometric measurement. Multiple questionnaires theoretically could negatively affect the quality in 2014 if they caused interviewer confusion but likely had limited direct impact on anthropometric measurement.
In all other aspects, the survey protocols were similar and consistent with the standard DHS global survey protocol. Both surveys used a 2-stage cluster design to produce representative estimates at the national level, for urban and rural areas separately, and at the regional level (provinces in 2008-2009 and counties in 2014). In both surveys, 25 households were randomly selected within each cluster. Clusters were selected using probability proportional to size sampling. In 2014, 40 300 households were sampled from 1612 clusters (995 rural and 617 urban). In 2008 to 2009, 10 000 households were sampled from 400 clusters (267 rural and 133 urban). More detailed methodologies are presented in the KDHS reports. 17,18
Results
Secondary Analysis
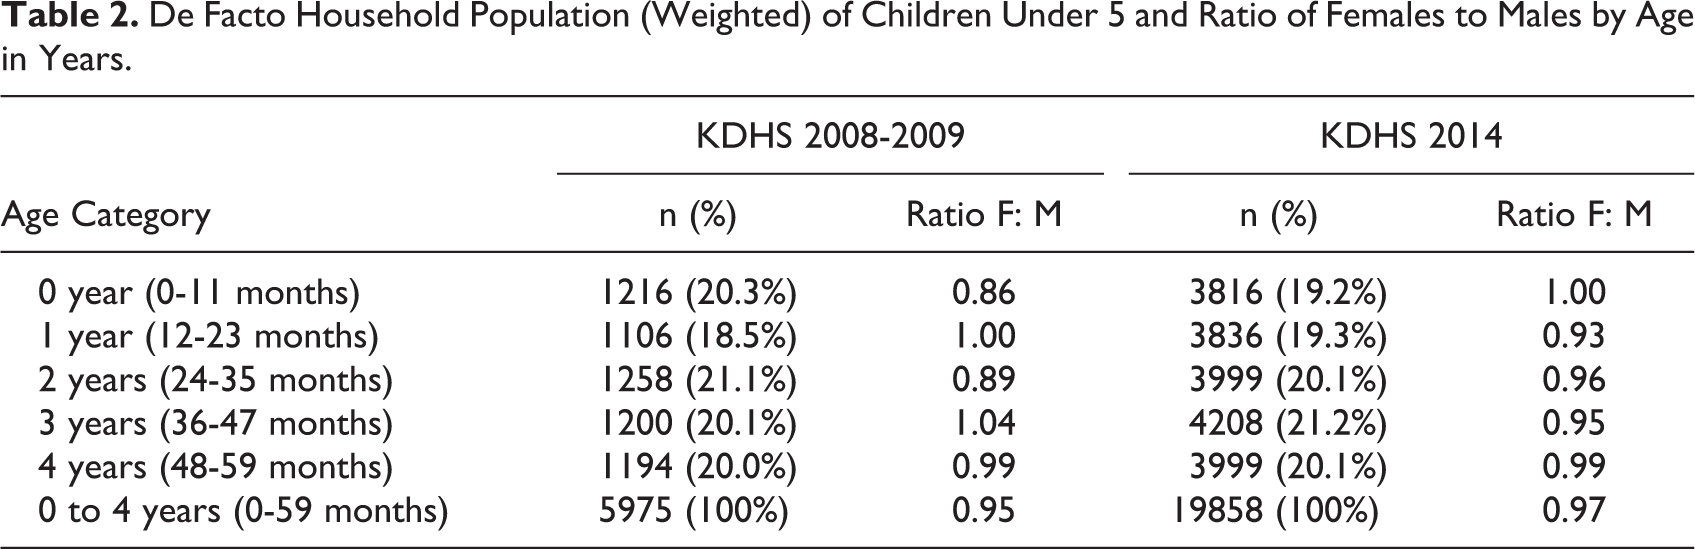
Response rates by residence for each survey are presented in Table 1. In both the surveys, response rates were above 97% for occupied households. Among children under 5, age distribution of de facto household members was similar across the survey years with approximately 20% of children in each 1-year age cohort for both 2008 to 2009 and 2014 (Table 2).
Number of Households, Interviews, and Response Rates (Unweighted) by Residence, Kenya Demographic and Health Survey Data 2008 to 2009 and 2014.
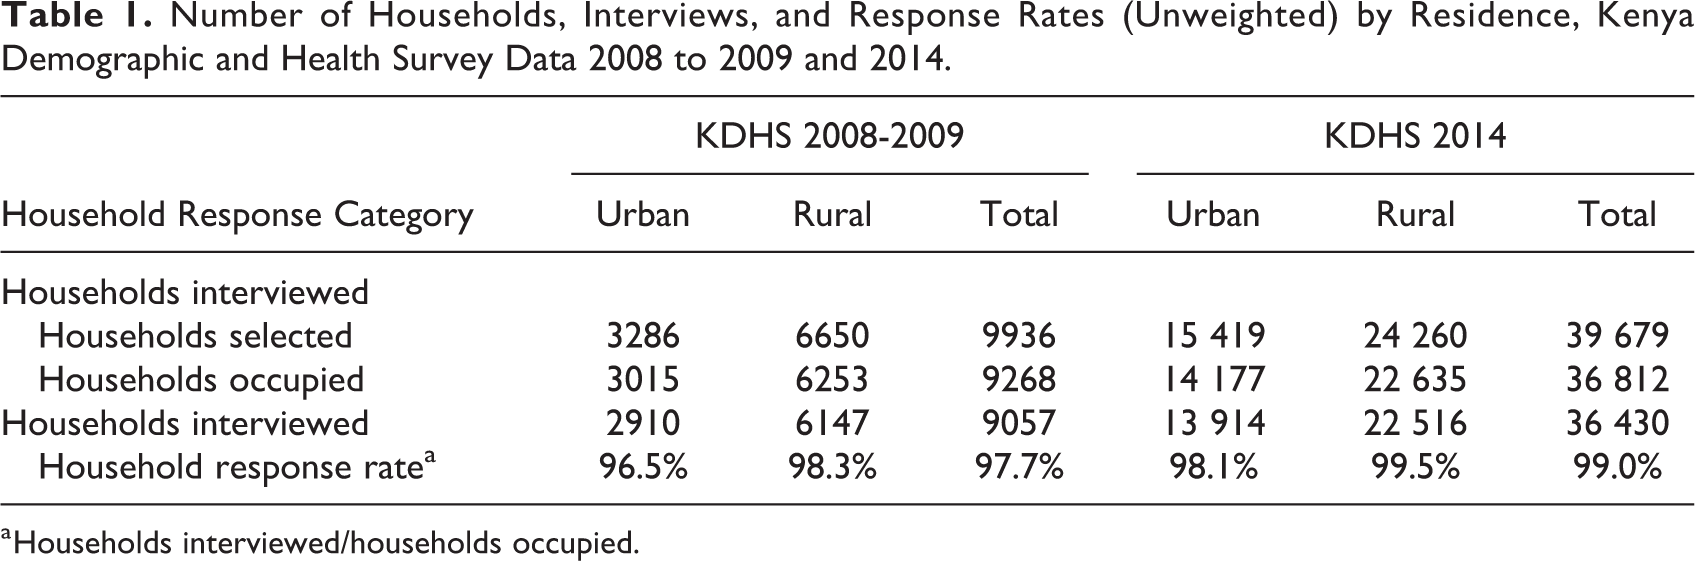
a Households interviewed/households occupied.
De Facto Household Population (Weighted) of Children Under 5 and Ratio of Females to Males by Age in Years.
Prevalence of wasting, stunting, and underweight all declined between 2008 to 2009 and 2014 (Table 3). As reported in the original analysis, prevalence of wasting declined from 6.7% to 4.1% corresponding with an increase in mean WHZ from −0.08 to −0.01. Stunting declined from 35.3% to 26.0% and underweight declined from 16.1% to 11.0%. Correspondingly, mean HAZ increased from −1.41 to −1.14 and mean WAZ increased from −0.86 to −0.64.
Prevalence, Mean, and Standard Deviation of Anthropometric Indicators Derived From Kenya Demographic and Health Survey data 2008 to 2009 and 2014.a
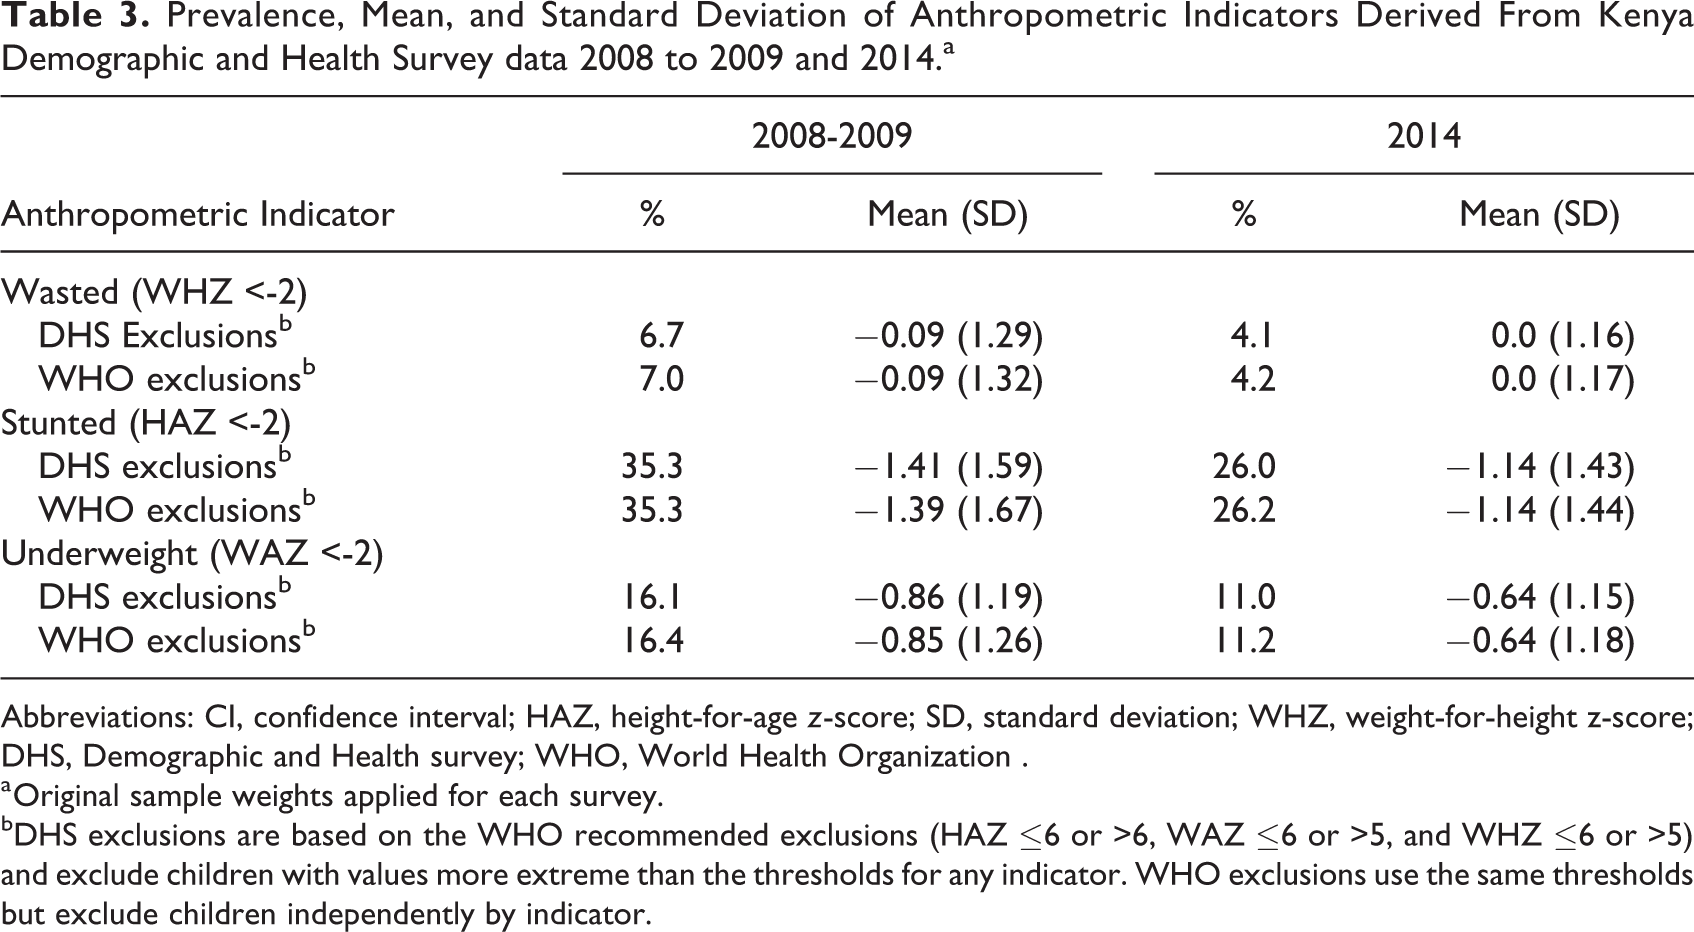
Abbreviations: CI, confidence interval; HAZ, height-for-age z-score; SD, standard deviation; WHZ, weight-for-height z-score; DHS, Demographic and Health survey; WHO, World Health Organization .
a Original sample weights applied for each survey.
bDHS exclusions are based on the WHO recommended exclusions (HAZ ≤6 or >6, WAZ ≤6 or >5, and WHZ ≤6 or >5) and exclude children with values more extreme than the thresholds for any indicator. WHO exclusions use the same thresholds but exclude children independently by indicator.
However, the primary objective of the comparative analysis was to observe the quality of anthropometric variables. The first metric of quality, standard deviation, is presented in Table 3. Applying the standard DHS exclusions, the standard deviations of WHZ, HAZ, and WAZ were all significantly narrower in 2014 than in 2008 to 2009. The difference was greatest for HAZ where standard deviation (SD) declined by 0.16 z-scores to 1.43 in 2014. However, WHZ SD also declined by over 10%, from 1.29 to 1.16 z-scores, between 2008 to 2009 and 2014. Figure 1 presents histograms of WH and HA Z-scores to graphically illustrate the SD by indicator for 2008 to 2009 and 2014. A normal distribution with the unweighted observed mean and a SD of 1.0 is overlaid on each graph for comparison. For both years, SD is narrower for WHZ than HAZ, illustrated with an improved fit of the normal distribution (SD = 1) for WHZ than HAZ. Additionally, for both WHZ and HAZ, the SD is narrower and fit improved for 2014 relative to 2008 to 2009.
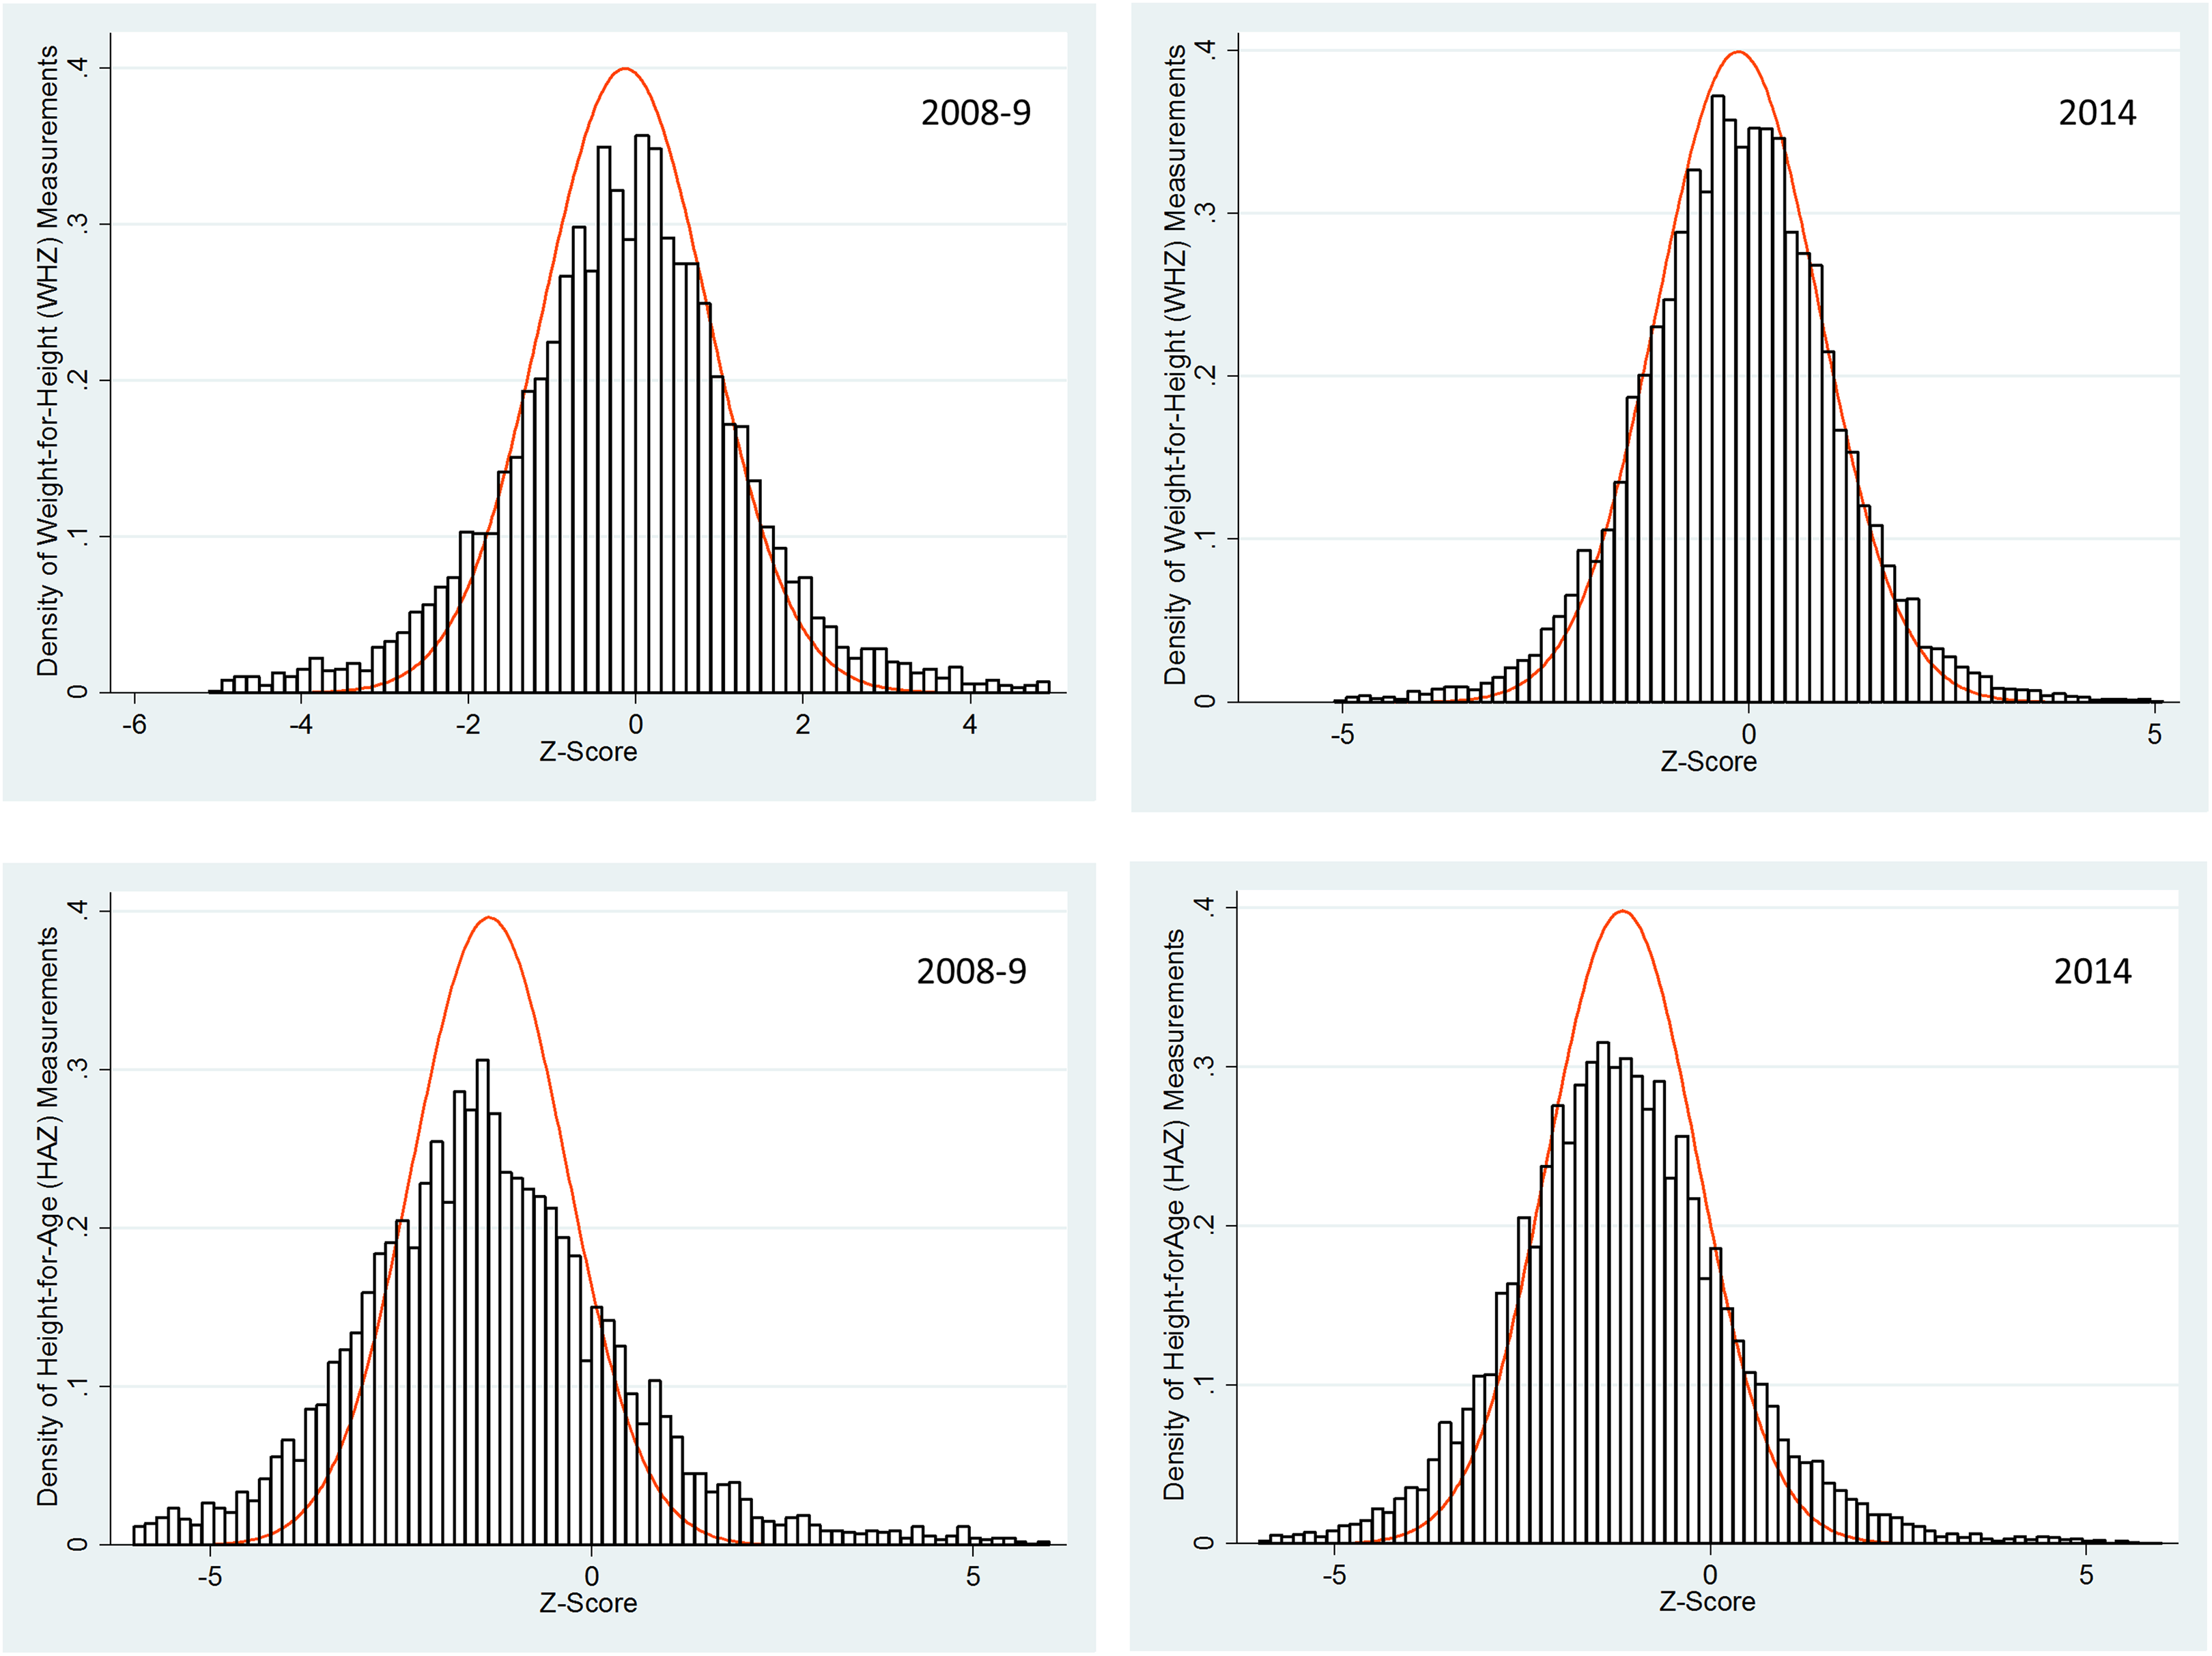
Unweighted distribution of weight-for-height and height-for-age z-scores applying World Health Organization (WHO) exclusion criteria, 2008 to 2009 and 2014. A normal distribution with the unweighted observed mean and a standard deviation of 1.0 is also overlaid on each graph.
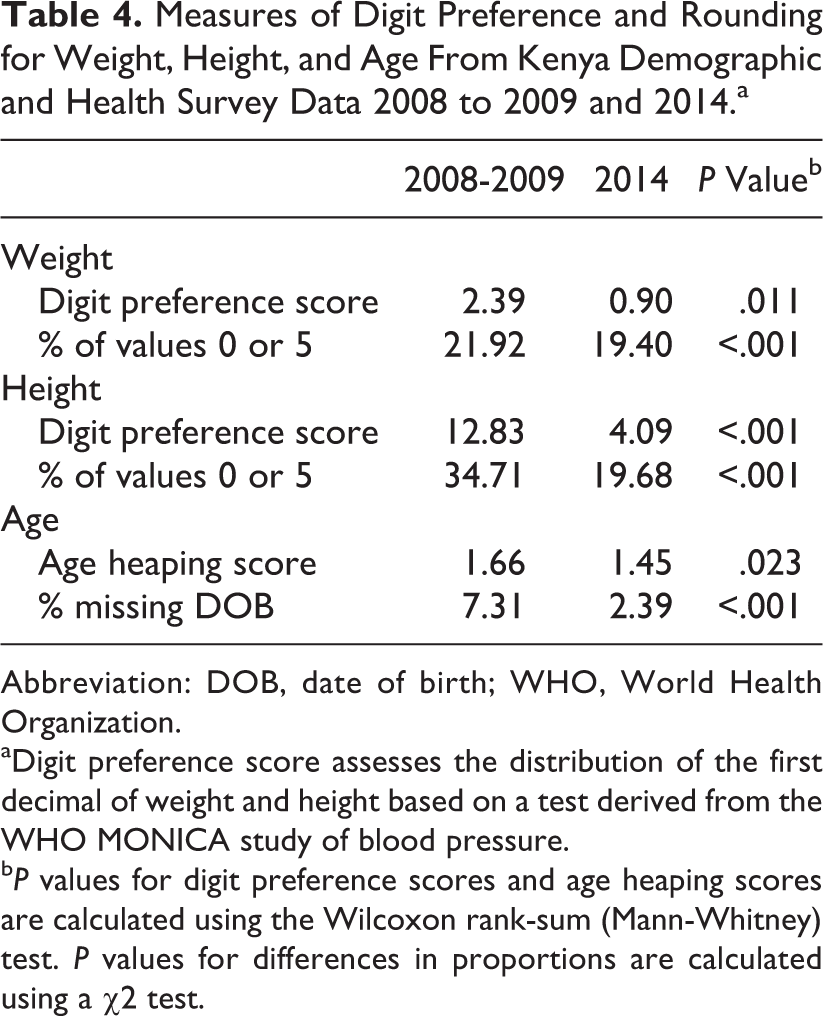
Measures of rounding for weight and height are presented in Table 4. Digit preference scores for weight were low in both surveys, suggesting only minor rounding; there was a slight but significant improvement from 2.39 to 0.90 in the digit preference score between 2008 to 2009 and 2014 (P = .011). The digit preference score for height significantly improved from 12.83 to 4.09 (P < .001) between 2008 to 2009 and 2014. In 2008 to 2009, 34.71% of height values were rounded to 0 or 5, which suggests rounding in nearly 15% of height measurements. This excess of height measurements ending in 0 and 5 is presented graphically in Figure 2. Age heaping scores were low in both surveys suggesting nominal rounding (Table 4). The proportion of eligible children with missing date of birth information was low but declined between 2008 to 2009 and 2014 (from 7.31% to 2.39%).
Measures of Digit Preference and Rounding for Weight, Height, and Age From Kenya Demographic and Health Survey Data 2008 to 2009 and 2014.a
Abbreviation: DOB, date of birth; WHO, World Health Organization.
aDigit preference score assesses the distribution of the first decimal of weight and height based on a test derived from the WHO MONICA study of blood pressure.
b P values for digit preference scores and age heaping scores are calculated using the Wilcoxon rank-sum (Mann-Whitney) test. P values for differences in proportions are calculated using a χ2 test.
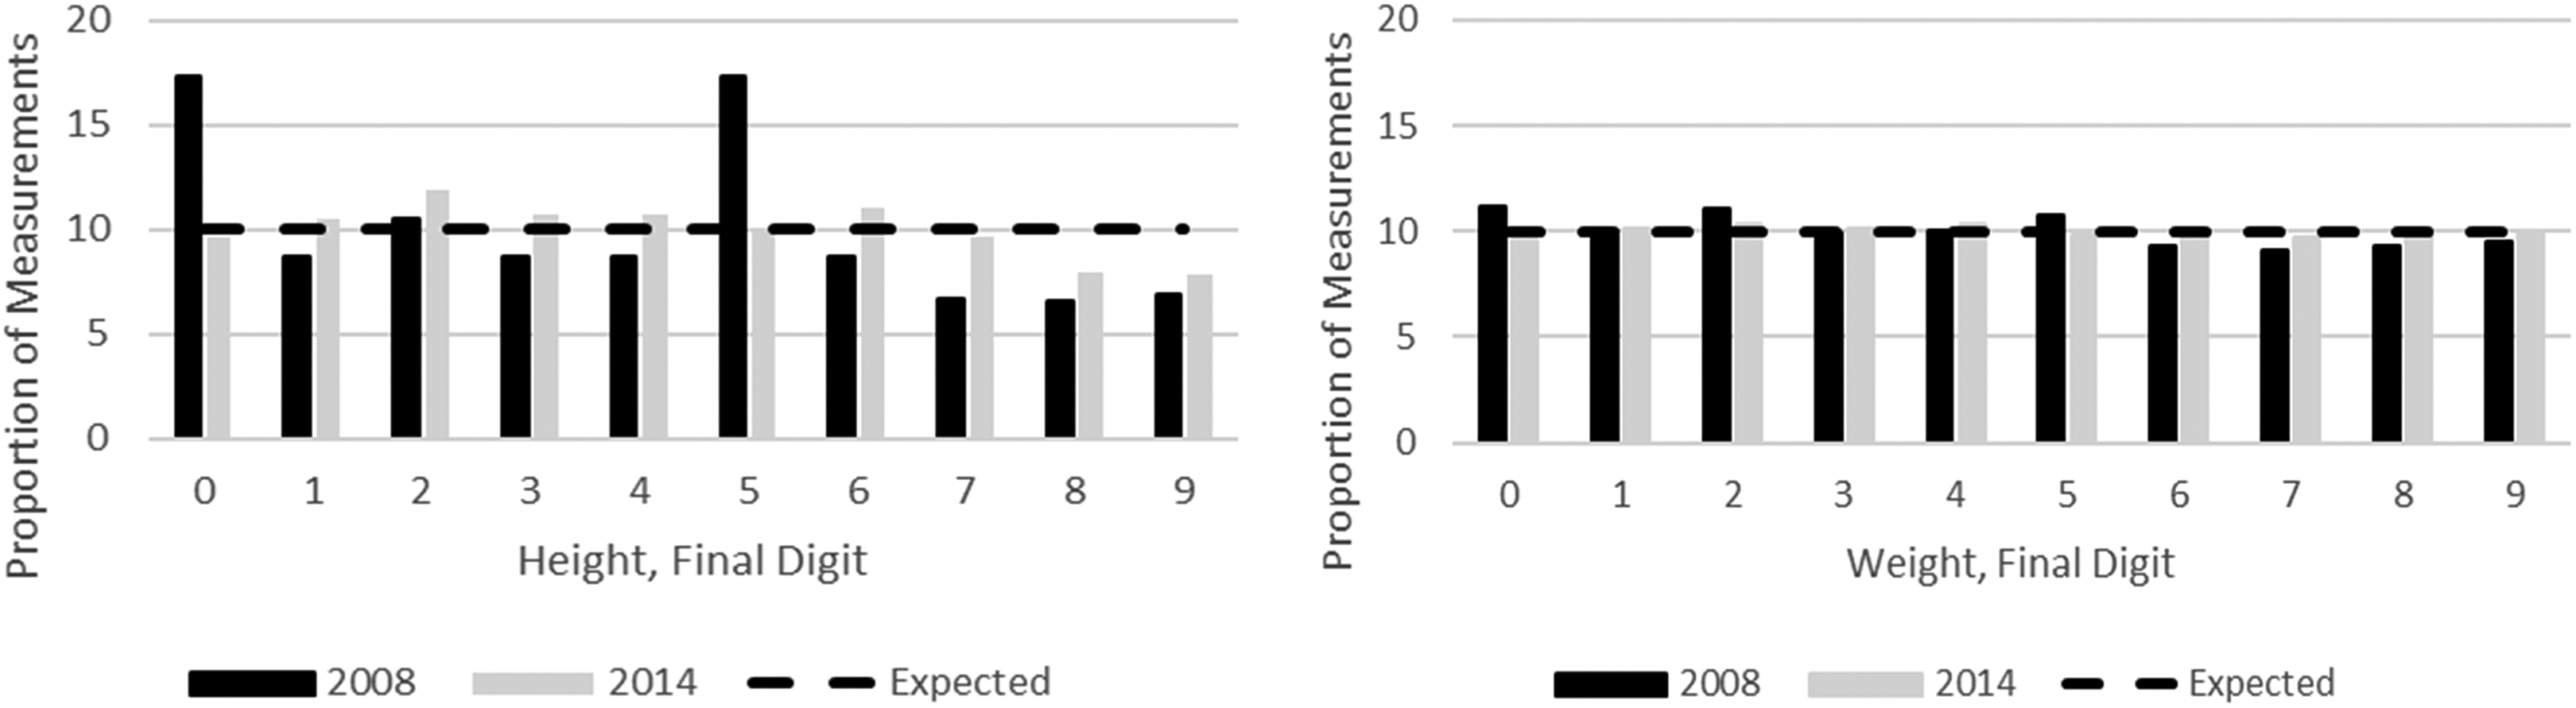
Digit preference for weight and height measurements from Kenya Demographic and Health Survey data 2008 to 2009 and 2014.
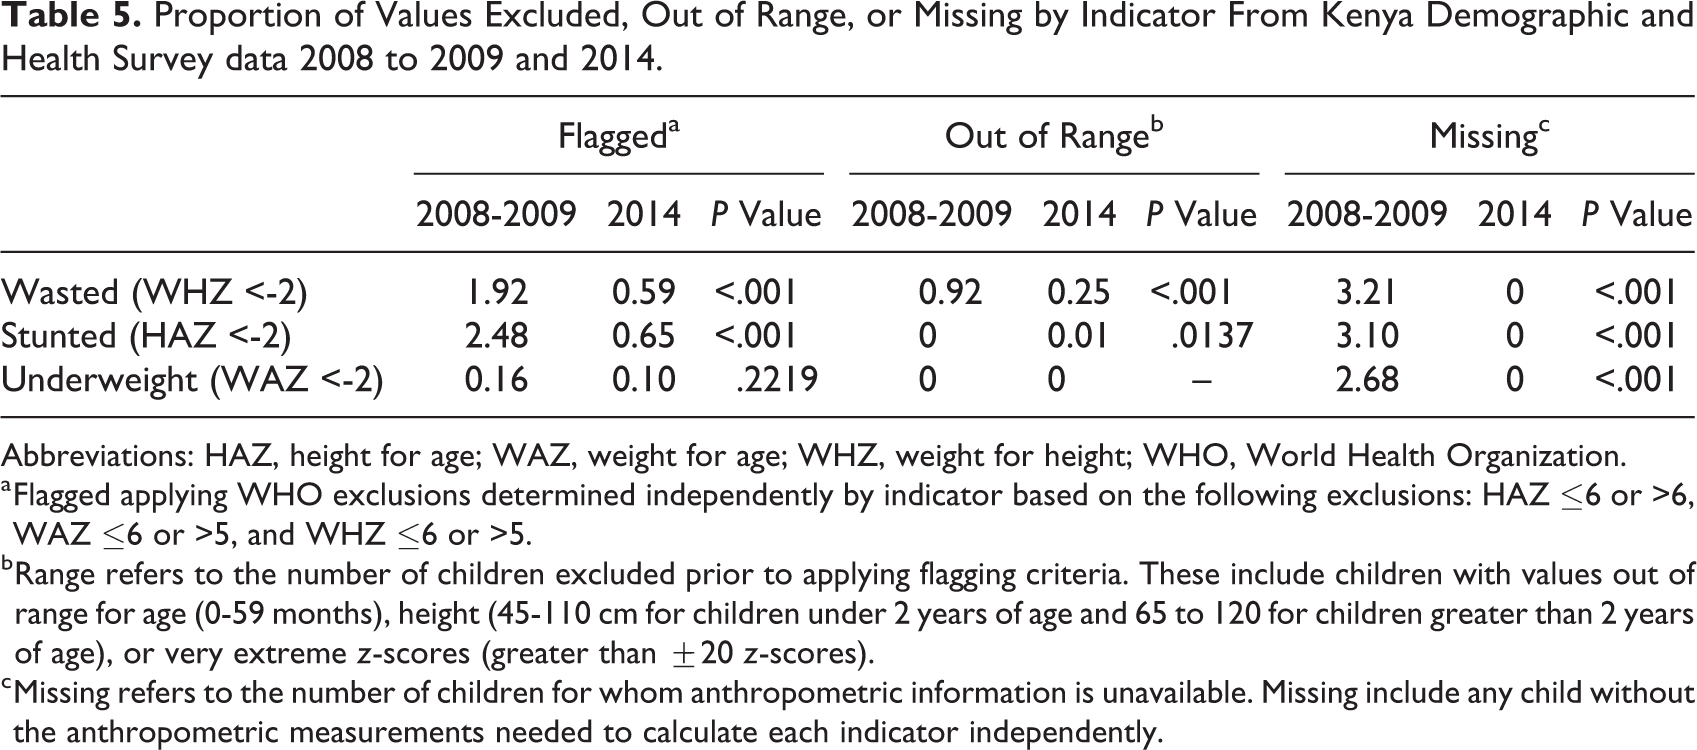
No eligible children were missing weight, height, or age measurements in 2014, a decline from 2008 to 2009, where 3.21%, 3.10%, and 2.68% of the values were excluded due to missing values for WHZ, HAZ, and WAZ, respectively (Table 5). Of children with available anthropometric measurements, the proportion excluded as likely outliers declined for all indicators between 2008 to 2009 and 2014 regardless of the exclusion criteria applied. With the WHO exclusion criteria, the proportion of outliers for both WHZ (from 1.92% to 0.59%, P < .001) and HAZ (from 2.48% to 0.65%, P < .001) declined significantly.
Proportion of Values Excluded, Out of Range, or Missing by Indicator From Kenya Demographic and Health Survey data 2008 to 2009 and 2014.
Abbreviations: HAZ, height for age; WAZ, weight for age; WHZ, weight for height; WHO, World Health Organization.
a Flagged applying WHO exclusions determined independently by indicator based on the following exclusions: HAZ ≤6 or >6, WAZ ≤6 or >5, and WHZ ≤6 or >5.
b Range refers to the number of children excluded prior to applying flagging criteria. These include children with values out of range for age (0-59 months), height (45-110 cm for children under 2 years of age and 65 to 120 for children greater than 2 years of age), or very extreme z-scores (greater than ±20 z-scores).
c Missing refers to the number of children for whom anthropometric information is unavailable. Missing include any child without the anthropometric measurements needed to calculate each indicator independently.
In addition to assessing quality parameters for the surveys overall, a subset of tests was performed by stratum. Strata were generally completed entirely by 1 survey team. The graphs of Figure 3 depict the proportion of flagged values and the SD of WHZ and HAZ in each stratum in 2008 to 2009 and 2014 DHS surveys. Each data point represents the measurements of 1 survey stratum. The graphs illustrate 2 notable findings. First, in 2008 to 2009, a larger proportion of strata had many values flagged for both HAZ and WHZ. For both WHZ and HAZ, 46.7% of strata in 2008 to 2009 but no strata in 2014 had more than 5% of values flagged as outliers. Second, the mean SD by stratum and the proportion of strata with wide SDs was greater in 2008 to 2009 than in 2014 for both indicators. For example, the proportion of strata with HAZ SD greater than 1.5 was higher in 2008 to 2009 than 2014 (80% and 21%, respectively) as was the proportion of strata with WHZ SD greater than 1.2 (60% and 17%, respectively).
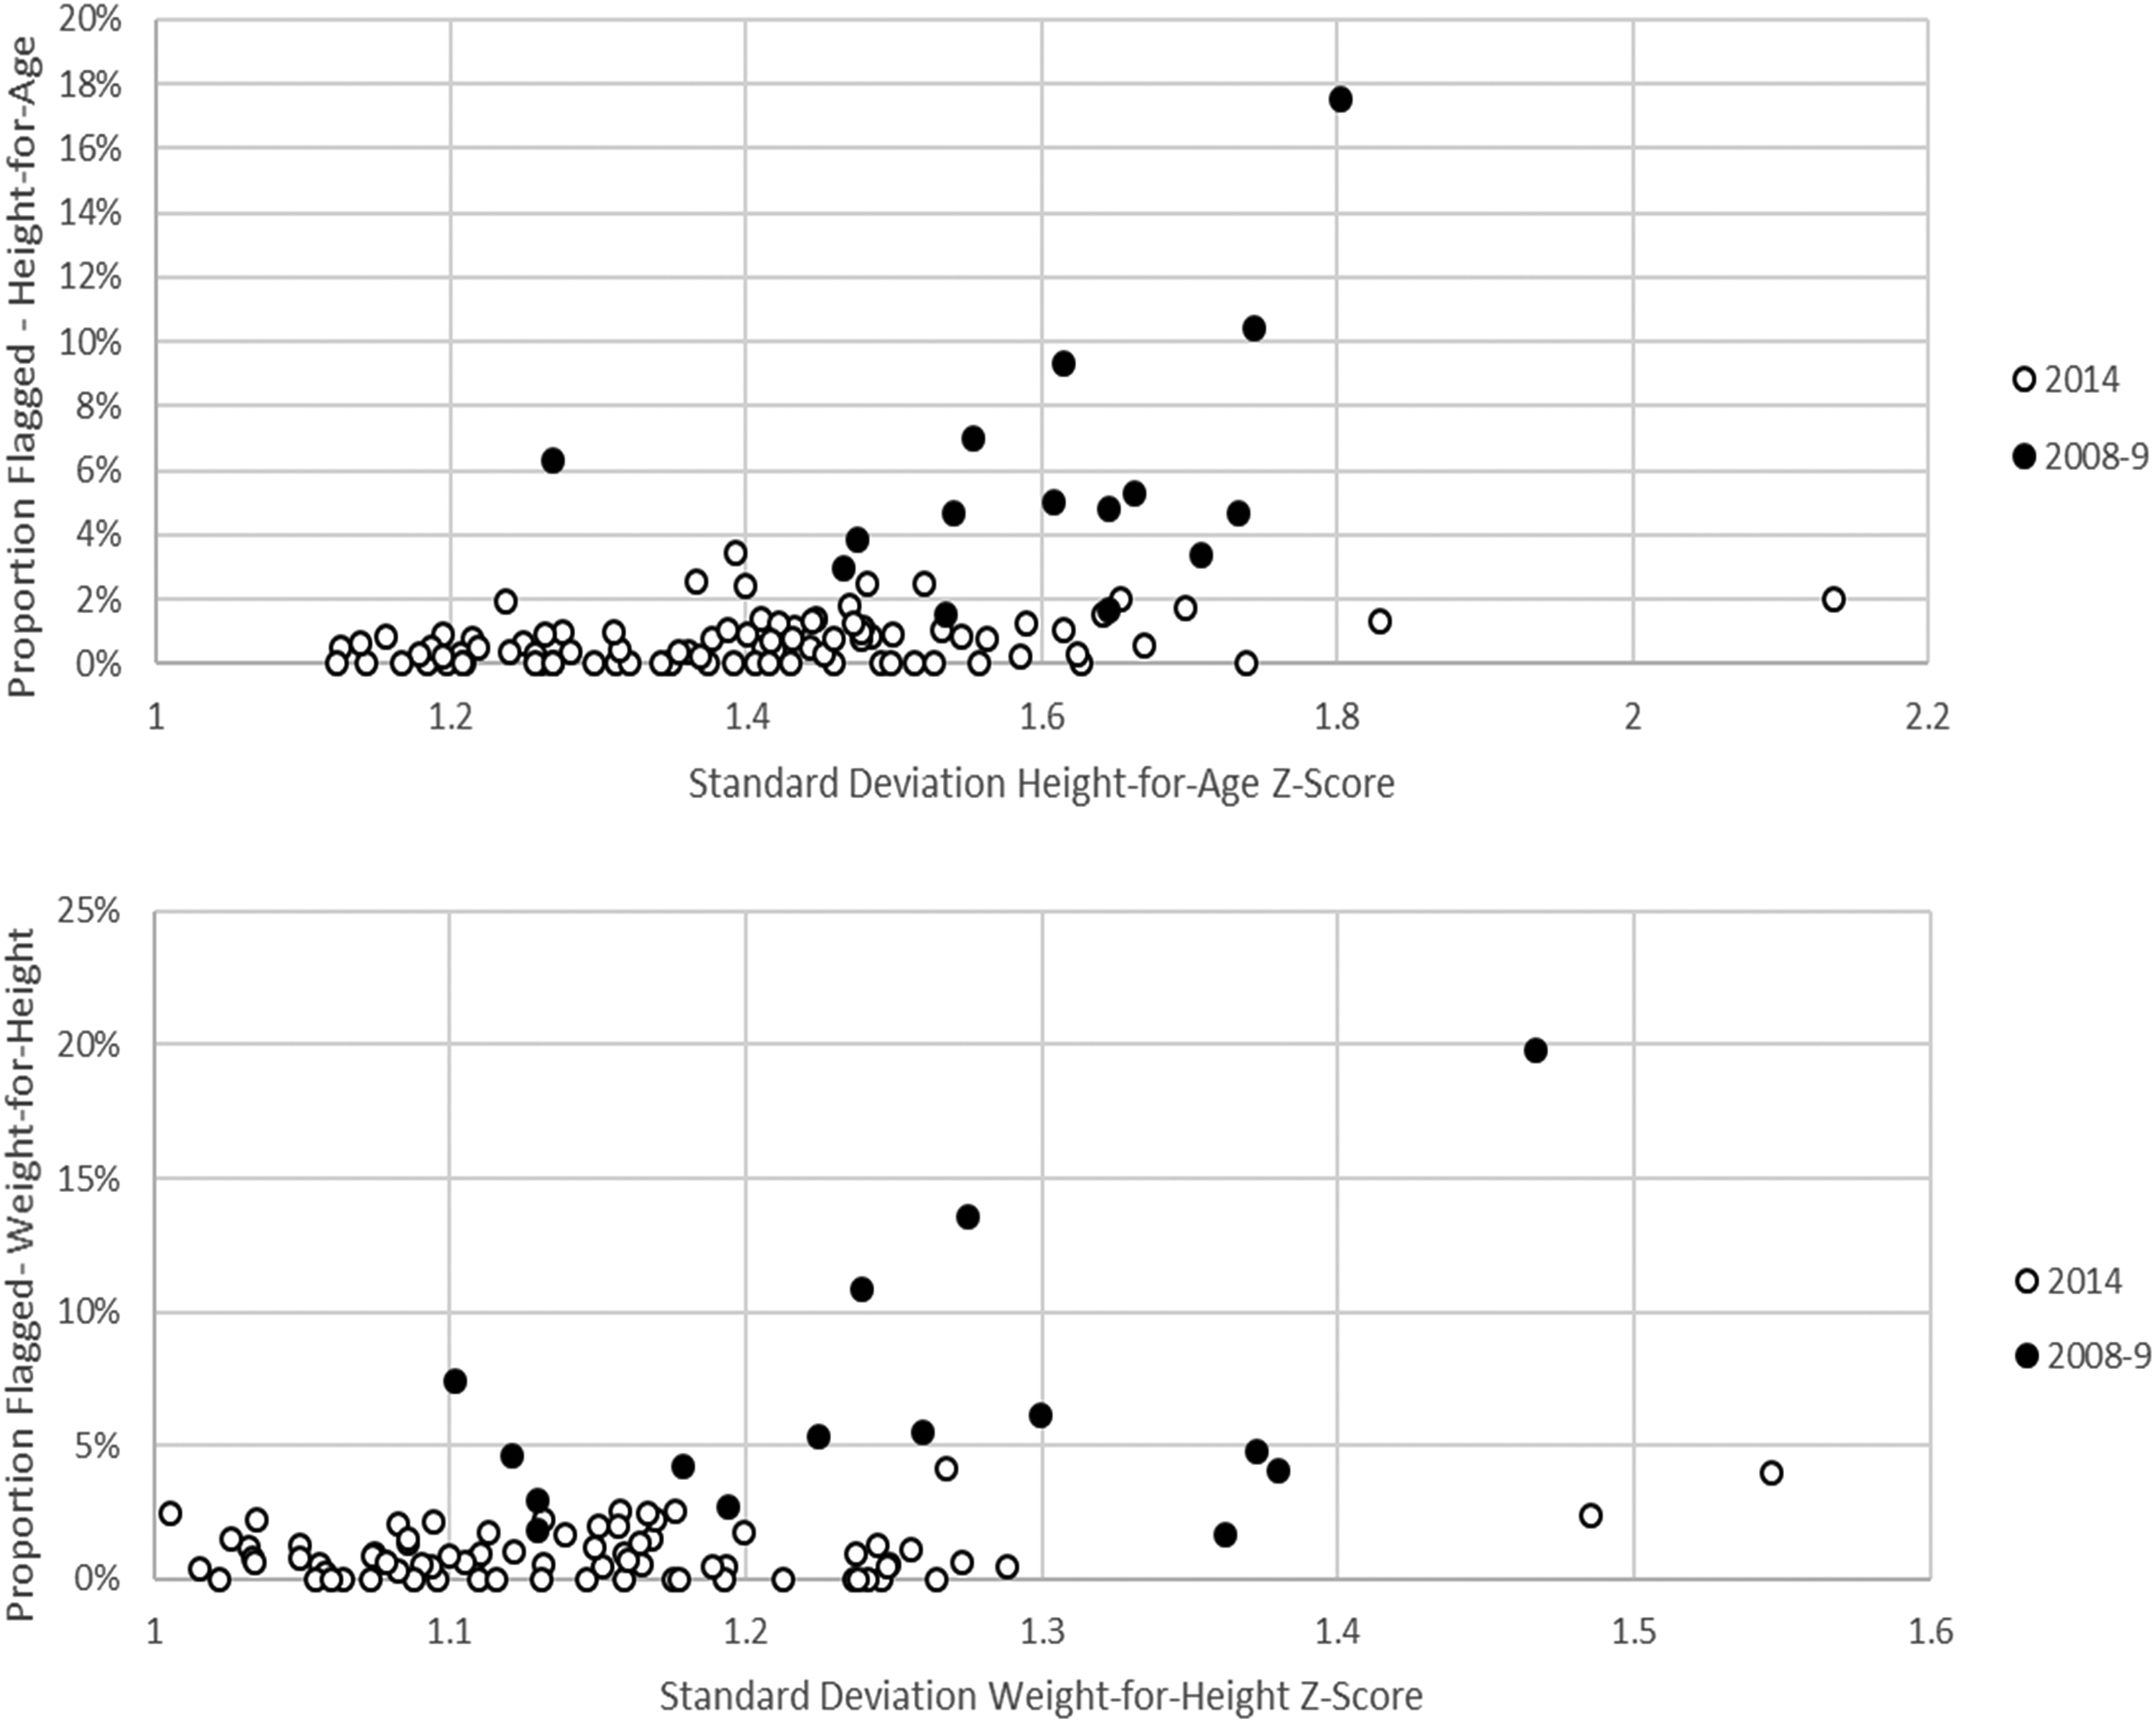
By survey strata, correlation of the proportion of values flagged and standard deviation for height-for-age and weight-for-height, Kenya Demographic and Health Survey data 2008 to 2009 and 2014. In 2008 to 2009, surveys included 15 strata (rural and urban for 7 districts plus urban Nairobi). In 2014, survey included 92 strata (rural and urban for 45 counties plus urban Nairobi and Mombasa). In both 2008 to 2009 and 2014, most strata were completed by 1 survey team. For both years, the proportion of HAZ values flagged was based on WHO exclusion criteria. Standard deviation was calculated after applying WHO exclusion criteria.
Discussion
Given concerns about the increased scale and complexity of the survey design planned for the 2014 DHS in Kenya, nutrition sector partners invested additional technical and financial resources not devoted in previous years. These surveys therefore serve as a unique case study to assess the effect of such investment on data quality in national cross-sectional surveys. Our analysis suggests that the anthropometric data quality in the KDHS 2014 is improved relative to that in the KDHS 2008 to 2009, despite the added complexity of the survey design. Investments in training and supervision specifically focused on anthropometry may have contributed to the measurable improvements in measurement quality.
For many survey variables, the assessment of quality is limited to checks of completeness. The calculation of anthropometric indicators however allows for several additional checks of quality. One key measure is SD of the continuous z-score distributions. As noted, previous research suggests that for a given population, Z-scores are normally distributed with an SD of approximately 1.0. 9,19 There is limited reason to believe that the population of Kenya became notably more homogenous in 2014 relative to 2008 to 2009 with respect to nutritional outcomes or that heterogeneity in Kenya is notably greater than that of other large, diverse nations in the region. 6 The percentage difference in wasting between highest and lowest wealth quintiles was actually greater in 2014 compared to 2008 to 2009. As such, we suggest that the most plausible explanation of the narrower SD in 2014 relative to 2008 to 2009 is an improvement in quality.
The analysis further suggests a greater proportion of outliers, a greater proportion of eligible children missing anthropometric measurements, and significantly more rounding of weight and height and heaping of age in 2008 to 2009 compared to 2014. Each of these tests is an independent marker of quality, providing information on different types of possible measurement errors. For example, outliers are most often the results of mistakes in recording rather than measurement. Using the standard WHO exclusion criteria, for a healthy child to be excluded as an outlier, the mistake in measurement must be large; a 12-month-old female would not be excluded from stunting analysis unless her height was 58.5 cm or less, nearly 15.5 cm below the median for children of the same age. Such large errors are uncommon in measurement but can result from data entry errors (eg, recording 58 cm instead of 85 cm for height or November 1 instead of January 11). In contrast, wide standard deviations are interpreted as an indication of errors in measurement. Analysis of previous DHS surveys has demonstrated that SD is often wider for children under 2 years, relative to children 2 to 5 years of age, who are generally more difficult to measure, given differences in the behavior and cooperation of children as they are measured. Modeled analysis has also shown that the introduction of small, nondirectional errors can increase the SD. 9,20 Small errors in measurement are also assessed through rounding. Digit preference for weight is uncommon in surveys using digital scales but remains a problem for height. As centimeter marks are much larger on height boards and easier to read than the millimeter marks, rounded values are often recorded by less diligent teams and may be a marker of other unobserved problems related to training and supervision.
Although the statistical tests assess different types of measurement error, we note that the results of all assessed checks suggest higher quality in 2014 relative to 2008 to 2009. This finding is consistent with previous research. Analysis of 54 DHS surveys conducted between 2005 and 2014 found that for many surveys, relative performance on these quality checks was correlated such that surveys that performed poorly on 1 test were likely to have performed poorly on many tests. 6 Several tests all indicating an improvement in data quality give support to the conclusion that data quality improved in 2014 relative to 2008 to 2009.
Achieving high quality of measurements is particularly important for anthropometry because quality is directly related to the estimate of prevalence for nutrition indicators. Previous research has demonstrated that the introduction of random nondirectional errors, such as those introduced when age is estimated rather than calculated or when teams are imprecise in measuring height or weight, can result in a wider SD. 19,20 For distributions with the same mean z-score, the wider the SD the higher the prevalence. In other words, introduction of random error can result in an estimated prevalence as high as double the true value. 20 Overestimation can confuse and mislead formulation and prioritization of national nutrition policies as well as inappropriately direct limited funds. In the case of Kenya, it is likely that the true decline in prevalence of wasting, stunting, and underweight between 2008 and 2009 and 2014 were less than reported, whereby improvements in quality and improvements in nutritional status (as indicated by higher mean z-scores) contributed to the trends documented. Failure to consider changes in data quality therefore likely exaggerates the decline in prevalence.
From the observational study design, it is not possible to conclude that the investment of additional staff effort and other support to the anthropometry component of KDHS from nutrition sector partners was causally associated with the observed improvements. However, we note that there were several enhancements in 2014 but not in 2008 and 2009 with this objective. Many of these enhancements have been shown to enhance the quality of anthropometric measurement in other settings. In the context of clinical or epidemiologic studies, the following 6 parameters are considered best practice for quality assurance of anthropometric measurement: (1) availability of a certified anthropometrist to train measurers, (2) drafting of standard procedures for measurement, (3) use of equipment that can measure with high accuracy and precision, (4) calibration of equipment, (5) standardization of measurers during training, and (6) measurements resampling. 21 Similar activities have been endorsed for small-scale emergency nutrition surveys. 22 The commitment of a dedicated technical officer from the MoH for the duration of the 2014 KDHS allowed for availability of an experienced anthropometrist for the duration of planning, training, and supervision. Commitments by the nutrition sector of technical and financial support allowed for a standardization test to be conducted according to WHO recommended (and DHS endorsed) best practice. 23 Calibration of equipment was standard practice in both 2008 to 2009 and 2014. Guidance in 2008 to 2009 and 2014 was to remeasure children with values out of range (as defined by DHS field check tables), rather than a random subset. 6
This study is subject to 3 key limitations. The first, as discussed, was the observational design. Given the large cost and effort of these surveys, a randomized design could not be justified prior to an observational study. Consequently, analysis is limited to what could be performed with routinely collected data. For example, repeated measurements are not currently routine in DHS surveys. Repeated measurements on a subset of children in future survey could allow for calculations of intermediate indicators such as inter- and intrarater reliability. Second, the quality of the anthropometric data in 2008 was not poor but rather average for a DHS survey when compared to DHS surveys conducted globally. For example, the SD values of HAZ, WHZ, and WAZ observed in Kenya 2008 to 2009 with DHS exclusions (1.59, 1.29, and 1.19, respectively) are similar to the average standard deviations of the z-scores in 52 countries who conducted DHS surveys between 2005 and 2014 (1.58, 1.31, and 1.18, respectively). 6 The impact of similar investments in an underperforming country is yet to be established. The third limitation is the generalizability of the findings. Kenya is in some ways a unique case study. As a country with frequent droughts, Kenya has invested in early warning systems many of which gather anthropometric data to monitor the nutritional status. All anthropometric data are collected, reviewed, and validated by a nutrition information technical working group to allow for utilization of the data in a process called the integrated phase classification conducted twice a year. 24 Thereby, the political and public health importance of anthropometric data are well appreciated among partners and throughout the Kenyan government. In the 5 years between the KDHS surveys, there has been significant investment in building systems to collect nutrition information and the capacity of national and international partners in Kenya to support them.
Given the advanced technical infrastructure around nutrition assessments in Kenya, the present case study may be best understood as establishing the feasibility of gathering high-quality anthropometry data in a large, national survey with subcounty strata rather than a model for such enhancements in all DHS countries. The experience suggests that enhanced attention to anthropometric measurements can be achieved with targeted human resource investments and limited additional funds. Given the documented improvement in anthropometric data quality (thereby providing the country with valid estimates of nutritional indicators), similar investments may be considered in future national surveys.
Footnotes
Authors’ Note
Leidman had full access to all the data in the study and takes responsibility for the integrity of the data and the accuracy of the data analysis.
Leidman, Mwirigi, and Bilukha contributed to acquisition, analysis, or interpretation of data. All authors drafed the manuscript. Leidman and Bilukha critical revision of the manuscript for important intellectual content. All authors gave final approval and agrees to be accountable for all aspects of the work.
The authors have completed the ICMJE Form for Disclosure of Potential Conflicts of Interest and none were reported.
The findings and conclusions in this report are those of the authors and do not necessarily represent the views of the United Nations Children’s Fund, or the Centers for Disease Control and Prevention.
Declaration of Conflicting Interests
The author(s) declared no potential conflicts of interest with respect to the research, authorship, and/or publication of this article.
Funding
The author(s) received no financial support for the research, authorship, and/or publication of this article.