
Abstract
Background:
The government of Burkina Faso, along with the United Nations Network for Nutrition (UNN), activity REACH (Renewed Efforts Against Child Hunger and undernutrition) partnership, conducted a mapping of nutrition interventions and stakeholders to identify the best approaches for scaling up priority nutrition interventions and to strengthen a multisectoral response to fight malnutrition.
Objective:
The objectives include describing the process used to map a set of country-prioritized nutrition interventions and to describe how the results contributed to the multisectoral nutrition planning process in Burkina Faso.
Methods:
The mapping exercise was designed as a cross-sectional study using the Excel-based Scaling Up Nutrition Planning and Monitoring Tool (SUN PMT) to collect, store, and analyze data.
Results:
The results present different analyses produced by the SUN PMT for 29 prioritized nutrition interventions. The analyses include the distribution of nutrition stakeholders for each intervention, the calculation of geographic and population coverage for each intervention, and the utilization of delivery mechanisms to reach beneficiaries.
Conclusions:
The mapping of key nutrition interventions and stakeholders supporting those interventions in Burkina Faso was an important tool in the multisectoral planning process. The exercise made it possible to identify gaps and needs; launch a discussion on nutrition planning and the scaling up of interventions; and mobilize sectors and development partners around nutrition.
Keywords
Background
Malnutrition is a global crisis, where 1 in 3 people is affected by some form of malnutrition in almost every country in the world. 1 It is recognized by actors at the global level that the challenge of malnutrition is multicausal and requires a multisectoral approach. 2 However, the multisectoral approach has been slow to materialize on the ground. The multisectoral approach faces challenges particularly when it comes to financial allocations, implementation of interventions, and program evaluation, all of which often tend to reside within individual sectors. 2 The complex nature of nutrition requires a great deal of determination to approach planning multisectorally. It also needs to be supported by the appropriate tools to enable sectors to better prepare convergent plans and implement nutrition services cohesively. In recent years, there has been growing momentum around multisectoral approaches to nutrition, showing that a change of vision and practice is taking place through the converging of sectoral policies and plans that engender common nutrition goals. 3 Several key initiatives, such as the Scaling Up Nutrition (SUN) Movement, 4 have helped to strengthen this remarkable progress at the country level. However, further work to find the right processes and accompanying tools is needed to see an impact on the ground.
In Burkina Faso, the government has demonstrated its commitment to improving the nutritional status of the population through several measures. First, through creating the Conseil National de Concertation en Nutrition (CNCN), a multisectoral, multistakeholder platform for nutrition coordination chaired by the Ministry of Health; second, through participating in several initiatives, such as the SUN Movement in June 2011 and the REACH (Renewed Efforts Against Child Hunger and undernutrition) Partnership under the United Nations Network for Nutrition (UNN) in August 2014; and finally, through intensifying nutrition interventions at the community level. However, these commitments have not led to a significant reduction in the various forms of malnutrition in Burkina Faso. For example, the prevalence of stunting has been slow to decline in recent years, seeing a reduction of only 2 percentage points between 2009 and 2012. 5 Furthermore, the 2015 Cost of Hunger study in Burkina Faso estimated that 40.1% of cases of infant mortality were associated with undernutrition, 51.7% of adults had stunting during childhood, and 5.8% of children who repeated a year of school was due to stunting. 6 Stunting has a large impact on the entire country and the Cost of Hunger study also showed that the annual costs associated with childhood malnutrition in Burkina Faso were estimated to be 409 billion XOF (roughly US$669 million), corresponding to 7.7% of the GDP. 6
Aware of the need to strengthen multisectoral approaches to nutrition to achieve sustainable improvements to the nutritional status of the Burkinabe, the government has put in place a process for joint planning for nutrition. The Nutrition Directorate of the Ministry of Health convenes sectors and partners to develop policies and plans for validation by the CNCN. This process aims to operationalize the multisectoral strategic plan for nutrition, Plan Stratégique Multisectoriel en Nutrition 2016-2020, which, in turn, will integrate into a sectoral reform agenda to expand the coverage of interventions and improve the quality of nutrition services. The planning process aligns with the commitments made by the government at regional and international levels to combat malnutrition. These commitments include the Sustainable Development Goals and targets set by the World Health Assembly.
To identify the best approaches for scaling up priority interventions and to strengthen a multisectoral response to fight malnutrition, the government, along with technical and financial support from REACH, conducted a mapping of prioritized nutrition interventions and stakeholders working in nutrition. REACH, a joint initiative of 5 United Nations agencies (Food and Agriculture Organization [FAO], World Food Programme, World Health Organization, United Nations Children’s Fund, and International Fund for Agricultural Development), provides facilitation, coordination, and technical support to governments for the strengthening of nutrition governance and multisectoral approaches to nutrition interventions. 7 The mapping exercise aimed to collect data on a set of prioritized nutrition interventions taking place in Burkina Faso and provide evidence on which interventions took place in each province, how each intervention was delivered, and how many beneficiaries were reached. Within the context of this exercise, an intervention is an activity or a set of activities that deliver a particular nutrition service to a particular set of quantifiable beneficiaries. For example, the treatment of severe acute malnutrition targeted at children younger than 5 years of age who are identified as acutely malnourished. The results of the mapping informed discussions around scaling-up and sustainability of nutrition interventions in the planning process.
Objective
The objective of this article is twofold. The first objective is to describe the process used to map a set of country-prioritized nutrition interventions taking place across multiple sectors and involving multiple stakeholders. The second objective is to describe how the results of the mapping exercise contributed to the multisectoral nutrition planning process in Burkina Faso.
Methods
The SUN planning and monitoring tool (SUN PMT), which was developed by REACH with the support of the Boston Consulting Group Social Impact section, was used to collect, store, and analyze data for the mapping exercise. The SUN PMT is an Excel-based tool with embedded macros allowing collected data to be analyzed using automatic tables that calculate coverage. The mapping exercise was designed as a cross-sectional study and was carried out in 4 phases: preparatory, data collection, data analysis, and interpretation. Data collection took place from March to June 2015 and collected data on interventions which took place during 2014. The National Nutrition Directorate of the Ministry of Health led each phase of the exercise.
Preparatory Phase
The first task was to inform and involve all stakeholders from the onset of the process. Both government and development partners were included in the preparatory phase. From the government, several departments across several sectors participated in the introductory meetings. In addition to government agencies, several other types of organizations participated, including United Nations (UN) agencies, Non-Governmental Organizations (NGOs), associations, the private sector, the academic sector, and donors. From the introductory meetings, a multisectoral mapping team was established. The team was made up of government focal points from nutrition, agriculture, and statistics departments as well as REACH facilitators and UN agency focal points. For 2 weeks, 2 consultants from the UNN/REACH Secretariat and FAO supported the team.
The mapping team led the process of identifying the interventions to be included in the mapping. The process of identifying key interventions started with review of the national nutrition Common Results Framework (CRF), which includes 45 key interventions aimed at reducing stunting across 7 sectors and were identified at the National Multisectoral Planning Workshop in May 2014. Additional criteria were introduced to refine the list of interventions to be mapped in a working session held with the sector focal points. The working session used the list of interventions defined in the 2008 Lancet series on maternal and child undernutrition 8,9 and additional considerations, including proven impact at the individual and household levels, importance of scaling up each intervention to address malnutrition, ability to quantify beneficiaries and target groups for the intervention, and sustainability of the intervention. The final list of 29 prioritized nutrition interventions to be mapped was validated at a workshop organized by the Nutrition Directorate (Table 1).
Prioritized Nutrition Interventions for Burkina Faso.
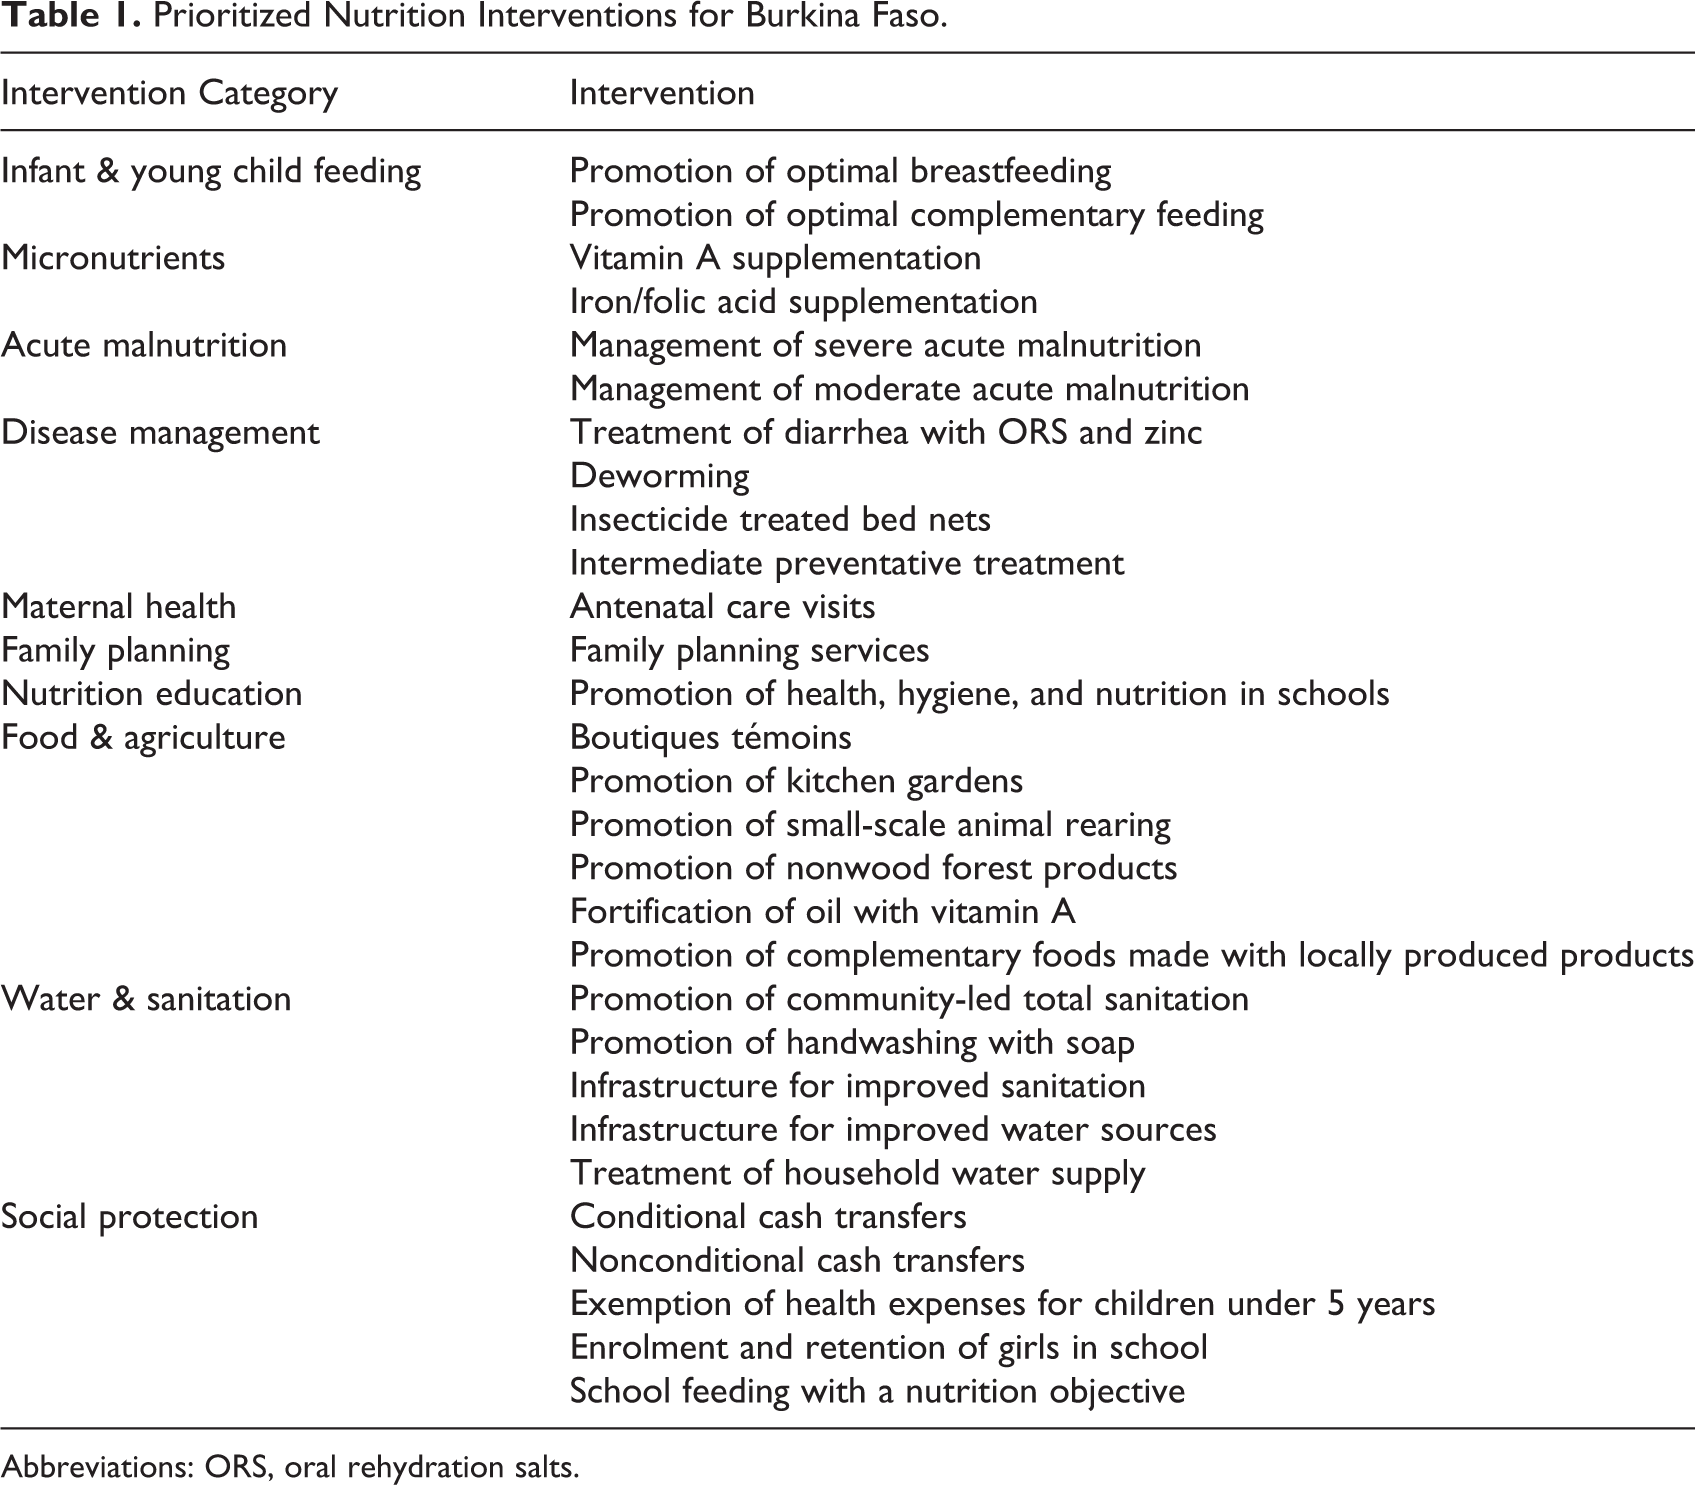
Abbreviations: ORS, oral rehydration salts.
The SUN PMT was then customized to include the 29 prioritized nutrition interventions specific to the country. The next step in customization included assigning specific target groups and delivery mechanisms to each intervention. The geographical areas (13 regions and 45 provinces) of Burkina Faso were added in order to collect data at the province level. The final aspect of customization was adding nutrition situation indicators (eg, stunting, wasting, anemia in children and women, and food insecurity), which were linked to specific interventions according to which intervention is expected to have an impact on each situation indicator. The inclusion of the situation indicators helps to identify priority areas and gaps in coverage important for the planning process.
Data Collection Phase
The data needed for the mapping was divided into 2 parts. The first part was the collection of population data. The National Institute for Statistics and Demographics (INSD) and statistics officers from different sectors provided data on the total population for each target group (eg, children younger than 5 years of age or pregnant women). These data were used as the denominators for the population coverage calculations.
The second part comprised data collection on the prioritized nutrition interventions. The data collected used the province as the unit of measurement by recording which province(s) an intervention was implemented in, the number of beneficiaries reached in each province, which partner organizations were involved, and which delivery mechanisms were used to reach beneficiaries. The data for this part were collected from stakeholders, which provided both qualitative and quantitative data on the interventions each stakeholder supported.
Stakeholders who participated in the mapping were identified through several sources, including the Ministry of Health’s Nutrition Directorate, the Office for the Coordination of Humanitarian Affairs database, implementing partners of donor and United Nations agencies, and government registered associations and local NGOs. Other organizations came forward to participate due to word of mouth. All stakeholders were informed of the objectives of the exercise and were free to participate. The process of identifying stakeholders used all available pathways. The only cases where stakeholders were excluded from the mapping were if they were not supporting one or more the 29 prioritized nutrition interventions in 2014.
The data were collected from stakeholders through a 3-step process. First, an Excel-based questionnaire was shared electronically. Next, interviews were conducted in-person or over the phone to assist the stakeholder to complete the questionnaire. Finally, the questionnaires were returned to the mapping team. As completed questionnaires were received, the data from each stakeholder was entered into the tool. The data collection process lasted 2 months.
Data Analysis Phase
Over a 1-month period, the data analysis phase was conducted. The first step of the analysis phase consisted of a thorough examination of all the data collected and cleaning of any inconsistencies and duplications within the database. Errors were identified using the automated tables within the tool to find interventions that were reported by 2 or more partners working together. In the case where coverage calculations were above 100% at the province level, inspection of each data point for that intervention was performed. Duplications were identified through examination of stakeholder partnerships across entries. Entries where there was repetition of intervention, target group, geographic area, and stakeholders were considered duplications and removed from the system after verification with applicable stakeholders.
Once the database was cleaned, 2 types of coverage were calculated according to the following formulas:
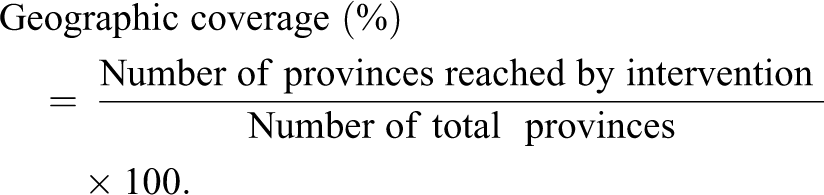
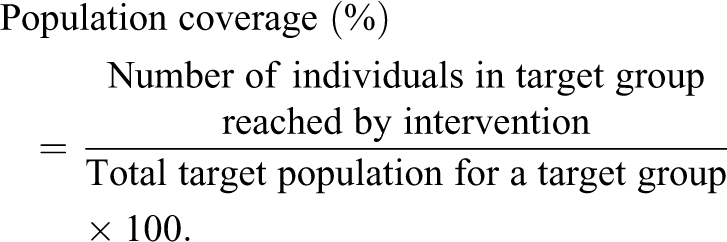
The geographic coverage refers to the percentage of provinces where the intervention is implemented out of the total number of provinces within a region or the country. The population coverage refers to the percentage of target population in the province reached by the intervention over the total target population in that same province, which is calculated based on the sum of the number of beneficiaries reached by partners supporting each intervention and is derived from routine government data and partner program data, discounting for duplicates. The total target population of a particular target group is derived from population estimates for 2014 provided by INSD. This coverage refers to a “delivery” coverage of services delivered to a target population divided by the total target population. It is different from coverage obtained from sampled households or individuals through household surveys.
Interpretation Phase
The automated tables in the tool allowed for direct generation of the results at the national and subnational levels, which help to highlight gaps in coverage of interventions across stakeholders and among delivery mechanisms. The presentation of results used maps, tables, and figures to highlight the key results.
Intervention coverage was compared to nutrition situation indicators in a matrix to identify priority geographic areas and target populations that were underserved and needed to be addressed during the national planning process. At the Stakeholder Validation Workshop, results and key messages helped fuel discussions on analyzing current coverage of beneficiaries at the province level, formulating assumptions for how to improve coverage for provinces most in need, evaluating options for improving implementation of interventions, and the development of the Multisectoral Strategic Plan for Nutrition (2016-2020). Furthermore, discussions also included analyzing programmatic approaches for scaling up, as well as strategies for reducing costs of interventions where possible.
Results
The results section presents the different analyses produced by the SUN PMT, including the presentation of nutrition actors for each intervention, the calculation of geographic and population coverage for each intervention, and the use of delivery mechanisms.
Completeness of Data
Of the 141 stakeholders contacted, 132 completed the questionnaire. The response rate was 93.6%. Table 2 provides a summary of the stakeholders who participated in the mapping exercise. In all, 52.5% of the stakeholders included were identified prior to the interviews, while the remaining were identified during the interview process through other stakeholders.
Distribution of the Organizations Involved in the Mapping in Burkina Faso, by Stakeholder Type.
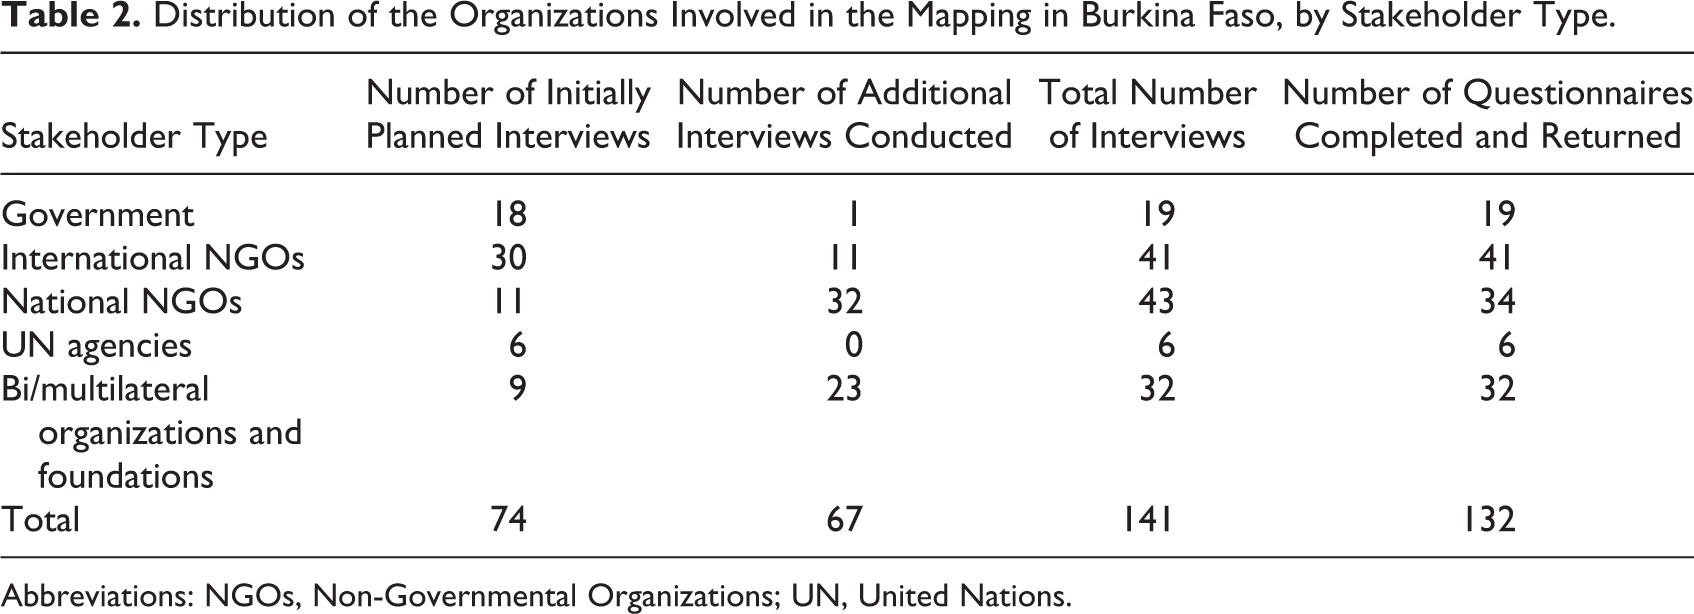
Abbreviations: NGOs, Non-Governmental Organizations; UN, United Nations.
Landscape of Nutrition Actors across Multiple Sectors
The stakeholders included in the mapping fill different roles in the implementation of interventions, which are classified into 4 categories. (1) The responsible ministry is in charge of the institutional framework and the overall leadership of the intervention and plays a leading role in the planning, implementation, and monitoring and evaluation (M&E) of the intervention. (2) The field implementer is responsible for the direct provision of the intervention to the beneficiaries; this category often includes government agencies and may include local NGOs or associations. (3) The catalyst provides technical support in the form of guidance and capacity development; this category often includes bi/multilateral organizations and UN agencies as well as international NGOs supporting the government or subcontracting with other organizations. (4) The funder provides financial support and most often include bi/multilateral organizations, foundations, or the government. It is important to note that some partners could play multiple roles simultaneously for the same intervention.
The distribution by type of intervention differentiating between nutrition specific and nutrition sensitive allows examination of nutrition interventions either directly addressing malnutrition or addressing the underlying causes of malnutrition. Nutrition-specific interventions are defined as interventions that have a direct impact on nutrition status, 10 while nutrition-sensitive interventions are defined as interventions that have an indirect impact on nutrition outcomes through underlying and basic causes. 10 Figure 1 provides an example of the distribution of stakeholders for a nutrition-specific (Figure 1A) intervention and a nutrition-sensitive (Figure 1B) intervention; management of severe acute malnutrition and improvement of access to safe drinking water. Of the provinces across the 13 regions in Burkina Faso, the examples in Figure 1 show that most regions are covered by the presence of the stakeholders supporting these interventions; however, most stakeholders are concentrated in the North, Sahel, Center-North, and East regions.
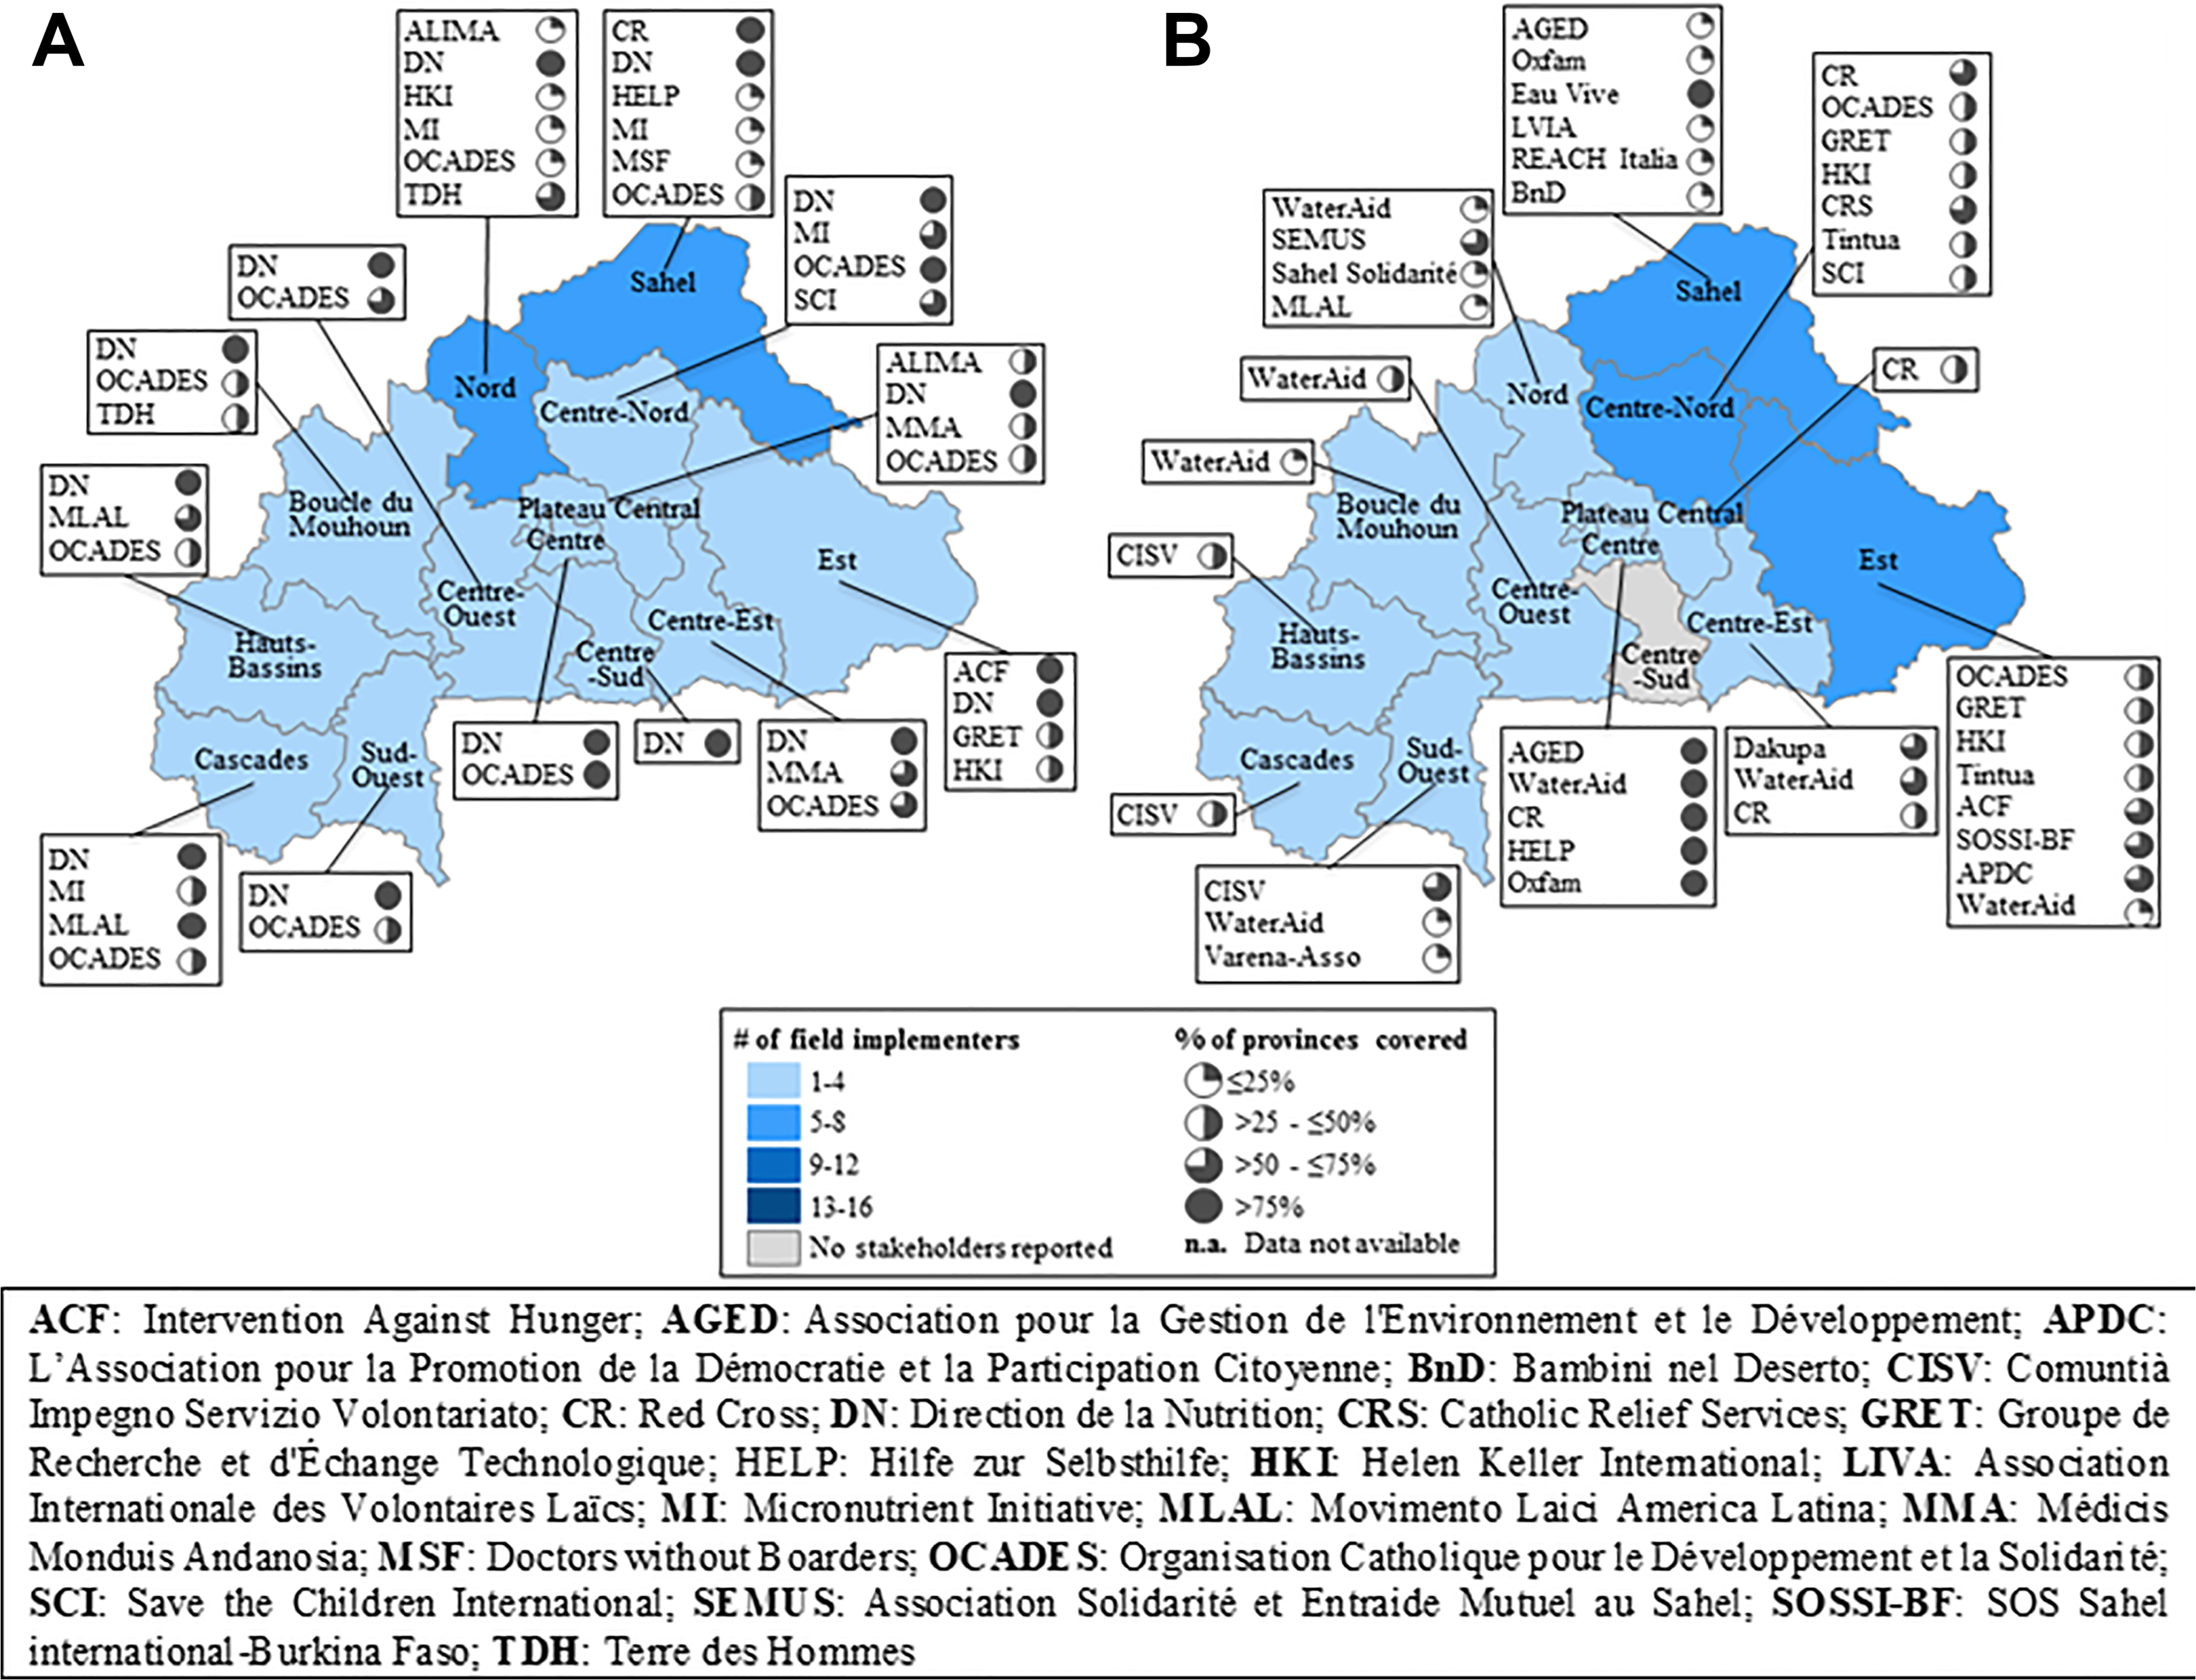
Who does what? Where? How many provinces reached? A, Management of severe acute malnutrition (nutrition-specific action). B, Access to portable water (nutrition-sensitive action).
Mapping the presence of stakeholders at subnational level is critical to understanding whether stakeholders are strategically placed to serve populations most in need. Across all interventions, we find that few stakeholders cover all provinces, particularly for nutrition-sensitive interventions (Table 3).
Distribution of Partners according to the Type of Intervention and Geographical Coverage Range.
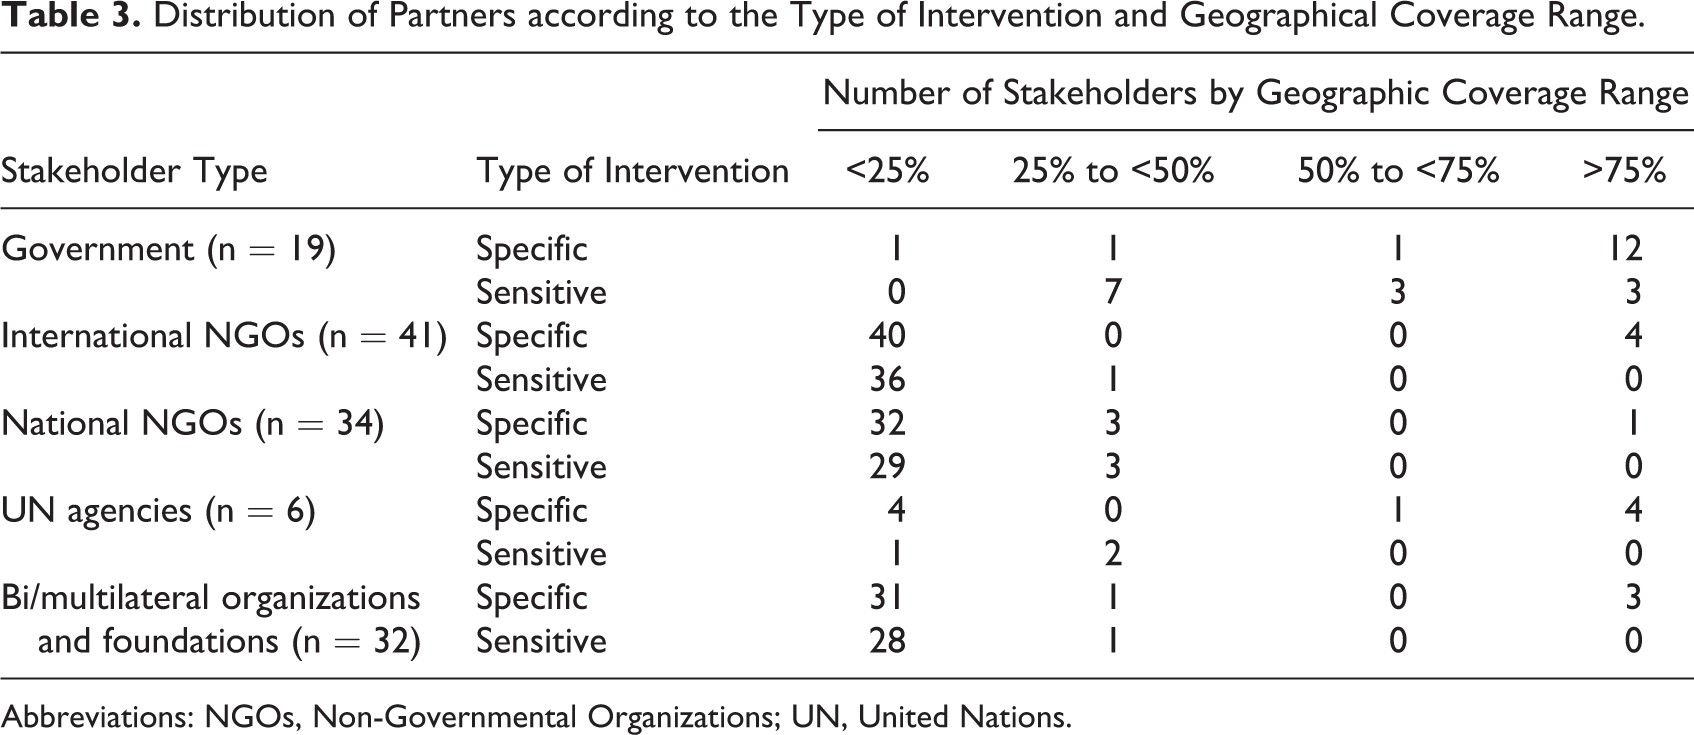
Abbreviations: NGOs, Non-Governmental Organizations; UN, United Nations.
Geographic Coverage
The results of the mapping show that many nutrition-specific interventions have satisfactory geographical coverage; 11 nutrition-specific interventions of 12 are taking place in more than 75% of provinces. Nutrition-specific interventions being implemented in all provinces include vitamin A supplementation for children, iron–folic acid supplementation for pregnant women, deworming for children, and management of acute malnutrition. However, the geographical coverage needs to improve for other nutrition-specific interventions, including promotion of exclusive breastfeeding (86.6%), promotion of complementary feeding (80.0%), treatment of diarrhea with oral rehydration salts (ORS) with zinc (77.7%), and distribution of insecticide-treated nets (53.3%). For most nutrition-sensitive interventions (10 of 17), geographic coverage is between 25% and 50%. For example, the provision of materials for household water treatment reaches 17.8% of provinces. There were no data available from stakeholders for some interventions, including promotion of home gardens, promotion of use of nontimber forest products, and boutiques témoins (shops providing access to low-priced cereals). Table 4 shows the geographic coverage results for a selection of interventions. Provinces in Sahel, North, and East regions have low geographic coverage; however, these regions have the highest burden of malnutrition.
Geographical Coverage, Population Coverage, and Delivery Mechanisms.
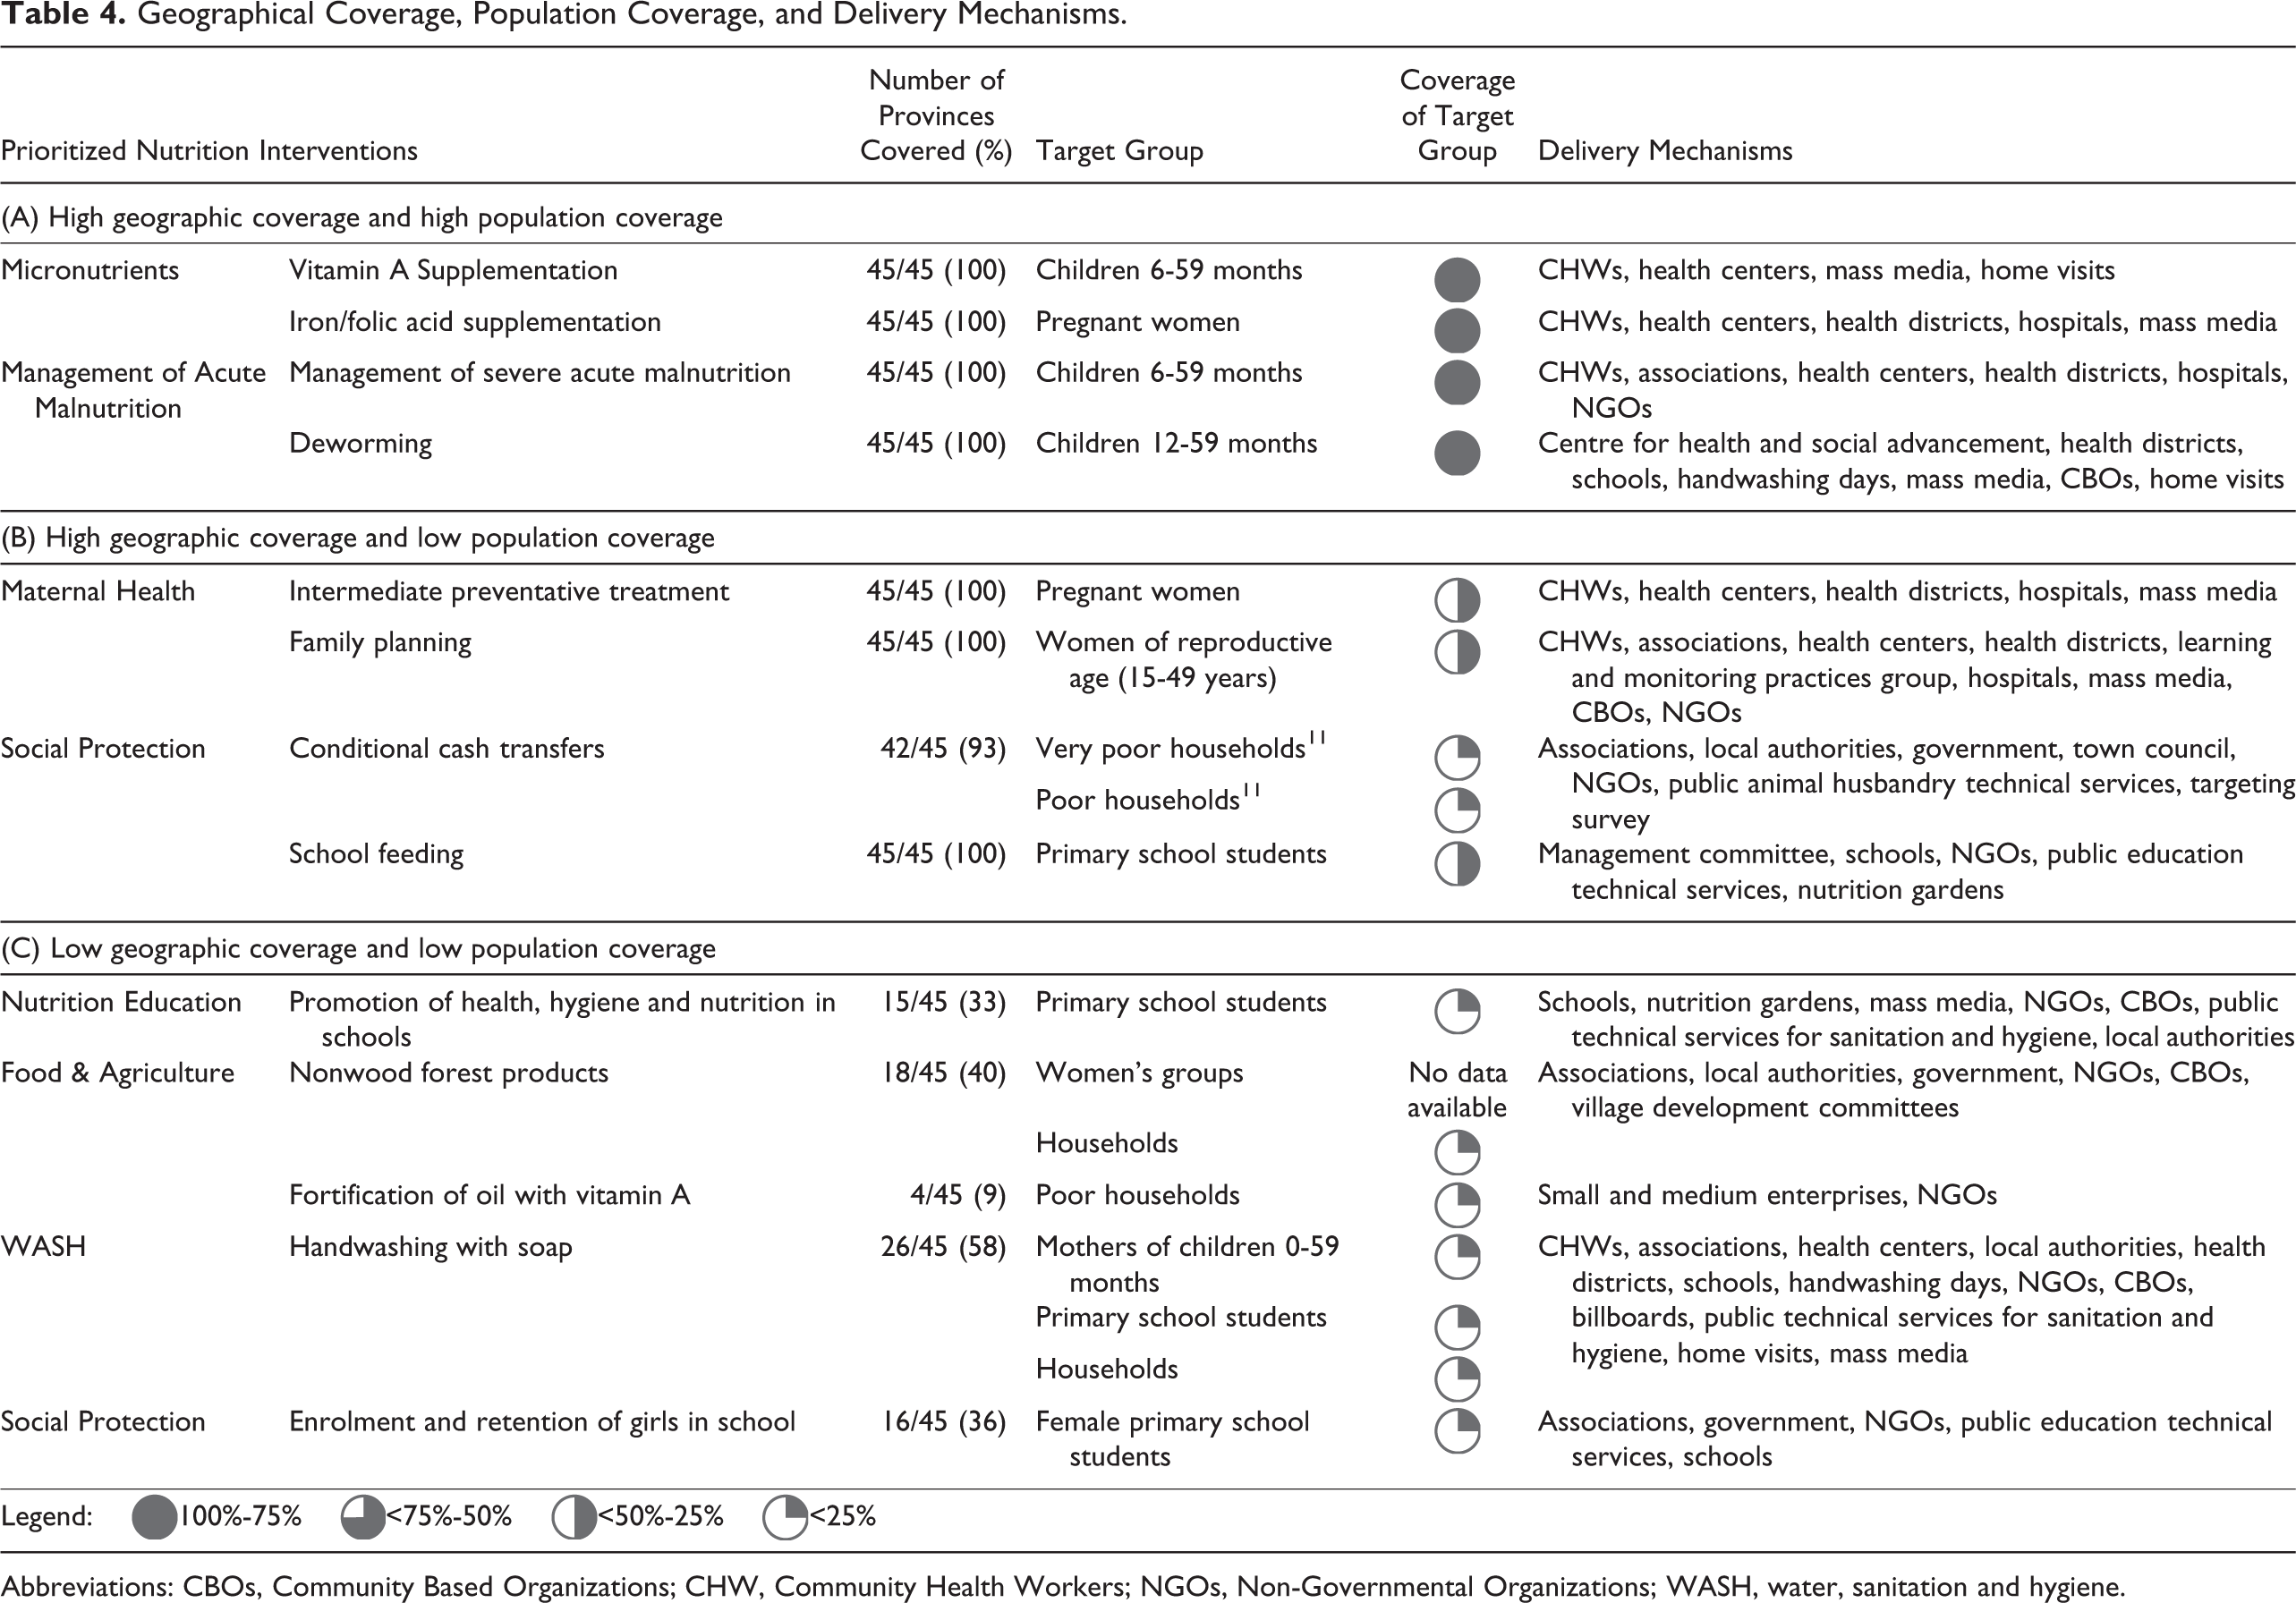
Abbreviations: CBOs, Community Based Organizations; CHW, Community Health Workers; NGOs, Non-Governmental Organizations; WASH, water, sanitation and hygiene.
Population Coverage
The coverage of beneficiaries differs across interventions, with some interventions having more than 1 beneficiary group. The results showed that population coverage is satisfactory for 5 of 12 nutrition-specific interventions, where coverage of the intended target group is >75%. As with geographic coverage, nutrition-specific interventions tend to have the highest population coverage. These interventions include vitamin A supplementation for children, iron–folic acid supplementation for pregnant women, deworming in children, and treatment of children having diarrhea with ORS with zinc supplementation. In contrast, most nutrition-sensitive interventions have low population coverage, except for the intervention promoting the consumption of locally produced flour for complementary foods. In general, it seems that there is more of a priority placed on nutrition-specific interventions, potentially because they directly address malnutrition and can produce results in a relatively short period of time compared to nutrition-sensitive interventions.
Geographic Coverage and Population Coverage
When considering geographic and population coverage simultaneously, the results can be divided into 3 categories: (1) interventions with both high geographic and population coverage (above 75%), including interventions such as vitamin A supplementation and iron/folic acid supplementation (Table 4 A); (2) interventions with high geographical coverage (above 75%) but low population coverage (less than 50%), including interventions such as intermittent preventive treatment for malaria during pregnancy, family planning services, and conditional cash transfers (Table 4B); and (3) interventions with low geographic and population coverage (<50%), including interventions such as promotion of home gardens; promotion of health, hygiene, and nutrition in schools; fortification of oil with vitamin A; and distribution of insecticide-treated nets (Table 4C).
As illustrated in Figures 2 and 3, the results showed that for nutrition-specific interventions, the geographic coverage is high (above 75% for the majority of the interventions), and population coverage is variable but in general above 50%. For nutrition-sensitive interventions, the geographic coverage is lower, between 25% and 75%, and population coverage is low (<25%).
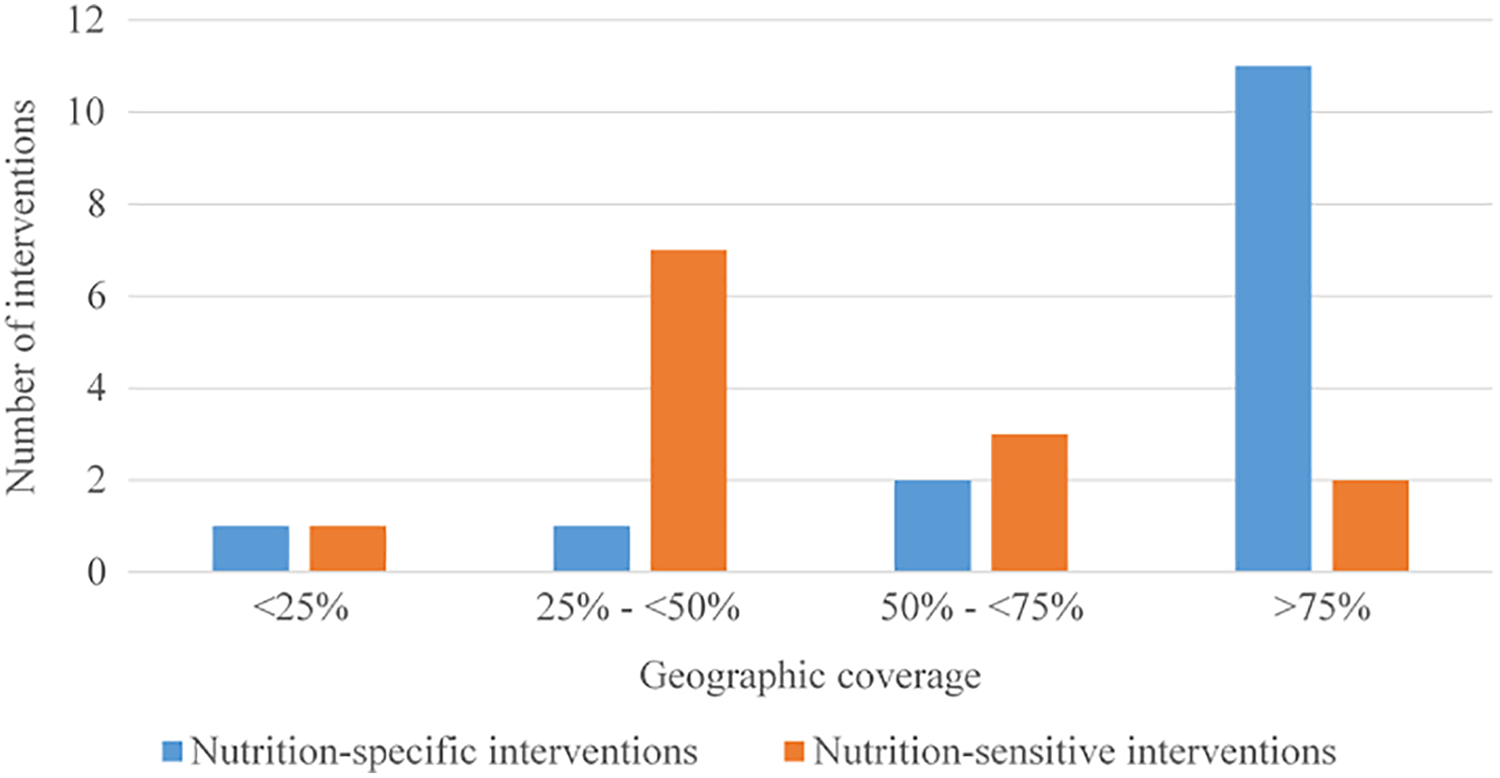
Geographic coverage of nutrition-specific and sensitive interventions.
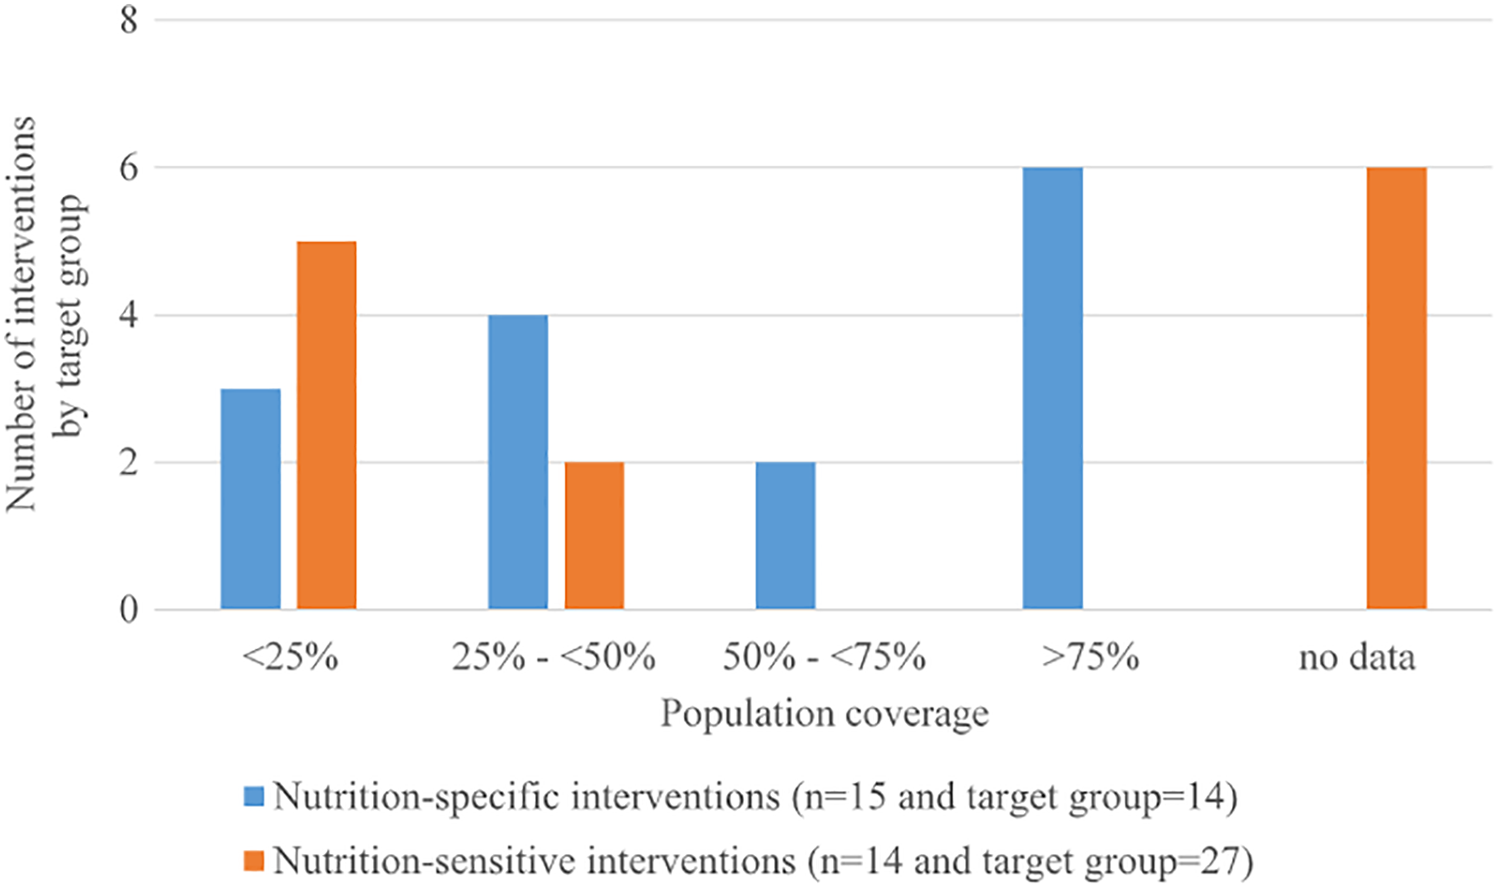
Population coverage of nutrition-specific and sensitive interventions.
Delivery Mechanisms
Delivery mechanisms are variable across sectors (see Table 4 and Figure 4). Across both nutrition-specific and nutrition-sensitive interventions, we observe the involvement of community-level actors (ie, community health workers, community-based organizations, or associations), mass media, and NGOs. Local authorities and technical public services are more often involved in nutrition-sensitive interventions.
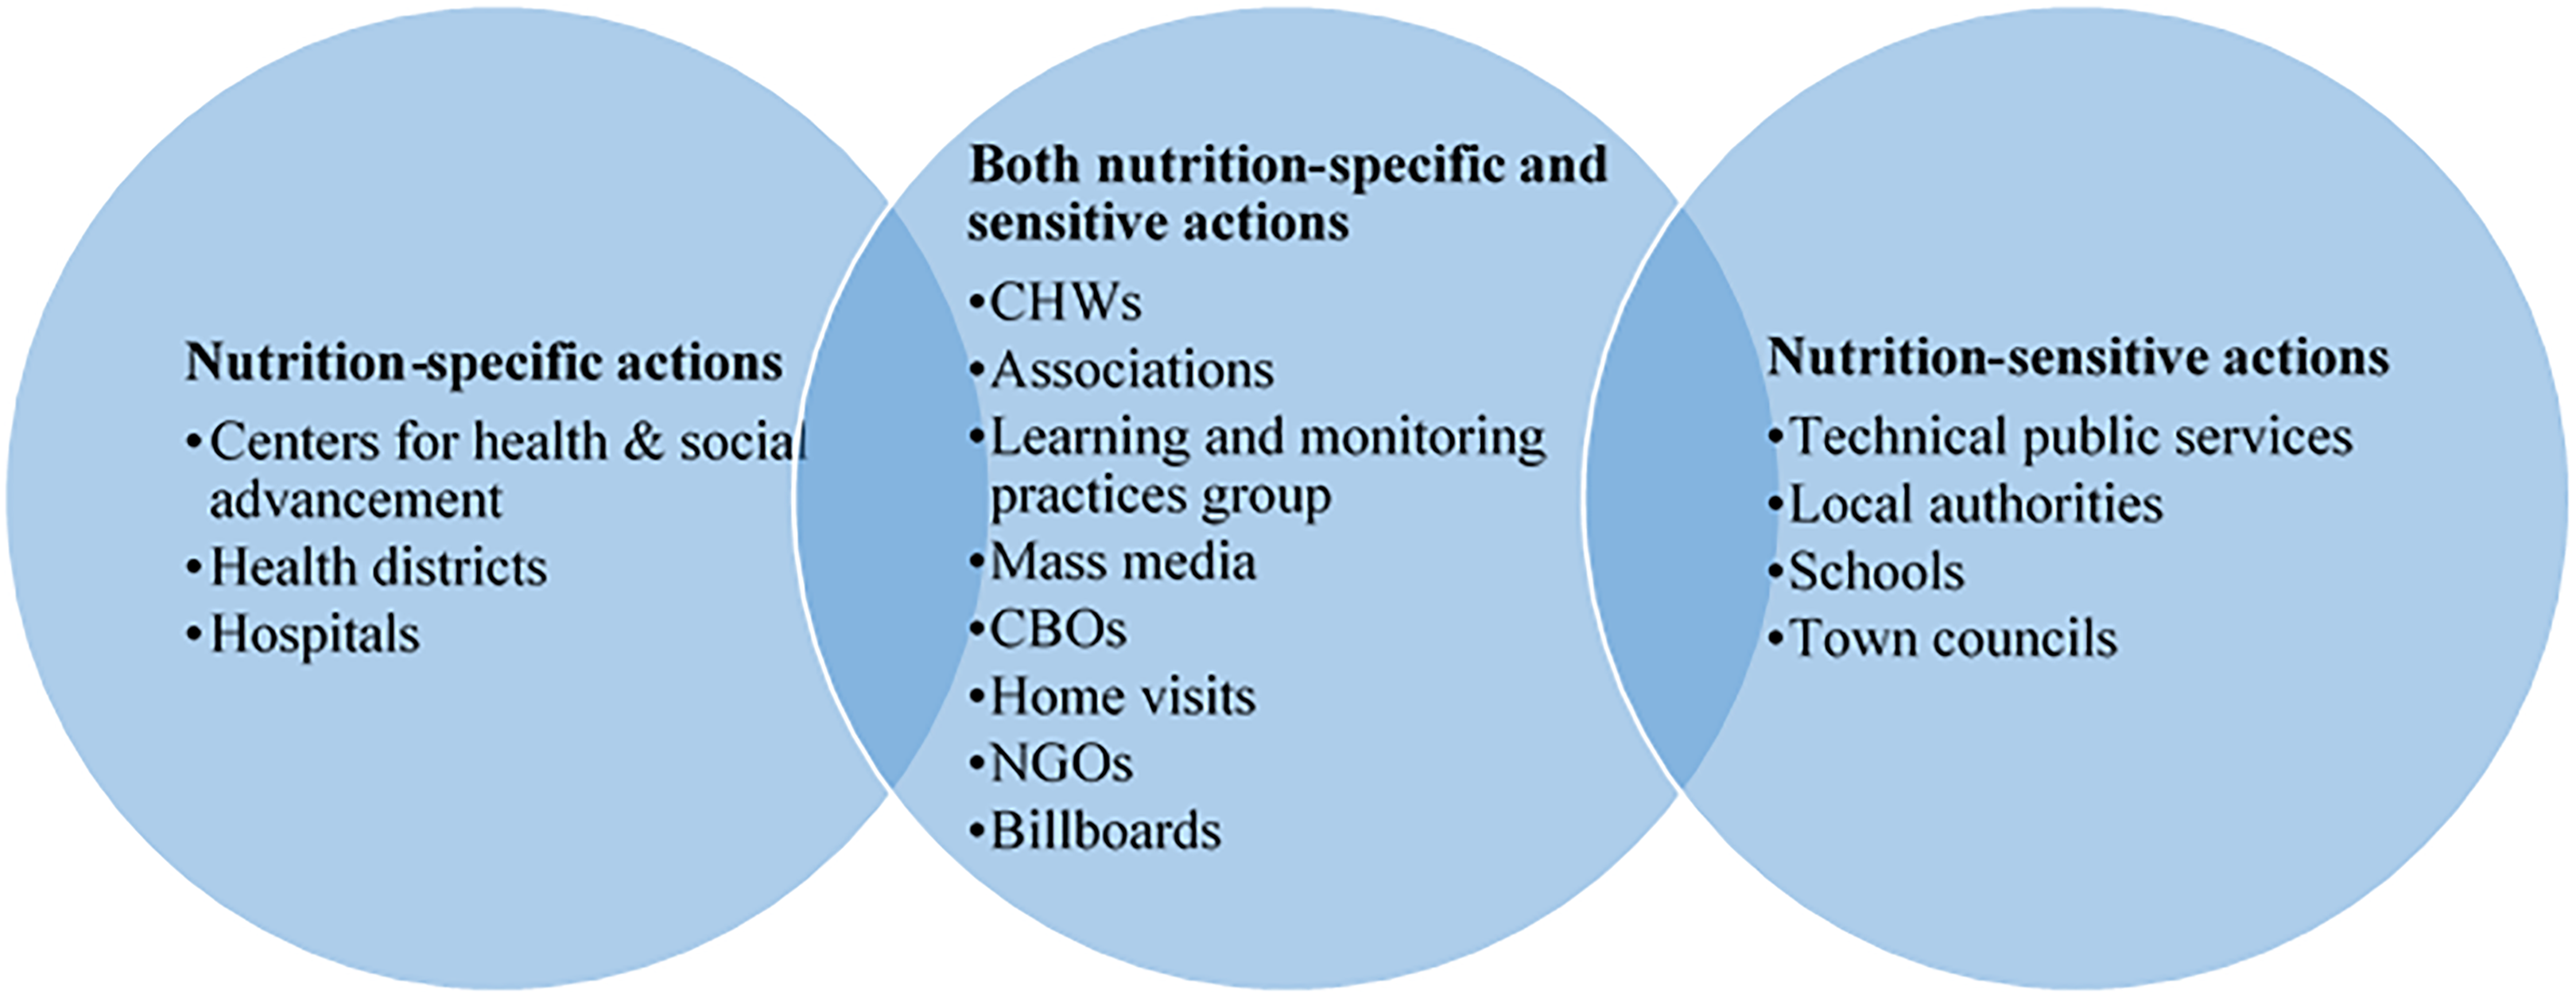
Delivery mechanisms per intervention type.
Identified Needs Based on Geographic and Population Coverage
Most prioritized nutrition interventions mapped are implemented across most regions in Burkina Faso; however, they only reach a small proportion of the target population (Figure 5). A typical child younger than 5 years of age in Burkina Faso receives 5 of 18 interventions directed toward children, although the needs based on the nutritional situation vary depending on the child. At the decentralized level, children are much more likely to receive more of the needed interventions in 3 regions (Sahel, North, and East), where the highest number of interventions reach at least 75% coverage of beneficiaries.
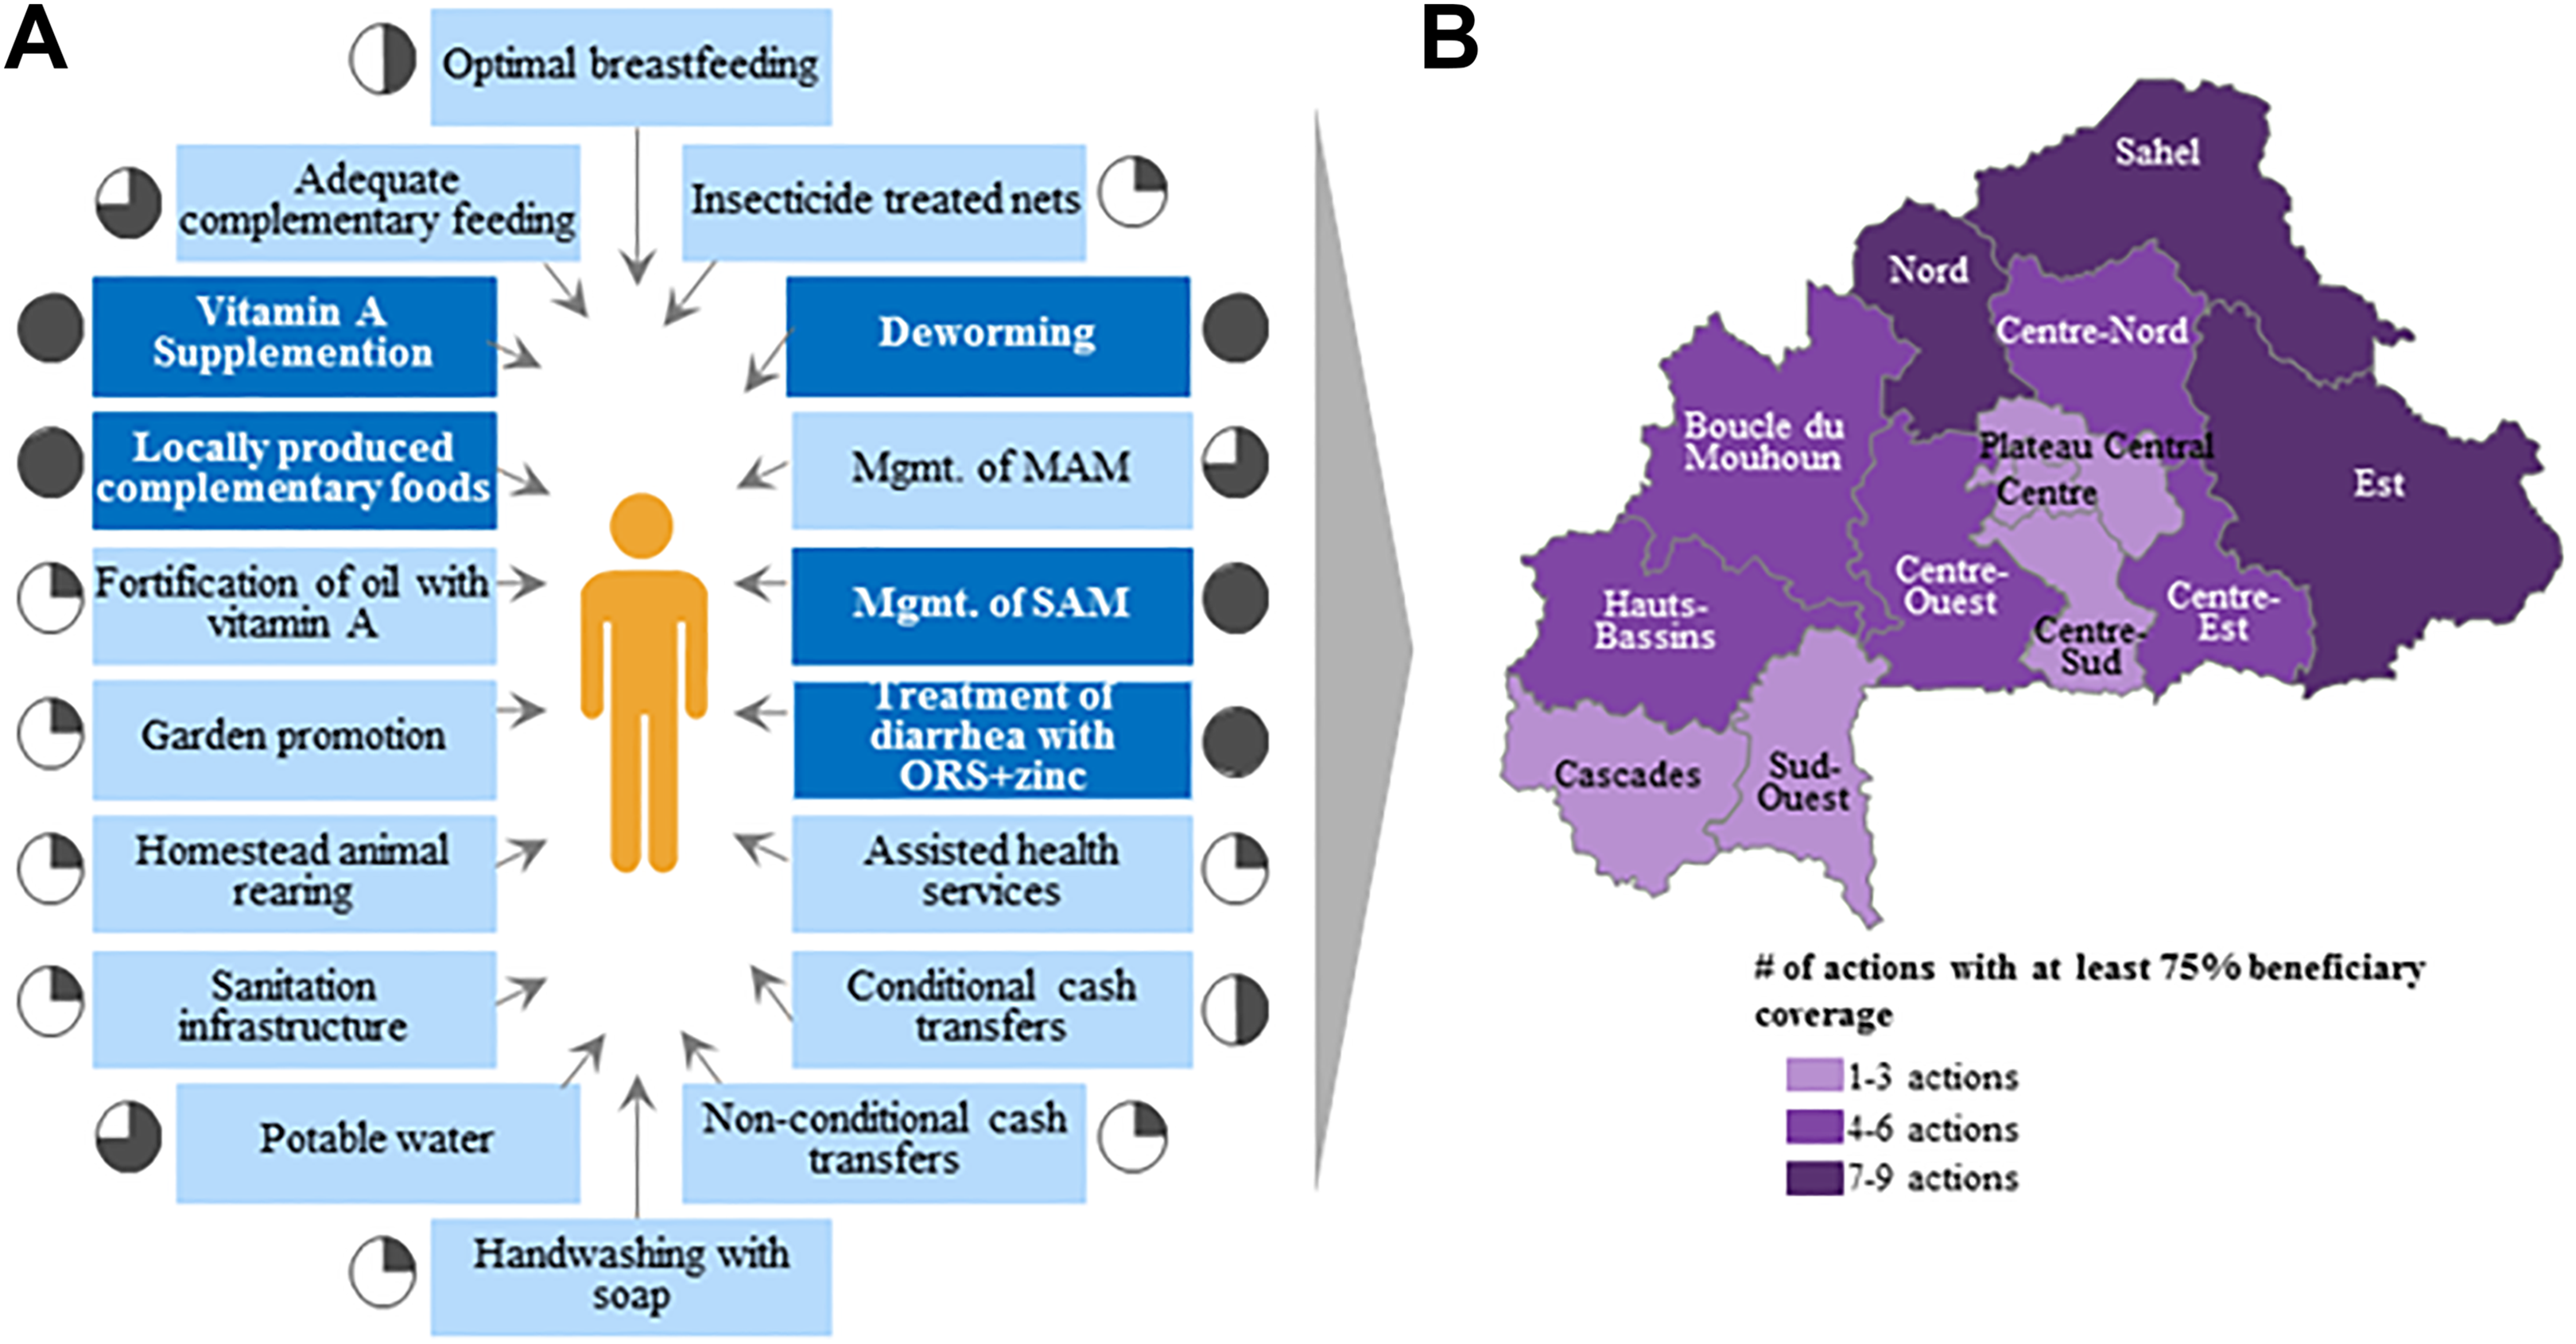
Coverage of child-centered intervention. A, A typical child in Burkina Faso receives about 5 actions they may need. B, On average, children in North, Sahel and East regions receive more actions than in other regions.
Coverage of interventions to combat malnutrition are not always correlated with the prevalence of different nutrition indicators at the regional level, particularly when examining the stunting situation. Figure 6 shows the regions as a function of the number of prioritized nutrition interventions with at least 30% of population coverage and the prevalence of stunting. This figure highlights 4 quadrants: (1) areas where the coverage of interventions need to be maintained and there is an acceptable nutrition situation; (2) areas where the coverage of interventions need to be monitored and have low levels of stunting; (3) areas where the coverage of interventions need to be investigated because there are high levels of stunting; and (4) areas where the coverage of interventions need to be scaled up because of high levels of stunting and low population coverage of many interventions. Many areas in Burkina Faso should be monitored because they have a noncritical nutritional status, although they have a low population coverage of many interventions. However, there are several regions (Southwest, Cascades, Center-East, North, and East), where the prevalence of stunting is above critical public health thresholds but the population coverage of mapped nutrition interventions is low. These regions need to consider strategies for scaling up interventions that better address the nutrition situation. Moreover, the Sahel region needs further investigation to determine why the coverage of interventions is not enough to address the nutrition situation. A better understanding of the situation, bottlenecks, and the implementation of interventions, particularly in terms of quality, is necessary. It was also found that despite the high coverage of interventions responding to anemia in children across different regions, prevalence of anemia remains extremely high.
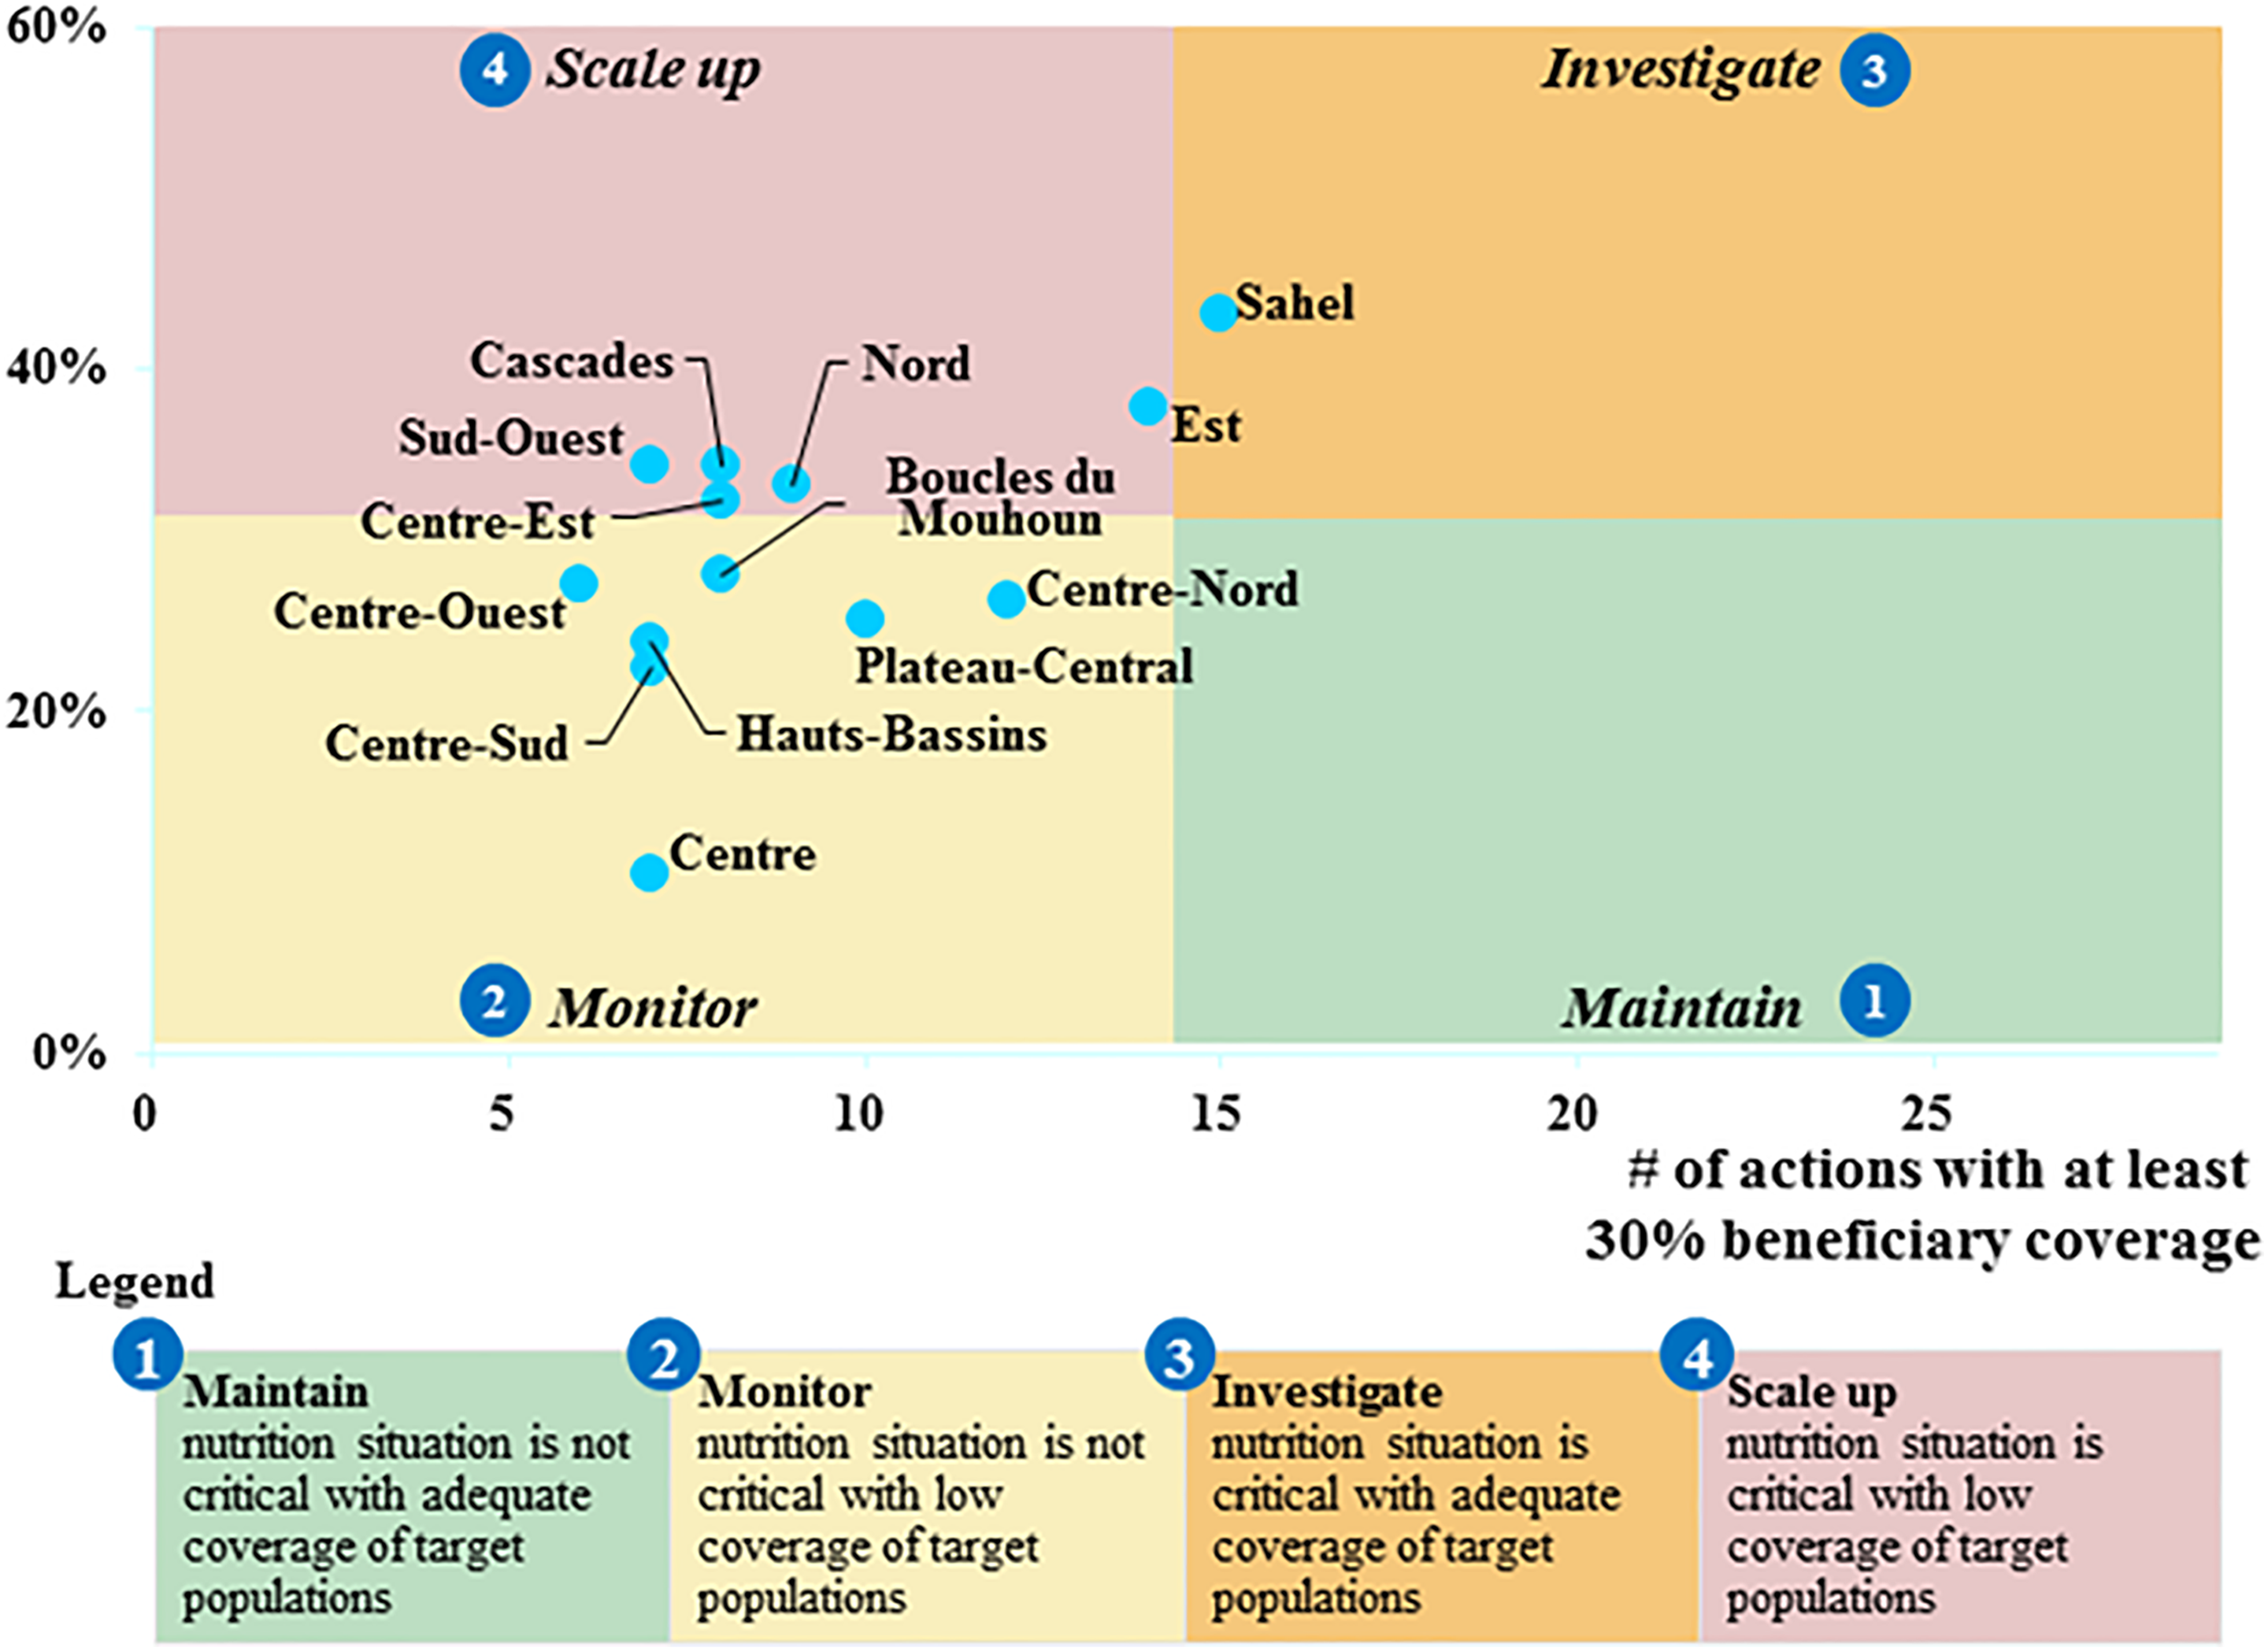
Regional assessment of population coverage and stunting (source: SMART 2014 11 ) Prevalence of stunting (%).
Discussion
The 2016 Global Nutrition Report highlights that some countries, which have fared better than others in overcoming the barriers to implementation of nutrition interventions and achieving high coverage rates in nutrition programs, have also developed strategic multisectoral nutrition plans. 1 The REACH Partnership under the UNN supports countries in this regard and provides country partners with effective tools and facilitation support to develop multisectoral plans with the participation of all stakeholders. 7 As in many countries who are part of the SUN Movement, Burkina Faso has been using a process for multisectoral nutrition planning since 2014, supported by several analytical exercises, including the mapping of stakeholders and nutrition interventions. The SUN PMT, used in the mapping, is dynamic and adaptable to the context, making it possible to easily aggregate and calculate coverage for a variety of intervention types. In the case of Burkina Faso, the mapping provided a first step and evidence-based approach to understanding the scale of nutrition interventions. It is expected that the mapping will be repeated in subsequent years, since the tool can track across years with few updates needed. This allows the one-time mapping of stakeholder and interventions to transform into a multisectoral and multistakeholder implementation monitoring system and further strengthens the routine data landscape.
There were 2 main limitations observed during the mapping exercise. The first was the risk of duplication of the same intervention being reported multiple times, and the second was the insufficient quality of the data provided by some stakeholders. There was an attempt to identify and eliminate duplication throughout the data collection and cleaning processes in order not to overestimate population coverage. To improve data quality and avoid duplication, several steps were taken. First, before starting the interview process, the stakeholders were categorized by type (field implementer, catalyst, funder, and responsible ministry) and their partners identified. This helped to make an initial mapping of how stakeholders may be working together so that information on a single instance of an action was not recorded twice. Second, during data entry, the entries from stakeholders were verified with reporting stakeholders through additional interviews when potential duplication of interventions across partners was noted. Third, during data cleaning, the automated tables presenting stakeholders by role and population coverage per province were used to further identify potential instances of duplication. If duplicate interventions were found, one would be removed from the database insuring that none of the qualitative data were lost before deleting. An additional part of data cleaning was to ensure that spelling and abbreviations are always the same for the names of stakeholders.
The second limitation of the exercise was the completeness of the data from all stakeholders. As the government was leading the mapping exercise, all partners were urged to share information regarding their projects and programs. Once the data were processed, it was shared with the partners who reviewed their data for accuracy and verified with their partners. This approach strengthened the inclusion of partners in the exercise. The 6.3% of stakeholders not considered were excluded because another partner had already reported their activities.
The review of the literature related to stakeholder and nutrition intervention mapping was inconclusive, as most of the articles found were concentrated on individual interventions and used varying methodologies, many using a more qualitative nature. 12 -17 The tools with methodologies most similar to the methodology used by the SUN PMT use Semi-Quantitative Evaluation of Access and Coverage (SQUEAC) or Simplified Lot Quality Assurance Sampling Evaluation of Access and Coverage (SLEAC) methodologies. These tools are used by NGOs to determine coverage of programs managing treatment of acute malnutrition in targeted geographic areas through the use of routine program data and small-scale surveys. 18 The SUN PMT allows for more flexibility by allowing for a variety of interventions to be mapped, differing from SQUEAC and SLEAC methodologies, which are focused on a single intervention. The SUN PMT has been used in several countries (Ghana, Uganda, Tanzania, Rwanda, Senegal, Niger, and Mali). Resources and examples have not been published in scientific journals, but they are available on the REACH website. 19
Our article seems to be the first to attempt to show how the collection and analysis of coverage of interventions based on program data from both the government and the partners has contributed to the multisectoral nutrition planning process and can be a vital tool in the accountability of both governments and partners toward achieving nutrition targets. This exercise was carried out at a time when the Government of Burkina Faso initiated the multisectoral nutrition planning process, and the results of the exercise could support data-driven decision-making and planning processes. The exercise enabled stakeholders to better identify nutrition needs and to provide background analysis from which to further explore during the planning process. For example, bringing together intervention coverage and investments with a view to understand whether low coverage is due to low funding allocation. Overall mapping results provide useful evidence to start a meaningful dialogue on interventions and areas to be prioritized for scaling up that have the greatest potential to have a sustainable impact on the nutrition status of key populations.
Planning for nutrition in Burkina Faso began with the development of the CRF, which serves as the basis for the development, harmonization, and approval of a multisectoral strategic plan for nutrition. The CRF prompts actors to agree on who is responsible for the implementation of certain interventions and how to achieve the expected results. 20 The mapping exercise helped to bridge the gap between the CRF and the multisectoral nutrition plan by providing data on the current statue of nutrition actions in the country. The results were used to define common objectives, identify needs, select priority interventions, and set targets. The results also facilitated discussions for scaling up key interventions and triggered further analysis including on budget and funding allocation. Through these discussions, several definitions of “scale up” emerged differing across sectors and spanning both the capacity development and means of implementation. Definitions of scaling up have also been described by several authors. 3,20 -26 The Global Nutrition Report 2014 referred to scaling up as a process to maximize the scope and effectiveness of a range of relevant nutrition interventions leading to a sustainable impact on nutrition outcomes. 27
The availability of information on the coverage of interventions has been crucial in the planning process in Burkina Faso. According to Bhutta et al, 28 attention must be paid to coverage data as it is an important means of assessing the presence of interventions on the ground. The results of the mapping have shown that there are still issues to address regarding the coverage of beneficiaries despite having good coverage of provinces. This divergence of coverage can be explained by the fact that partners are rarely implementing nationally and that the heterogeneity of partners differs across interventions.
In the analysis of the mapping results, the population coverage of interventions was examined in comparison to situation indicators at the regional level in order to better align priorities with decision-making. For example, coverage of interventions that address anemia were compared to the level of anemia in children at the regional level. 29 The results help to distinguish that there are regional discrepancies between the prevalence of anemia and the interventions being implemented that have the potential to affect the prevalence of anemia. Another area where there were regional discrepancies was between the prevalence of wasting 11 and interventions that both treat and prevent acute malnutrition. Comparisons of this effect helped to further define the priorities areas within the CRF. Information from the mapping coupled with the results of the Cost of Hunger study 6 serves as an advocacy tool for integrating nutrition into the government’s agenda.
In view of the usefulness of mapping in the nutrition planning process, the government has introduced it as a key element of their M&E system. The mapping will be carried out on a regular basis of every 2 years. The importance of mapping on a regular basis makes it possible to analyze trends in coverage to ensure continuous progress. Coverage data should however be triangulated with coverage data from household surveys for better analysis of results and to guarantee quality and sustainability of interventions implemented. This will be the subject of a future article.
Conclusion
The mapping of key nutrition interventions and stakeholders supporting those interventions in Burkina Faso was an important tool in the multisectoral planning process. The exercise made it possible to identify needs, promote an evidence-supported planning process in order to scaling up interventions, and mobilize sectors and development partners around nutrition. The Multisectoral Strategic Plan 2016 to 2020 was developed as a planning document based on objective information, and the implementation of the plan will undoubtedly improve the nutrition situation in Burkina Faso. The regular application of the mapping exercise will make it possible to continue to monitor the implementation and coverage of the prioritized nutrition interventions in the strategic plan over time and compare with trends in the nutrition situation in order to make sure there is continued impact.
Footnotes
Declaration of Conflicting Interests
The author(s) declared no potential conflicts of interest with respect to the research, authorship, and/or publication of this article.
Funding
The author(s) disclosed receipt of the following financial support for the research, authorship, and/or publication of this article: The mapping exercise was funded by Global Affairs Canada (GAC).