
Abstract
Background:
A therapy based on ready-to-use therapeutic food (RUTF) in outpatient settings is considered the gold standard in the treatment of severe acute malnutrition in children younger than 5 years. The price of RUTF is the key cost driver of the therapy. However, no studies to date have systematically examined the determinants of RUTF prices.
Objective:
This article presents the first analysis of factors associated with the prices of RUTF, focusing on the impact of competition and tendering.
Methods:
This article examines data on the prices of RUTF purchased by UNICEF Supply Division from 2006 through 2015 (90% of RUTF purchased globally). To assess the association between price, competition, and tender introduction, controlling for potential confounding factors, regression analysis using a generalized estimating equation was used.
Results:
Competition, measured as the number of suppliers, was negatively associated with RUTF price. On the other hand, no statistically significant association was found between RUTF price tendering. Quantities sold were also significantly associated with RUTF prices.
Conclusions:
Significant price reductions have been achieved by increasing competition in the RUTF market. In contrast, introduction of tendering did not result in decreases in prices. Tendering is an effective price-lowering mechanism because it awards the bidder(s) with the lowest price with market exclusivity. However, the current tender system promotes market fragmentation and reduces the incentives for price reductions. Further reduction in RUTF prices can likely be achieved by modifying the current tendering procedures and putting a greater emphasis on price competition.
Introduction
Severe acute malnutrition (SAM; note 1) in children younger than 5 years of age, also known as severe wasting, is a form of malnutrition resulting from a combination of infections and inadequate intake of macronutrients. It results in significant body weight loss and severely repressed immune responses. 1 Children with SAM have 9 times higher mortality rates than their peers who are not malnourished. 2 In the absence of treatment, SAM mortality risk may be as high as 20% to 30%. 3,4 According to the World Health Organization (WHO), wasting accounts for 2 million deaths among children under 5, globally—5% of all deaths in that age-group. 1
Severe acute malnutrition treatment has been shown to reduce mortality and lead to recovery in over 80% of cases. 5 Traditional inpatient treatment protocols relied on water-soluble milk formula products and required inpatient admissions that greatly limited treatment availability. The introduction of outpatient treatment based on ready-to-use therapeutic foods (RUTF) has lowered the cost and made treatment more accessible and cost effective. 6
The first commercially available RUTF product was developed by the Institute for Research for Development and the French company NutriSet and patented in 1997 under the name Plumpy’nut. 7 United Nations Children’s Fund (UNICEF) started procuring RUTF for its SAM treatment programs in 2000 and quickly became its main global purchaser. Currently, UNICEF purchases about 90% of the global supply of RUTF. In 2007, the joint statement from WHO, UNICEF, and the World Food Program recommended expansion of RUTF-based SAM treatment. Following the publication of the statement and the subsequent development of national treatment protocols in many countries, the demand for RUTF increased dramatically giving rise to concerns that NutriSet, which had been the sole global supplier of RUTF, would not be able to meet it. In order to increase global supply and to control rapidly escalating costs, UNICEF set out to promote the entry of new suppliers by introducing competition and tendering for RUTF.
Compared to other child health and nutrition interventions, treatment of SAM remains relatively expensive with the cost of RUTF accounting for a large proportion of the total cost. 8 Despite concerns that the high cost can limit the expansion of SAM treatment programs, no studies to date have systematically examined the determinants of RUTF prices. This article offers the first analysis of factors associated with prices of RUTF, focusing on competition in general and tendering in particular. The key questions it seeks to answer is whether the decision to introduce competition and tendering has led to significant price reductions.
Literature Review
The RUTF is a therapeutic product that needs to conform to strict norms established by the WHO. It was initially developed under a patent and was protected by intellectual property rights. This product development and marketing trajectory is similar to that of pharmaceuticals. Consequently, literature on competition in pharmaceutical markets offers a useful framework in which the impact of competition on RUTF prices can be analyzed.
Tenders for pharmaceutical products, and tenders in public procurement more broadly, are usually conduced as reverse or Dutch auctions with 1 monopsonistic purchaser, where the seller or sellers who offer the lowest price win the auction and, for a time period, are given exclusivity to supply the market. 9 Economic theory suggests that, under such conditions, tenders result in Bertrand-like price competition: Producers are willing to reduce prices to levels approximating marginal costs in order to capture large market shares.
Empirical literature on tendering for outpatient pharmaceuticals is surprisingly limited. 10 This may be because tendering is still a relatively new procurement and reimbursement mechanism for outpatient markets. Tendering is widely used for purchasing drugs and devices in hospital settings, for pharmaceutical products for public health purposes (eg, vaccines and epidemic preparedness products), and for medicines for certain patients’ groups (eg, prisoners and military personnel). 11 However, tendering for outpatient pharmaceuticals has been used only in a few countries. Such tenders are usually introduced for certain classes of medicines and may or may not include patented originator and nonoriginator products. New Zealand was the first country to introduce tendering in the outpatient market at a large scale in 1996. 12 Since then, tenders in outpatient markets have been held in a number of other countries including the Netherlands, Germany, Belgium, Iceland, and Ireland. 11
Case studies show that the introduction of tendering has led to significant price reductions. In New Zealand, the introduction of tenders resulted in 60% to 70% declines in the prices of generic medicines. 12 In the Netherlands, the tendering for generic statins (simvastatin and pravastatin) and omeprazole led to price decreases ranging from 80% to 93%. 9 In Belgium, following the introduction of tendering, the price of generic simvastatin declined by about 40%. 9 By introducing tenders, the Global Drug Facility was able to reduce the price of multidrug-resistant tuberculosis treatment by 26%. 13
Concerns have been raised over the impact of market concentration resulting from tenders on the stability of supply and prices. Some authors have argued that tendering may lead to shortages of medicines if the provider who wins the tender is unable to supply the quantities needed 14 or that market concentration may lead to market exits of producers who do not win bids and result in monopolies and subsequent price increases. 10 Empirical literature on tenders in outpatient pharmaceutical markets shows no evidence of supply shortages or creation of monopolies and price increases. 15 One analysis of tenders for malaria artemether-lumefantrine combination therapy in Kenya and Uganda reported posttender shortages. 16 However, those shortages were a result of poorly organized tenders rather than utilization of tendering as a means of procuring medicines.
While country studies suggest that tendering may lead to very significant price declines, to date, no systematic econometric analyses have been published that examine the impact of tender introduction on the price of outpatient pharmaceuticals, the impact of tendering on competition in outpatient markets, or the impact of specific tender features on prices or the degree of competition. Two recent studies examined the impact of generic entry and participation in tenders on the competitive behaviors of tender participants, including the price of the products offered. 17,18 However, the focus of the analyses was to understand the impact of generic participation in tenders rather than the impact of tenders on prices. Examining the prices of RUTFs before and after the introduction of tendering offers an opportunity to better understand both the determinant of RUTF prices and the impact of tenders on prices of outpatient pharmaceutical products.
Tendering for RUTF
UNICEF purchases about 90% of the global supply of RUTF. Between 2001 and 2008, RUTF was procured through bilateral agreements first with NutriSet (2001-2006) and then with NutriSet and another global supplier (2007-2008), and prices were set through negotiations. 7 In 2008, Nutriset released its patent. The first tender for RUTF was carried out for 2009.
UNICEF has identified 2 overarching goals of this procurement strategy: (1) achieving affordability and (2) ensuring availability of RUTF. 19 In addition, the following objectives for the tendering process have been set: (1) identify a reliable supplier base capable to respond to growing demand at a competitive price; (2) support development of sustainable supplier base in UNICEF programmatic countries; and (3) by 2017, source 50% of RUTF from manufacturers located in programmatic countries. 20
For each tender, suppliers submit offers with a specific price (per 15-kg carton—roughly the amount needed to treat 1 episode of SAM) for a specific quantity they are proposing to supply in a given year. All suppliers whose offers meet the tender evaluation criteria are allowed to sign long-term agreements (LTA) to supply RUTF to UNICEF. For each LTA, UNICEF awards all or part of the quantity specified in the supplier’s proposal.
Suppliers are encouraged to offer staircase pricing, with greater discounts for greater amounts awarded in LTAs, greater cumulative orders placed, or greater total amounts ordered by UNICEF. 21 In addition to price, proposals are evaluated based on producer’s location in a UNICEF programmatic country, payment terms and discounts, delivery times, quantity offered, capacity to maintain buffer stock, product characteristics, past performance of delivery times, account management, experience in manufacturing RUTF, and quality assurance. 21
Long-term agreements are nonbinding agreements. The amounts of RUTF included in the LTAs are based on demand projections, which UNICEF shares with the potential suppliers during prebid conferences. Orders are filled monthly based on the actual demand from country offices. UNICEF’s projections are highly accurate. In 2012, orders exceeded the projected demand by only 4%, in 2013 by 5%, and in 2014 the orders were lower by 13% than the projected demand. 22 This suggest that suppliers may have a relatively high degree of certainty regarding the quantities that UNICEF will purchase in a given year and that projections usually underestimate the actual orders. Consequently, the suppliers can be fairly certain that they will sell to UNICEF at least the amounts specified in their LTAs, if not more. At the same time, however, anecdotal evidence suggests that monthly orders fluctuate significantly, with very small quantities ordered during some months and high quantities ordered during other months (author’s personal communication). This has significant implication for cash flow (eg, lower monthly revenues, increased cost of borrowed capital), and stock management, especially for smaller and less diversified producers for whom inputs are less fungible. Long-term agreements usually cover 1 calendar year (12 months, from January to December) with an option of 12-month extension.
Hypotheses
General economic theory suggests that the increased competition and the entry of new suppliers on the RUTF market should be associated with decreases in prices. Furthermore, auction theory suggests that the introduction of the tender system should generate a sharp 1 time decrease in prices. It also suggests that competition should result in a negative relationship between price and quantities sold, as suppliers entering the tender would be willing to lower prices in order to capture a large share of the market.
Methods
The data presented below span the time period from 2006 through 2015. Data on RUTF prices are publicly available and were obtained from UNICEF website (note 2). The data include the price per carton (15 kg) of RUTF for each supplier for every year in which UNICEF Supply Division (SD) purchased RUTF from that supplier. It does not include prices from suppliers whose bids were unsuccessful and who were not awarded LTAs. All prices in the data set are LTA prices for palletized and containerized product at the delivery point and reflect all discounts. Prices have been converted into US dollars and inflated to 2015 values.
Data on RUTF quantities sold to UNICEF by each producer are not publicly available and were obtained by the author from the UNICEF SD. The data include the quantity, in metric tons (MT; 15 kg), of RUTF for each supplier for every year in which UNICEF SD purchased RUTF from that supplier. The data on quantities purchased were highly right skewed, with most suppliers selling relatively small quantities and a few suppliers selling significantly larger quantities. Skewed distributions pose problems for estimation because most of the observations are clustered within a small range of the values of the data which in turn make identifying statistical associations more difficult. 22 Therefore, in the regression models, the natural log of quantities sold was used. Data on prices and quantities purchased were available from 2006 through 2015.
The total number of producers supplying UNICEF in a given year was included as a proxy measure for the competitiveness of the RUTF market. The number of suppliers was calculated using the RUTF price data set. For every year, the value of the variable was equal to the number of suppliers who have signed LTA with UNICEF and whose prices were recorded in the data set.
The independent variable capturing the impact of tendering was coded 1 for all observations after the introduction of the tender (form 2009 through 2015) and 0 otherwise. In addition, a dichotomous indicator for whether a supplier was located in a programmatic country or not was added to control for the fact that, in its tendering procedure, UNICEF explicitly promotes suppliers from programmatic countries and may be willing to pay a price premium on product procured from those suppliers. Data on suppliers’ location were obtained from the UNICEF SD website. A dichotomous indicator for the originator was included to control for the originator’s potential price advantage. A dichotomous indicator for originator franchisees, coded 1 if a supplier was producing RUTF under a franchising agreement and 0 otherwise, was used to control for potential price advantage of franchisees. Data on whether a producer was a franchisee was obtained from NutriSet website (note 3).
Dried skimmed milk is estimated to account for between 40% and 50% of RUTF input costs and over one-third of the total manufacturing cost. 23,24 To account for the impact of the changes in commodity prices on the prices of RUTF, the Food and Agriculture Organization (FAO) Dairy Price Index was included in multivariate analyses. Dairy Price Index data were obtained from the FAO website. Measures of prices of 2 other ingredients of RUTF, peanuts and palm oil, were also used in the statistical models. Palm oil prices were obtained from the World Bank’s Global Economic Monitor Commodities. Because no comparable data were available for peanuts, peanut oil data were used instead, as a proxy of peanut prices. Annual peanut price index was from the World Bank’s Global Economic Monitor Commodities data base. The prices for both variables were measured as price per MT in real US 2010 dollars. Finally, a linear time trend was included as a proxy measure for changes in production technology and potential increases in efficiency. The data used in the analyses presented below is a panel data in which 1 observation corresponds with 1 supplier-year.
Analytic Methods
Descriptive analyses were used to examine changes over time in RUTF prices and quantities sold. Regressing analysis was used to assess the association between price, competition, and tender introduction, controlling for potential confounding factors. Because analyses were conducted on panel data, ordinary least squares (OLS) regression assumption of uncorrelated standard errors (SE) was violated and OLS estimator would yield biased SEs. 22 Therefore, 2 alternative approaches were used: (1) an OLS model with robust SEs and (2) a general estimating equation (GEE) model. Generalized estimating equation estimator is both consistent and efficient. 25 Because the results from both models were virtually identical, GEE results are reported below. All analyses were conducted using Stata version 13 (College Station, Texas).
In pharmaceutical pricing studies, quantities sold are often considered endogenous to price and vice versa. This is because suppliers who sell higher quantities can lower their prices but also suppliers who offer lower prices can subsequently sell higher quantities. Therefore, instrumental variable techniques have been used for models including both price and quantities. 17,26 In UNICEF RUTF tenders, both price and quantities are submitted by suppliers as part of their bids. In fact, both proposed prices and quantities are key criteria used to evaluate bids. Therefore, it is unlikely that lower prices cause higher sales volumes or vice versa. Rather, both proposed price and quantity are 2 dimension of the suppliers bidding decision. Therefore, while clearly associated with one another, there is no reason to expect a causal, and therefore, endogenous, relationship between them. For this reason, no instrumental variable modeling was used.
Results
Over the past 10 years, the number of companies supplying UNICEF with RUTF has increased from 1 to as many as 15 (in 2012; Figure 1).
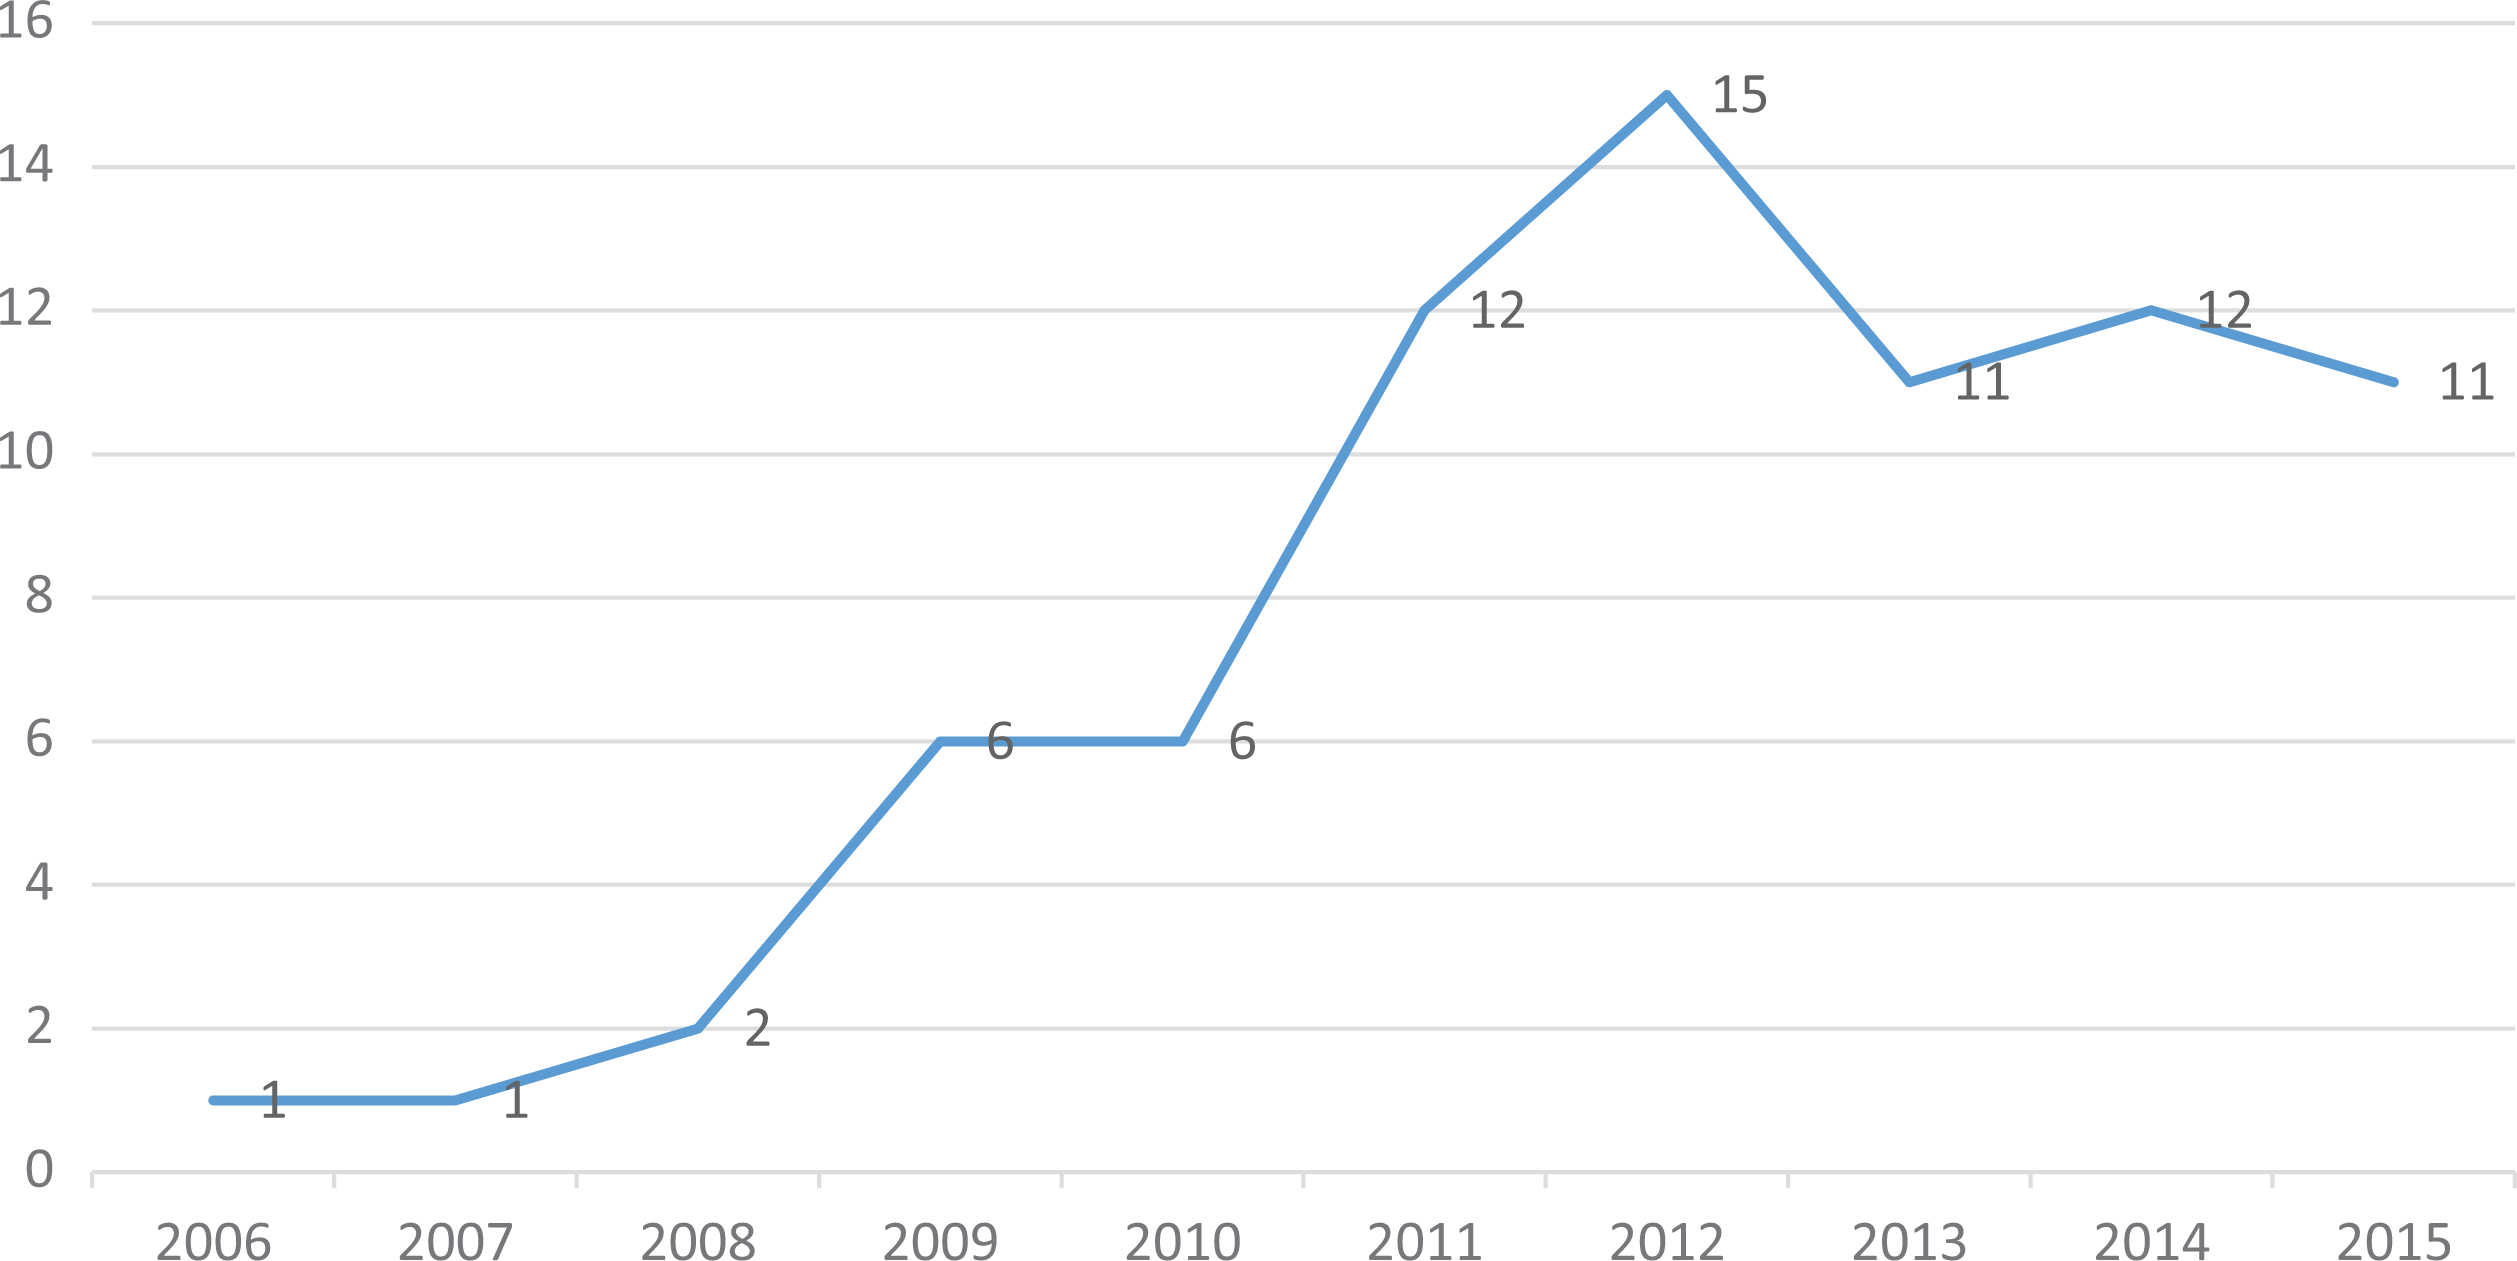
Number of RUTF producers supplying UNICEF Supply Division.
Seven of 17 producers in the data set were located in UNICEF programmatic countries. They accounted for about 60% of the observations (supplier-years) in the data set (see Table 1). Nine of the suppliers were the originator’s franchisees and contributed about 30% of the observations in the data set.
Descriptive Statistics of the Variables Used in Multivariate Models.
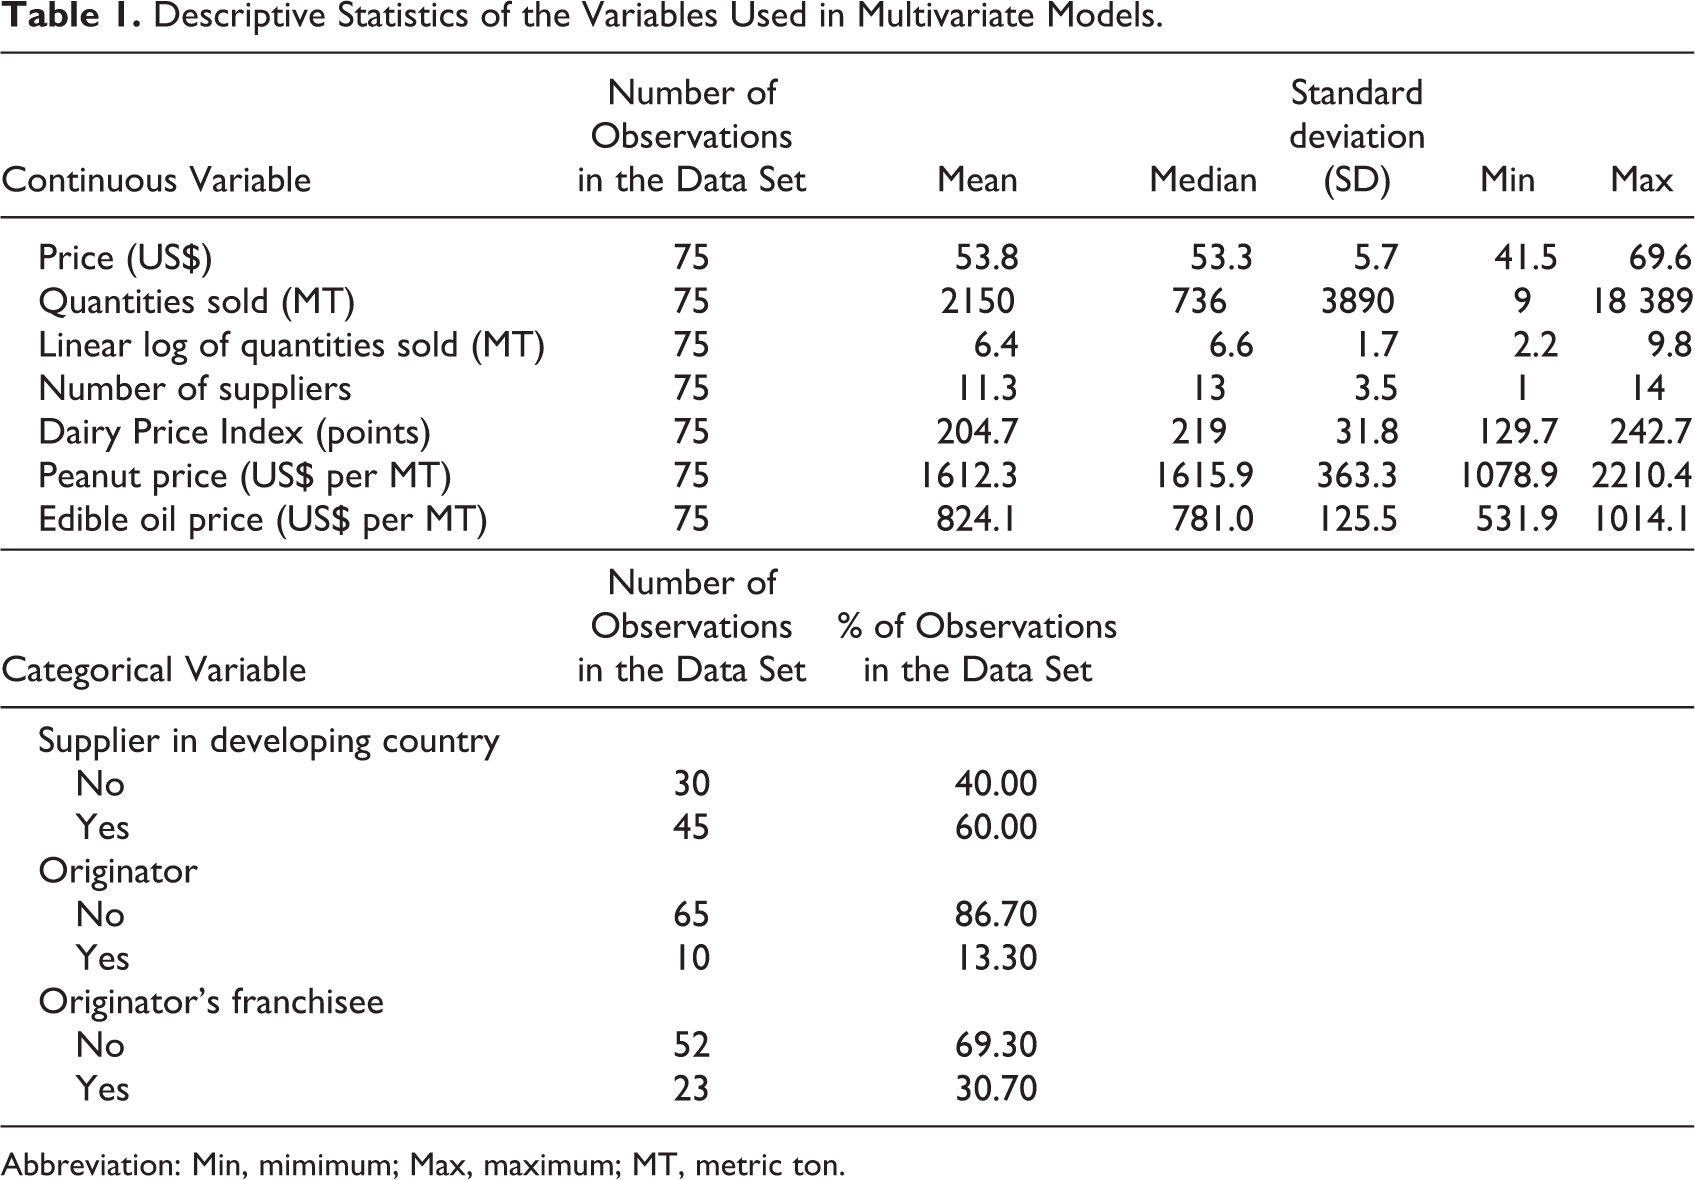
Abbreviation: Min, mimimum; Max, maximum; MT, metric ton.
Within the timeframe of the analysis, 5 suppliers stopped supplying UNICEF SD. Two of those continued supplying UNICEF country offices. The data do not allow to determine whether the remaining 3 suppliers exited the RUTF market altogether or whether they continued supplying other clients; the latter however seems less likely.
Over the past decade, the average price per 15 kg of RUTF declined by about 15% (see Figure 2). However, no drastic price reductions above and beyond this trend were observed following the introduction of tendering in 2009.
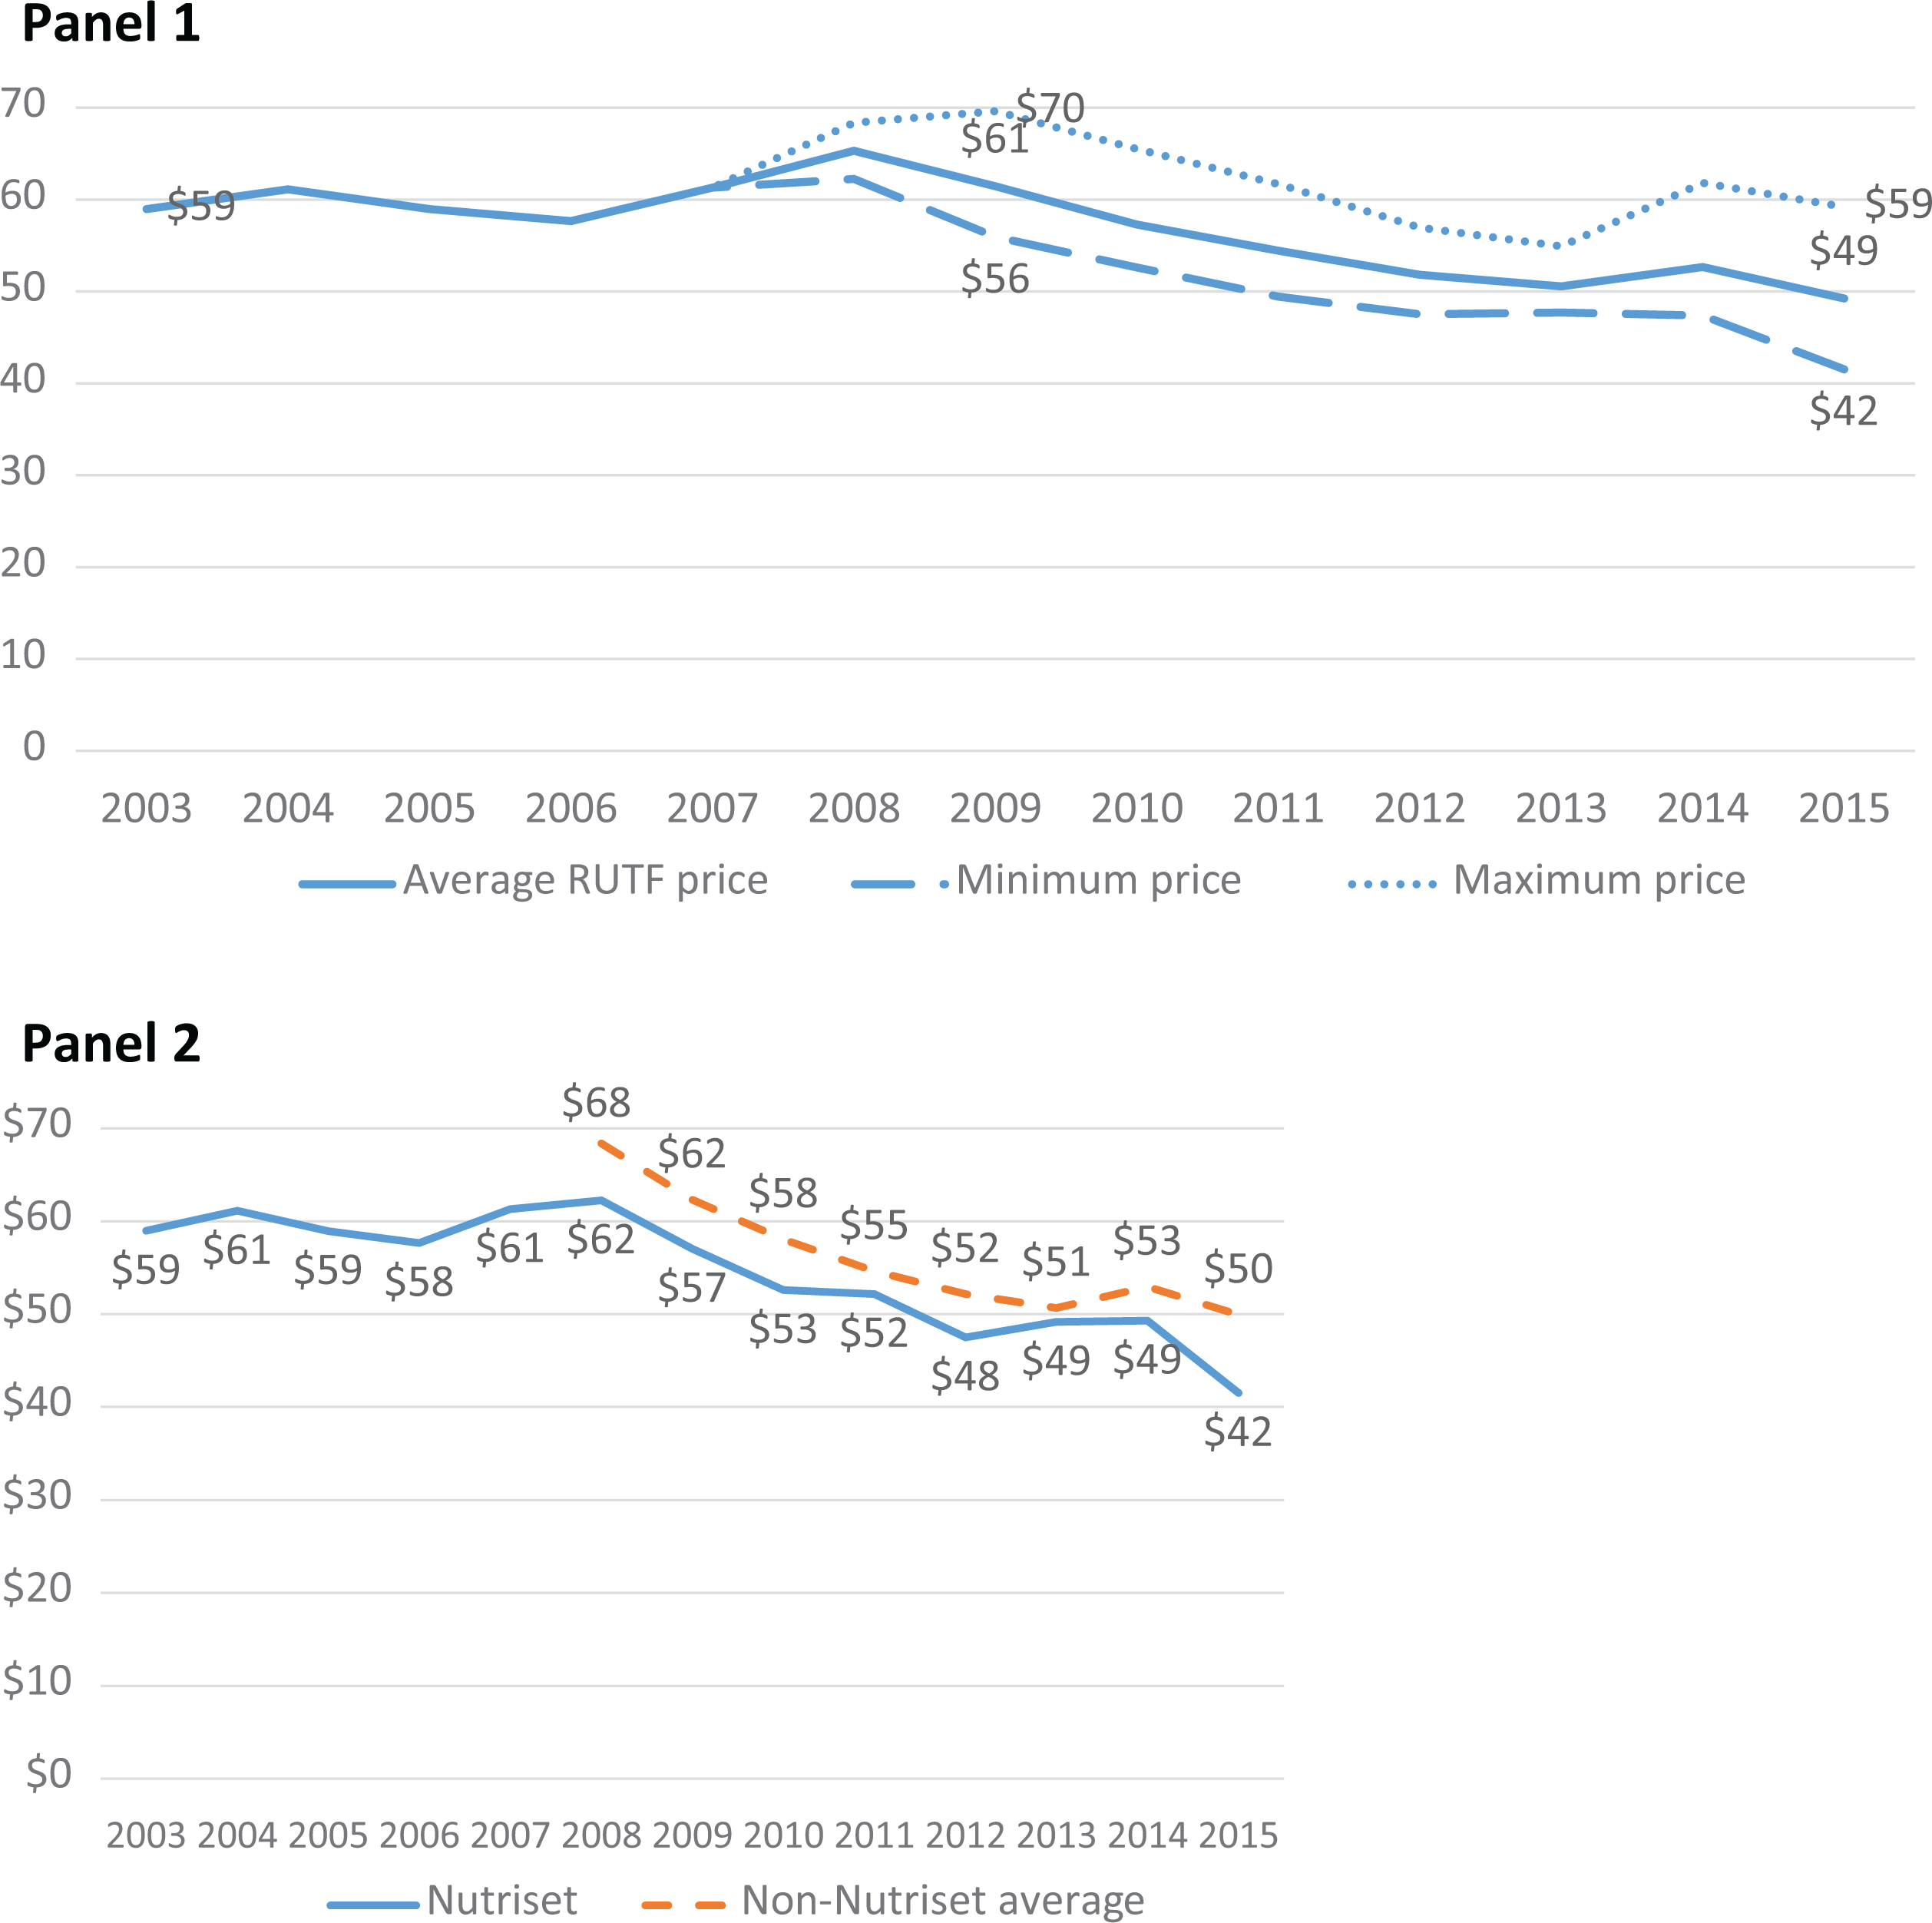
Average, minimum, and maximum annual RUTF prices and average prices by originator and nonoriginator producers, 2003-2015 (in 2015 US$).
From 2007 to 2008, the average price increased by about 6%, largely due to fluctuations in exchange rate between Euro and US$ (note 4). The price in Euro between 2006 and 2008 has in fact declined by 1.5% from €39.19 to €38.67. From 2008 to 2009, the average RUTF price declined by 6%.
The originator price has declined by about 27% from about US$57 to US$41. The average nonoriginator price has shown a very similar level of decline (27%; from about US$69 to about US$50; Figure 2). The difference in average prices between the originator and the nonoriginator producers have persisted over time, with the originator consistently offering prices lower, on average, by about 9%. The originator offered the lowest price among all the producers during 6 of the 10 years included in the sample.
Between 2006 and 2015, the market for RUTF expanded dramatically. The total quantity of RUTF purchased increased more than 10-fold from about 2.5 thousand MT in 2006 to about 28 thousand MT in 2015 (see Figure 3). The total quantity sold by the originator has increased 6 times from about 2500 MT in 2006 to about 16 thousand MT in 2015; the total quantity for nonoriginators has increased over 110-fold from 105 MT in 2008 to about 11 thousand MT in 2015.
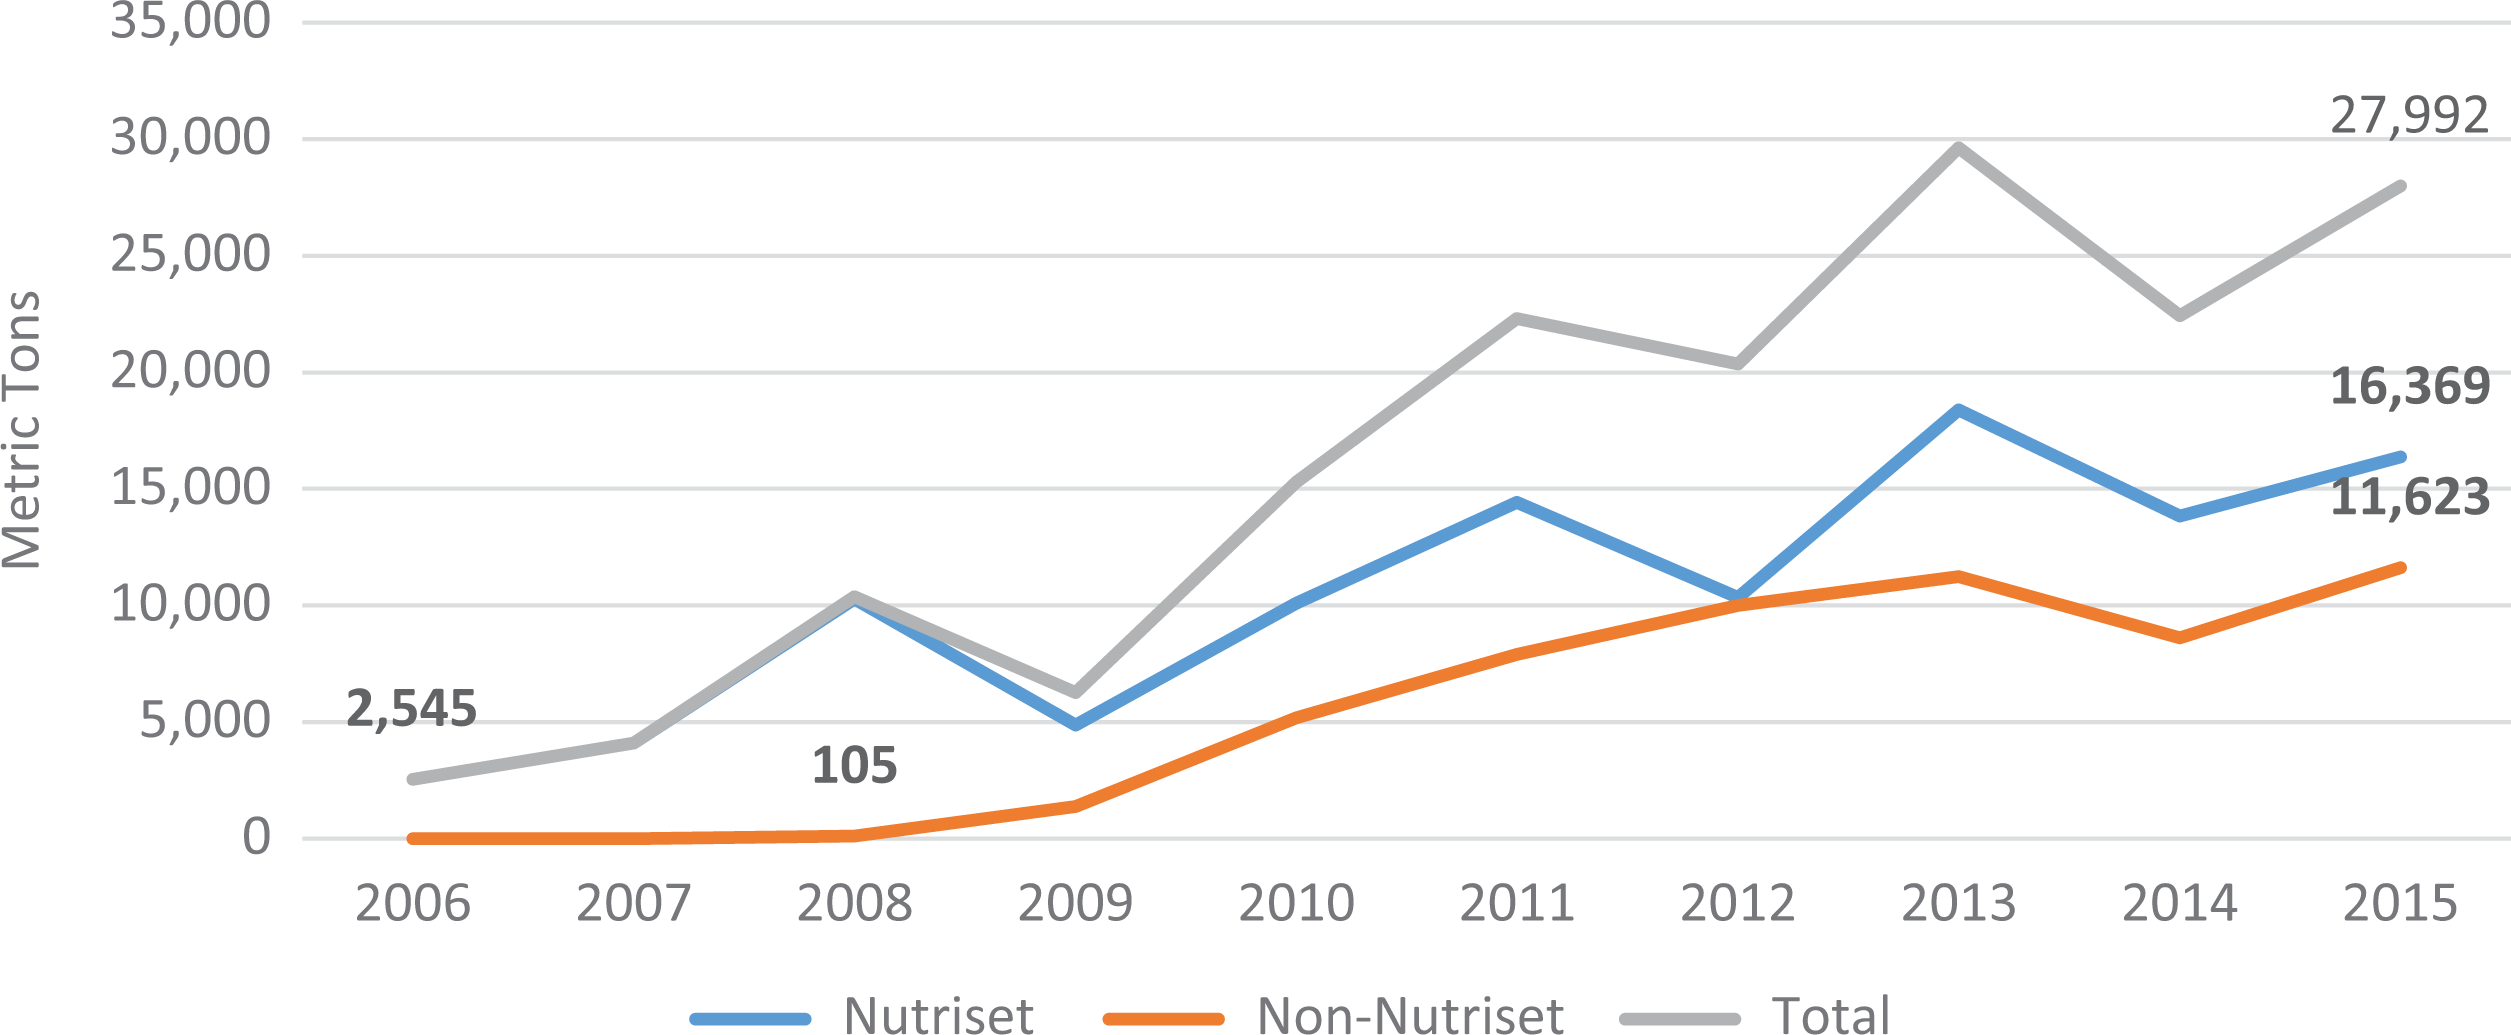
Volumes of RUTF procured by UNICEF supply division (SD).
On average, each supplier has sold about 2150 MT of RUTF in a given year. The distribution of quantities sold was highly skewed, with the lowest annual volume supplied of about 9 MT, the maximum of over 18 000 MT, and the median of about 736 MT (see Table 1).
The entry of new suppliers has reduced the market share of the originator from 100% to about 66% within the first 2 years. However, from 2010 until the end of the data series, the split of the market between the originator and the nonoriginator producers has remained stable with the originator claiming about 60% of the market and nonoriginator producers claiming the remaining 40%. This is truly remarkable, given the fact that the overall number of suppliers kept increasing during that period (see Figure 4).
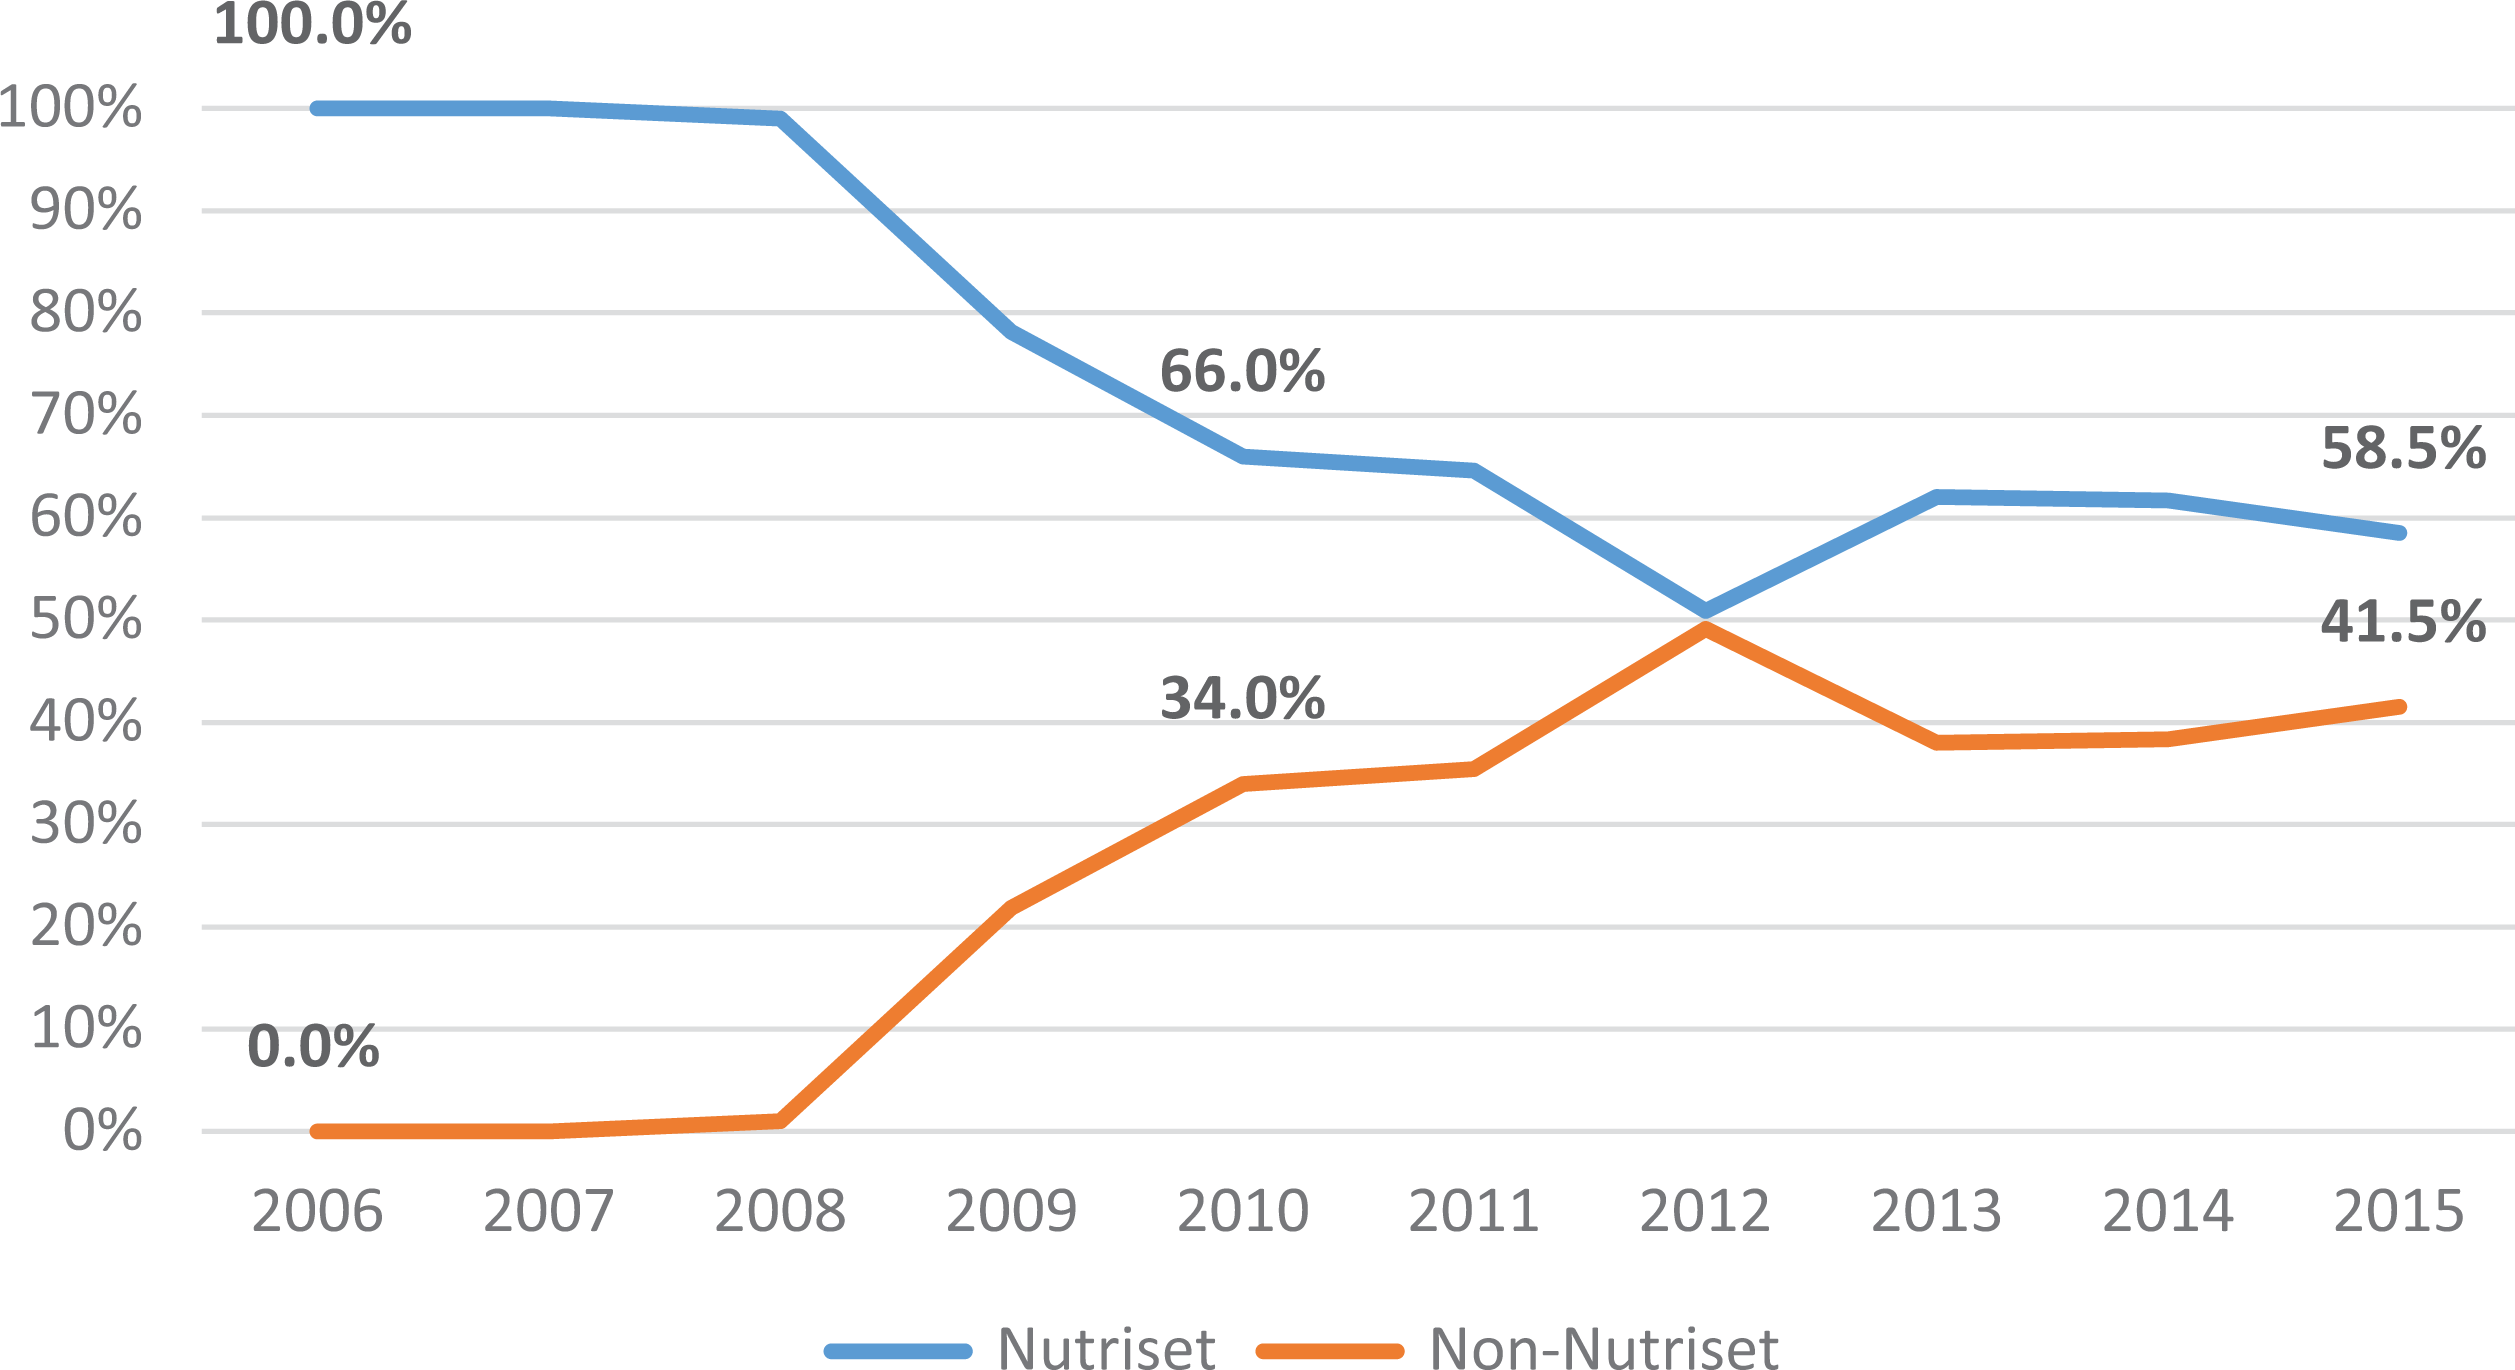
Market Share of the Originator and the Nonoriginator RUTF Suppliers, 2006-2015.
Multivariate Analysis
Regression analysis showed that higher numbers of suppliers in a given year, a proxy measure for the degree of competition in the RUTF market, was associated with lower RUTF prices (see Table 2). Each additional supplier entering the market was associated with lowering the average price per 15 kg by about 66 cents (βnumber of suppliers: −0.66; standard error [SE]: 0.28). It also showed no statistically significant differences in the average RUTF price before and after the introduction of the tender. The coefficient of the dichotomous variable indicating time periods before and after the introduction of tendering was not statistically significant (βafter tender: −4.17; SE: 2.43). Quantity sold was significantly associated with RUTF price. An increase of 1 in natural log of the quantity sold (in MT) was associated with about US$1.16 decreases in the price of RUTF (βquantity sold: −1.16; SE: 0.38). An increase of US$1 in the price of an MT of edible oil was associated with an increase of about 2 cents in the price of RUTF (βoil: 0.02; SE: 0.01). An increase of US$1 of an MT of peanut oil was associated with a decline of about 0.3 cents in the price of RUTF (βpeanut: −0.003; SE: 0.001). The relationship between producer’s location in a UNICEF programmatic county, originator status, franchisee status, and the dairy price index were not associated with price.
Association Between RUTF Price and Explanatory Variables (GEE Model Results).a
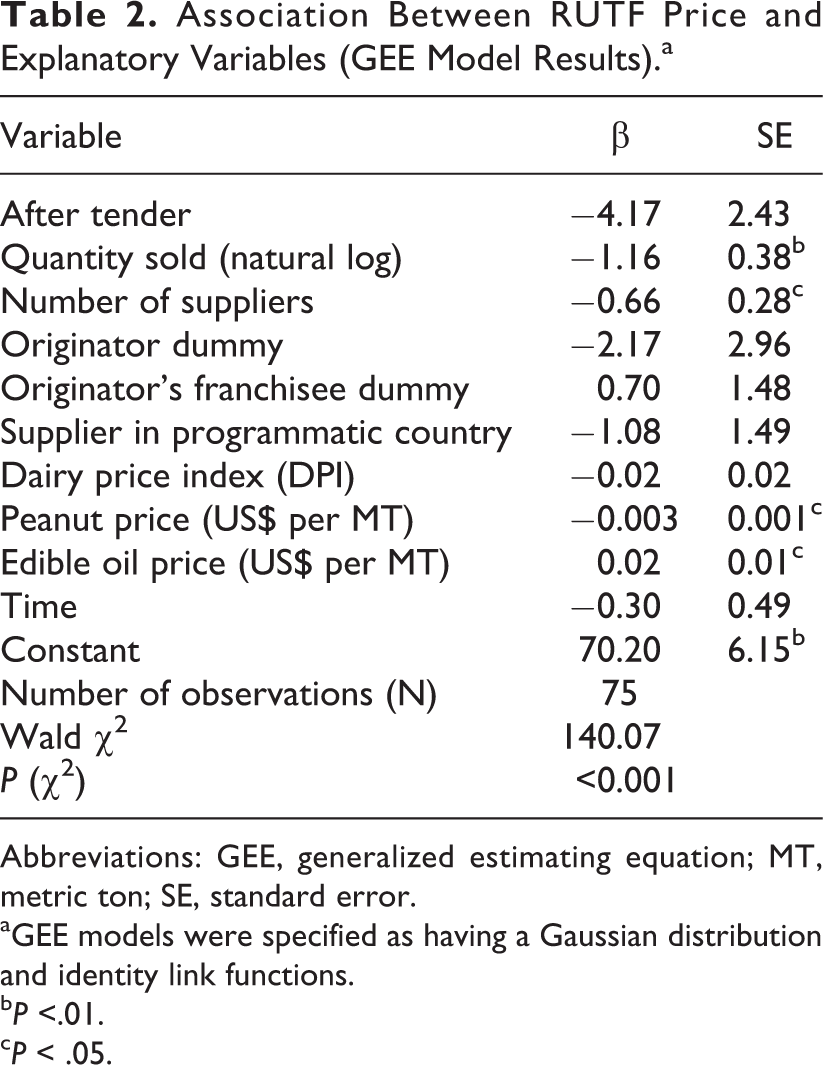
Abbreviations: GEE, generalized estimating equation; MT, metric ton; SE, standard error.
aGEE models were specified as having a Gaussian distribution and identity link functions.
b P <.01.
c P < .05.
Discussion
Consistent with the extant literature on pharmaceutical pricing, 26 quantitative analyses presented above showed that the introduction of competition by UNICEF in the RUTF market resulted in statistically significant reductions in prices. Regression analysis suggest that increasing the number of suppliers from 1 in 2006 to 12 (average 2012-2015) might have led to about 11% decline in the average price of RUTF. Over the past 10 years, those price declines could have translated into treatment for about 400 000 additional SAM cases compared to what would have been possible if monopoly prices persisted (see Supplemental Material). On the other hand, introduction of tendering seems to have had no effect on prices over and beyond the effect of opening of the market to competition. There were no sharp decreases in prices, contrary to what might have been expected based on the experiences from Europe, New Zealand, or the Global Drug Facility.
The key reason for the lack of significant price decreases seems to be the decision to allow multiple tender winners, stemming from the desire to ensure adequate global supply of RUTF and the emphasis of building a supply base in developing countries. Tenders are effective in lowering prices because they award the winning bidders with market exclusivity and allow for compensating revenue losses from lower margins with revenue gains from larger sales volumes. Conversely, increasing the number of tender winners reduces the price declines from introducing the tender. In New Zealand, a decision in 2009 to divide the market among 2 suppliers as opposed to allowing only 1 tender winner lead to an average price increase of about 17%. 15
The data presented above suggest that a more aggressive tendering system could result in substantial gains in terms of the amount of RUTF that could be purchased. First, RUTF producers are willing to exchange higher volumes sold for lower prices. Therefore, tendering procedures putting a greater emphasis on price and rewarding producers offering lower prices with greater market shares could potentially lead to all or most producers offering lower prices. Second, even assuming that there would be no general decline in the prices offered by all suppliers entering the tender, selecting fewer suppliers offering the lowest prices, even at the current price levels, could result in significant gains in terms of quantities of RUTF that could be purchased. For example, in 2015, UNICEF purchased RUTF from 11 suppliers who met the minimum tender requirements. Purchasing RUTF from the 3 suppliers offering the lowest prices in that year could have allowed to treat about 80 000 more SAM cases. Taking into account constraints of production capacity of different suppliers, even preserving the current market share of the originator who has the highest production capacity and splitting the remaining third of the market among the 2 suppliers offering the lowest prices would allow to purchase enough RUTF to treat over 64 000 more cases of SAM, roughly equivalent to all prevalent SAM cases in Djibouti and Eritrea combined (see Supplemental Material).
More aggressive tendering procedures would increase the risk of market exit for some suppliers. This would be particularly likely for suppliers in developing countries who produce smaller quantities and face higher production costs. In addition to higher input prices, producers in the developing countries and smaller-scale producers face proportionally larger costs of quality assurance and food safety control to meet the UNICEF and other quality requirements and, potentially, greater penalties for contamination. For example, in 2012, Cronobacter sakazakii contamination led to a quarantine of large quantities of RUTF with subsequent increases in testing among manufacturers and reported declines in the quantity of RUTF purchased by UNICEF from producers located in programmatic countries. 27,28
No studies to date have examined the economic impact of producing RUTF in developing countries. One analysis of community-level production of RUTF in Malawi has demonstrated that while individual farmers supplying commodities used to produce RUTF have benefited, the overall economic impact on the community was very limited. 29 Given that relatively small quantities of RUTF are currently produced in developing countries; that the production process is capital intensive, but not labor intensive; and that most of the inputs, in particular dried skimmed milk, have to be imported, the economic impact at the national level is unlikely to be substantial. Favoring local RUTF producers may have additional benefit by increasing the coverage of treatment programs in RUTF producing countries. However, currently, treatment coverage data are very sparse and insufficient for a cross-country comparison. 8 Future analyses should explore whether the benefits of producing RUTF in developing countries outweigh the opportunity cost of supplying less RUTF due to higher prices.
It is possible that RUTF market dynamics have attenuated the impact of tendering and competition on prices. In a market with stable demand, the only way for a supplier to increase sales volumes is to capture a greater market share. This is not the case for a growing market. Depending on the supplier’s cost function, she may find it more beneficial to keep prices and market share constant while the market expands than to lower the prices to capture a greater market share. Combined with the fact that the current tender system allows multiple winners, rapid expansion of the market might have allowed the suppliers to avoid price competition and keep prices (and market shares) relatively stable. A recent study has estimated potential demand for RUTF to be worth about US$9.1 billion over the next decade. 8 While it is unlikely that this level of demand can be financed in full, it is highly probable that the RUTF market will continue to expand in the coming years.
Some authors have pointed out that public tenders create conditions conducive to collusion. 30,31 Tendering procedures tend to be transparent with quantities and prices offered often publicized. This means that bidders can predict with high degree of accuracy both the quantities and the prices their competitors will offer in the upcoming bids. Therefore, even if the bidding suppliers do not coordinate their bids explicitly, implicit collusion can occur when bidders can discover the tenderer’s reservation price (the maximum price one is willing to pay) and bid accordingly. 32 Data presented above, showing a remarkably stable market split between the originator and other producers, seem to be consistent with this intuition. The analyses included in this article are insufficient to confirm or disconfirm the presence of implicit collusion in RUTF tenders. It should be explored in future studies.
Consistent with the economic theory and extant empirical literature on pharmaceutical pricing, 33 regression analysis showed a negative and statistically significant association between price and quantity sold. Each 1 natural log increase in quantity sold was associated with about US$1.16 reduction in price. This suggests that producers are willing to lower prices in exchange for greater overall sales. The data analyzed above does not permit to determine whether this association is a result of strategic behavior or the fact that producers who sell more are simply more efficient and are better able to benefit from economies of scale. Likely, it is a combination of the two.
While the data presented above indicate that the economies of scale are likely present in the RUTF market, the quantities of RUTF produced by each supplier are relatively small. For example, in 2015, even the largest supplier in the sample (NutriSet) has sold to UNICEF only about 16.4 thousand MTs of RUTF. In the same year, the average non-Nutriset supplier sold about 1.1 thousand MT. With some exceptions, most of the new entrants have been medium-size or small enterprises that likely face high initial cost to expand production. Because the current tendering system allows for awarding contracts to all suppliers who meet technical requirements, with an explicit advantage given to producers in programmatic countries, it partially restricts price competition. Conversely, the entry of new large-scale producers may lead to lower prices.
In addition to scale, it is possible that the economies of scope may also be present in the RUTF market. More specifically, most of the inputs used in the production of RUTF are fungible and can be used not only in other therapeutic and supplemental foods, but also in traditional food products. Suppliers with diverse product portfolios would likely face lower overall input cost, because they purchase higher input volumes. They would also be better protected against the fluctuations in the demand for RUTF. If this hypothesis is correct, it is possible that lowest RUTF prices could be offered by large-scale food producers with a diversified product portfolio that extends beyond supplemental and therapeutic foods. Unfortunately, no data on the diversification of production of the UNICEF RUTF supplies is currently available. Future analyses should explore whether economies of scope, in addition to the economies of scale, affect RUTF prices.
It is believed that the prices of RUTF are highly sensitive to changes in commodity prices. Data analysis presented above shows only a limited impact of commodity prices on RUTF price. Increases in the price of edible oil was associated with increases, albeit very small one, in RUTF price. Increases in the prices of peanuts were, somewhat counterintuitively, associated with even small declines in RUTF prices, which suggests a spurious association. Most notably, the diary price index was not associated with RUTF prices. It is possible that this is due to measure used: The index captures the prices of all dairy products, while RUTF price is influenced by the price of processed skimmed powdered milk and whey protein. Unfortunately, no global data on prices of skimmed powder milk are publicly available.
One key limitation of this study is the relatively short time span of the data and a small data set (75 observations). This results in low statistical power of the multivariate models and high likelihood of type 2 error. However, it needs to be noted that the data set includes all RUTF purchases that have ever made by UNICEF’s SD (and over 90% of all RUTF purchases globally).
This analysis includes only RUTF purchased by the UNICEF SD and excludes prices of RUTF purchased by the country offices. Country office purchases were excluded because data on quantities purchased from each supplier were not available and because those purchases were tendered separately from those by the SD. However, RUTF purchased by country offices account for a relatively small proportion of the total RUTF purchase (about 18% from 2012 through 2015). It also excludes RUTF purchased by countries and other donors (eg, USAID). Unfortunately, data on prices and volumes purchased by those entities are not available. However, as noted above, UNICEF purchases about 90% of all RUTF bough globally. Therefore, despite the data limitations mentioned above, the findings of this article can be considered representative of the very large proportion of the global RUTF market.
This article focused on the prices of RUTFs used to treat SAM. Similarly formulated ready-to-use supplemental foods (RUSF) are used to manage moderate acute malnutrition (MAM) and small-quantity, lipid-based nutrient supplements (LNS) have recently been used as a means to prevent chronic malnutrition. 34 Given the similarity and fungibility of inputs, expanding the analysis to RUSF and LNS may offer additional insights into the factors driving the prices of those products. However, currently, no data exist that would capture RUSF prices and volumes sold and purchased. If such data become available, future analyses should consider extending the analysis of price to determinants to RUSF used to manage MAM as well as to other lipid-based supplemental foods.
Conclusions and Implications
Introducing competition in the RUTF market has resulted in substantial price declines. At the same time, the introduction of tendering does not seem to have produced price reductions above those realized from expanded competition. The data indicate that producers are willing to trade price for quantities sold, or, at least, that producers with higher sales volumes tend to offer lower prices. Therefore, it is likely that a more aggressive tendering system would produce greater cost savings.
Expansion of treatment programs is necessary to mitigate the impact of SAM and to reach the nutrition-related sustainable development goals. Without substantial declines in RUTF prices, expanding the supply of SAM treatment will be very challenging. While reformulating RUTF by substituting dried skimmed milk with less expensive sources of protein is one promising avenue, currently, no such products are available. This article argues that purchasing and market mechanisms to lower RUTF prices are important, potentially beneficially, yet, as demonstrated above, not fully utilized strategies to reduce the cost of treating acute malnutrition.
Finally, it should be noted that, in addition to prices, delivery capacity is an important factor inhibiting the expansion of SAM treatment programs. While prices are often discussed as the key reason behind the low coverage of SAM treatment, delivery and programming capacity is not. It possible that the lack of capacity to deliver SAM treatment has made the need to lower RUTF prices less urgent (ie, all RUTF that can be programmed can be bought at current prices). However, this author believes that lowering of RUTF prices would create a strong pressure to strengthen delivery capacity and scale up SAM treatment programs worldwide.
This study has 2 potential implications for the broader empirical literature on tendering in pharmaceutical markets. The first is that specific feature of the tender (eg, number of winners) will likely mediate the impact of tendering on prices. The second is that, for tenders with multiple winners, the impact of tendering may be mediated by market dynamics. In particular, expanding market can attenuate price competition. Those hypotheses can be evaluated in future empirical studies.
Supplemental Material
Supplemental Material, RUTF_pricing_Supplemental_materials_1_26_18 - Determinants of the Global Prices of Ready-to-Use Therapeutic Foods
Supplemental Material, RUTF_pricing_Supplemental_materials_1_26_18 for Determinants of the Global Prices of Ready-to-Use Therapeutic Foods by Jakub Kakietek in Food and Nutrition Bulletin
Footnotes
Acknowledgments
I would like to thank Alistair McGuire and Panos Kanavos from the London School of Economics for discussions and suggestions during the early stages of the development of this manuscript. I would also like to thank UNICEF Supply Division and Africa Region teams, Augustin Flory from the Results for Development Institute, and Saul Guerrero from Action Against Hunger, for discussion and feedback on the various drafts of this manuscript. The findings and conclusions of this report are those of the author and do not necessarily represent the official position of the World Bank or any of the other project agencies.
Declaration of Conflicting Interests
The author(s) declared no potential conflicts of interest with respect to the research, authorship, and/or publication of this article.
Funding
The author(s) received no financial support for the research, authorship, and/or publication of this article.
Supplemental Material
Supplemental material for this article is available online.
Notes
References
Supplementary Material
Please find the following supplemental material available below.
For Open Access articles published under a Creative Commons License, all supplemental material carries the same license as the article it is associated with.
For non-Open Access articles published, all supplemental material carries a non-exclusive license, and permission requests for re-use of supplemental material or any part of supplemental material shall be sent directly to the copyright owner as specified in the copyright notice associated with the article.