
Abstract
Background:
Stunting affects close to 2.4 million children in Uganda, and it is among the major contributors to the annual loss in productivity of the equivalent of US$899 million.
Objective:
This study sought to identify the key underlying causes of the persistently high stunting rates in a region of Uganda known to have low poverty rates and a high agricultural output.
Methods:
A matched case–control study was conducted in Buhweju district, southwest Uganda to compare prior exposures between stunted children (cases) and nonstunted children (controls).
Results:
The sample comprised 56 cases and 112 controls, totaling 168 children aged 6 to 59 months. There were almost equal numbers of boys and girls in the sample. Boys were significantly more likely to be stunted compared to girls (odds ratio [OR]: 2.2, 95% confidence interval [CI]: 1.1-4.2; P < .05). Stunted children were significantly less likely to be introduced to complementary foods at an appropriate age and their primary caregivers lacked knowledge about stunting. The odds of stunting were 2.4 times greater for children in food-insecure households compared to those in food-secure households (OR: 2.4, 95% CI: 1.1-5.0; P < .05) and 4.5 times greater among children who resided in poor quality houses (OR: 4.5, 95% CI: 1.4-13.0; P < .05).
Conclusion:
Low access to appropriate complementary diets, sex of child, food insecurity, poor socioeconomic status, and low knowledge about stunting were the main predictors of childhood stunting in the study population.
Introduction
Stunting, or being too short for one’s age, 1 affects 162 million children aged 6 to 59 months globally, 2 and it is one of the most significant impediments to human and economic development. 3 –5 The prevalence of stunting associated with each of the continents is highest in Africa (40%). East Africa, where 24 million children aged 6 to 59 months are stunted, 4,6 has the highest burden of stunting out of all regions in Africa. Stunting is associated with diminished cognitive and physical development, reduced productivity, and poor health. 3,4 Longitudinal studies of children from various countries have associated stunting with a reduction in schooling, lower household expenditure per capita, and a greater likelihood of living in poverty. 7,8 According to World Bank estimates, a 1% loss in adult height due to childhood stunting is associated with a 1.4% loss in an individual’s economic productivity. 9 It is also estimated that stunted children earn 20% less as adults compared to nonstunted individuals. 10
In Uganda, although nutrition indicators have improved over the years, the rate of change in stunting is slow and the burden of stunting much higher in some regions than in others. Stunting affects close to 2.4 million children in Uganda and it is among the major contributors to the annual loss in productivity of the equivalent of US$899 million. 11 The underlying causes are thought to be inadequate access to improved water and sanitation facilities (defined as access to improved drinking water source and toilet facility, hand-washing, and safe disposal of infants’ feces), inadequate health infrastructure and inadequate access to health care, and food insecurity. 12 A situation analysis of nutrition in Uganda showed that food insecurity has been increasing, sanitation and hygiene have worsened in marginalized areas, social and behavior change communication (SBCC) is not enough to improve caregivers’ nutrition practices, income and wealth disparities are increasing, and poor health infrastructure is undermining nutrition outcomes. 12 Although the proportion of households living below the international extreme poverty line of US$1.90 a day has declined across Uganda from 68% in 1993 to 35% in 2013, the improvements have not been evenly distributed, and income inequality has risen steadily. 12,13
In southwest Uganda, although poverty rates are lowest compared to other regions, and agricultural output is reportedly higher than most regions, the region has a high prevalence of stunting (29%) and second highest child mortality (57 per 1000 live births), according to the national demographic and health survey. 11,14 The prevalence of stunted growth has been decreasing as noted above, but at a very slow pace and current reduction trends may be insufficient to meet the 2025 World Health Assembly (WHA) target for a 40% reduction in the number of children aged 6 to 59 months who had stunting by 2025. 2 Therefore, in order to reduce the number of stunted children in Uganda to less than 1.5 million by 2025 (as set out in the WHA targets), focused investment to identify and address risk factors in regions of the country with the highest burdens of stunting is urgently required. This study sought to identify the key immediate and underlying causes of the persistently high stunting rates in the southwest region of Uganda known to have low poverty rates and a high agricultural output.
Methods
Study Design and Setting
A matched case–control study was conducted in Buhweju district in southwest Uganda between September and October 2016 to compare prior exposures between stunted children (cases) and nonstunted children (controls). Thirty-two villages were randomly selected from the 216 villages in the district using the simple random sampling technique (Figure 1). This study was conducted according to the guidelines laid down in the Declaration of Helsinki, and all procedures involving human patients were approved by the Makerere University School of Health Sciences Research and Ethics Committee and the Uganda National Council for Science and Technology. Written informed consent was obtained from all study participants. The selected villages were briefed on the purpose and objectives of the study before data collection.
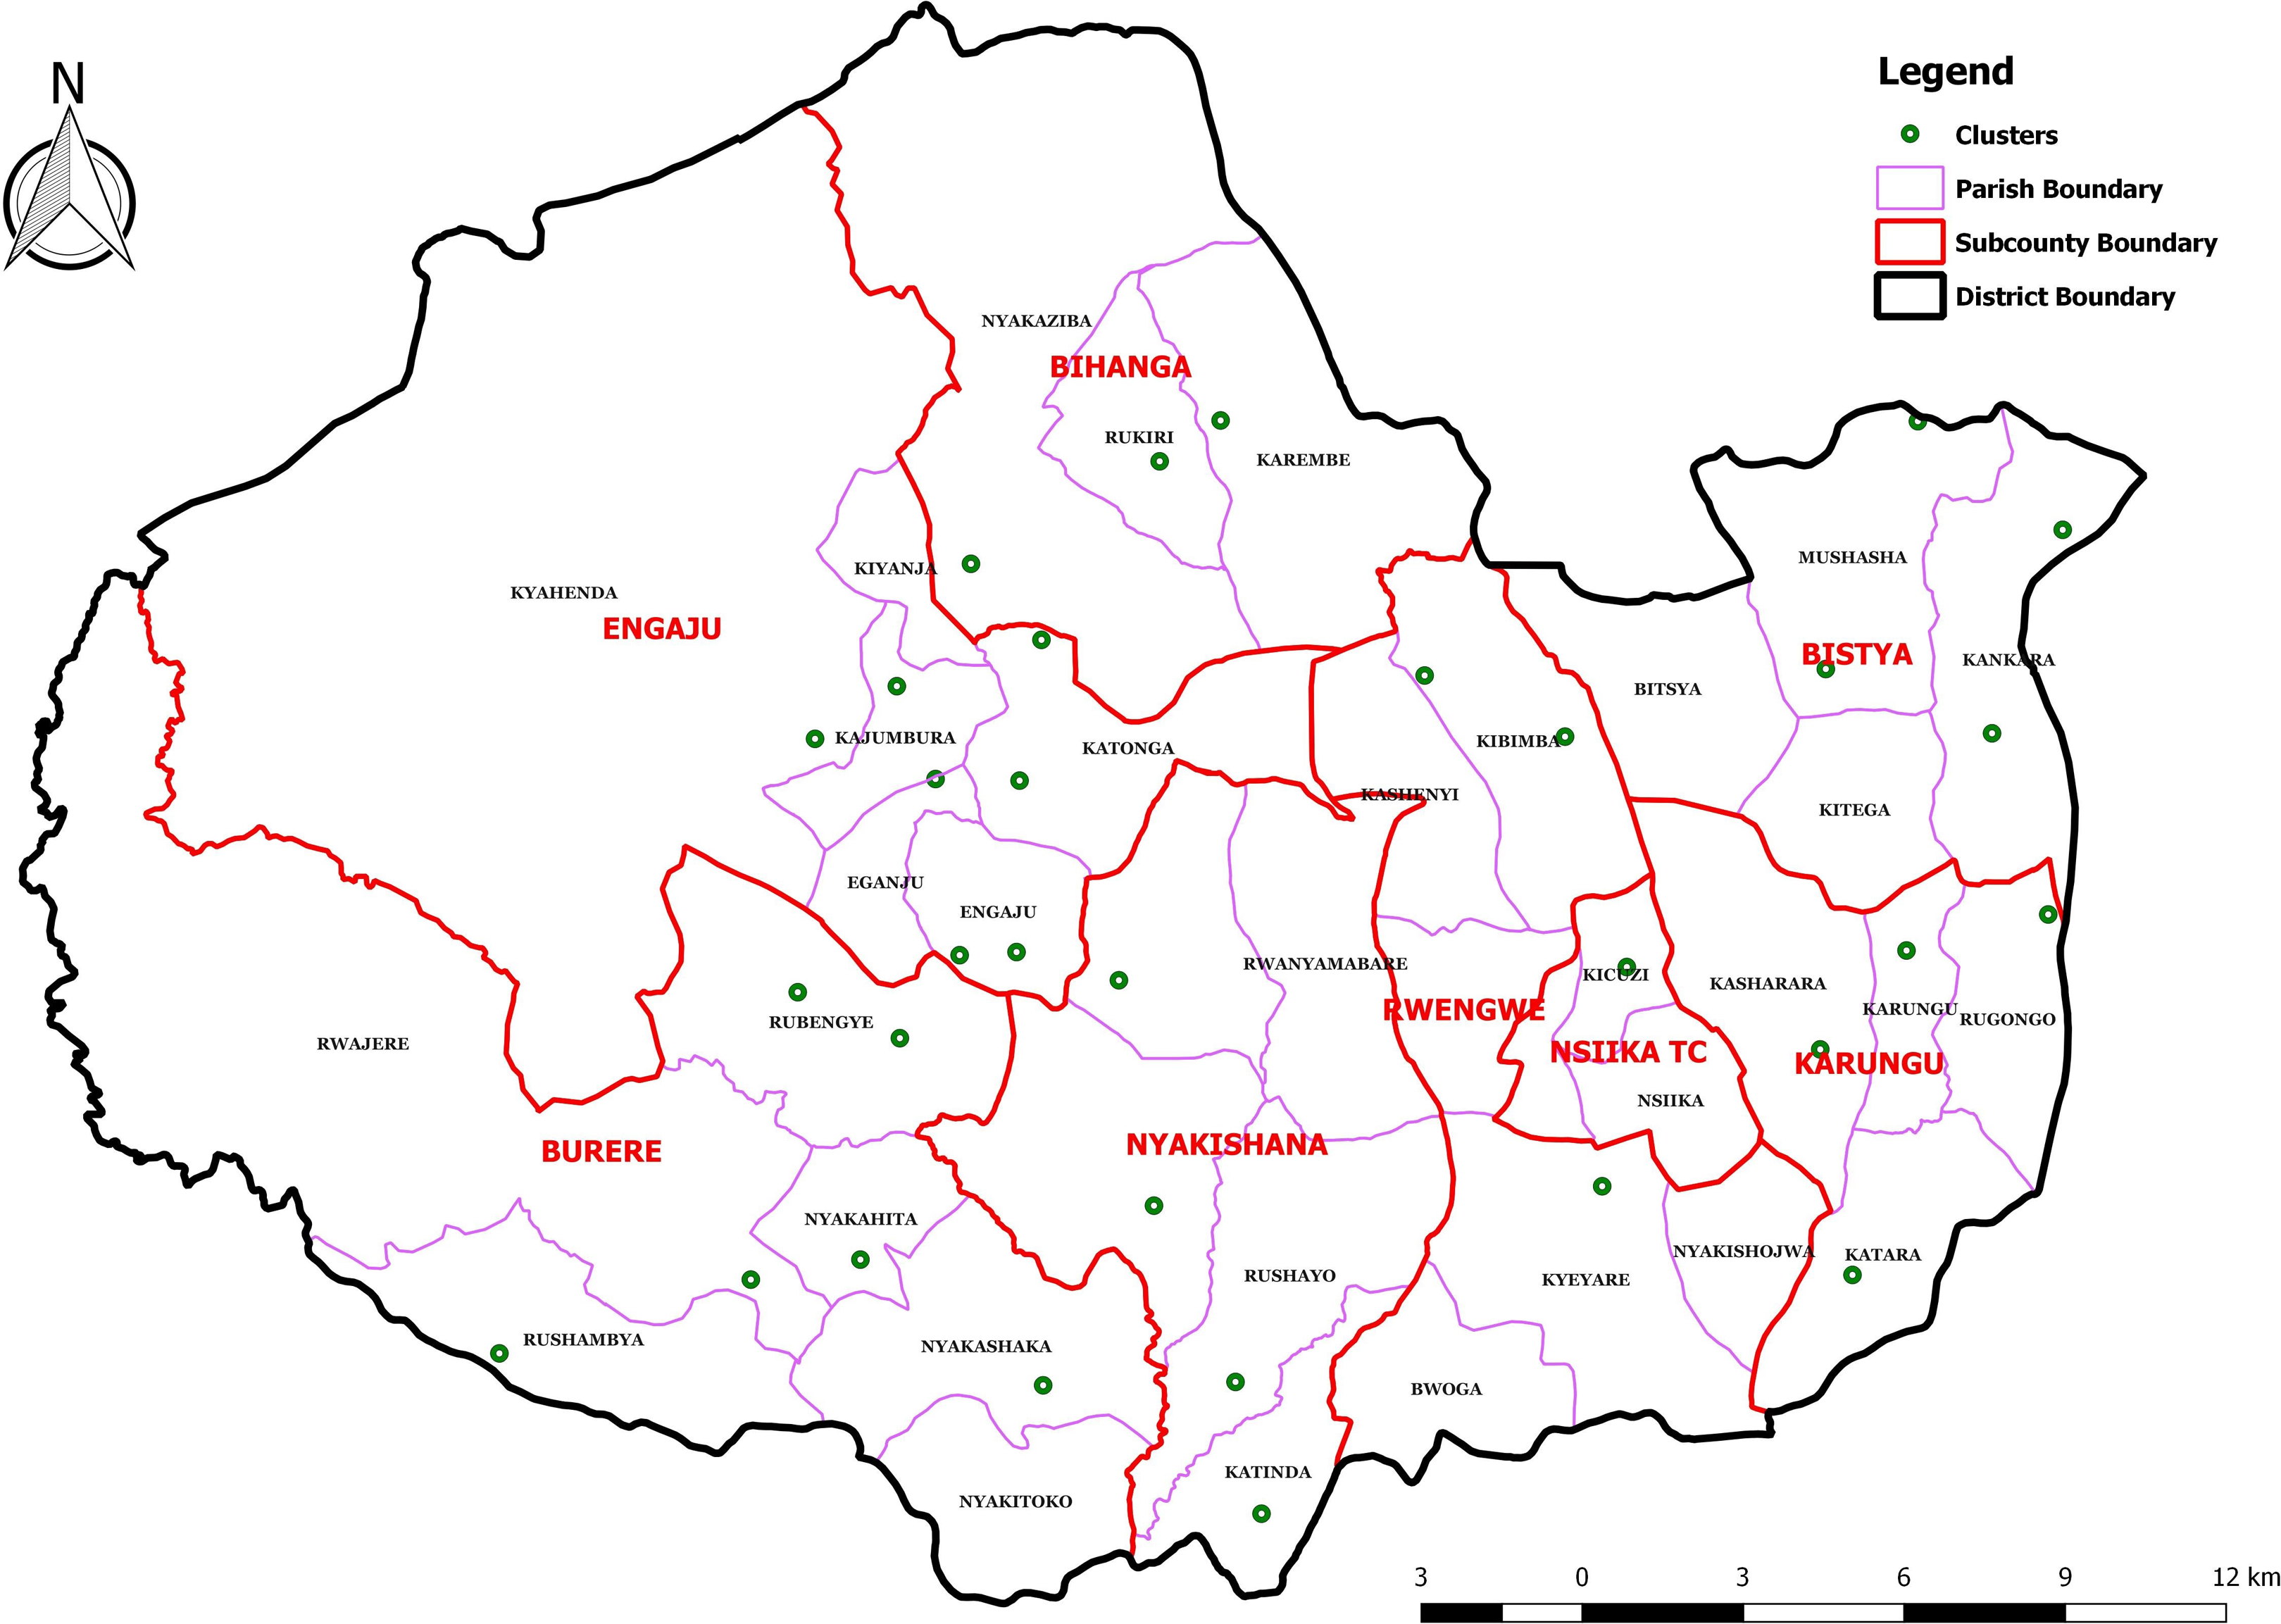
Map of Buhweju district showing villages where the study was conducted.
Study Participants
The study was conducted among children aged 6 to 59 months. In the randomly selected villages, house-to-house screening was conducted to identify cases and controls. Cases were defined as children with stunting (height-for-age z score <−2 z scores). Controls were selected from the cases’ nearby neighbors who were of similar age (ie, within ±3 months) and who were not stunted (height-for-age z score ≥ −2 z scores). If 2 or more eligible controls were found in the same household then 1 of them was selected randomly. Once matched, a structured questionnaire was used to interview the mothers of the selected children about household sociodemographic characteristics, indicators of household food security and socioeconomic status (SES), child health, infant and young child feeding (IYCF) practices, 15 and water, sanitation, and hygiene (WASH) practices.
Sample Size Calculation
The following formula was used to calculate the required sample size:
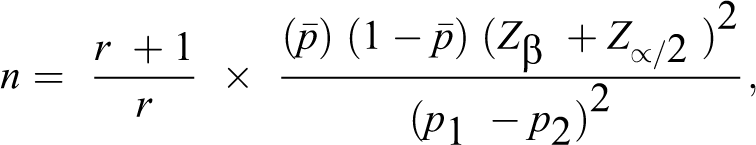
n = sample size of the case group, r = ratio of controls to cases,
Sample size calculation was based on an effect size (odds ratio [OR]) of 4,
16
and the proportion of children aged 6 to 59 months exposed to the risk factor (diarrhea) in the control group was 31%.
17
The proportion of children with reported diarrhea incidence within the previous 2 weeks was used for this study because it is a known risk factor for stunting. The reasonable values of 95% power and 5% significance were used for this study.
16
Data were collected on 56 cases
Infant and Young Child Feeding Practices
Mothers or other primary caregivers were interviewed on breastfeeding practices and then asked to recall all foods and drinks consumed by their child in the course of the previous day. The variables assessed under IYCF comprised past early initiation of breastfeeding, prelacteal feeding, past exclusive breastfeeding, continued breastfeeding, introduction of solid, semisolid or soft foods (introduction of complementary foods), minimum dietary diversity (defined as proportion of children aged 6-59 months who receive foods from 4 or more food groups), minimum meal frequency (defined as 2 times per day for 6- to 8-month-olds, 3 times for 9- to 23-month-olds, and 4 times for 24- to 59-month-olds), and minimum acceptable diet (which is a composite indicator combining both the minimum meal frequency and the minimum dietary diversity). 15
Food Consumption Score
Household food security has 4 key dimensions: availability, access, utilization, and stability. 18,19 The access dimension of food security was used to assess the household food security status of the study population. Food Consumption Score (FCS) is a proxy indicator of food access 17 –19 and therefore was used to measure household food security. A 7-day recall period was used to collect information on consumption of 8 food groups (cereals and tubers, pulses, vegetables, fruits, meat/fish and eggs, milk, sugar, and oil). Weights were assigned to the food groups based on their nutritional density (defined as food group’s quality in terms of caloric density, macro and micro nutrient content, and actual quantities typically eaten). 18,19 The weights were used to calculate each household’s FCS. The households were then classified as having “poor,” “borderline,” or “acceptable” consumption based on their FCSs. Households with an FCS of less than 28 were classified as having poor consumption, those with an FCS of 28 to 42 were classified as having borderline consumption and those with an FCS of greater than 42 were considered to have acceptable consumption. 18,20 Households having “poor” or “borderline” consumption were classified as food insecure.
Socioeconomic Status
A household wealth index adapted from research by Garenne and Hohmann-Garenne, 21 Saaka and Osman, 22 and Jemal et al 23 was used to determine household SES. The household wealth index scores were calculated based on information collected on the education level and occupation of the head of each household, ownership of household assets (such as land, a bicycle, a motorcycle, a car, a television, a radio, a telephone, a refrigerator, poultry, and livestock), and housing quality (floor, walls and roof material, and type of toilet facility). The scores varied from 1 to 12 and households that had a score of below 6 were classified as having low SES, those with a score of 6 to 7 were classified as moderate while those that had a score of 8 and above were classified as having high SES. Households having “low” or “moderate” scores were then classified as being of poor SES.
Statistical Analysis
Data entry, cleaning, and analysis were conducted using Statistical Package for Social Sciences version 21. The variables included in the tests were sex and age of child, birth place of child, IYCF practices, vaccination status, morbidity, education status of the mother, household food security, household SES, and WASH practices. Bivariate analyses were conducted using χ2 statistics to assess the predictors of stunted growth. Crude ORs and 95% confidence intervals (CIs) were calculated for bivariate analyses. Both dependent and independent variables were screened for outliers, and the predictor variables were tested for multicollinearity. To further examine confounding among the predictor variables, changes in β value were assessed when variables were removed from the model. Among continuous variables, correlation matrix was run to test for collinearity. Multiple logistic regression analysis was then conducted to examine associations between risk factors and stunting in the study district. Hosmer and Lemeshow test was applied to test the logistic regression model for goodness of fit. For all statistical tests, P ≤ .05 was considered significant.
Results
Sociodemographic Characteristics
The survey covered 56 cases and 112 controls, totaling 168 children aged 6 to 59 months. There were almost equal numbers of boys and girls in the sample as shown in Table 1. Most of the children were in the 24- to 59-month age group (75%). Among the households surveyed, 11% were female-headed households, the average household size was 5 people, and the major source of income and food was agricultural production (85%). Most of the households had 5 or more members (57%). The majority of the households (82%) surveyed had poor SES (low or moderate SES) and only 18% had high SES. The majority of mothers whose children were stunted did not know that their children had the condition (54%).
Sociodemographic Characteristics.
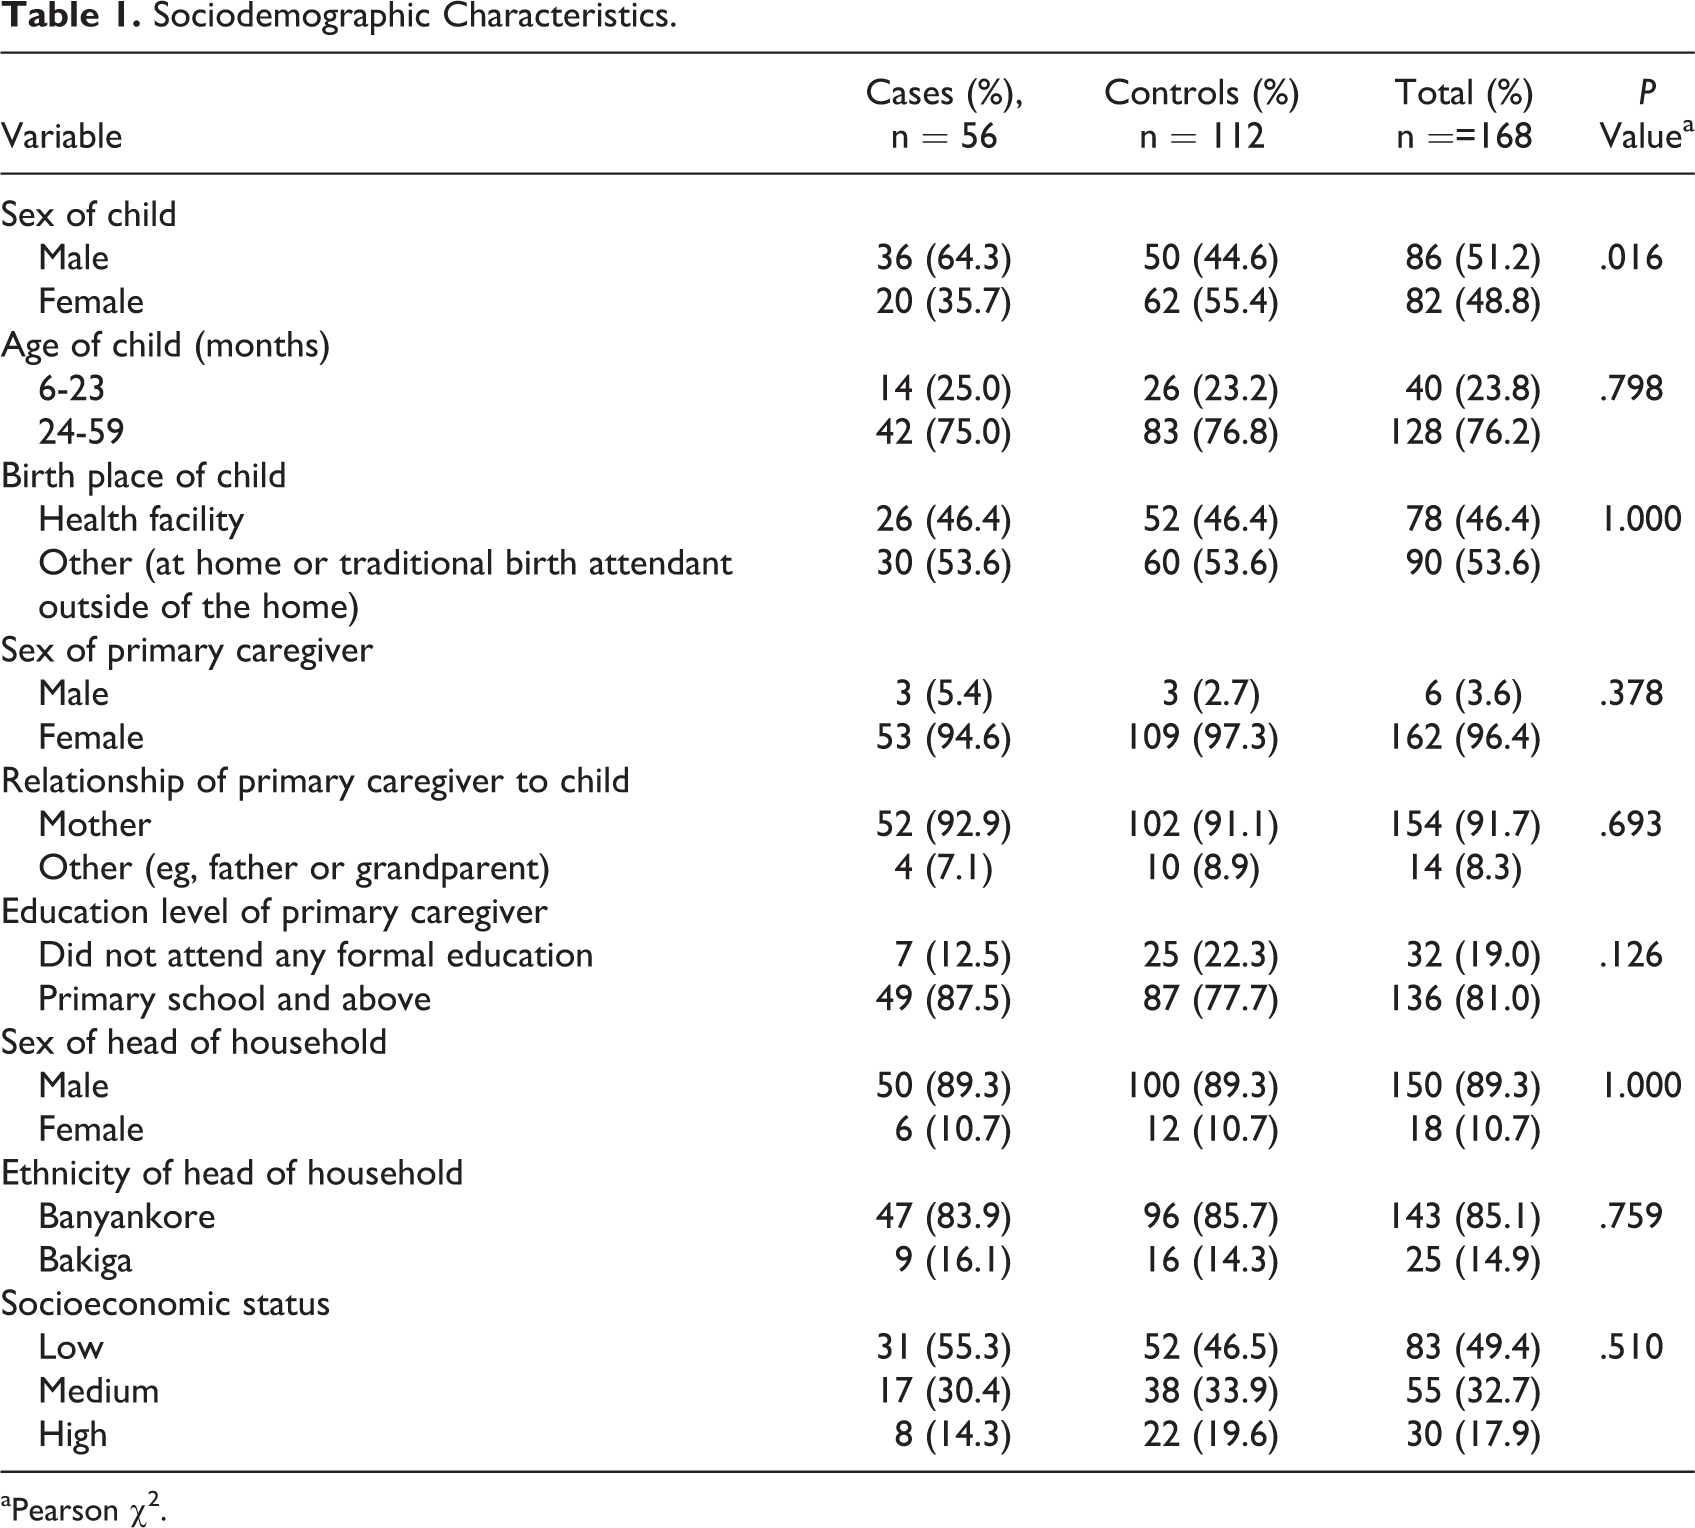
aPearson χ2.
Boys were significantly more likely to be stunted compared to girls (χ2: 5.77; OR: 2.2, 95% CI: 1.1-4.2; P < .05). In multivariate analysis, the odds of stunting were significantly (P < .05) higher among boys compared to girls. The odds of stunting were 1.5 times greater for children from poor SES households (OR: 1.5, 95% CI: 0.6-3.5) compared to those from high SES households, but this was not significant. On the other hand, the odds of stunting were significantly higher (χ2: 4.48; OR: 4.5, 95% CI: 1.4-13.0, P < .05) among children who resided in poor quality houses (a proxy indicator for poor household SES).
IYCF Practices
Most mothers understood that the newborn should be put to the breast immediately or within an hour of birth (80%) and the majority also reported that they initiated breastfeeding within the first hour after birth (79%). However, only 62% of the mothers understood the meaning of exclusive breastfeeding and, only 38% of the sampled children were exclusively breastfed during the first 6 months. In addition, 48% of the mothers reported that they used prelacteals (defined as foods or fluids given to newborns to drink within the first day after birth before the commencement of breastfeeding). The main prelacteal used by mothers was water (85%). The risk of stunting was much higher among children whose mothers used prelacteals (OR: 1.4, 95% CI: 0.7-2.6), but this was not significant.
Mothers who did not exclusively breastfeed their infants reported not having sufficient breast milk as the main reason (74%). Although 85% of the mothers understood that breastfeeding should be continued until age 2 years, 41% said that they breastfed their children for less than 2 years. Mothers who did not practice continued breastfeeding up to 2 years reported that pregnancy, lack of enough breast milk or conflict with work at home and in the garden were the main reasons for discontinuing breastfeeding (43%).
When complementary foods are introduced at the age of 6 months of the child, the food given should be adequate to support growth (quantity and number of meals), have the right consistency, and be of sufficient nutrient and energy density. Although most mothers understood the appropriate age for introduction of complementary foods (84%), only 34% practiced appropriate introduction of complementary foods at 6 months. Only 20% of the children received the minimum number of meals, only 19% of the children received the recommended minimum dietary diversity, and only 4% had the minimum acceptable diet. The consumption of animal-source foods (meat, fish, eggs, and dairy products), fruits, and vegetables was generally very low although the differences between cases and controls were not significant.
Food Consumption Score
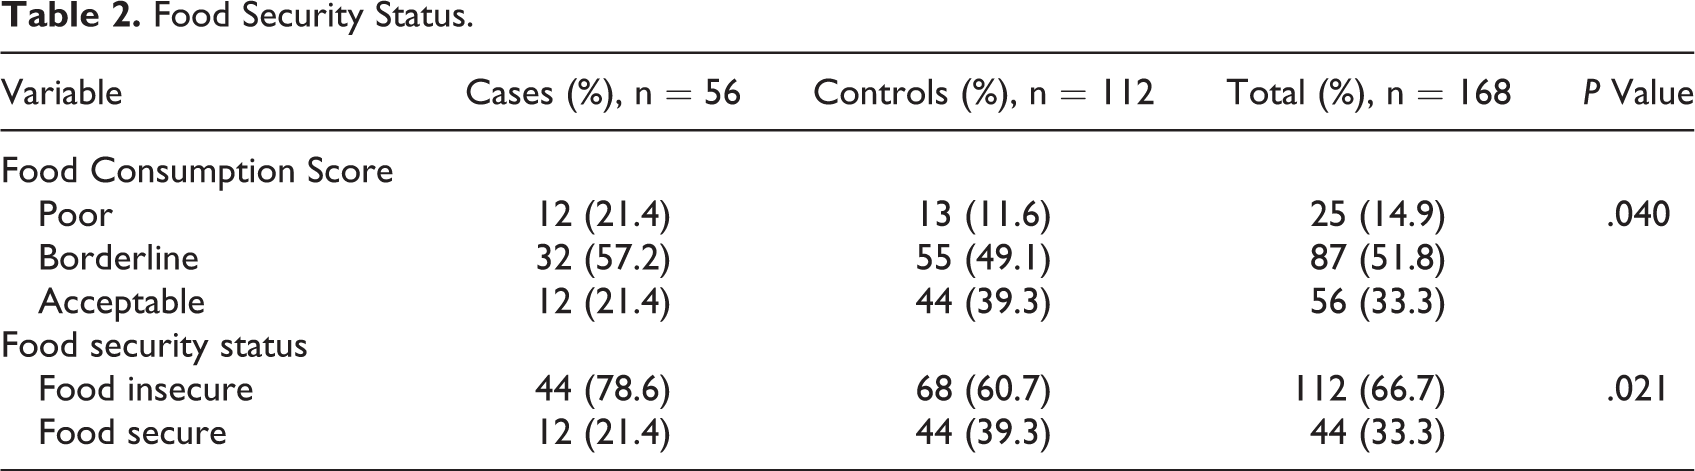
The majority of the households surveyed (67%) were food insecure (had poor or borderline food consumption). Only 33% of the households had acceptable food consumption and therefore were classified as food secure (Table 2). Children from food-insecure households were significantly more likely not to consume the recommended minimum dietary diversity (χ2: 28.56; OR: 9.1, 95% CI: 3.7-22.2; P < .05) or the recommended minimum acceptable diet (χ2: 9.01; OR: 13.3, 95% CI: 1.9-24.1; P < .05). The odds of stunted growth were 2.4 times greater for children in food-insecure households compared to those in food-secure households (χ2: 5.36; OR: 2.4, 95% CI: 1.1-5.0; P < .05). The mean number of food groups consumed per week was only 3 and the proportion of households consuming 4 or more food groups was only 44%. In multivariate analysis, stunting was significantly associated with household food insecurity (Table 3).
Food Security Status.
Risk Factors for Childhood Stunting in Multivariate Analysis.
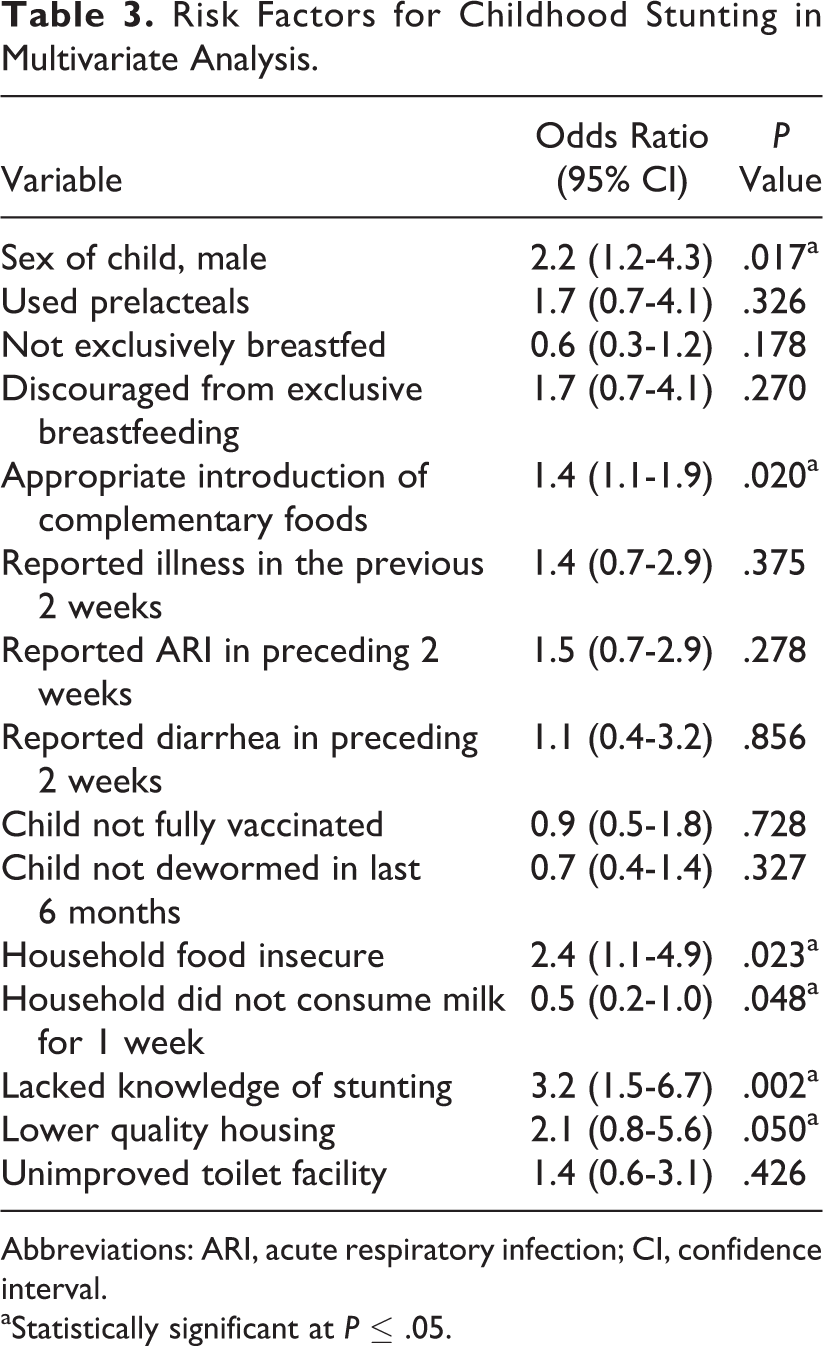
Abbreviations: ARI, acute respiratory infection; CI, confidence interval.
aStatistically significant at P ≤ .05.
Water, Sanitation, and Hygiene Practices
Improved water, sanitation, and hygiene (WASH) facilities are defined as access to an improved drinking-water source (which, by the nature of its construction and when properly used, adequately protects the source from outside contamination), an improved toilet facility (which hygienically separates human excreta from human contact), and a facility for washing one’s hands with soap after using the toilet. Although the majority of the households drank water from improved sources that were therefore assumed to be of suitable quality (60%), most of them (59%) reported that the distance to the water source was more than 30 minutes. The average time it took to collect water from the main drinking water source was approximately 80 minutes.
The majority of households did not have access to an improved toilet facility (78%), although the majority of those with children under 3 safely disposed off the children’s excreta (96%). Similarly, most of the toilets observed did not have a facility for hand washing (76%). Therefore, it is unsurprising that only 38% of the respondents washed their hands after using the toilet. Overall, only 3% of the households had access to improved WASH facilities (ie, improved drinking water sources, toilets, and hand washing facilities). The risk of stunting was 2.0 times greater for children from households without access to improved WASH facilities (OR: 2.0, 95% CI: 0.2-18.7) than for children who did have access, although this difference was not significant.
Morbidity
Parents were asked whether their children had been ill within 2 weeks prior to the survey (self-reported illness in the previous 2 weeks), and it was reported that 10% of the children aged 6 to 59 months had diarrhea, 16% had suspected malaria, and 29% had an acute respiratory infection (ARI). The risk of stunted growth was higher among children who were reportedly ill within 2 weeks prior to the survey (OR: 1.4, 95% CI: 0.7-2.9), especially for those with ARI (OR: 1.5, 95% CI: 0.7-3.0) but less so for those who had diarrhea (OR: 1.1, 95% CI: 0.4-3.2), but the differences were not significant (Figure 2).
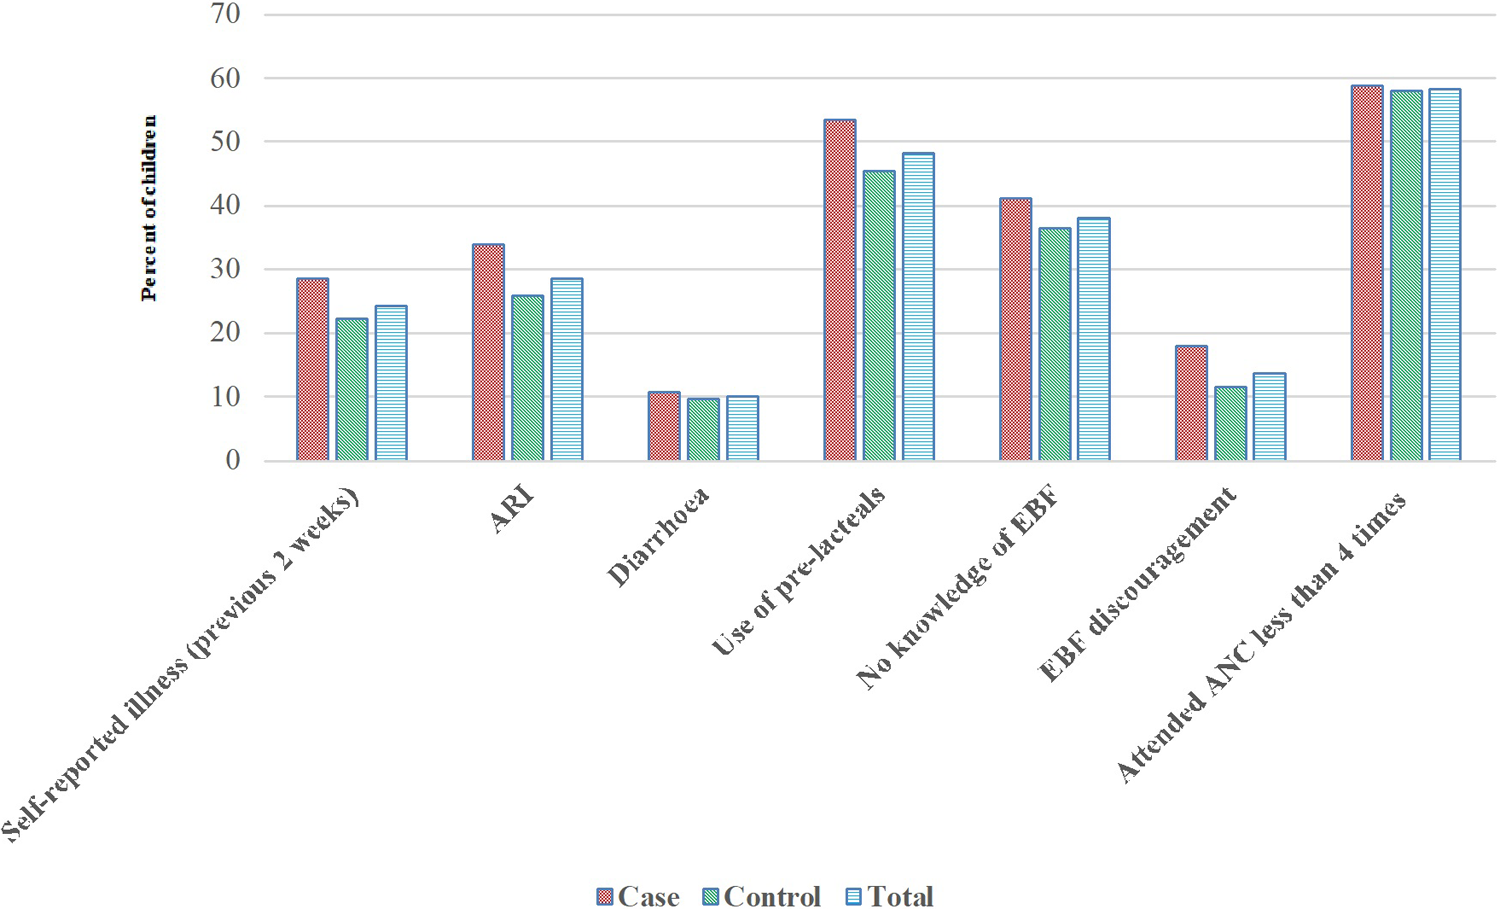
Percentage of children exposed to various risk factors among cases and controls.
Access To Child Survival Interventions
Figures 2 and 3 present the risk factors for childhood stunting in Buhweju district that are related to inequality in access to child survival interventions. Stunted children were less likely to be exclusively breastfed, introduced to complementary foods at an appropriate age, fully vaccinated, received vitamin A supplementation, or dewormed (Table 3). Similarly, households of stunted children were more likely to be food insecure, lack access to quality diets (did not consume milk), poor SES, or had low access to improved sanitation facilities (Table 3). In multivariate analysis, the odds of stunting were also significantly (P < .05) higher among children of primary caregivers who lacked knowledge about childhood stunting.
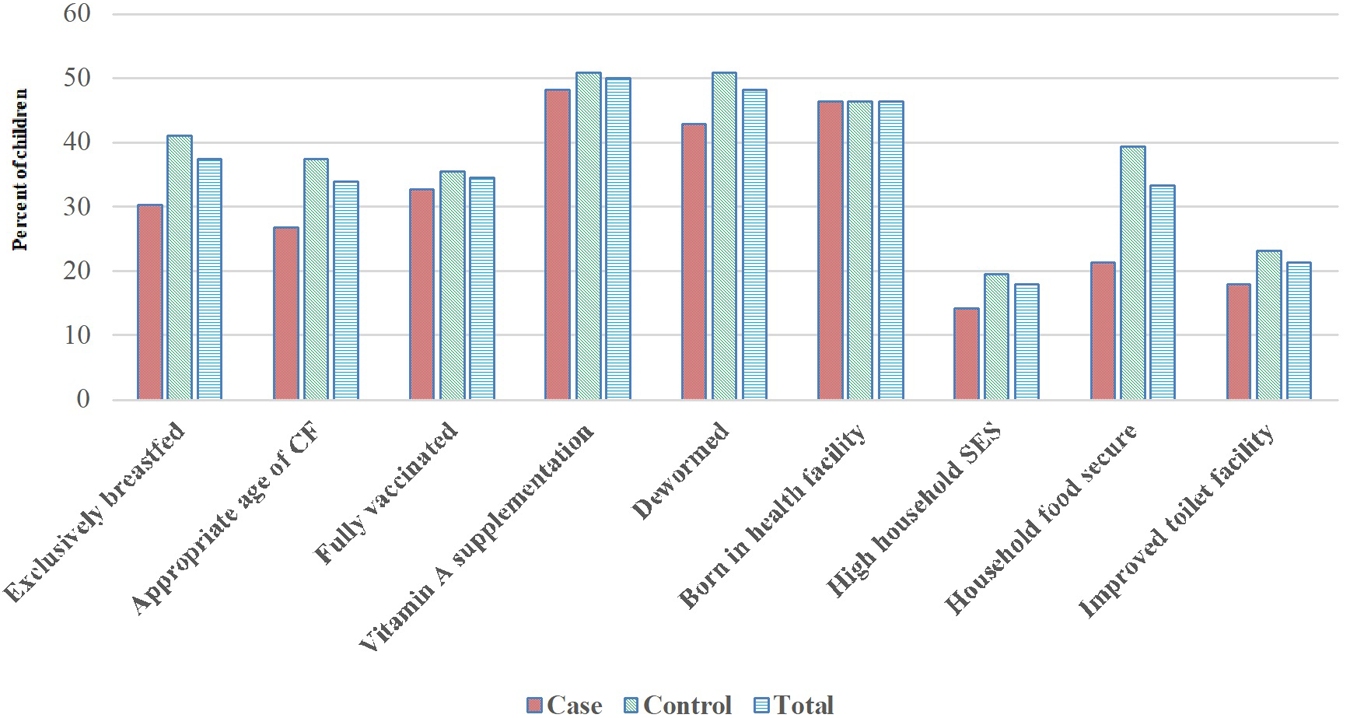
Access to child survival interventions.
Discussion
This study is the first in Uganda to investigate predictors of stunted growth using a case–control design. Addressing stunting is currently a national priority, at least at policy-making level, 24 given the strong global evidence of the negative impacts of stunting on human and economic development. 3 –5 A literature review by Dewey and Begum 4 showed that stunting affects adult height, which, among women, is associated with their reproductive health and consequently the health and survival of their children. Similarly, stunted growth in childhood is linked to reduced economic productivity among men. 4 Childhood stunting is therefore the best overall indicator of children’s well-being and an accurate reflection of social inequalities. 25 Our study findings indicated that stunted children and their households had inequitable access to interventions that address immediate and underlying causes of suboptimum growth compared to nonstunted children. Sex of child was also found to be a strong predictor of stunted growth.
Stunting is largely unrecognized in the study population because short stature is so common that it is considered normal. 25,26 Therefore, it is not surprising that majority of the mothers whose children were stunted did not know that their children had the condition. Stunted growth results from a complex interaction of suboptimal IYCF, infection and other maternal, household, environmental, socioeconomic, and cultural influences. 25,27 In the current study, childhood self-reported illnesses in the previous 2 weeks were most prevalent among stunted children and their mothers had limited knowledge of optimal IYCF practices. Our study provides further evidence that food insecurity is a strong risk factor for stunting. Similar results have been reported in Ethiopia, 23 Ghana, 28 Nepal, 29 and Malaysia. 30 For example, in Ghana, a 1.5% reduction per year in stunting was attributed to investment in agriculture to boost economic growth and reduce poverty, together with the promotion of good IYCF practices in the context of a stable political environment. 28 Furthermore, in Nepal, 51% of children aged 6 to 59 months living in severely food-insecure households were found to be stunted. 29
Although we did not conduct detailed investigation into the causes of sex differences in stunting rates, our findings are consistent with existing literature in sub-Saharan Africa that reported the same trend of the risk being higher among boys compared to girls. This is mostly attributed to preferences in feeding practices and vulnerability to health status determinants. 31,32 In Buhweju district, differential feeding practices may contribute to the higher risk of stunting observed among boys compared to girls. Similar findings have been reported in Mozambique 31 and from a meta-analysis of 16 Demographic and Health Surveys (DHSs) in 10 sub-Saharan Africa countries. 32 The meta-analysis of DHS data from the 10 sub-Saharan countries found that stunting prevalence was 46% among boys, compared to 36% among girls. 32
The specific actions and interventions that can be used to tackle stunting during the main window of opportunity (ie, the preconception period, pregnancy, lactation, and the first 2 years of life) are well-documented. 33 Our study supports the evidence that increased investment in SBCC, food security, and nutrition programs (particularly those involving agricultural production) would significantly contribute to the prevention of stunting in rural areas. The majority of households in our study depended on agriculture as the main source of household income (85%). This is consistent with the review conducted by Ruel and Alderman, 34 in which they reported that agriculture is the main occupation of 80% of low-income individuals in rural areas. Investment in large-scale agricultural programs to improve SES, food security, and nutrition could be implemented relatively easily since majority of the households in our study are dependent on agriculture. These programs would effectively reach low-income households in rural areas, where the prevalence of stunting is greatest. These programs could also be leveraged to serve as delivery platforms for interventions that address the immediate determinants of fetal and child nutrition and development.
The case–control design used in our study may have a number of limitations. The design required respondents to recall prior exposures which could introduce recall bias. 16 Although several factors are known to be strong predictors of stunting based on previous studies conducted in various countries, 23,28 –32,35,36 only few yielded strong association in the current study. However, this type of study design has been used to examine predictors of stunting in several countries, 31,35,36 and all our findings are consistent with those from the existing literature.
Conclusion
Our study revealed that low access to appropriate complementary diets, sex of child, food insecurity, and poor SES were the main predictors of stunting in the study population. Therefore, reductions in the current trends in stunting in Uganda will require the translation of the national health, food security, and nutrition policies into targeted programs in areas with high burdens of stunting. For example, boosting agricultural productivity, which is the major source of income and food in Buhweju district, would significantly contribute to food security, SES, and improve the nutritional quality of the food consumed by children.
Footnotes
Authors’ Note
Bukusuba contributed to conception and design, contributed to acquisition, analysis, and interpretation; drafted the manuscript; critically revised the manuscript; and gave final approval; Kaaya contributed to conception and design, contributed to interpretation, critically revised the manuscript, and gave final approval; Atukwase contributed to conception and design, contributed to analysis and interpretation, critically revised the manuscript, and gave final approval; Bukusuba, Kaaya, and Atukwase agree to be accountable for all aspects of work ensuring integrity and accuracy.
Declaration of Conflicting Interests
The author(s) declared no potential conflicts of interest with respect to the research, authorship, and/or publication of this article.
Funding
The author(s) disclosed receipt of the following financial support for the research, authorship, and/or publication of this article: Supported by a grant from the Nestlé Foundation for the study of problems of nutrition in the world, Lausanne, Switzerland.