
Abstract
Background:
Commonly consumed foods may be nutritionally inadequate. Schoolchildren may be at risk of undernutrition as a result of this.
Objective:
To assess the nutrient and energy values of commonly consumed foods and determine their contributions to the recommended nutrient intakes (RNIs) of schoolchildren (6-15 years).
Methods:
List of commonly consumed foods was obtained through focus group discussions with parents of schoolchildren. Ninety randomly selected schoolchildren were visited at home on 3 consecutive days (2 weekdays and 1 weekend day) during which their portion sizes of these foods were obtained. Aliquots of these foods were collected, wrapped in polyethylene bags, and kept frozen until analysis. The samples were analyzed using standard methods. Percentage contributions of the nutrients to RNI were calculated. Data were analyzed by descriptive statistics.
Results:
Results per 100 g showed that Pentaclethra macrophylla (akpaka) sauce had the highest moisture (76.91%), ash (6.9%), iron (13.51%), and vitamin A (44.0 retinol equivalent [RE]). Steamed bambara groundnut pudding (okpa) had the highest protein (15.08%). Maize + pigeon pea (ayaraya oka) had the highest fat (15.76%). Tomato stew proved superior in carbohydrate (28.15%) and energy (194.6 kcal). Pterocarpus soyauxii (oha) soup contained the highest fiber (4.13%). Yam + pigeon pea (ayaraya ji) had the highest zinc (4.97 mg). Contributions to RNI were protein (5.0%-134.0%), carbohydrate (0.6%-9.9%), energy (4.9%-38.8%), iron (1.5%-168.8%), vitamin A (0.0%-18.7%), and zinc (1.2%-166.0%).
Conclusion:
Most foods did not meet one-third of the schoolchildren’s RNI for vitamin A, zinc, iron, protein, carbohydrate, and energy. Nutrition education on nutrient adequacy is recommended.
Introduction
Undernutrition has often been linked to several factors. Its primary cause is often inadequate nutrient intake, with ignorance and poverty playing significant roles. Schoolchildren are vulnerable to inadequate nutrient intake because most of them skip meals, especially breakfast. It has been reported that 54.4% skipped meals and 41.9% skipped breakfast regularly. 1 In addition, schoolchildren have different forms of diseases/infections that affect their appetite, which in turn affects their nutrient intake. Inadequate treatment of these conditions as a result of poorly implemented primary health care further leads to depletion of micronutrient stores and higher prevalence of undernutrition. Their physical activity level is also high with corresponding high energy expenditure. These coupled with their growth rate have led to a high prevalence of underweight, stunting, wasting/thinness, and micronutrient deficiencies among them.
Several studies 2 -7 have reported the prevalence of underweight, stunting, wasting/thinness, anemia, iron, vitamin A, zinc, and copper deficiencies among schoolchildren. Undernourished schoolchildren are more likely to be absent from school and with low attention span are more likely to have poor academic performances consequent upon poor cognitive development.
There has been noticeable deviation from traditional foods as commonly consumed foods in most developing countries of the world. This is a result of urbanization that has adversely affected school-age children, especially adolescents. Adolescents have the tendency to explore, and food is one of the things most frequently explored. Schoolchildren have numerous food intake challenges such as choice, diversity, availability, quantity, and quality. Adequacy of food intake has often been mistaken for adequate nutrient intake. The amount of food consumed may be enough filling the stomach and giving satiety but most often inadequate in nutrients for an individual’s age, sex, physical activity level, physiologic state, and health status. This is a major cause of undernutrition. Understandably, there are other causes of undernutrition among children, but when food intake and of course nutrient intakes are not adequate, undernutrition is most likely. Continual deprivation worsens the situation with grave danger on physical and cognitive development of children.
Commonly consumed foods in an area are those foods that have high consumption frequencies of more than 3 times a week. People are dependent on these foods as their main meals. Most commonly consumed foods are mainly plant based. Although animal-based protein sources such as meats contribute more protein and several nutrients such as zinc, vitamin B12, phosphorus, and iron, plant-based protein foods, however, can make reasonable contributions to intakes of magnesium, vitamin E, β-carotene, 8 and phytochemicals.
Commonly consumed foods may vary from household to household. Despite this, a food consumption survey will certainly demonstrate the same trend of foods consumed with variant frequencies. People tend to consume what is available, affordable, and has ease of preparation. Availability may affect what is consumed at any given time as well as the quantity of food consumed. Besides, the amount of ingredients (individual foods) such as crayfish and African oil bean added to foods during preparation also affects their nutritional quality.
Some studies and food composition tables have reported the nutrient compositions of some commonly consumed foods, but none to our knowledge have evaluated the contributions made by these foods (as consumed) to nutrient intakes of schoolchildren. It is therefore important that these foods, which form the main meals frequently consumed in an area, be evaluated to provide data that would enhance nutrition education (for mothers and children) and diet counseling and provide basis for planning school lunch and income-generating activities for women and young persons.
Materials and Methods
Definition of Terms
Commonly consumed foods are cooked ready-to-eat foods with consumption frequency of 3 or more times weekly. They serve as main meals (breakfast, lunch, and supper).
Jollof is a term used to describe 1 or 2 foods cooked together in which the ingredients and main food are cooked together in a pot. This term is mainly applied to rice and rice and beans.
Soup is the food made by boiling solid ingredients in liquid until the flavors are extracted, forming a broth. The broth is usually thickened with soup thickeners and eaten with foods commonly called fufu. Fufu is solid food made from fermented cassava; garri (fried form of cassava); yam; cocoyam; and maize, rice, and wheat flours.
Stew and sauce are made the same way as soup but without thickeners. The ingredients may be fried in oil. They are eaten with staple foods (potato, yam, cocoyam, rice, plantain) that are cooked plain with or without salt.
Dish is the ready-to-eat food that can be consumed on its own without a complement, for example, okpa and igbangwu.
Meal is a dish consumed at certain established time of the day. There are 3 meals a day (breakfast, lunch, and supper; the heaviest is called dinner). However, in-between meals are allowed for children and other vulnerable persons such as pregnant mothers and convalescents.
Foods are cooked ready-to-eat dishes or individual foods.
Soups, sauce, and stew are not normally consumed by themselves but with staples.
Area of Study
Ede-Oballa is a typical rural Igbo community in Enugu North Senatorial Zone of Enugu State, Nigeria. The inhabitants are predominantly farmers who specialize in the production of typical Nsukka (yellow) pepper, some species of yam, cassava, palm oil, cocoyam, maize, and vegetables. Their staple foods include rice (Oryza sativa), yam (Dioscorea spp), cassava (Manihot esculenta), cocoyam (Colocasia spp), pigeon pea, and cowpea (Vigna unguiculata) of various species. It has a total of 10 (7 primary and 3 secondary) schools.
Data Collection Methods
This study took place between May and August. List of commonly consumed foods was obtained through focus group discussions with mothers/guardians/caregivers of the schoolchildren in all 10 schools in Ede-Oballa. Each focus group was made up of 8 to 10 persons. At each school, 2 focus groups were formed. Convenient days and time were selected for the discussions. The discussions focused on list of foods commonly consumed, the ingredients used in their preparation, and methods of preparation. Foods (single foods or composite dishes) were regarded as commonly consumed if they were consumed 3 times or more weekly. These are cooked ready-to-consume foods.
The sample size was determined by a single population proportion formula. A subsample of 20% (90) was used for this study. Sample size for each of the 10 schools was determined by stratified proportionate sampling to ensure adequate representation. Age and sex formed the strata. Selection of 90 schoolchildren in whose homes the study was conducted was achieved through simple random sampling (by balloting without replacement). The sample size comprised 40 secondary and 50 primary schoolchildren: 41 males and 49 females.
The nature of the study was explained to the parents of the children and their willingness to participate in the study solicited. Informed consent was obtained from each of the parents of the children who were selected for the study. Those who declined were replaced by the same sampling method, and in all 90 homes were enlisted in the study. These homes were visited on 3 consecutive days (2 weekdays and 1 weekend day) to obtain the food portion sizes for the respective commonly consumed foods identified. Mean portion size for same food was used in statistical analysis in cases where the food was consumed 2 or more times during the period of the study. The participants were informed to obtain small samples of the commonly consumed foods whenever foods were consumed outside the homes. Portion sizes of foods consumed outside the homes were obtained by estimation using household measures. Party foods were excluded as they may not reflect usual food intake.
Aliquots (20 g) of each of the commonly consumed foods were collected from each of the households visited on the 3 days as many times as it was consumed as a meal. In all, 748 samples of identified commonly consumed foods were obtained from the 90 homes visited and these were analyzed chemically. The samples were wrapped in labeled polyethylene bags and kept frozen until analyzed. Prior to analyses, the individual food samples were allowed to thaw to room temperature and then homogenized. Official methods of the Association of Analytical Chemists (AOAC) 9 were used to determine the triplicate values for proximate composition (moisture, crude protein, ash, crude fiber, and crude fat) of the respective foods. Carbohydrate was determined by difference. Iron, zinc, and β-carotene in the samples were determined by the methods described by AOAC. 9
Nutrient values for rice, cassava, and yam were obtained from West African food composition table. 10 Atwater conversion factors 11 were used to determine the energy value of the foods. Nutrient/energy intakes were calculated by simple proportions.

The contributions made by the foods to the recommended nutrient intakes (RNIs) of the schoolchildren were calculated. Calculations were also based on simple proportions.

The foods consumed at meal (breakfast, lunch, and supper) time are supposed to contribute at least a third to daily RNI of an individual. In judging the percentage contributions made by the foods, a third of the daily RNI was used. Results were presented with respect to mean portion sizes of the different age groups of the children.
Statistical Analysis
Means ± standard deviations were statistical tools used. Analysis of variance was used to analyse data on portion sizes and Duncan’s New Multiple range test was used to group and compare means of age groups. T-test was also used to compare values of portion sizes between sexes. Significance was accepted at P < .05.
Results
Table 1 shows the local, common, and scientific names and major ingredients of commonly consumed foods. Sixteen foods were identified. These were achicha (cocoyam + pigeon pea), akpaka (African oil bean seed) sauce, ohoyi (dikanut) soup, oha (Pterocarpus soyauxii) soup, ayaraya ji (yam + pigeon pea), onugbu (bitter leaf) soup, ofe (tomato) stew, igbangwu (maize meal), egusi (melon seed) soup, ayaraya oka (maize + pigeon pea), okpa (steamed bambara groundnut pudding), osikapa na agwa (jollof rice and beans), agworoagwo osikapa (jollof rice), ji (yam), akpu (cassava fufu), and osikapa ocha (white rice).
Commonly Consumed Foods: Common and Scientific Names and Major Ingredients.a
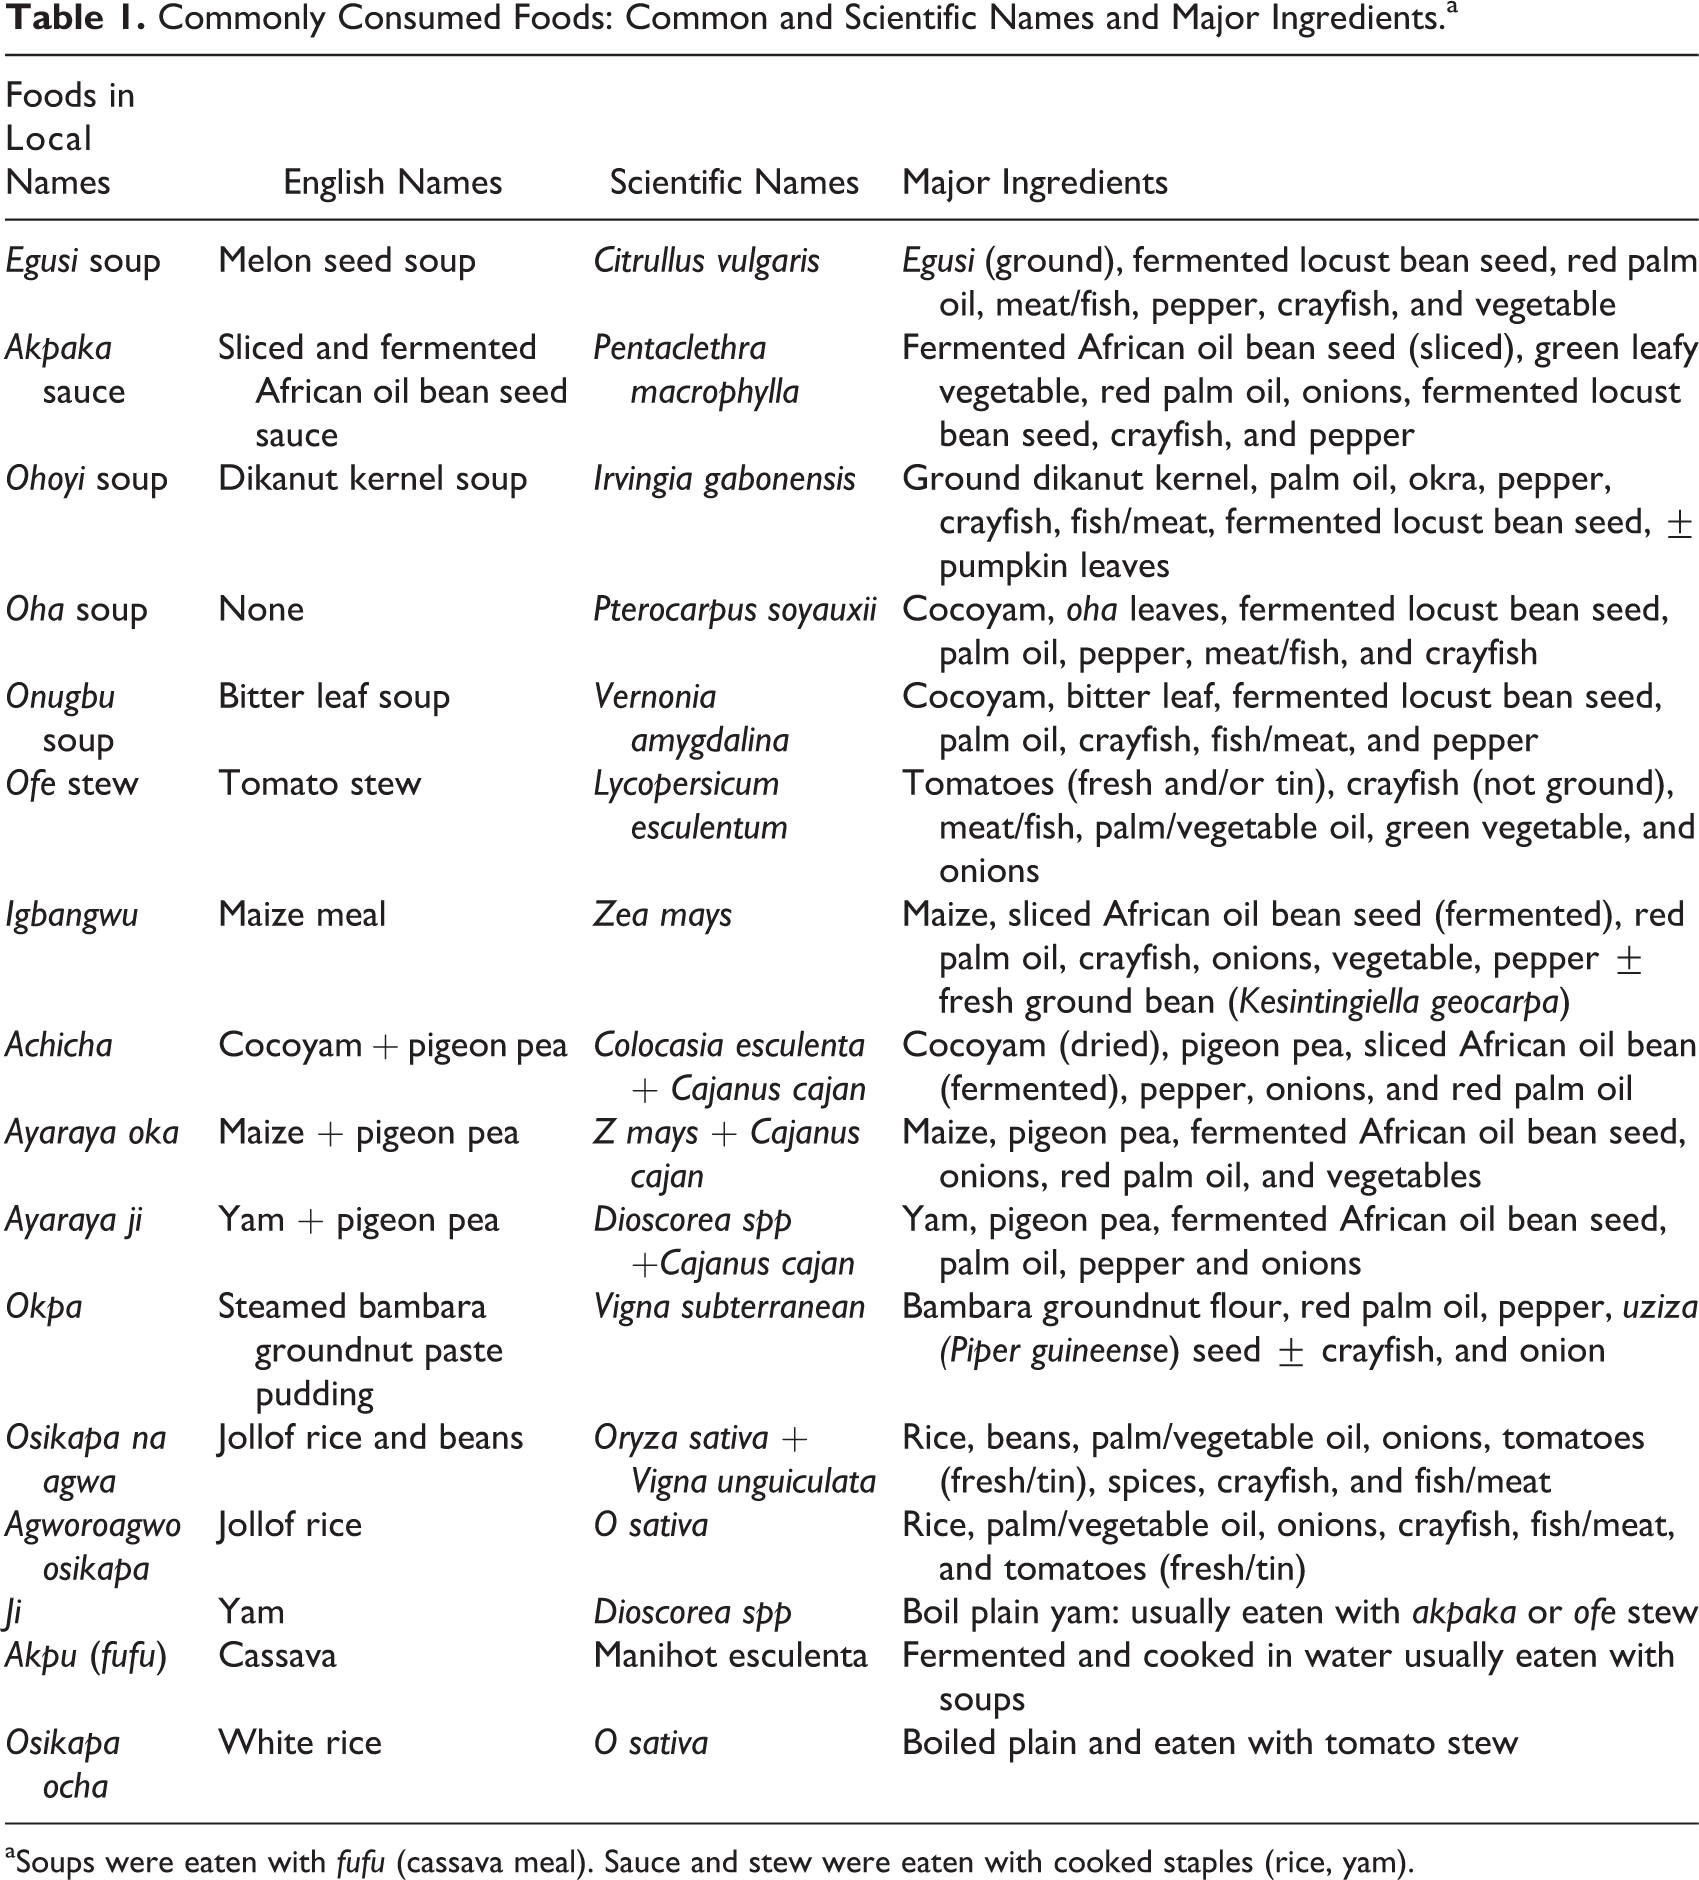
aSoups were eaten with fufu (cassava meal). Sauce and stew were eaten with cooked staples (rice, yam).
Table 2 shows the mean portion sizes of the foods consumed by the schoolchildren according to their age groups and gender. The differences in the mean portion sizes for male and female schoolchildren were significant for okpa (P < .05), bitter leaf soup (P < .01), and yam (P < .001), with the difference in yam being the strongest. The age-group means of portion sizes of foods commonly consumed by the schoolchildren differed significantly (P < .01), except group mean values of portion sizes of oha (P soyauxii) soup, ayaraya ji (yam + pigeon pea), rice, and egusi (melon) soup, which had no significant (P > .05) relationship with age of the schoolchildren.
Mean Portion Sizes of the Commonly Consumed Foods.a
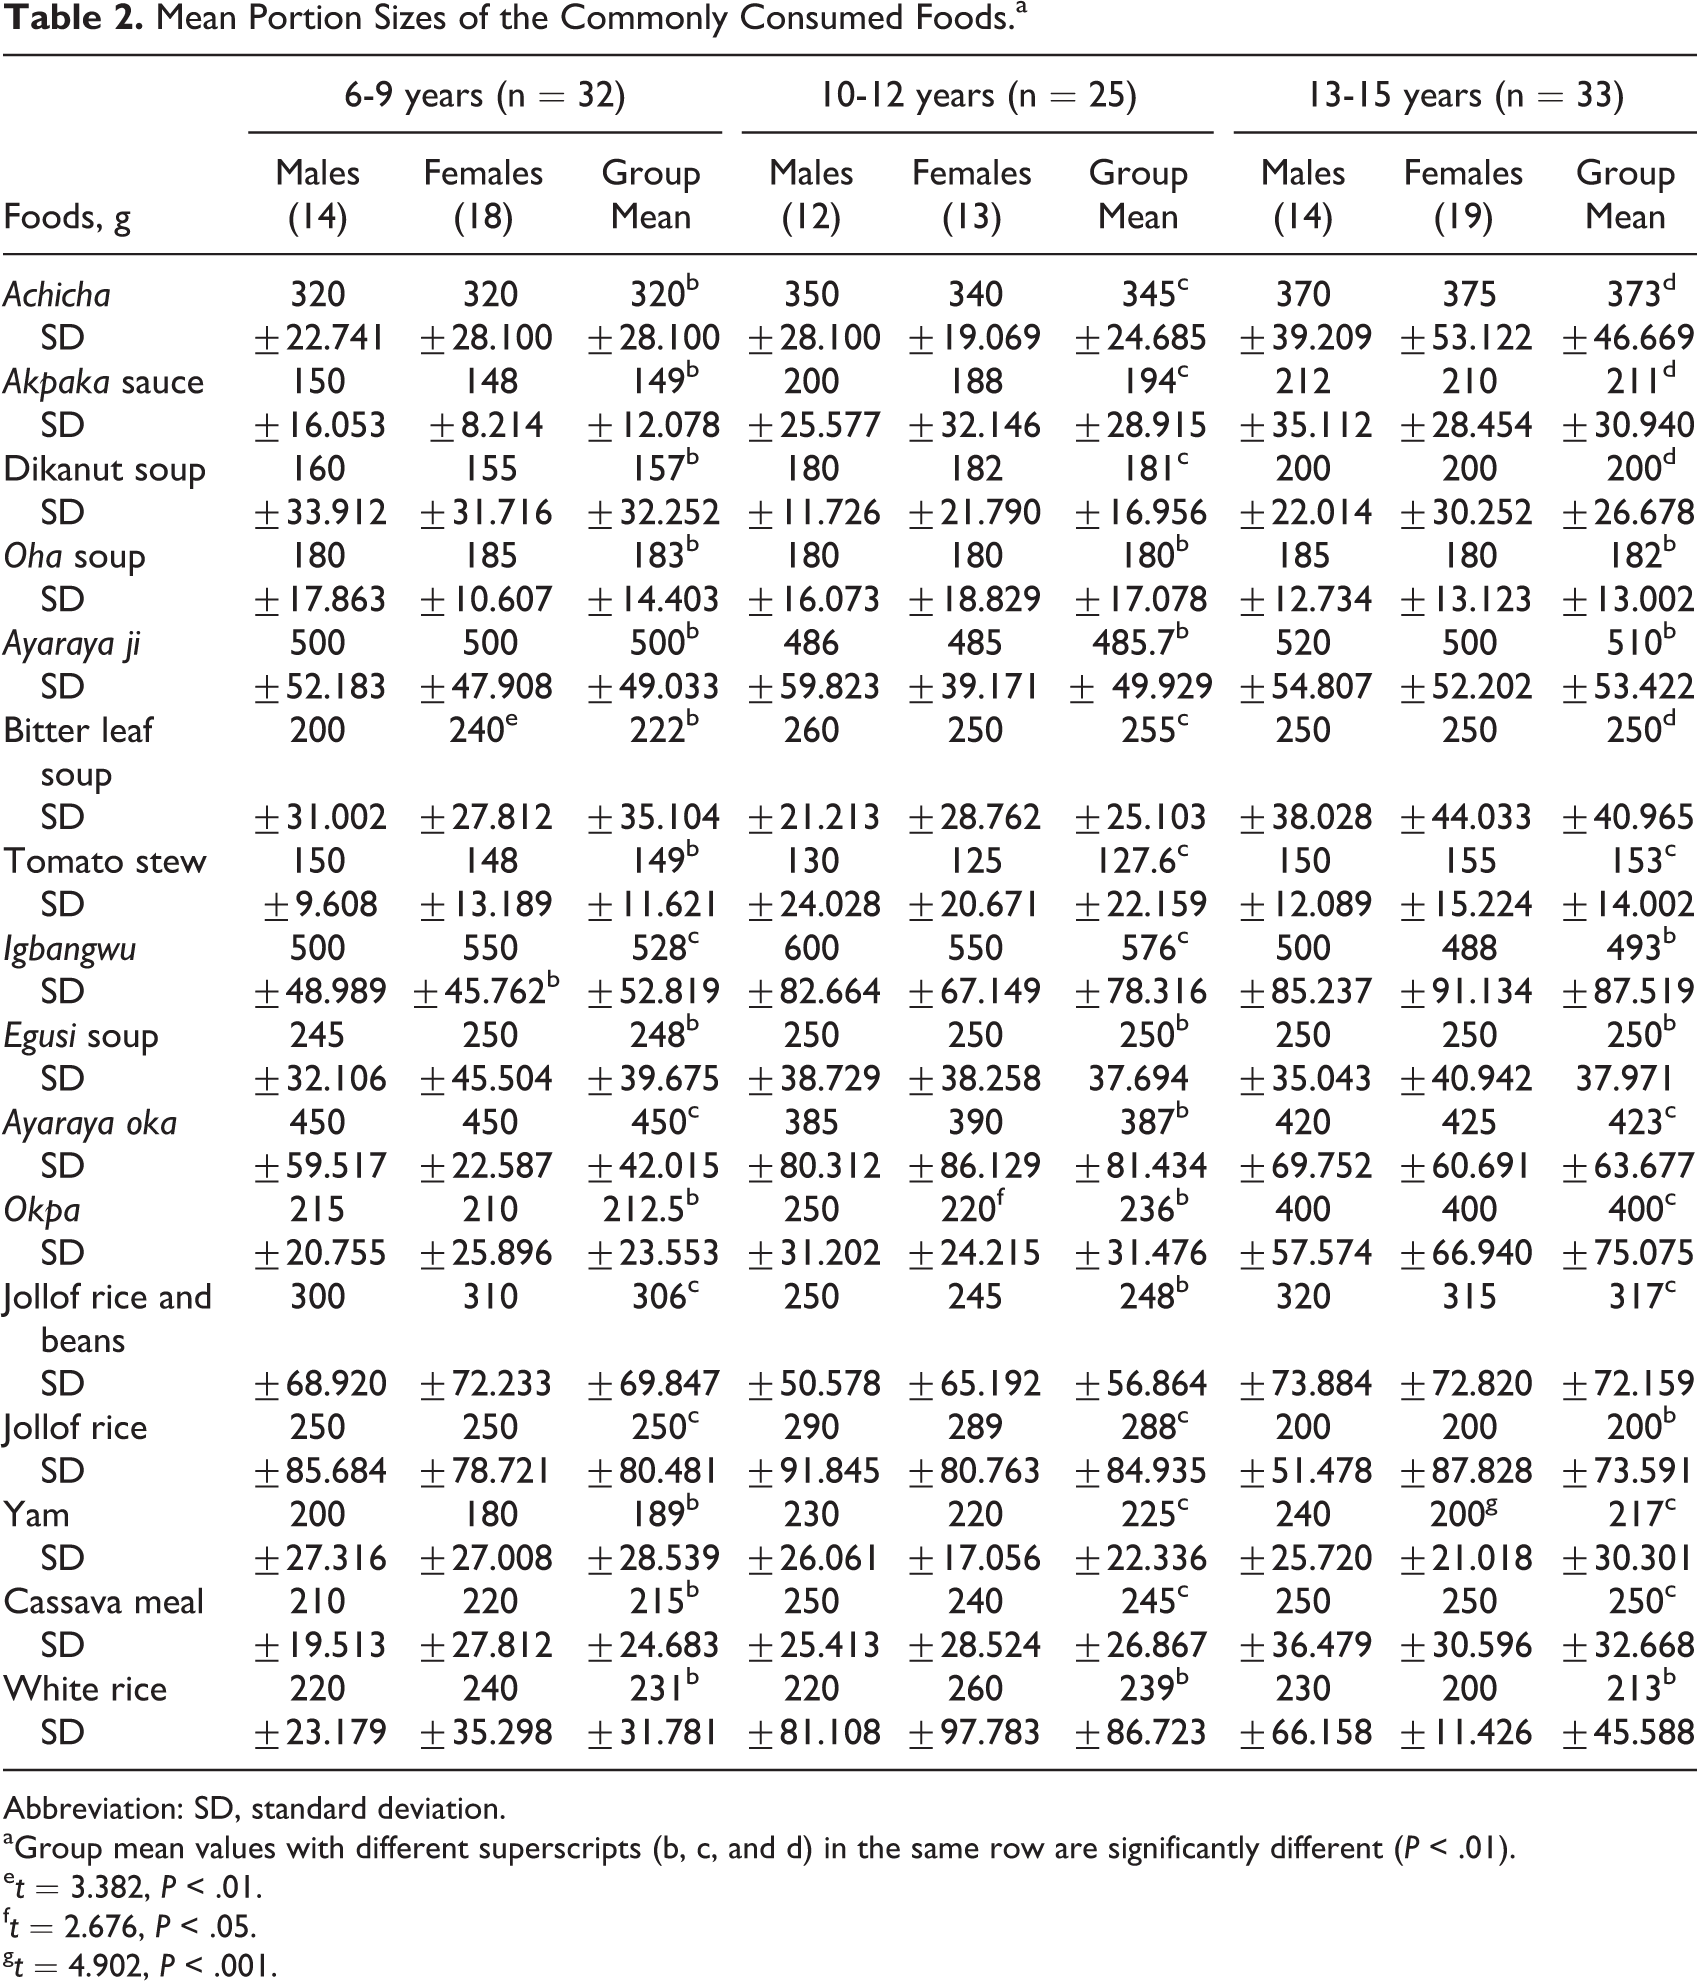
Abbreviation: SD, standard deviation.
aGroup mean values with different superscripts (b, c, and d) in the same row are significantly different (P < .01).
e t = 3.382, P < .01.
f t = 2.676, P < .05.
g t = 4.902, P < .001.
Table 3 illustrates proximate composition and energy value of commonly consumed foods per 100 g. Protein ranged from 1.2% in cassava to 15.08% in okpa (steamed bambara groundnut pudding); ash ranged from 0.3% in white rice to 6.9% in akpaka (African oil bean seed) sauce; fat ranged from 0.2% in yam and white rice, each to 15.76% in ayaraya oka (maize + pigeon pea); fiber ranged from 0.2% in okpa to 4.13% in oha (P soyauxii) soup; and carbohydrate ranged from 4.79% in ayaraya oka (maize + pigeon pea) to 37.4% in cassava. Energy value ranged from 71.8 Kcal in akpaka sauce to 194.6 kcal in tomato stew.
Proximate Composition and Energy Value of Commonly Consumed Foods per 100 g.
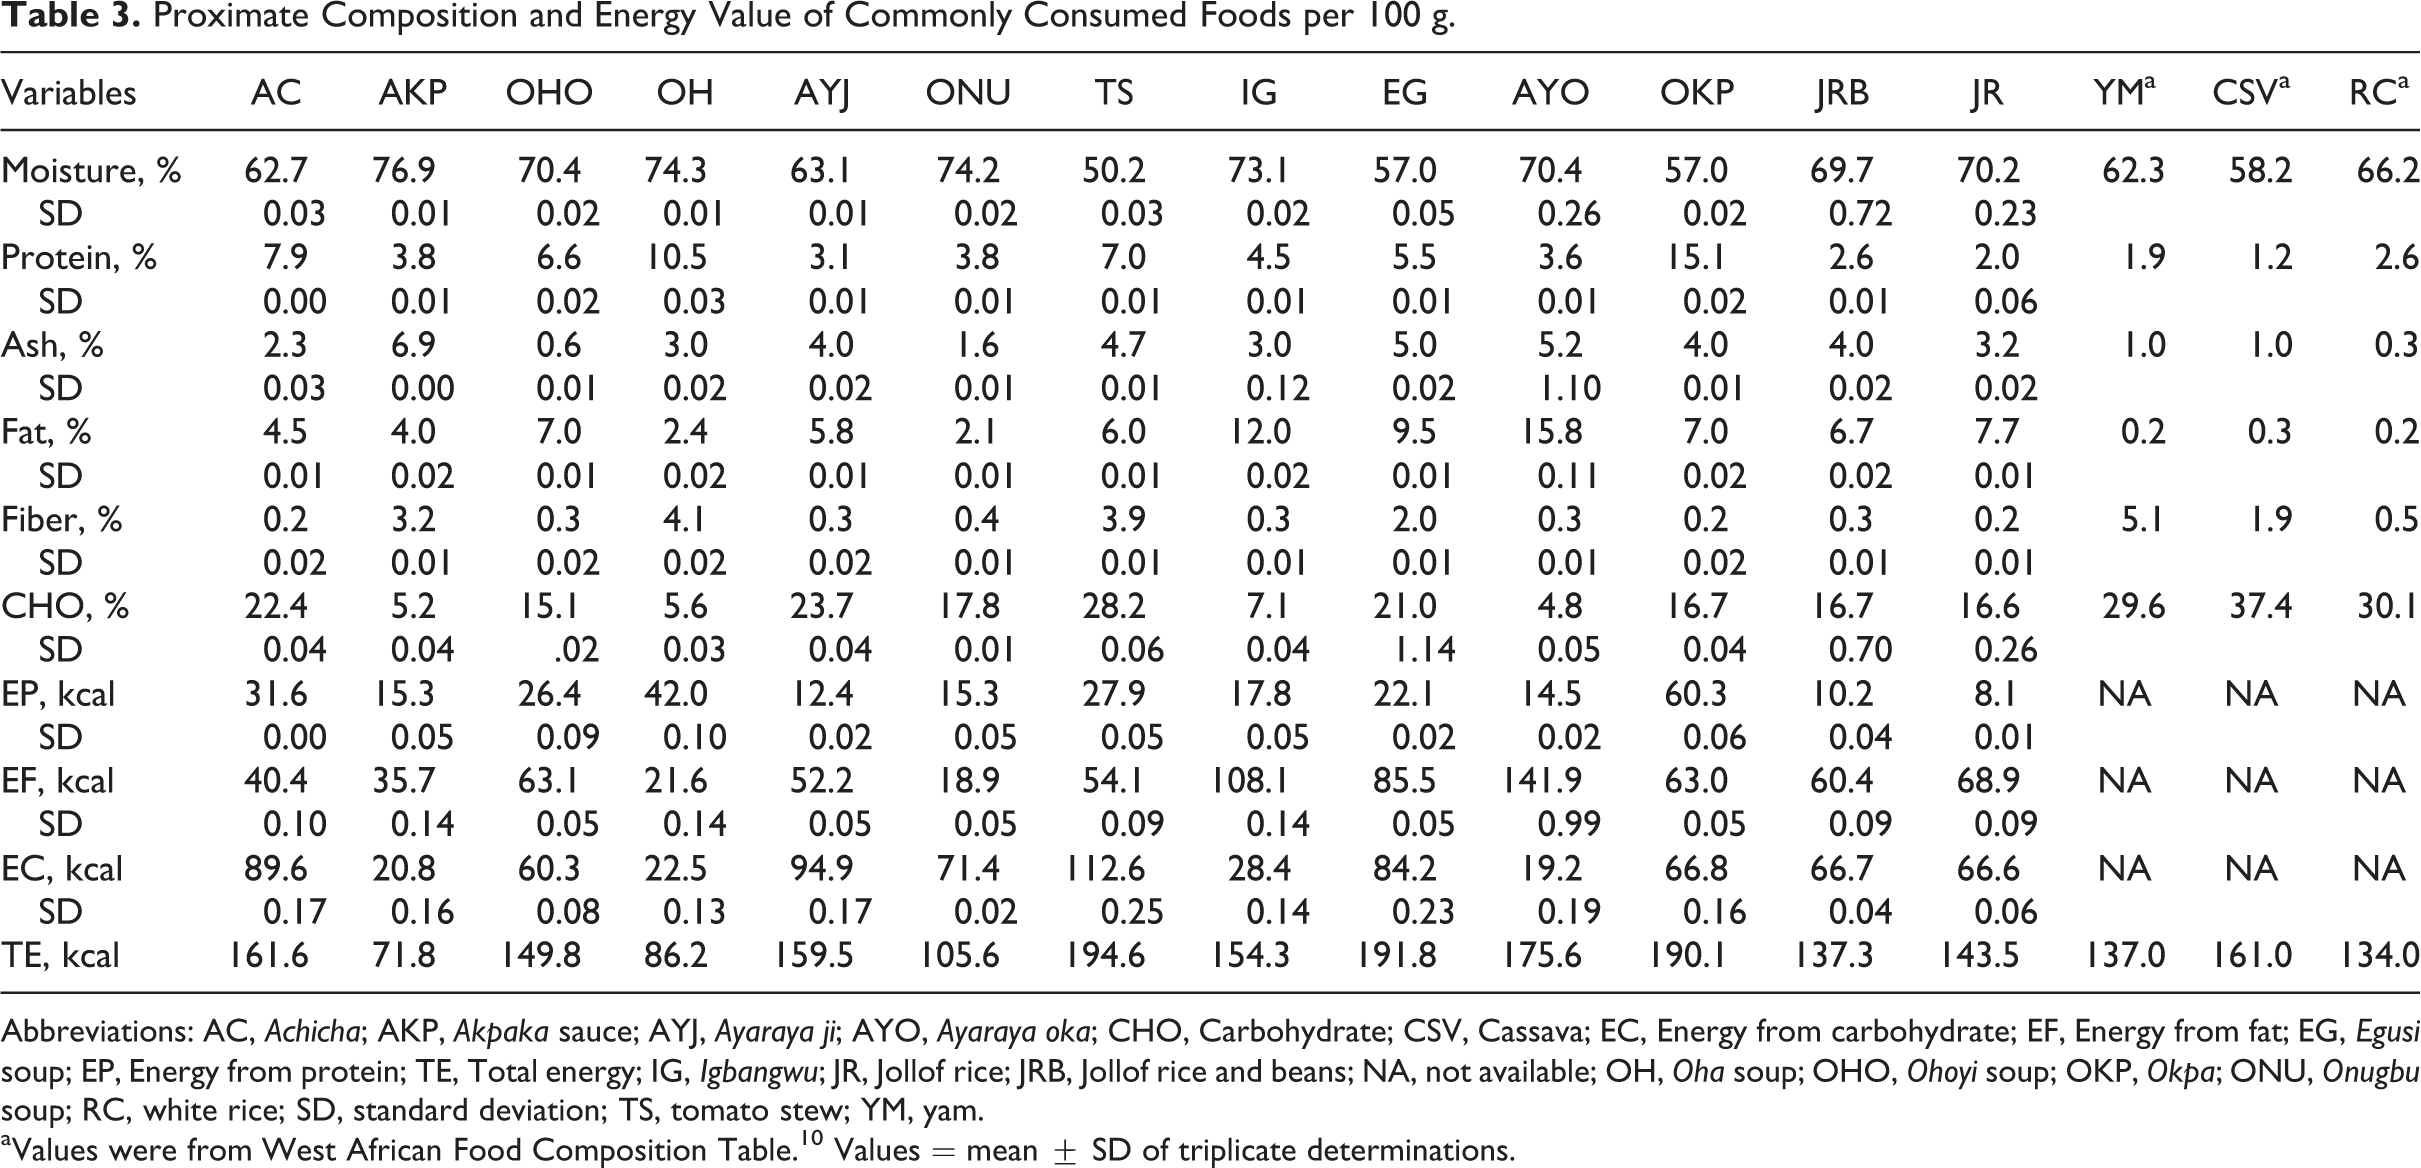
Abbreviations: AC, Achicha; AKP, Akpaka sauce; AYJ, Ayaraya ji; AYO, Ayaraya oka; CHO, Carbohydrate; CSV, Cassava; EC, Energy from carbohydrate; EF, Energy from fat; EG, Egusi soup; EP, Energy from protein; TE, Total energy; IG, Igbangwu; JR, Jollof rice; JRB, Jollof rice and beans; NA, not available; OH, Oha soup; OHO, Ohoyi soup; OKP, Okpa; ONU, Onugbu soup; RC, white rice; SD, standard deviation; TS, tomato stew; YM, yam.
aValues were from West African Food Composition Table. 10 Values = mean ± SD of triplicate determinations.
Table 4 shows the micronutrient composition of commonly consumed foods per 100 g. Oha (P soyauxii) had the least iron (0.23 mg) and zinc (0.17 mg) values. The highest iron and zinc values were found in akpaka (African oil bean seed) sauce (13.51 mg) and ayaraya ji (yam + pigeon pea; 4.97 mg), respectively. Dikanut soup had the lowest vitamin A (2.97 retinol equivalent [RE]), while the highest value of 44.0 RE was found in akpaka (African oil bean seed) sauce. White rice had none (0.0 RE).
Micronutrient Composition of Commonly Consumed Foods per 100 g.
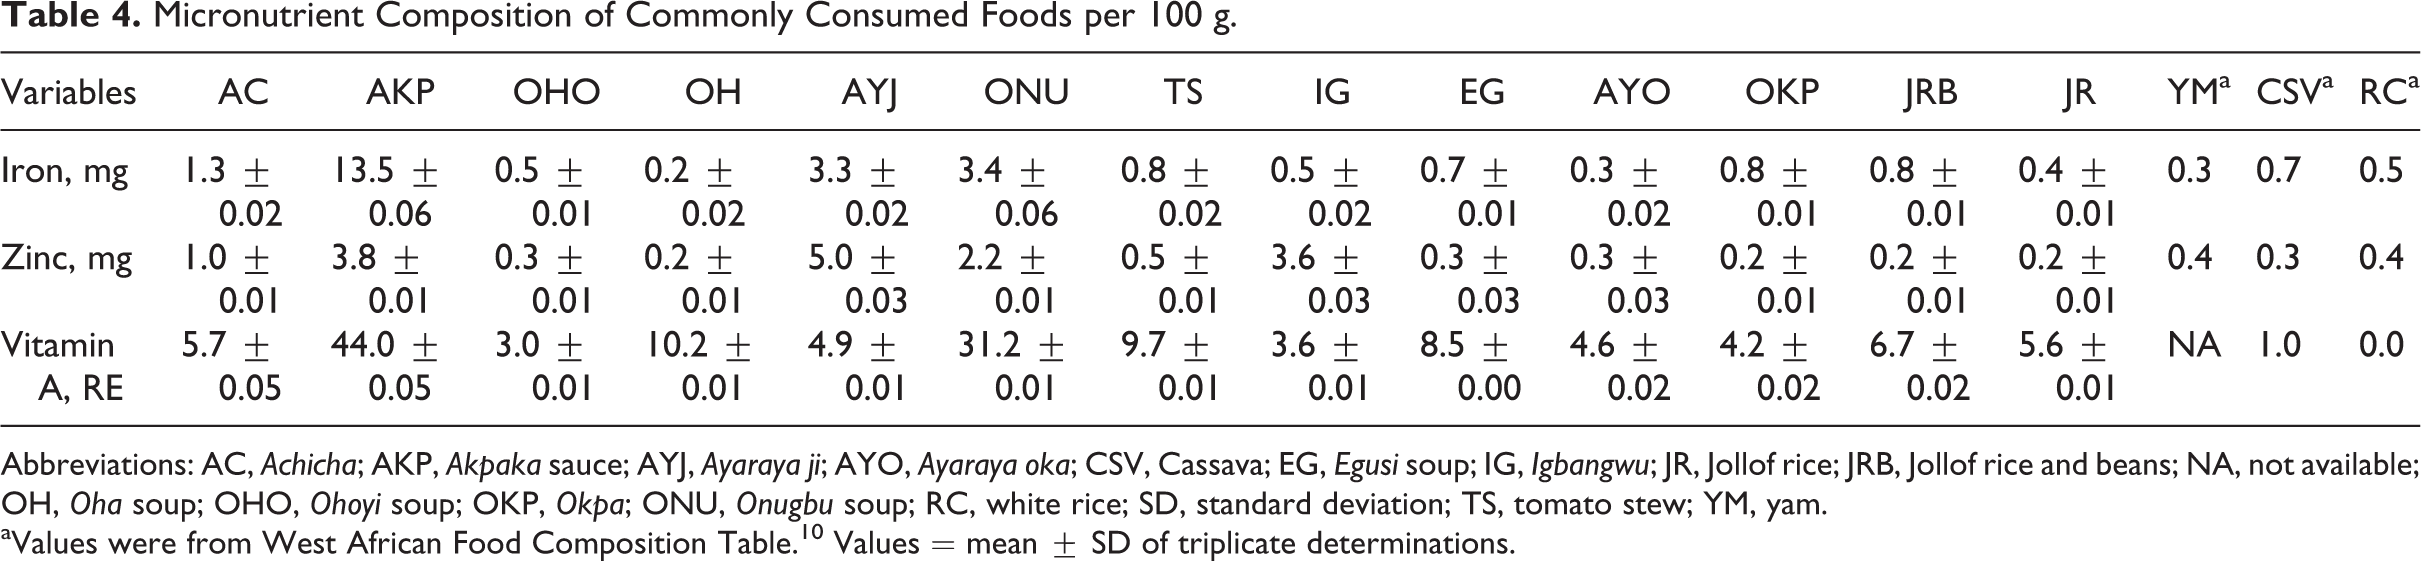
Abbreviations: AC, Achicha; AKP, Akpaka sauce; AYJ, Ayaraya ji; AYO, Ayaraya oka; CSV, Cassava; EG, Egusi soup; IG, Igbangwu; JR, Jollof rice; JRB, Jollof rice and beans; NA, not available; OH, Oha soup; OHO, Ohoyi soup; OKP, Okpa; ONU, Onugbu soup; RC, white rice; SD, standard deviation; TS, tomato stew; YM, yam.
aValues were from West African Food Composition Table. 10 Values = mean ± SD of triplicate determinations.
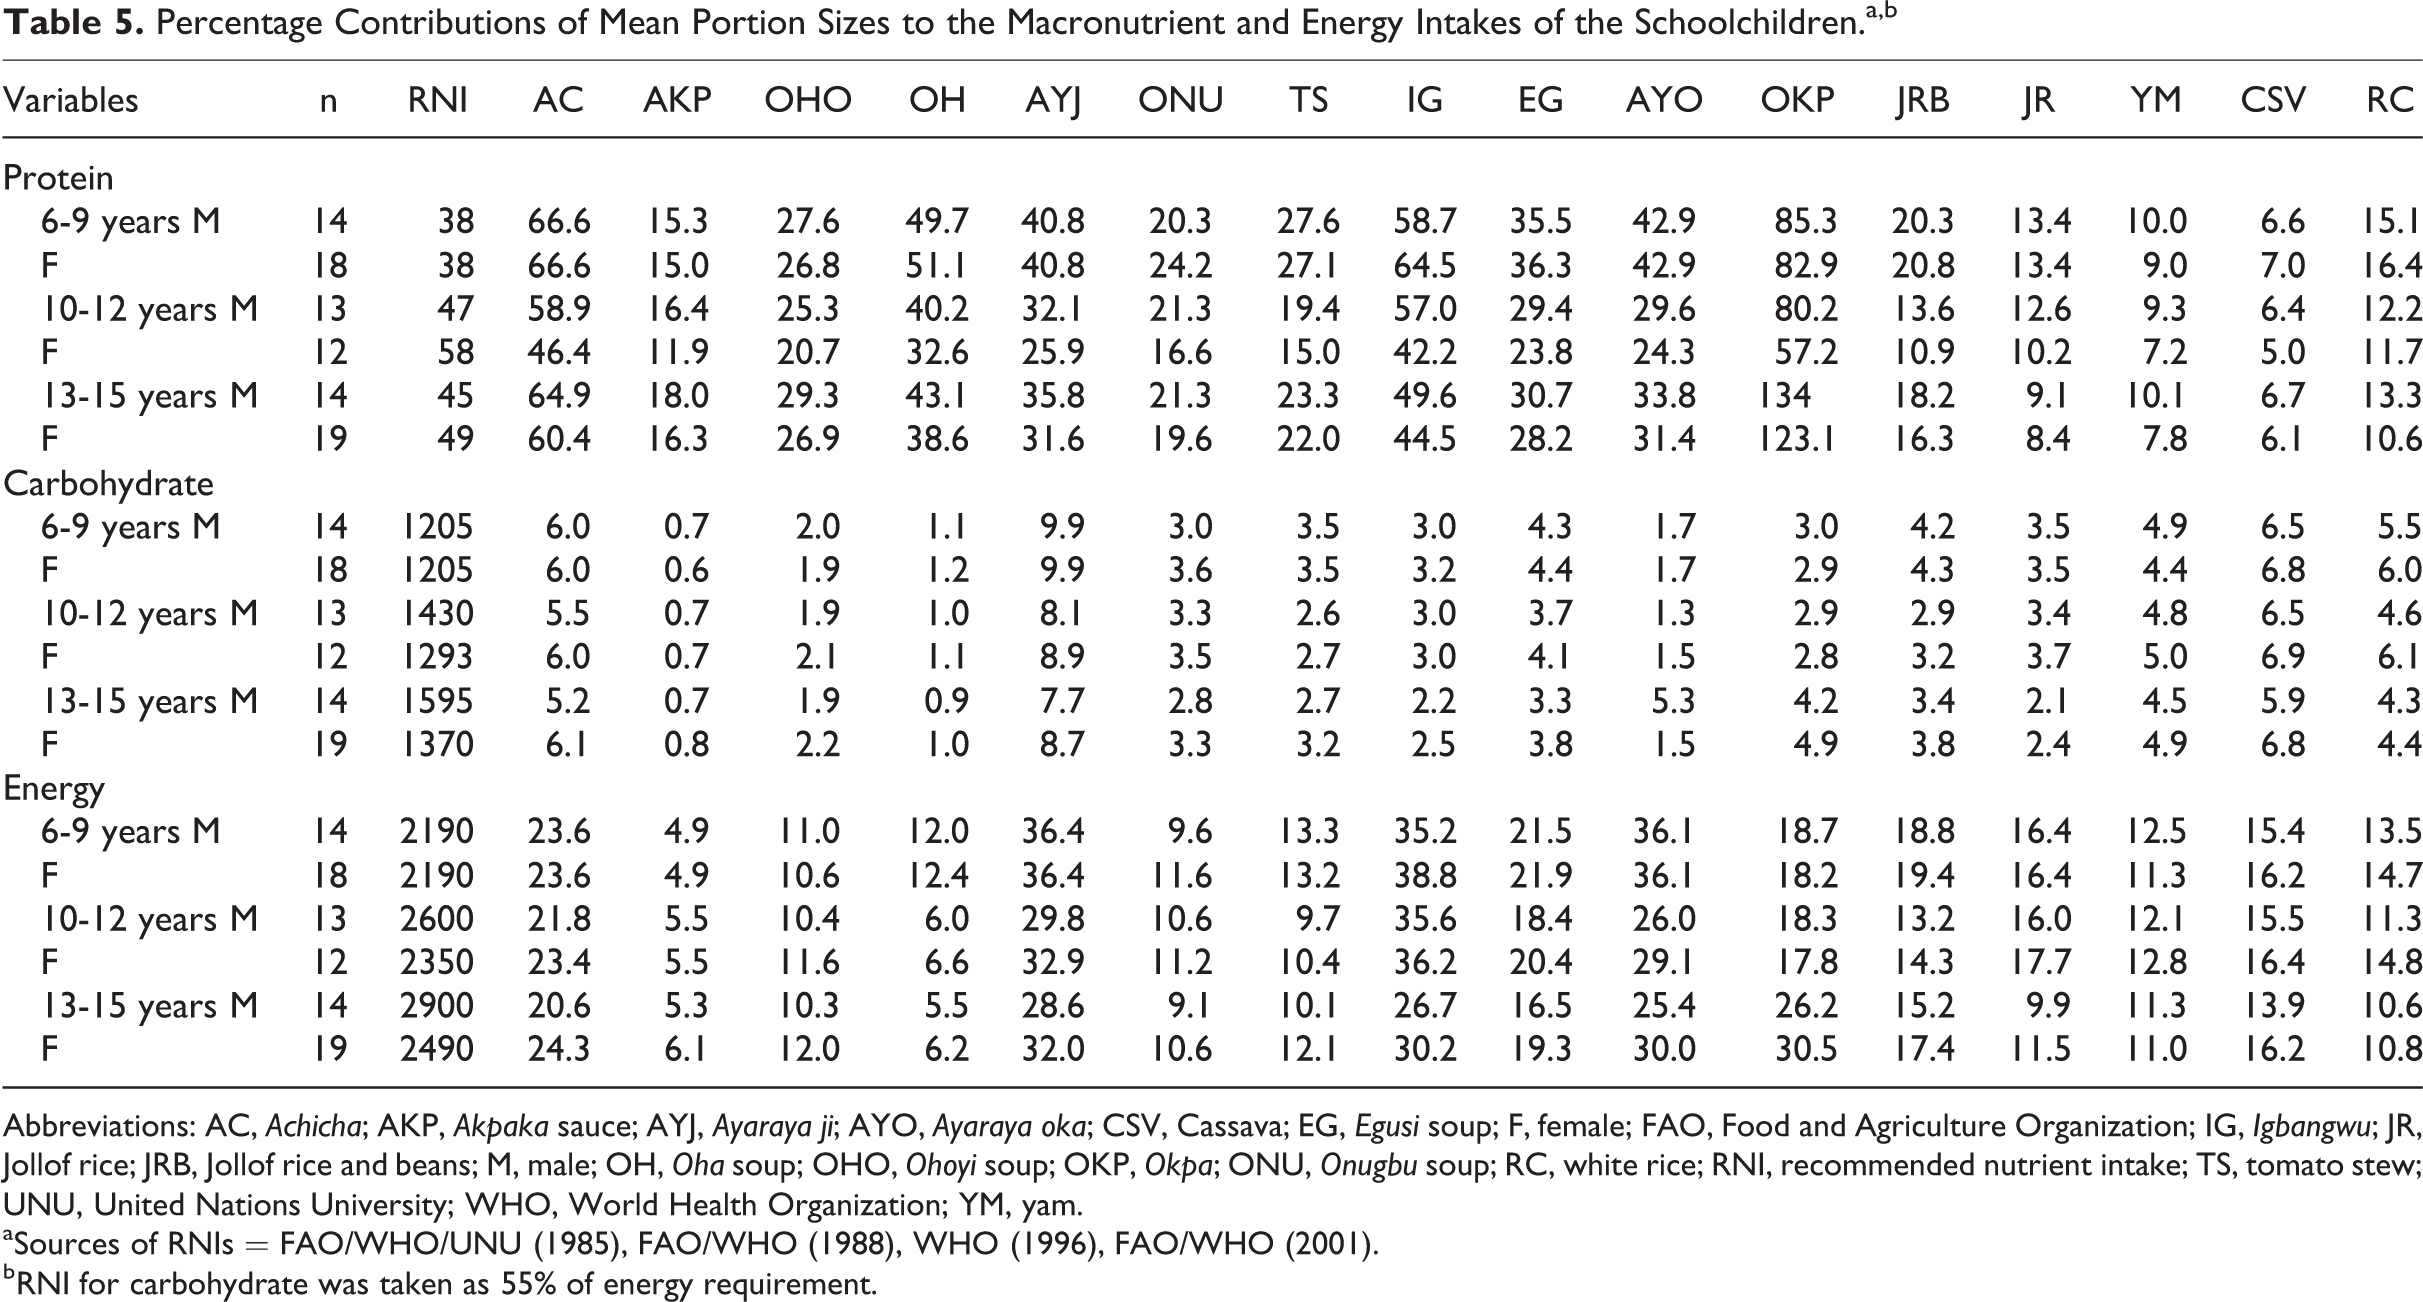
Percentage contributions of mean portion sizes to the macronutrient and energy intakes of the schoolchildren are shown in Table 5. The highest percentage contribution of 134.0% to protein requirement was made by okpa (steamed bambara groundnut pudding) to 13 to 15 year-old males. Ayaraya ji (yam + pigeon pea) made the highest percentage (9.9%) contribution to carbohydrate RNI, and this was to children (males and females) aged 6 to 9 years. The highest percentage (38.8%) of energy requirement was made by igbangwu to 6 to 9 year-old females.
Percentage Contributions of Mean Portion Sizes to the Macronutrient and Energy Intakes of the Schoolchildren.a,b
Abbreviations: AC, Achicha; AKP, Akpaka sauce; AYJ, Ayaraya ji; AYO, Ayaraya oka; CSV, Cassava; EG, Egusi soup; F, female; FAO, Food and Agriculture Organization; IG, Igbangwu; JR, Jollof rice; JRB, Jollof rice and beans; M, male; OH, Oha soup; OHO, Ohoyi soup; OKP, Okpa; ONU, Onugbu soup; RC, white rice; RNI, recommended nutrient intake; TS, tomato stew; UNU, United Nations University; WHO, World Health Organization; YM, yam.
aSources of RNIs = FAO/WHO/UNU (1985), FAO/WHO (1988), WHO (1996), FAO/WHO (2001).
bRNI for carbohydrate was taken as 55% of energy requirement.
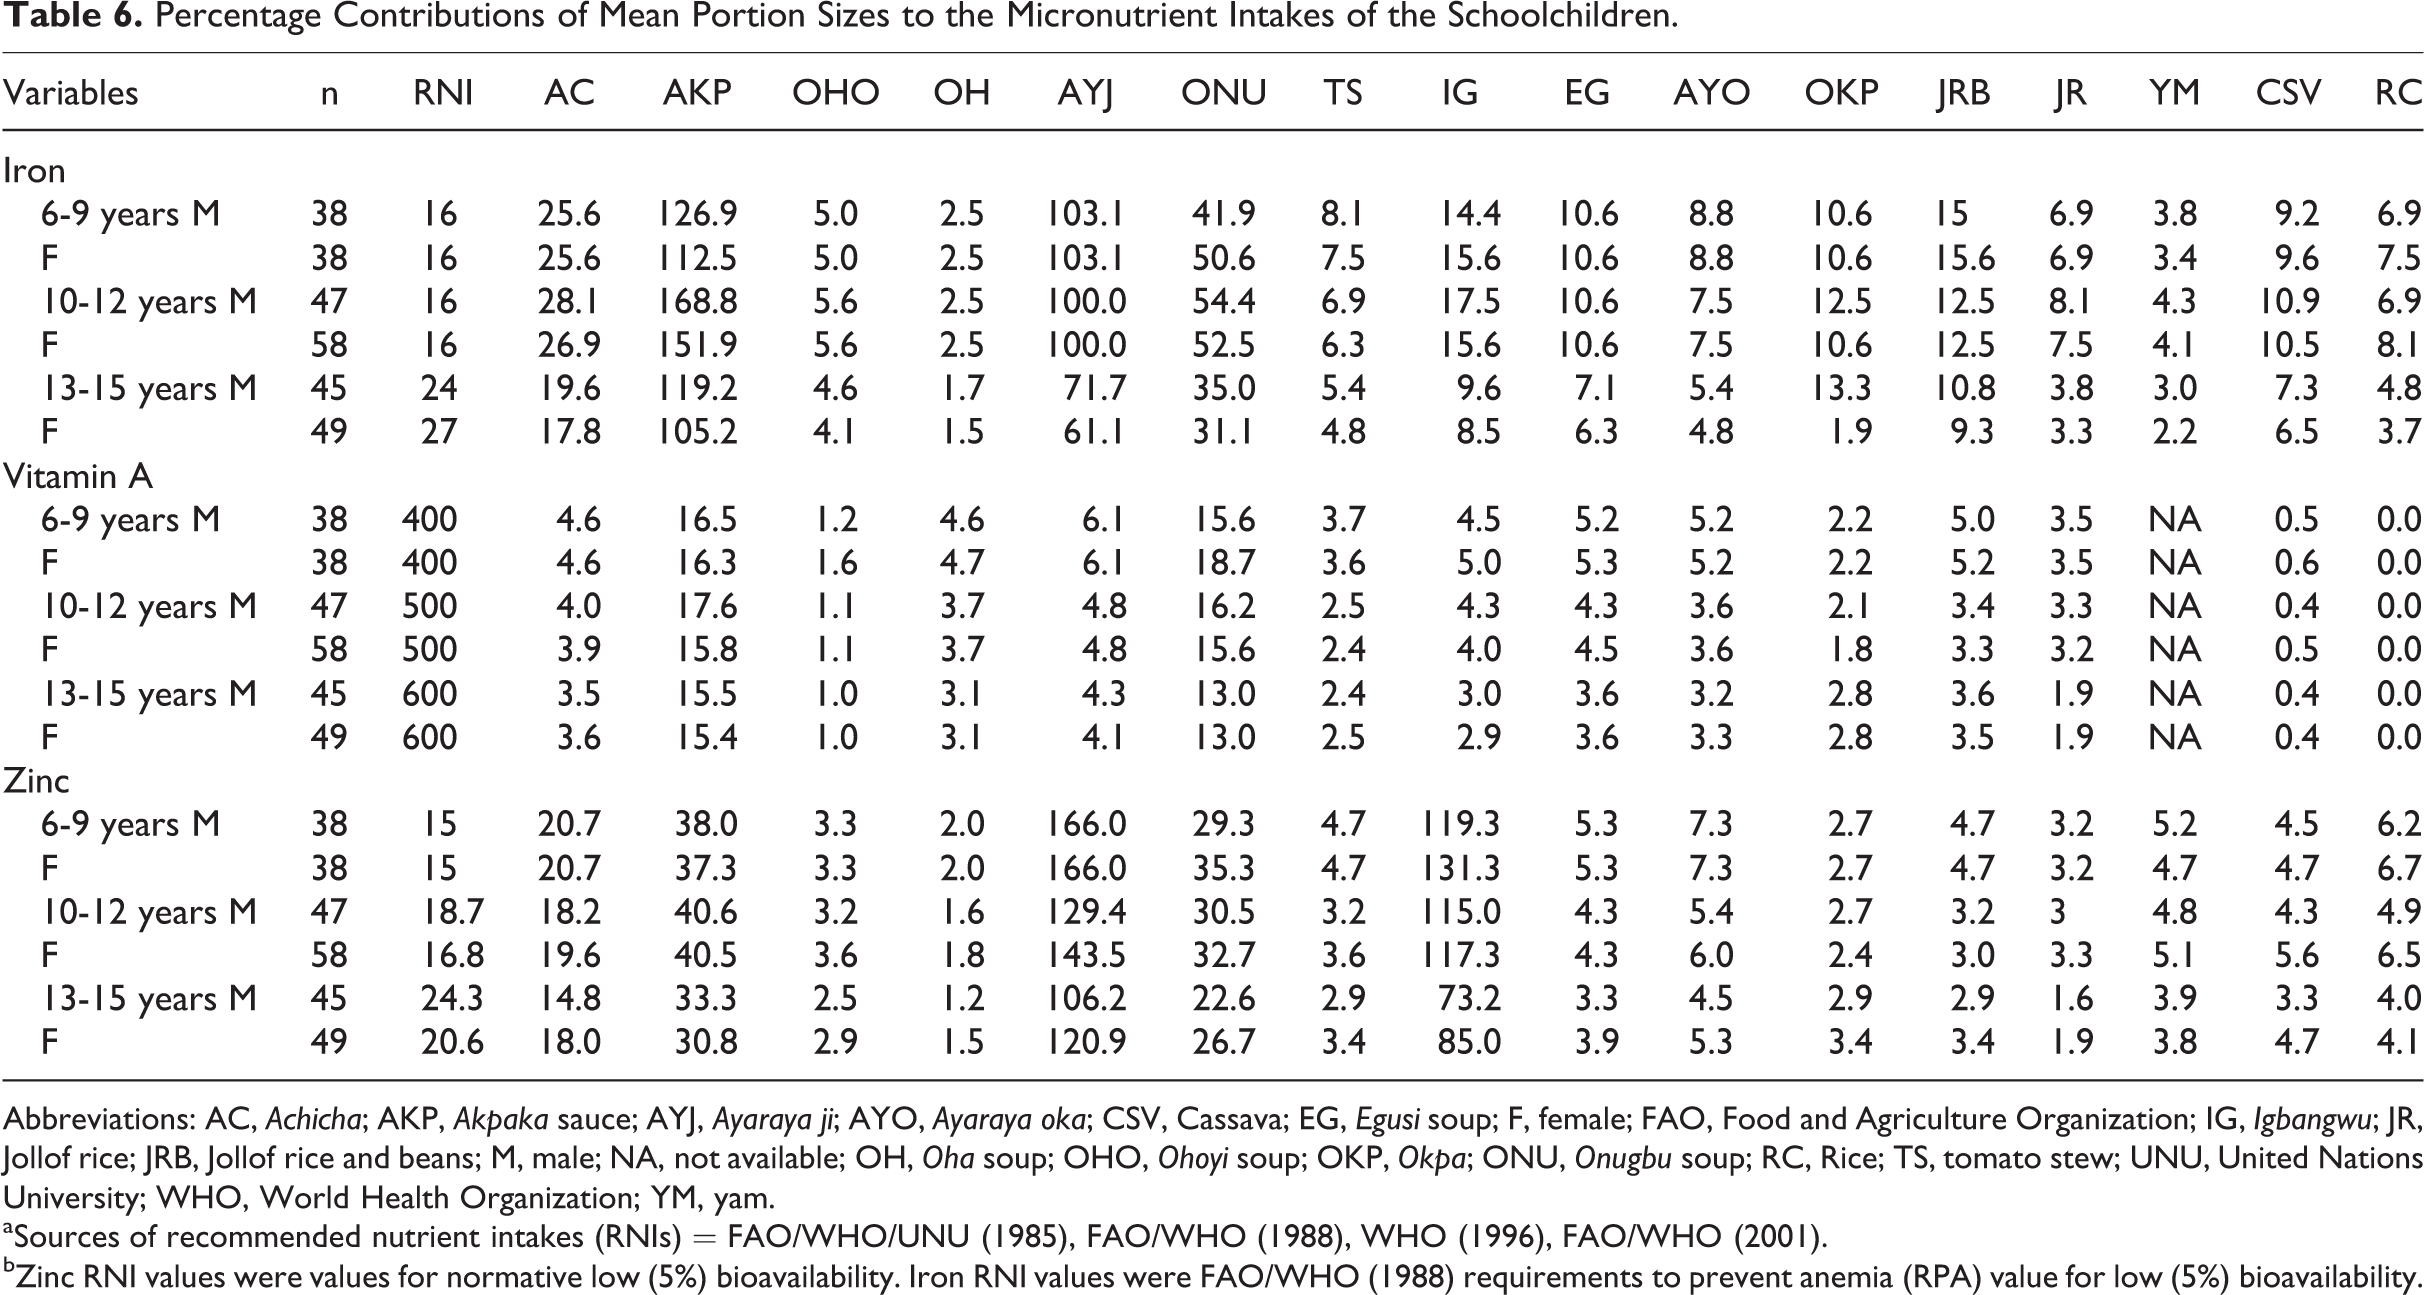
Table 6 shows the percentage contributions of mean portion sizes to the micronutrient intakes of the schoolchildren. The highest contribution (168.8%) to iron requirement was made by akpaka (African oil bean seed) sauce. Bitter leaf soup provided the highest vitamin A requirement (18.7%). Ayaraya ji (yam + pigeon pea) contributed the highest percentage (166.0%) of zinc requirement. The highest percentage contributions to iron (168.8%), vitamin A (18.7%), and zinc (166.0%) requirements were made to 10 to 12 year-old males, 6 to 9 year-old females, and 6 to 9 year-old males and females, respectively.
Percentage Contributions of Mean Portion Sizes to the Micronutrient Intakes of the Schoolchildren.
Abbreviations: AC, Achicha; AKP, Akpaka sauce; AYJ, Ayaraya ji; AYO, Ayaraya oka; CSV, Cassava; EG, Egusi soup; F, female; FAO, Food and Agriculture Organization; IG, Igbangwu; JR, Jollof rice; JRB, Jollof rice and beans; M, male; NA, not available; OH, Oha soup; OHO, Ohoyi soup; OKP, Okpa; ONU, Onugbu soup; RC, Rice; TS, tomato stew; UNU, United Nations University; WHO, World Health Organization; YM, yam.
aSources of recommended nutrient intakes (RNIs) = FAO/WHO/UNU (1985), FAO/WHO (1988), WHO (1996), FAO/WHO (2001).
bZinc RNI values were values for normative low (5%) bioavailability. Iron RNI values were FAO/WHO (1988) requirements to prevent anemia (RPA) value for low (5%) bioavailability.
Discussion
That most commonly consumed foods were traditional foods was not a surprise since the area of study is typically rural. We also observed that foods were not cooked and consumed at once, and this is worrisome. Foods were cooked in excess of what can be consumed immediately so that leftover portions are consumed at the next meal (breakfast, lunch, or supper). Cooked foods served 2 to 3 meals. Most night meals served as breakfast. This was attributed to culture, lack of time to prepare meals, ignorance, and poverty. The implication of this dietary habit is depreciation in nutritional quality as a result of heating and reheating the food each time prior to consumption. The poor nutritional quality of some of the foods was attributed to this. Nutrition education aimed at educating mothers and schoolchildren is a strategy to enhancing adequate nutrient intake in both quantity and quality.
Some findings on nutrient composition of the foods as reported in this study differed from the reports of some researchers but comparable to the reports of others. Protein in dikanut soup (3.34 g), okpa (10.36 g), and achicha (2.78 g) were higher than values reported by Okeke et al. 12 Okeke and Eze 13 reported similar protein values for igbangwu (4.34%), ayaraya ji (3.08 mg), ayaraya oka (3.57 mg), and jollof rice and beans (2.7 mg). Ayaraya ji (1.73 RE), jollof rice and beans (1.55 RE), and okpa (1.6 RE) are shown 13 to have lower values of vitamin A than reported in this study. Madukwe and Ene-Obong 14 reported higher values of iron in igbangwu (9.29 mg) and jollof rice (6.56 mg) than values reported in this study. The findings of Sanusi and Adebiyi 15 on jollof rice agreed with the report of this study. The observed differences were attributed to cooking/preparation methods, quantity, and type of ingredients used as well as inter laboratory differences in methods and chemicals.
The low percentage contribution of the nutrients in these foods to the RNI of the participants was a function of small portion sizes and nutritional quality of the foods. Generally, ingredients such as crayfish (the main animal protein in most of the foods) were observed to be in small quantities compared to the quantity of food being cooked. This implies that to meet the daily requirements or at least contribute a third of it, larger portion sizes must be consumed. In the face of high cost of foods and food scarcity, this is an illusion. Poverty has been implicated in determining what is consumed and the quantity consumed. It leads to the inability to obtain foods and ingredients necessary for preparing nutrient-dense foods. Ene-Obong et al 16 reported significant decrease in stunting, wasting, and general malnutrition with increase in income. Besides, poor food and nutrient intakes in families were the result of low socioeconomic status of the parents. 17 Increasing income-generating activities is paramount in enhancing the income of households, their purchasing power, and therefore, the nutritional status of its members. Food insecurity is another major limiting factor closely tied to poverty. The study was conducted at a time marked by food scarcity. Planting season was over, but harvest time was awaited.
Nutrient intake from most commonly consumed foods was below what is recommended for the children’s ages and sex. This invariably implies that nutrient intake from foods not commonly consumed will also be low. Only 4 (26.7%) of the 16 foods met one-third of the protein requirements of all children. These are achicha, oha soup, maize meal, and okpa. This finding implies that the remaining two-thirds of the RNI would likely be unmet because they may be based on foods whose consumption is infrequent and likely to be affected by the problem of poverty that affects provision of foods in adequate quantity and quality.
That none of the foods provided one-third of carbohydrate requirements and only 3 foods provided energy requirements for some children is worrisome. This collaborates with the findings of other researchers. 13,18 This finding is dangerous to the general development of the children. Low nutrient and energy intakes may be responsible for high prevalence of protein energy malnutrition and micronutrient deficiencies observed among children and adolescents. 2,3,5,19,20 It is important to point out that the foods consumed by the children were mainly plant foods with lower bioavailability than animal foods. Animal proteins have more nutrients to offer than plant proteins, 8 though the advantage of phytochemicals in plant foods cannot be overemphasized.
That akpaka sauce met the iron requirement (≥100.0%) of the children was expected. African oil bean sauce contains 33.2 mg of iron/100 g. 10 Ayaraya ji also met the iron requirement (≥100%) of all the children except the 13 to 15 year-olds due to their higher iron RNI. Children 13 to 15 years are at the peak of growth spurt. Most of the females have commenced menstruation and in need of higher iron intake. It is worth noting that iron is the only nutrient with higher RNI in females than males. Inability of iron intake to meet iron RNI implies severer iron deficiency and therefore anemia and serious effects on growth and immunity. Besides, bioavailability is a serious issue because the foods consumed are plant foods whose iron has low bioavailability.
None of the foods met a third of vitamin A requirements. This was not a surprise. We observed that foods like achicha, ayaraya oka, and ayaraya ji usually cooked with large amount of red palm oil were not cooked with such large amounts of oil in most households where the study took place. This was again attributed to poverty that caused them to sell most of the red palm oil produced. Majority of vitamin A intake has been reported to come from red palm oil used in food preparation. 13 Fruits and vegetable sources of β-carotene were consumed less frequently (<3 times weekly). Provitamin A in plants has reduced absorption in comparison to preformed vitamin A in animals. The inability of vitamin A intake to meet one-third of the children’s RNI is risky for growing children. Vitamin A boosts immunity, and with low intake, the issue of higher disease/infection episodes is thus raised. Some studies 21,22 have shown the relationship of vitamin A to infections and mortality. Frequent bouts of illnesses interfere with general development of the child, especially growth and cognition, since missed schools may be high. The children may have anemia, and vision may also be at risk.
The fact that only three (20.0%) foods (akpaka, ayaraya ji and igbanwu) met one third of zinc requirements of the children is a serious cause for worry. Even at that, akpaka sauce failed to meet one-third of zinc RNI for the oldest group of 13 to 15 year-olds. Zinc plays significant roles in growth 23 and immunity. 24 Depression of immune response therefore implies worsened vitamin A, iron and zinc deficiencies, and growth retardation with resultant higher prevalence of anthropometric failure.
The overall implication of low contributions of commonly consumed foods to nutrient intakes of schoolchildren culminates in poor academic performances with poor socioeconomic potential and low standard of living and therefore continued vicious cycle of poverty with grave consequences on women and children yet to be born. A functional school feeding program would ameliorate these effects on schoolchildren, unfortunately, none exists in Enugu state.
Conclusion
Most commonly consumed foods in rural Southeastern Nigerian community failed to contribute one-third of the daily nutrient requirements of schoolchildren. This was a function of small portion sizes and ingredients in the foods consumed by the children.
Recommendation
School feeding program as a means of improving nutrient intake; ameliorating nutritional problems; improving academic performances, nutrition education, and income-generating activities (to complement main income source); and promoting high-nutrient crop varieties such as orange-fleshed sweet potato are recommended.
Limitation
The study concentrated on schoolchildren in a rural community in southeast Nigeria. The study did not include many nutrients, hence the need to evaluate these foods for other nutrients such as vitamins C, B1, B2, B3, calcium, and phytochemical.
Footnotes
Authors’ Note
R. Ayogu contributed to conception, and design of the study, acquisition, analysis, and interpretation of data; drafted the manuscript; and critically revised the manuscript. R. Edeh contributed to analysis of the data and drafted the manuscript. E. Madukwe contributed to interpretation of analyzed data and critically revised the manuscript. H. Ene-Obong contributed to conception and critically revised the manuscript. All authors gave final approval and agree to be accountable for all aspects of work ensuring integrity and accuracy.
Declaration of Conflicting Interests
The author(s) declared no potential conflicts of interest with respect to the research, authorship, and/or publication of this article.
Funding
The author(s) received no financial support for the research, authorship, and/or publication of this article.