
Abstract
Background:
Undernutrition is a type of malnutrition in which there are deficiencies in nutrient intake. It is caused by inadequate dietary intake and disease. Undernutrition contributes toward poor health outcomes of a child, and imposes a financial burden on the child’s household. This study aims to determine under-five undernutrition prevalence, its inequality and associated socioeconomic and demographic factors in Uganda.
Methodology:
We analyzed secondary data of 2019/2020 Uganda National Panel Survey. From 815 households, selected 815 children under 5 who had complete data on age (months), weight (kilograms), and height (centimeters). This was used for computing the z scores. Based on the World Health Organization reference, we used the z scores to determine the children’s nutritional status. We then compared households of malnourished and those of the well-nourished children using the student’s t-test and the chi square (χ2) test respectively.
Results:
Among 815 children included in the study, undernutrition prevalence was 16.9% stunted, 6.1% wasted, and 11.8% underweight. This corresponds to catastrophic health expenditure being 1.1%, 1.7%, and 0.7% lower among households with stunted, wasted and underweight children respectively, compared to households with well-nourished children. The distribution was not statistically significant: (
Conclusion:
The odds of undernutrition didn’t differ by nutritional status, but undernourished children had significantly higher transport expenses. MoH should invest in community healthcare services to reduce these costs.
Background
Undernutrition is a type of malnutrition in which there are deficiencies in nutrient intake. 1 The classes of undernutrition include stunting, wasting, underweight and micronutrient deficiencies. Stunting is low height-for-age, while wasting is low weight-for-height. Underweight is low weight-for-age. 2
Globally, 149 million children under 5 experience stunting, 45 million children under 5 suffer from wasting.2,3 Meanwhile, 2.8 billion people cannot afford a healthy diet. 2 In Uganda, of all the under-five children, 24.4% are stunted, 9.7% are underweight, while 3.2% are wasted. 4
Undernutrition is responsible for nearly half of deaths among under-five children globally; predisposing these vulnerable groups to common infections.3,5 Undernutrition costs up to 16.5% of GDP across Africa. 2 In Uganda, approximately half of the deaths among under-five children are associated with undernutrition. 6 Moreover, undernutrition costs Uganda approximately 1.8 trillion Uganda shillings (UGX) annually. That is equivalent to 5.6% of the country’s gross domestic product (GDP). 6
Undernutrition is caused by intake of food nutrients that are inadequate to meet the body’s needs.2,3 This can be as a result of inadequate dietary intake. Acute malnutrition (or wasting) is caused by lack of nutritious food, repeated infections or both. 2
Therefore, undernutrition is influenced by food insecurity and inadequate care for women and children. Inadequate access to quality healthcare services also affects undernutrition. Unsanitary environments constitute the other factor that impacts undernutrition. 6
The factors associated with child malnutrition are maternal education, household income, and maternal nutritional status. There is also age of the child, availability of sanitation facility at home, and child’s birth weight. Others are conflict, poverty, the child’s sex, and gender inequality.6,7
Antenatal multiple micronutrient supplementation, provision of supplementary food and use of locally produced therapeutic food is used to manage acute malnutrition in children are global interventions to mitigate undernutrition. 8 However, conflicts, extreme weather conditions, ineffective food systems, economic shocks and gender inequality are global challenges. 2 Entrenched cultural and social norms, low literacy levels, poverty, climate shocks and limited functional capacity and/or budget, and changing mindsets, are challenges in Uganda. 9
The financial burden of healthcare on a household is expressed in terms of catastrophic health expenditure (CHE), 10 which is defined as out-of-pocket payments (OOP) that exceed a certain percentage (10% and 25%) of household income. 11 Globally, 2 billion people experience CHE or impoverishing OOP health spending. 1 In Uganda, 14.2% of the households have experienced CHE. 12 There is paucity of literature on the association between child undernutrition and household CHE. Knowledge of this association is essential in designing nutrition interventions which are cost effective and offer financial risk protection (FRP) benefits.
The main objective of this study was to estimate the risk of CHE associated with households of undernourished under-five children in Uganda. We answered this objective through analysis of secondary data. Descriptive and inferential statistical models were employed under the extended cost effectiveness analysis (ECEA) framework. 13
Methods
Study Design
The study used secondary data analysis (SDA) from the 2019/2020 Uganda National Panel Survey (UNPS). 14 An appropriate dataset within the household datasets was identified and used to answer our research question.
Variable Extraction
Data was extracted for the study variables’ list according to the tool indicated below (Table 1).
Variable Extraction from the 2019/2020 UNPS Household Questionnaire.
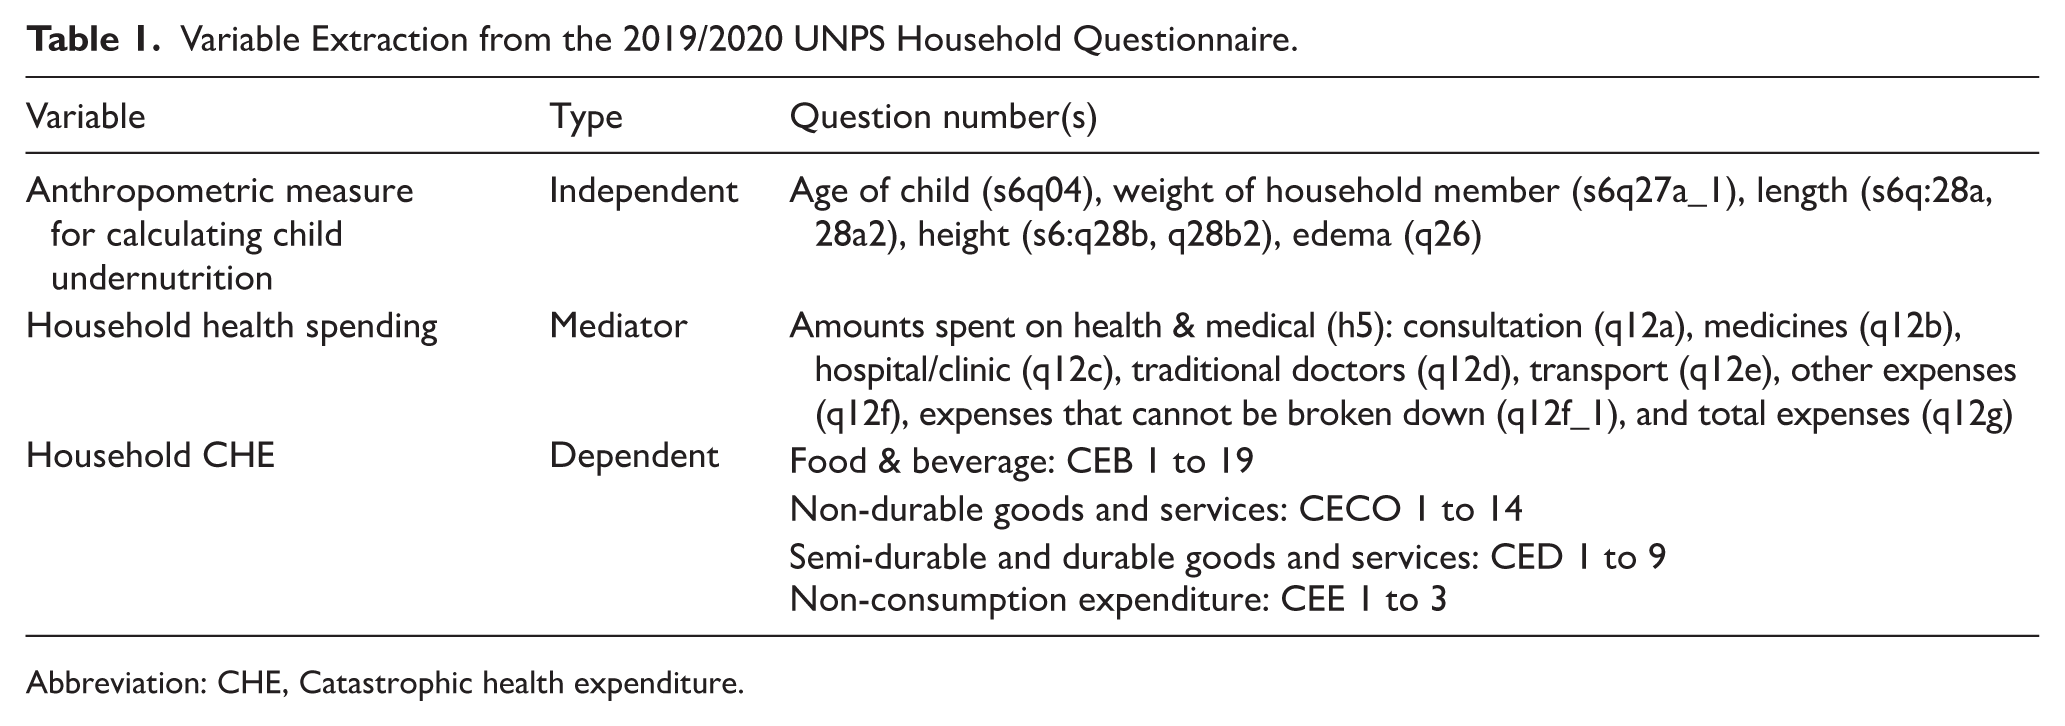
Abbreviation: CHE, Catastrophic health expenditure.
Study Population and Area
According to the report, the UNPS study population consisted of households (3123) that the UNPS set out to track and interview since 2009/2010. The sample of households was selected from 322 Enumeration Areas (EAs), including all 34 EAs in Kampala district, and 72 EAs (58 rural and 14 urban) in each of the other regions that is, Central excluding Kampala, Eastern, Western, and Northern. 14 Our study population was selected at national level using inclusion and exclusion criteria.
Inclusion
The inclusion criteria for the data selected were households with at least an under-five child and who was available for measurement. Others were under-five children who had complete data on age, height and weight. We also included households that reported symptoms of illness/injury, sought health care, and made OOP payments for health care. Households of undernourished under-five children and of children suffering from other illnesses were also included.
Exclusion
Excluded were households of under-five children with a neurological disorder such as cerebral palsy; a chronic illness, and those that reported symptoms of illness/injury, but did not seek health care. Households that were covered by health insurance and those whose under-five children had missing data on: age, weight and height; were also excluded.
Data Selection
A total of 815 households, each with an under-five child were selected. The final data set were weighted, based on the sampling weights included in the sample.
Data Management
We downloaded the data from the Uganda Bureau of Statistics (UBOS) database into Stata (version 15) and then reviewed its files for completeness and accuracy. The data was subjected to systematic checks and validation procedures in relation to the research topic and research questions set out to be answered. We also downloaded the household tool and data dictionary and the data verified against them.
Assessment of Nutritional Status of Under-Five Children
The variables: age, weight, height, and edema were used to generate the nutritional status of the children, based on the WHO reference. The height-for-age z score (HAZ) measured stunting, while weight-for-height z score (WHZ) measured wasting. Weight-for-age z score (WAZ) measured underweight. Thus, stunting, wasting, and underweight, are forms of malnutrition/undernutrition we considered in the study. We sub-divided each form into moderate (<−2SD) and severe (<−3SD) sub-categories, to indicate the extent of the severity. The undernutrition variable generated stands for all under-five children who experienced at least 1 of the 3 forms of malnutrition.
Since the approach used in measuring height or length is related to age of the child, only height (applicable to the age > 24 months) was used in the study. The length variable was excluded because it had fewer counts than the height variable. Secondly, children aged under 24 months benefit from passive immunity derived from the maternal breast milk.
Assessing Household Health and Medical Expenditures
The household health and medical expenditures in the last 30 days prior to the survey were assessed based on the respective variables. The variables used included consultation fee, medicines, hospital/clinic charges, traditional doctor’s fees, transport to and from, other expenses, expenses that cannot be broken down, and total health and medical expenditures (THME). We compared the health and medical spending between households of the undernourished and those of the well-nourished under-five children.
Estimating Monthly Household Incomes
The total household expenditures were used as a proxy for household income. We aggregated expenditures on food and beverages, non-durable goods and services, semi-durable and durable goods and services and non-consumption expenditures to constitute household income. Equation (3.1) was used in the computation:
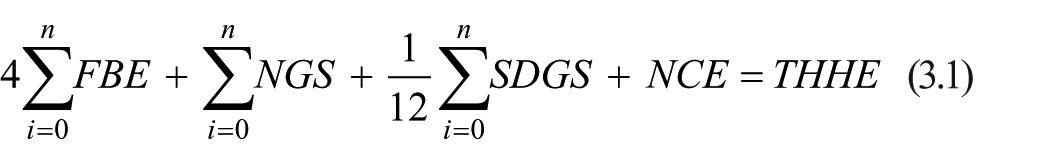
Where: FBE is food and beverage expenditures; NGS is expenditure on non-durable goods and services; SDGS is semi-durable and durable goods and services; NCE is non-consumption expenditures and THHE is monthly total household expenditures.
The proportions greater than 10% of household incomes were categorized as catastrophic while the remainder was regarded as normal health spending.
Modeling Risk of CHE Associated with Undernutrition
The CHE was computed using equation (3.2):

Where: THME is monthly total health and medical expenditures and THHE is monthly total household expenditures.
We used budget share approach in computing CHE 15 and a threshold proportion of 10% was used since the 25% threshold was not attained by any household in the study.
A case of CHE associated with undernutrition was enumerated when THME exceeded 10% of THHE amongst households of undernourished under-five children. We estimated the risk of CHE associated with undernutrition in Uganda by comparing the number of cases of CHE between households of the undernourished and those of the well-nourished under-five children.
Data Analysis
Descriptive Statistics
We used descriptive statistics to show the distribution of under-five children by selected background characteristics. The statistics used included frequency, means, medians, and proportions (or percentage). We also used descriptive statistics to show how nutrition status is distributed by age group.
Bivariate and Inferential Statistics
We used a student’s t-test to analyze the difference in health and medical expenditures between households of the undernourished and those of well-nourished children. The Wilcoxon (Mann-Whitney) test was done to maintain this model, where some variables were not normally distributed. In the sensitivity analysis, we used marginal effects to test the robustness of the primary findings by varying values of the nutritional status.
The distribution of household CHE by nutritional status of under-five children was analyzed using a contingency table and the test statistic was the chi-square (chi 2 ). A Fisher’s exact test (FET) was done to maintain this model, where some cells had counts less than 5.
Results
Background Characteristics of Study Participants
According to Table 2, the study involved 815 children from 815 households. The selected children were divided into 3 age groups: 25 to 36, 37 to 48, and 49 to 59 months. The age group of 25 to 36 months contributed 42.5% of the children. Females constituted 51.0% of the children. Rural residences made up 57.4% of the households. Children who had suffered an illness or injury in the past 30 days prior to the survey accounted for 52.0% of the sample. The mean age was 39.2 months (median: 39.0 months). The mean weight was 13.6 kg (median: 13.3 kg), while the mean height was 92.4 cm (median: 91.85 cm).
Distribution of Children Under Five by Selected Background Characteristics.

Source: 2019/20 UNPS Data.
The prevalence of under nutrition among children under 5 (prevalence of stunting, wasting, and underweight by age groups).
Table 3 displays the nutritional status of the 815 children against their age groups. The prevalence of stunting, wasting and underweight was 16.9%, 6.1%, and 11.8%, respectively. The severe form of stunting, wasting and underweight were prevalent at 3.9%, 1.2%, and 1.8%, in that order. The age group of 25 to 36 months contributed 43.5% stunting, 44.0% wasting, and 42.7% underweight.
Prevalence of Nutrition Status by Age Group of the Children.

Source: 2019/2020 UNPS data. Children aged 0 to 24 months not included in the merged dataset used.
Health and Medical Expenditures by Nutritional Status
Table 4 compares itemized health spending between households of the well-nourished and those of the undernourished children. The families of the undernourished and those of the well-nourished children had no significant difference in health spending on: medicines [t = −391, 95% CI: −3217.1 to 2148.6, P = .348], other expenses [t = 0.414, 95% CI: −419.2 to 643.1, P = .660], expenditures that cannot be broken down [t = −0.499, 95% CI: −1321.8 to 643.1, P = .309], and total health and medical care [t = −0.152, 95% CI: −3676.9 to 3149.7, P = .440].
Health and Medical Expenditures by Nutritional Status.

Diff = mean (normal) − mean (undernourished); Test used is Diff less than 0 (Ha).
Abbreviation: MWT, Mann-Whitney test.
Significant at 10% (P = .075); 1 US $ = UGX 3500.
However, undernourished children’s families spent significantly more on transport [t = −1.441, 95% CI: −577.2 to 38.5, P = .075] than those of well-nourished children, with a difference of UGX 269.3 [95% CI: −577.2 to 38.5]. The Mann-Whitney test result attests to this significant difference in transport [z = −2.020, P = .043, n = 815] (Table 4).
Results of the sensitivity analysis (Table 5) confirm the robustness of the primary findings: child undernourishment predicts higher health spending on transport (P < .001).
Linear Prediction of Health Expenditure on Transport.
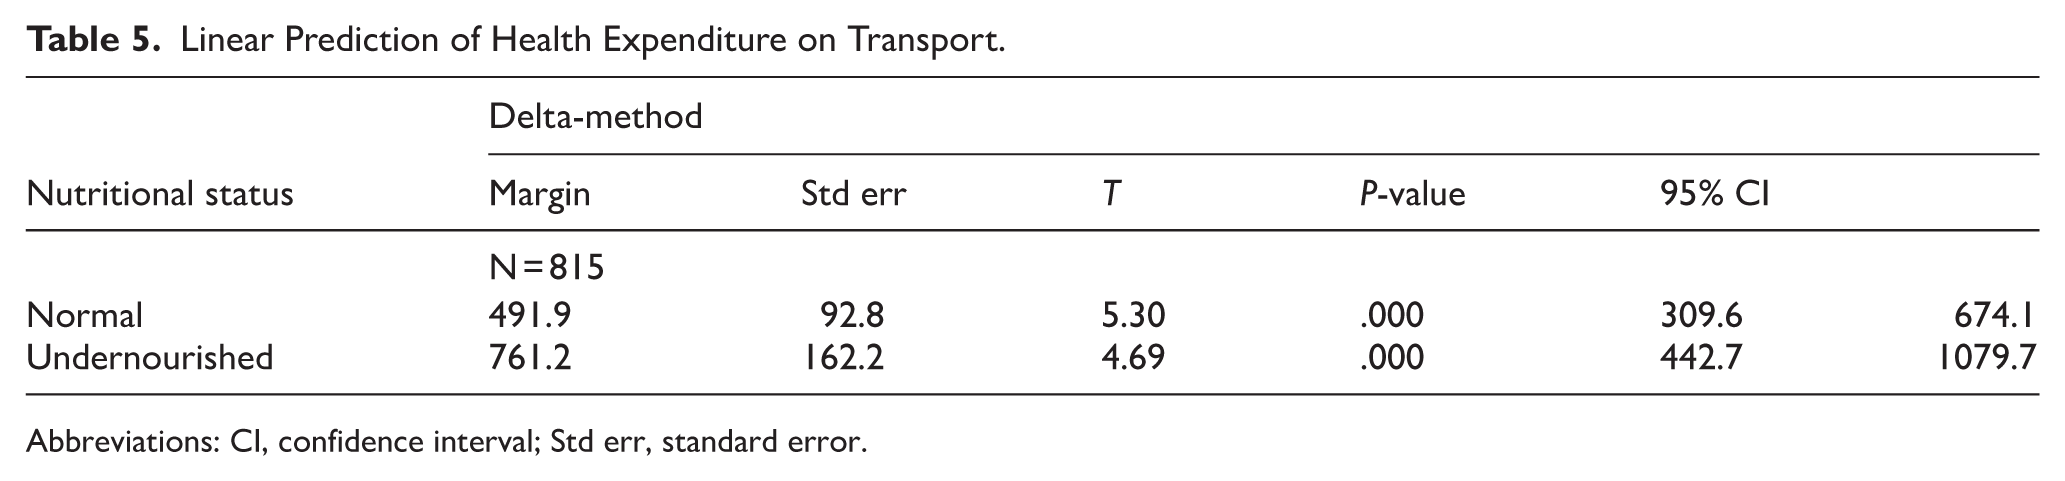
Abbreviations: CI, confidence interval; Std err, standard error.
Prevalence of Catastrophic Health Expenditures by Nutritional Status
Table 6 shows that the overall prevalence of CHE among the study households was 1.6%. The prevalence was 0.7% (
The CHE by Nutritional Status.

Abbreviation: FET, Fisher’s Exact test (one-sided).
Discussions
Prevalence of Nutritional Status by Age Group of the Children
Most children were aged 25 to 48 months, with the youngest age group making up 42.1% of the sample. The findings of our study confirm that there is high prevalence of undernutrition amongst under-five children in Uganda. Overall, 1 in every 10 children (16.9%) aged 25 to 59 months are stunted, 6.1% are wasted. One out of every 10 children (11.8%) is underweight or weigh less than their age. The high prevalence of under nutrition concurs with the findings of recent studies in Uganda.4,16 -18 However, with the national prevalence of stunting at 24.4%, underweight at 9.7% and at wasting at 3.2%, 4 our results overestimated underweight and wasting, but underestimated stunting. The differences may be stemming from the exclusion of the 0 to 24 months’ age group from our study.
The exclusion of children aged 0 to 24 months may have influenced the observed associations between nutritional status and catastrophic health expenditure. This age group represents a critical window for growth and vulnerability, during which children are at highest risk of wasting, growth faltering, and illness, and when healthcare utilization and associated costs are often greatest. Infants and young children are more likely to experience frequent infections, require repeated outpatient visits, hospital admissions, therapeutic feeding, and caregiver time costs, all of which can substantially increase household health expenditures. If children aged 0 to 24 months had been included, a higher prevalence of both acute malnutrition and CHE might have been observed, potentially strengthening the association between poor nutritional status and financial hardship.
Indeed, the youngest age group contributed the most to undernutrition in the study population, accounting for 43.5%, 44.0%, and 42.7% of stunting, wasting and underweight, respectively. This is consistent with the findings of a study in North-Western Uganda. 19
Inclusion of this age group may also have revealed clearer gradients in risk, particularly for wasting and underweight, and improved the study’s ability to detect statistically meaningful relationships.
Health and Medical Expenditures by Nutritional Status
There was no significant difference in health spending between households of the undernourished and those of the well-nourished children for the following items: medicines (t(813) = −391, P = .348), other expenses (t(813) = 0.414, P = .660), and expenditures that cannot be broken down (t(813) = −0.499, P = .309) and the total health spending (t(813) = −0.152, P = .440).
This contradicts the findings of a study in the Netherlands on disease-related malnutrition (DRM). According to the study, treating DRM in hospitalized children was associated with an elevation in annual hospital costs with an extra amount of € 80 million. Acute malnutrition was responsible for the largest proportion of this extra amount. 20 The difference in findings may be attributed to the use of secondary data in our study. The secondary data had no malnutrition-specific health expenditures. Secondly, the health expenditures were not children-specific but rather generalized to the entire household.
However, there was a significant difference in health expenditures on transport. These were expenses incurred on transport to and from the point of healthcare. Households of undernourished children spent more than their well-nourished children’s counterparts (t(813) = −1.441, P = .075) by UGX 269.3 (90% CI: −577.2 to 38.5). This means households of the undernourished need more healthcare than households of the well-nourished. This is in agreement with findings of recent studies, including the one in Nigeria.10,21 Therefore, health authorities should closely supervise and invest in nutrition interventions to prevent undernutrition, especially amongst under-five children.
Prevalence of Catastrophic Health Expenditures by Nutritional Status
The prevalence of CHE amongst households of well-nourished children was higher than that amongst households of undernourished children. The prevalence was lower by 1.1%, 1.7%, and 0.7%, amongst households of the stunted, wasted, and underweight children respectively, than amongst households of their well-nourished counterparts. This means households of the undernourished have a lower likelihood of experiencing CHE than those of well-nourished under-five children. However, the distribution was not statistically significant: (
This study’s limitation is that, important factors such as household coping strategies, severity and frequency of child illness episodes, health insurance coverage, distance to health facilities, and informal healthcare expenditures were not measured and may have influenced both nutritional outcomes and household health spending. In addition, low prevalence of CHE and the presence of sparse and zero cell counts limited statistical power and reduced the precision of effect estimates, increasing the likelihood of type II error. These constraints may have masked true associations, resulting in wide confidence intervals or non-significant findings. Despite the limitations, the study used large datasets distributed throughout the country, covering rural and urban settings.
Conclusion and Recommendations
There was no risk of CHE associated with households of undernourished under-five children in Uganda. This is because there was no significant difference in CHE prevalence between households of the undernourished and those of the well-nourished children (P > .05). However, households of undernourished children experienced significantly higher expenses on transport to and from the health facility than their counterparts of the well-nourished children: (t(813) = −1.441, P = .075) by Ugx 269.3 (90% CI: −577.2 to 38.5).
Therefore, to mitigate these, investments on nutritional interventions address undernutrition specifically children under 5 years are essential to include but not limited to scaling up community and behavior change communication through village health teams to improve infant and young child feeding, hygiene and timely care-seeking. Then further research should be conducted to understand the economic implication of treatment and management of malnourished under-five children at household level. This should clearly distinguish between costs stemming from malnutrition alone and those costs connected to other underlying conditions. Also, studies should prioritize inclusion of children under 2 years to better capture the full nutritional and economic burden experienced by households.
Footnotes
Acknowledgements
First and foremost, I sincerely appreciate my supervisors and not forgetting my fellow students for their rigorous support during the program. Lastly, we express our sincere gratitude to the UBOS for granting the permission to access the data source.
Ethical Considerations
We sought permission to use the data from UBOS. Approval to conduct the study was obtained from Busitema University, Faculty of Health Sciences Research & Ethics Committee (REC), and number BUFHS-2023-114 prior to data analysis.
Author Contributions
SO conceptualized the study idea, analyzed the data, wrote, and edited the manuscript. FO, PN, MRM, YL, BN and KAU and YL guided the writing and editing of the manuscript. FO reviewed the manuscript. All authors read and approved the final manuscript.
Funding
The authors received no financial support for the research, authorship, and/or publication of this article.
Declaration of Conflicting Interests
The authors declared no potential conflicts of interest with respect to the research, authorship, and/or publication of this article.
Data Availability Statement
The datasets used and/or analyzed during the current study are available from the UBOS link.