
Abstract
Background:
In Nepal, limited availability and affordability of nutritious foods contribute to malnutrition.
Objectives:
To identify nutrient deficiencies in commonly consumed diets and model lowest cost changes that could improve diet quality in 3 agroecological zones of Nepal.
Methods:
In August to September 2014, we collected market price and women’s food frequency data from 3 representative villages in Nepal’s mountains (Mahat Gaun, Jumla, n = 181 households), hills (Sitapur, Arghakhanchi, n = 166), and terai (Saigaun, Banke, n = 232) and verified local diets during women’s group discussions. Using the Cost of the Diet method, we compared models of the most nutritious version of a commonly consumed diet given locally available foods (“common diet”) with the cheapest possible diet meeting nutrient requirements, including foods not currently available (“optimal diet”).
Results:
The household common diet lacks sufficient vitamin B12, riboflavin, and calcium in the mountains; B6, B12, calcium, and iron in the hills; vitamin A, calcium, and iron in the terai. Adding fish to the mountain and hill diets and increasing dark green leafy vegetable consumption in all zones yielded nutritional adequacy. Optimal diets are more expensive than the common diet in the mountains and hills but less expensive in the terai.
Conclusion:
The modeled lowest cost diet commonly eaten in 3 Nepalese communities lacks key nutrients. Policies and interventions that increase market availability and consumption of vitamin B12- and calcium-rich fish and dark green leafy vegetables could improve local diets, particularly in the mountains and hills.
Introduction
In Nepal, 41% of children younger than 5 years are stunted, 29% of children are underweight, and 18% of reproductive-age women are undernourished. 1 In all, 39% of households are moderately or severely food insecure, meaning they do not have sufficient access to and use of safe, nutritious foods to maintain an active, healthy life. 1 –3 Although the causes of malnutrition and food insecurity vary, for the approximately 80% of Nepal’s population that is employed in agricultural production, region-specific factors including food prices, climate, and season can play a key role in household livelihood and, in turn, food security and diet. 4 –9 Despite its small size, Nepal is a country with diverse climate, terrain (mountains, hills, terai), ethnicities, and food customs. Land use, crop varieties, dietary preferences, and market access differ greatly between regions. 4,10 It is important to consider Nepal’s heterogeneous landscape when addressing the country’s nutrition and food security challenges. 10
Save the Children UK developed a Cost of the Diet (CoD) method to help researchers and practitioners model the effects of changes in food availability, price, and/or household income on nutritious diet affordability. 11 Since its development, the CoD method has been used in many countries including Nepal. 12 –15 In 2013, Akhter estimated the effects of global food price shocks on diet affordability in Dhanusha District, in Nepal’s eastern terai (lowlands) region. 15 More recently, Geniez et al used data from the Nepal Living Standards Survey to estimate the cost and affordability of a nutritious diet in Kathmandu and in a rural mountain area. 16 Although those studies provided valuable insights into food security and nutrition in Nepal, the CoD method has as yet not been used to identify how the cheapest nutritious diet available differs by agroecology and the feasibility of purchasing such diets.
Recognizing the need for region-specific food security and nutrition data in Nepal, this study used the CoD method and 2014 survey data from the Policy and Science for Health, Agriculture, and Nutrition (PoSHAN) Community Studies with the following objectives: to identify sources of nutritional deficiencies in household diets given typical consumption patterns and foods available at the time of study, to identify lowest cost dietary changes needed for households to eat nutritious diets; and to stratify analyses by agroecological zone. Using the CoD method, we modeled the differences in cost and nutrition between currently consumed diets (“common diets”) and optimally nutritious diets (“optimal diets”) in 3 village development communities (VDCs) representing 3 districts in Nepal’s mountains, hills, and terai. 17 Modeling a regionally specific estimation of current and more nutritious diets and their associated costs demonstrates how tools like the CoD software can be used to inform agriculture, nutrition, and economic policies that improve food security and nutrition by increasing market access, availability, and affordability of nutritious foods.
Methods
Data Collection
The PoSHAN Community Studies is an annual nationwide household and community survey in 21 randomly selected VDCs stratified across Nepal’s 3 major agroecological zones. The study collects nutrition, health, income, expenditure, agricultural production, and health and/or agriculture program involvement data. The participants are young mothers, children younger than 5 years, caretakers, and heads of household from households with children younger than 5 years and/or newly married women. Annual and seasonal food and agricultural item price information is collected from local markets. This analysis used seasonal PoSHAN data on local food prices, women’s food frequency, and household composition collected in August to September 2014 from 3 PoSHAN sites representative of each zone: a mountain site in Mahat Gaun, Jumla District (n = 181 households); a hill site in Sitapur, Arghakhanchi District (n = 166); and a terai site in Saigaun, Banke District (n = 232).
The 21 VDCs participating in the annual PoSHAN study were selected using systematic random sampling. We selected 7 VDCs from each agroecological zone and then randomly selected 3 wards per VDC, totaling 21 participating wards per zone. To provide in-depth seasonal estimates of market prices, food security, diet, and nutritional status and collect data for this analysis, 1 VDC nested within each zone’s sample was selected as a “sentinel site.” We selected sentinel site communities by analyzing a site’s representativeness of each respective zone based on average comparability with 6 other randomly sampled VDCs in each zone. We compared public census data on zonal distribution of population density, age and sex, households with agricultural land, livestock and poultry, nonagricultural economic activity, literacy, and other factors. The 3 VDCs that most closely approximated the center of these distributions in each zone were selected as the sentinel sites.
To identify locally available foods and consumption patterns in each community, we used results of the PoSHAN 7-day food frequency questionnaire (FFQ) and supplemental discussions with local women. The PoSHAN FFQ used in this analysis was designed to measure women’s dietary diversity based on reported consumption frequency of 49 food items (not specific to portion size) in the last 30 days. Because the foods listed in the FFQ are not specific to agroecological zone, we facilitated a group discussion with 10 to 11 women at each site in September 2014 to ensure that the food list used to calculate low-cost diets reflected all foods locally available and consumed in that season. Groups consisted of purposively sampled local women known to be involved in household food purchasing and/or preparation, who represented a variety of socioeconomic levels, ethnicities, and ages. Following a protocol based on methods recommended in the CoD manual, through free listing and facilitated discussion, participants listed all known local foods available in the nearest market in the postmonsoon season (Note 1). Facilitators followed a discussion guide developed in English and translated into Nepali, drawing from previously validated protocols for free listing and pile sorting to collect dietary information in resource-limited settings. 18,19
We then compared the foods listed in the women’s discussions with the foods included in the PoSHAN FFQ to create a comprehensive list of commonly consumed, seasonal foods available in the market for each site (69 foods in mountains, 66 foods in hills, and 67 foods in terai; see Appendix). Although fish consumption is not unheard of in Nepal’s mountains and hills, because of its very low reported consumption in the FFQ and absence from the market during the season of data collection, it was not included in the food list used to calculate the common diet for those sites. However, although there may be substantial barriers to widespread fish consumption at higher altitudes compared to in the terai, because of its potential (low-cost) contribution to nutritional adequacy, we added fish to the lists of theoretically available foods for the optimal diets in the mountains and hills.
After identifying all foods available in the market and consumed, women further discussed foods on the list that were not already included in the PoSHAN women’s FFQ to estimate the consumption frequency. During a pile-sorting activity, the facilitator distributed cards with the names of each food written on them to each woman and asked women to place each food card in a pile signifying how often her household eats the food. The options were “never,” “rarely” (once a month or less), “often” (1-4 days per week), or “usually” (5 or more days per week).
The PoSHAN study data collectors gathered prices for foods available in the nearest market to each site. Prices were recorded in Nepalese rupees (NRS) per kilogram or converted from another commonly used measurement to NRS/kg as needed. 20,21 During formative research for the PoSHAN Community Studies, data collectors interviewed key informants to identify the most commonly used market nearest to participating study communities. Perhaps due to supply chain barriers, although reported as being commonly consumed, prices for black gram and chickpeas were unavailable at the time of PoSHAN data collection and were estimated from district-specific national food security monitoring data. 22,23 Because market prices for fish were only available in the terai and dark green leafy vegetable (DGLV) prices were only available in the mountains, we estimated those food prices for the other sites by multiplying the known price by a factor consistent with the observed price difference between regions for similar foods. To calculate mountain and hill fish prices, we used cooking oil prices as a proxy, given an assumption that oil, like fish, requires processing and transport before purchase in the market. The DGLV prices were estimated by multiplying the mountain site survey price by a factor consistent with regional price differences observed in the first annual (nationwide) PoSHAN survey in 2013. Nepali rupees were converted to US dollars (USD) postanalysis. 24
The PoSHAN data on household size, mother’s age, and children’s ages were used to construct a household profile that reflects the PoSHAN study’s target population of households with young women, mothers, and children younger than 5 years. Nutritional content of foods used in the analysis was drawn from the CoD food composition database, including values for energy, protein, and fat; vitamins A, C, B1, B6, and B12; and riboflavin, niacin, pantothenic acid, folic acid, calcium, iron, magnesium, and zinc.
Data Analysis and Model Construction
Analyses were done using Stata 13.1 statistical package and Save the Children UK’s CoD linear programming software. 11,25 After compiling a comprehensive food list, we entered PoSHAN and pile-sorting data into the CoD software to model (1) the most nutritious, cheapest diet given what most women in the survey population reported eating (common diet) and (2) a most nutritious, least expensive diet that could be consumed by households (optimal diet) that includes foods not commonly eaten at present. To identify individual nutrient needs contributing to overall household deficiencies, we modeled common and optimal diets for individuals and households.
Although study households are typically larger in the terai (mean: 6.52 people, standard deviation [SD]: 2.67) than households in the hills (mean: 4.70, SD: 1.70) or mountains (mean: 4.76, SD: 1.98), to compare the nutritional adequacy of a lowest cost household diet between zones, the household composition used in this analysis was the same for all 3 sites (5 members, including an exclusively breastfed infant). We constructed the standardized household profile using individual energy, weight, and age profiles predetermined in the CoD tool, including a child (any sex) aged 12 to 23 months; a moderately active, 45-kg woman aged 18 to 29 years at 3 to 6 months of lactation; a man aged 30 to 59 years, 50 kg and moderately active; and a woman older than 60 years, 45 kg and moderately active. We then calculated common and optimal diets at the household and individual levels for each VDC, given the nutrient requirements of each individual, or at the household level, given the combined nutrient requirements of all individuals in the household.
The CoD method uses linear programming to select a diet with the lowest cost combination of foods, given specified nutritional constraints. To model a diet, the program chooses foods from a given list that provide the cheapest diet within certain constraints. Those constraints are an individual’s or household’s total nutrient requirements for a specified time period and a range of frequency within which a person or household would reasonably be expected to consume each food. Because FFQ data were not available for all individuals, we estimated minimum and maximum frequencies of consumption for all household members based on the FFQ of a young mother, supplemented by women’s group discussions.
To estimate the common diet, we set minimum and maximum consumption constraints for all individuals except the 12- to 23-months-old child at the 25th and 75th percentiles of the women’s FFQ responses for each food. For example, if 75% of women reported eating rice at least 7 times per week and 25% reported eating it more than 21 times per week, then the minimum rice consumption allowed for an individual’s common diet would be 1 serving daily and the maximum consumption possible would be thrice daily. For food items not included in the FFQ, we calculated consumption minimum and maximum constraints using in-built formulas in the CoD software, based on pile sorting results, and likewise used the same minimum and maximum constraints for all adults. Because the diet of the child aged 12 to 23 months automatically included 532 kcal of breast milk per day (breast milk being the cheapest source of energy), for that individual’s profile, we set minimum consumption constraints at 0 for all foods except rice, which was set at 7 times per week. Because the young woman is lactating at 3 to 6 months, the model also assumes that a young mother would be able to exclusively breastfeed a 3- to 6-month-old infant and the older child.
Diets at the individual level were constructed by setting minimum and maximum constraints at the same levels as those based on the range of what young women reported eating. Portion sizes were adjusted to fit each individual’s nutrient needs based on age, energy requirements, and gender. The software automatically calculates individual-specific portion sizes by scaling each individual’s portions in relation to energy requirements for a 12- to 23-month-old child. Therefore, although we developed a list of local foods and general dietary patterns based on the frequency with which women reported eating certain foods in the past 30 days, the portion sizes for actual diets modeled for each individual are specific to the individual profile. The FFQ data were used only to supply a possible range of consumption frequency, which this analysis assumes was wide enough to include the possibility of intrahousehold differences in consumption frequency.
To model optimal diets after identifying the nutritional deficiencies of the common diet, we expanded constraints to the maximum upper values in FFQ results for each food, setting the minimum value at the 25th percentile. Because nutrient deficiencies still existed even after this constraint expansion, we incrementally adjusted minimum and maximum values to force foods high in limiting nutrients (like fish) into the diet, while keeping consumption of each food within boundaries of what a person could theoretically consume. Adjustments were made until the best possible nutrient profile was achieved for all individuals, and making further adjustments to constraints began to yield poorer nutrient profiles, thus modeling the “best-case” nutrient scenario with the lowest cost. As noted above, in the mountains and hills where there was no or very low reported consumption of fish, a food rich in key limiting nutrients, we allowed for higher fish consumption to construct optimal diets for those zones.
Nutrient requirements were determined using default values in the CoD software, which are based on World Health Organization (WHO) published recommendations as follows: Energy intake requirements were set at the estimated average requirement (EAR), with a 50% probability that any given individual meets his/her energy requirement. A minimum and maximum fat allowance was set as a percentage of overall energy intake for each individual: a minimum of 30% and maximum of 40% for a child 12 to 23 months old and a minimum of 20% and maximum of 35% of energy intake for adults. Protein requirements were set at the 95th percentile of the distribution of requirements for individuals. Micronutrient requirements reflect WHO recommended nutrient intakes (RNIs), which were set at 2 SD above the EAR, at the 97.75th percentile. Tolerable Upper Level Intake above the RNI applied to vitamin A, vitamin C, calcium, iron, and niacin to prevent consumption at toxic levels. 26,27
Ethics
The Johns Hopkins University Institutional Review Board and the Nepal Health Research Council granted ethical approval for the PoSHAN Community Studies. Informed consent was obtained orally from PoSHAN and women’s group discussion participants.
Results
Nutrient Deficiencies in the Common Diet
Household level
As shown in Table 1, the common diet modeled for each zone provided 100% of the targeted daily household macronutrient needs. Of the 16 measured nutrients, calcium and vitamin B12 were most lacking in the common diet, which provided less than 10% of required B12 in the mountains and hills and less than 40% of required calcium in all 3 zones. In addition, the common diet in the hills lacked sufficient riboflavin, vitamin B6, and iron but provided at least 80% of each respective nutrient. Vitamin A deficiency was unique to the common diet in the terai, where the common diet also only provided 55% of necessary household iron needs. Finally, the mountain common diet lacked sufficient riboflavin (86%) in addition to B12 and calcium.
Percentage of Daily Household Nutrient Targetsa Met in Common Versus Optimal Diet, by Agroecological Zone.
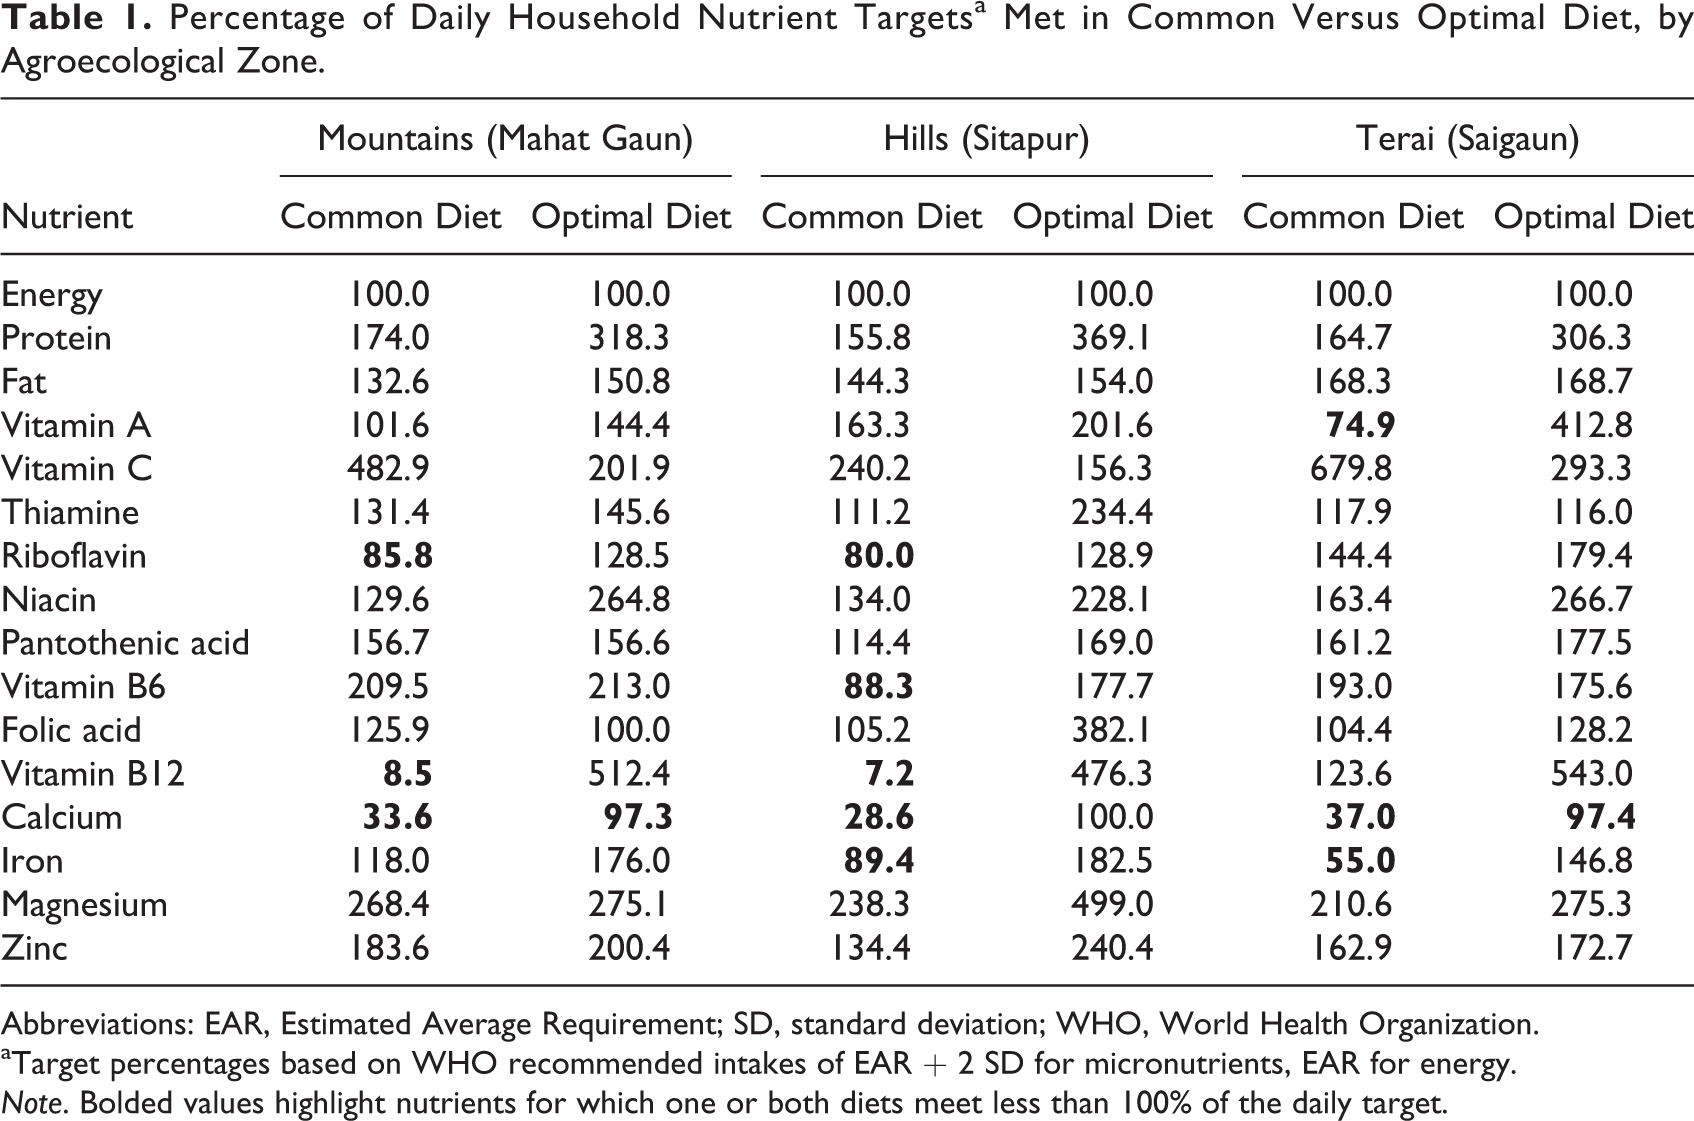
Abbreviations: EAR, Estimated Average Requirement; SD, standard deviation; WHO, World Health Organization.
aTarget percentages based on WHO recommended intakes of EAR + 2 SD for micronutrients, EAR for energy.
Note. Bolded values highlight nutrients for which one or both diets meet less than 100% of the daily target.
After relaxing consumption constraints to model optimal diets, the exclusion of small fish (with bones) from mountain and hill diets (due to very low reported consumption and unavailability in the market) prevented us from modeling nutritionally adequate diets without grossly distorting costs. Therefore, to investigate one way to address the substantial vitamin B12 and calcium deficiencies, we added fish to the list of possible foods for the optimal diets in those zones. Doing so, in addition to modeling an increase in the consumption of DGLVs such as spinach and pumpkin leaves, allowed the optimal diet to eliminate B12 deficiencies in the mountains and hills and provide at least 97% of required calcium for a household in all zones.
In combination with increasing fish and DGLV consumption, to eliminate riboflavin, B6, and iron deficiencies in the hills, the optimal diet included more long green beans. To eliminate vitamin A deficiency in the diet of a terai household, we also modeled an increase in consumption of buffalo milk. Increasing consumption of goat milk, spinach, and pumpkin leaves in the mountain optimal diet also may have helped to eliminate the riboflavin deficiency for that zone’s diet. With these changes, we were able to model a lowest cost diet for all 3 zones that provided 100% of all nutrients except calcium, which was included at only 97% of the requirement in the mountain and hill optimal diets.
Individual level
Table 2 highlights the intrahousehold distribution of nutrient deficiencies in the common and optimal diets. In the mountains, although a common diet at the household level provided adequate energy needs, the diet for a child aged 12 to 23 months provided less than 50% of required fat. The child’s diet also included more vitamin B12 than for the other individuals, providing 74.3% of the requirement compared to 1% or less for all others. The common diet for the woman aged >60 years had the highest calcium deficiency (16.5% of requirement). Although the optimal diet includes more calcium-rich foods, the older woman’s diet only reaches 92.1% of the daily requirement in the mountains. Adding fish and increasing DGLV consumption in the optimal diets helped to eliminate these nutrient deficits for all individuals, but the older woman’s optimal diet in the mountains includes 4 servings of small fish and 4 servings of cooked pumpkin leaves per day, which may not be realistically attainable for some individuals.
Percentage of Limiting Nutrient Targeta Met in Individual-Level Common Versus Optimal Diets, by Agroecological Zone (VDC).
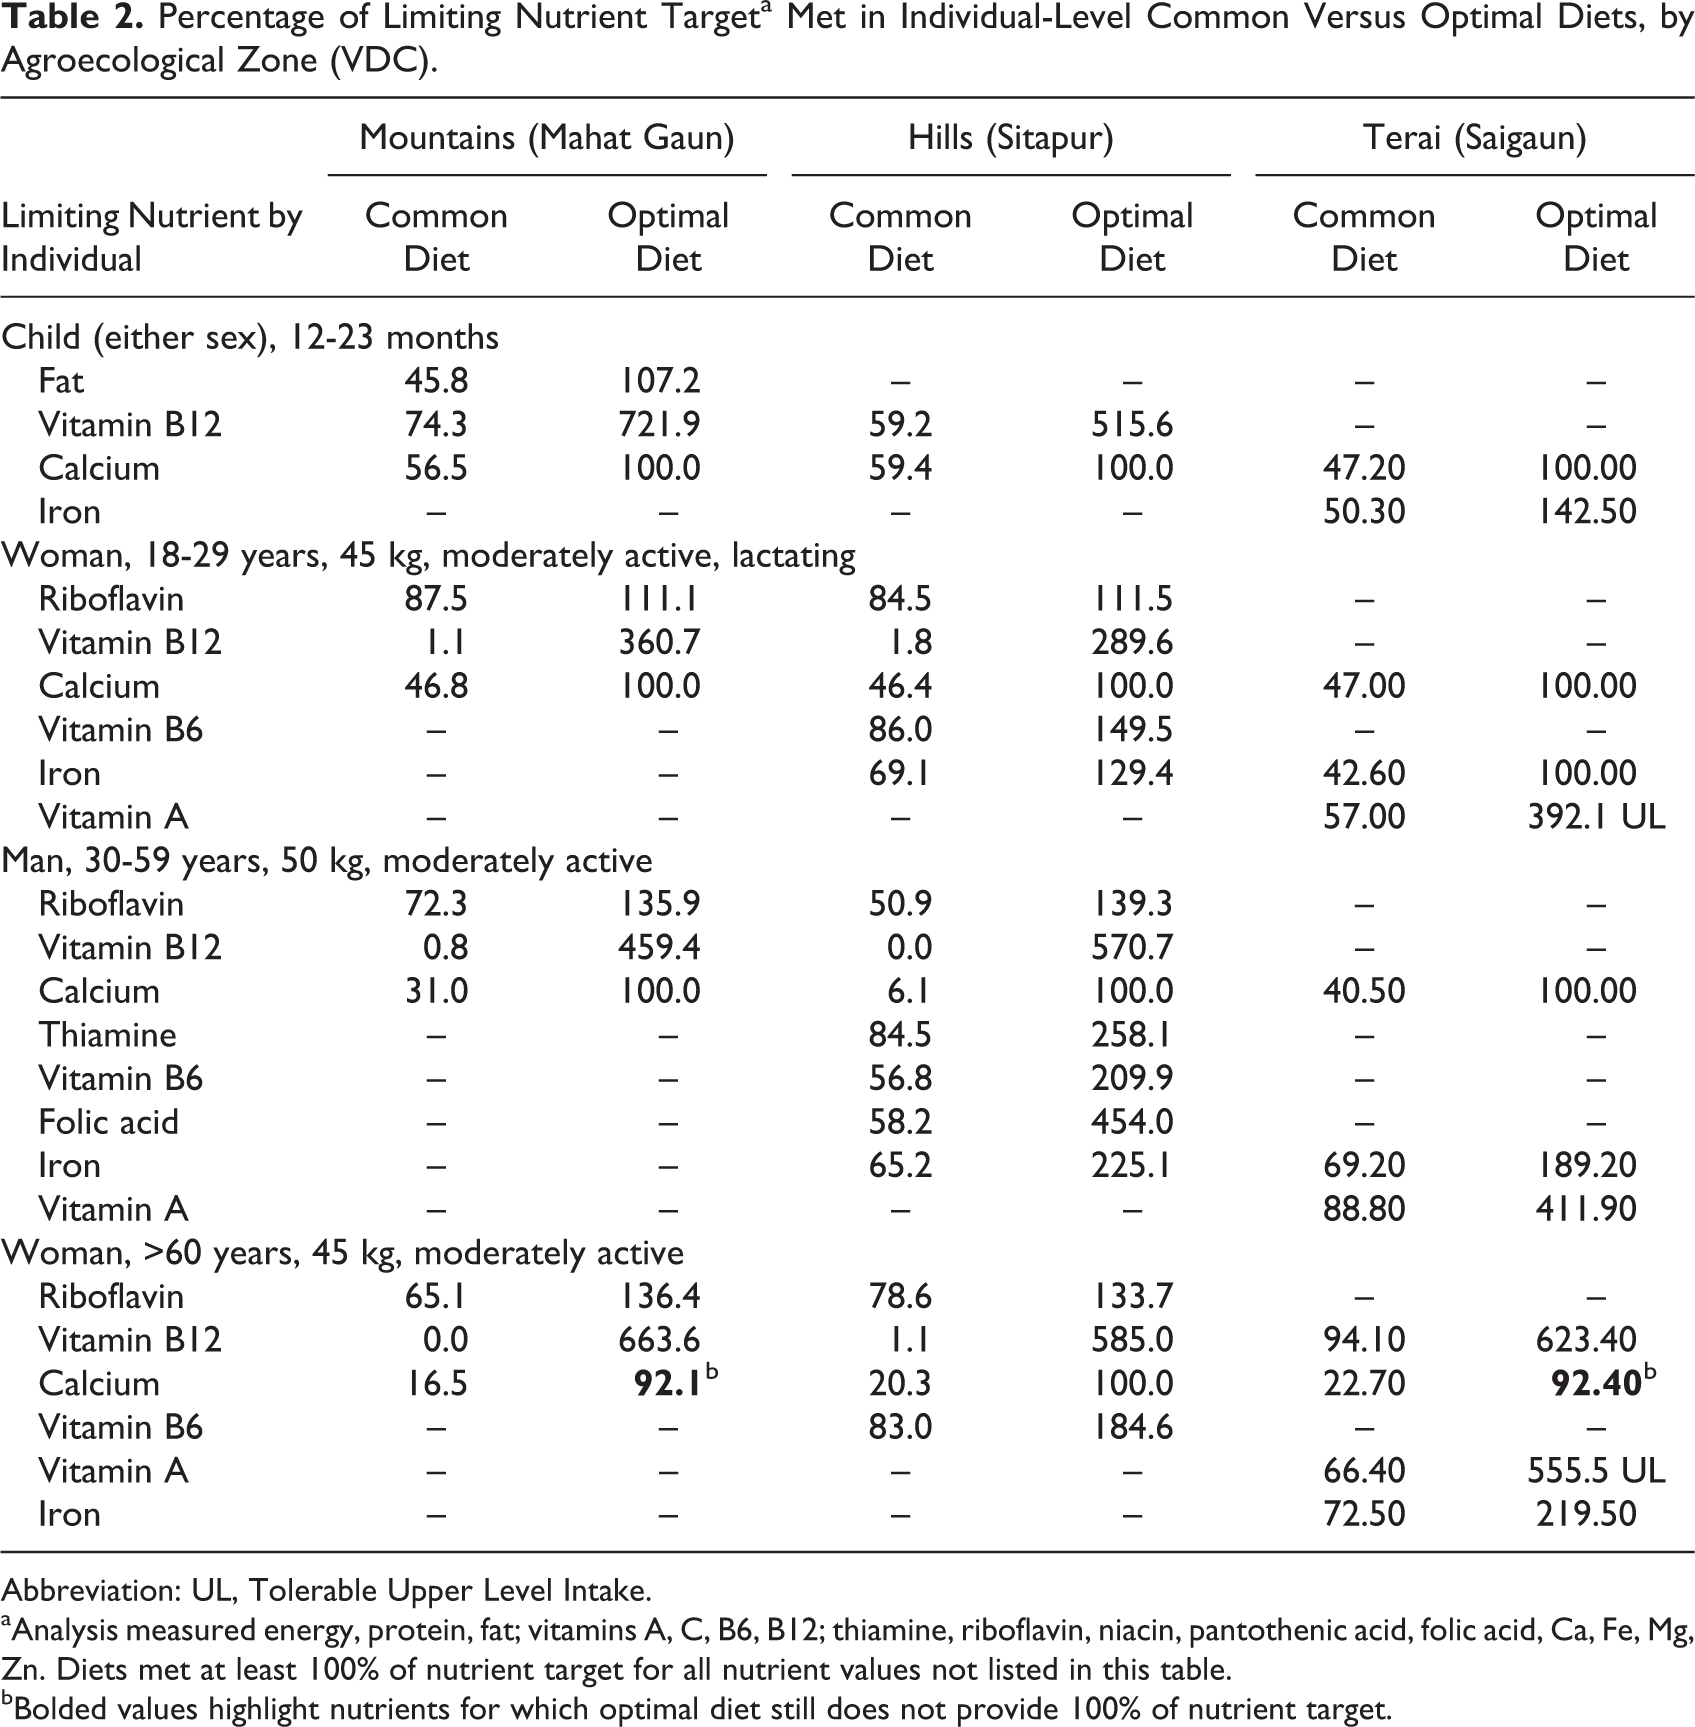
Abbreviation: UL, Tolerable Upper Level Intake.
aAnalysis measured energy, protein, fat; vitamins A, C, B6, B12; thiamine, riboflavin, niacin, pantothenic acid, folic acid, Ca, Fe, Mg, Zn. Diets met at least 100% of nutrient target for all nutrient values not listed in this table.
bBolded values highlight nutrients for which optimal diet still does not provide 100% of nutrient target.
In the hills, all individuals’ common diets were deficient in vitamin B12 and calcium. The common diet contained the highest levels of vitamin B12 for the 12- to 23-month-old child (59.2%) compared with 0% to 2% of the requirement for all other individuals. Calcium deficiency was highest for the older woman (20.3%), but unlike in the mountains and terai, we were able to model an optimal diet for the older woman with sufficient calcium. The man’s common diet contained the most nutrient deficiencies (7 nutrients), whereas the child’s diet contained only 2 limiting nutrients. Adding fish and increasing DGLV consumption for all individuals helped to eliminate nutrient deficiencies. In addition, the child and older woman’s more nutritious diets uniquely include cow milk, and the man’s optimal diet includes an egg but less rice than the common diet.
The common diets for all individuals in the terai lacked adequate calcium and iron. Similar to the mountains, the older woman’s calcium deficiency was greatest, at 22.7% of the requirement. The older woman’s common diet also had a slight vitamin B12 deficiency (94.1%). The common diets for all 3 adults also lacked enough vitamin A, although the child’s diet was sufficient in this nutrient. To model a child’s optimal diet in the terai, like in the other regions, we increased consumption of fish, milk, and DGLVs, as well as cruciferous vegetables and lentils. The younger woman’s diet reached adequacy by including more fish, DGLVs, pumpkin, and buffalo milk.
Vitamin A deficiency was specific to the terai in this analysis. Although vitamin A-rich foods such as eggs and DGLVs were available in this community, 75% of women reported that they did not consume DGLVs in the week prior, so those foods were not included in the common diet. Allowing for higher consumption of these foods and other vitamin A-rich foods than what most women responding to the FFQ reported eating resulted in an optimal diet adequate in vitamin A for the simulated younger woman in the terai household.
For the man’s optimal diet in the terai, we included 3 servings each of fish and pumpkin leaves and added cooked pumpkin and spinach to the diet. In the terai, even with 2 extra servings of fish, an extra serving of paneer, and the addition of cabbage, cauliflower, and DGLVs in the optimal diet, the older woman gets only 92.4% of her recommended daily calcium intake.
Cost of Diets
Household level
Figure 1 depicts the differences in daily cost of household-level common versus optimal diets, by zone. In the mountains, a household with 3 adults, 1 child, and an infant would have to spend 16.5% more for an optimal diet compared to a common diet. In the hills, a household would have to spend 31.0% more to purchase a nutritionally adequate diet. In contrast, in the terai, the more nutritious optimal diet costs 24.1% less than the daily common diet.
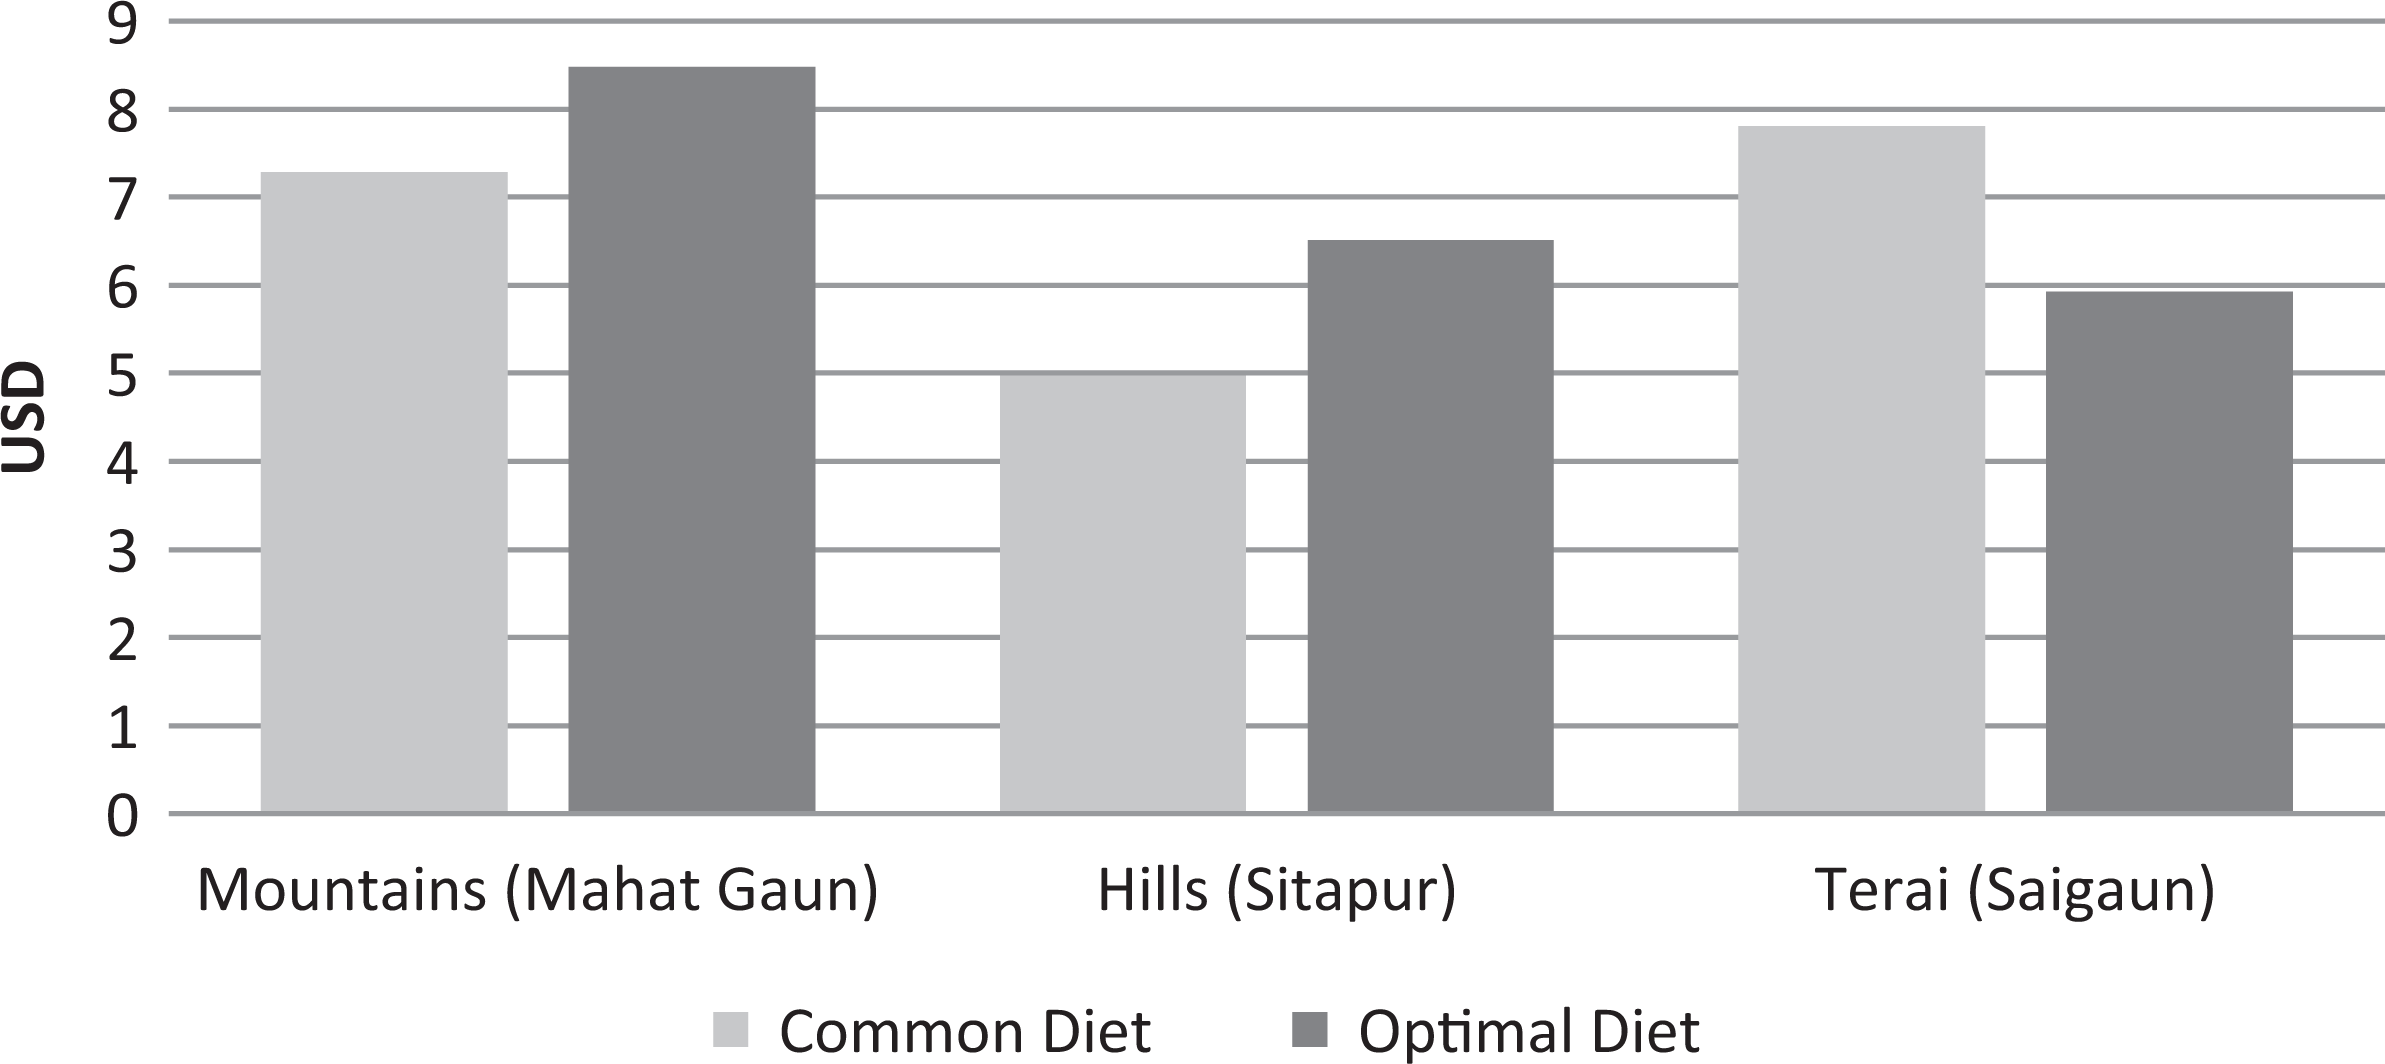
Daily household cost (US$) of common versus optimal diet by agroecological zone (village development communities [VDCs]).
Individual level
As shown in Figure 2, the difference in cost of a common versus optimal diet varies by individual and by zone. For a child aged 12 to 23 months, the daily cost of either diet is most expensive in the mountains and least expensive in the terai. Achieving optimal nutrition is 11.6% more costly in the hills but 24.5% and 14.7% cheaper in the mountains and terai, respectively. For a woman aged 18 to 29 years, the optimal diet is less expensive than the common diet in all 3 zones, by 13.9% in the mountains, 20.8% in the hills, and 51.5% in the terai. A man aged 30 to 59 years in the mountains would have to spend 48.4% more in the mountains and 97.9% more in the hills to buy a nutritious diet. In the terai, however, the optimal diet is 37.8% less expensive than the common diet. The optimal diet is more expensive than the common diet for a woman aged >60 years in all 3 zones, by 65.7% in the mountains, 73.3% in the hills, and 22.2% in the terai.
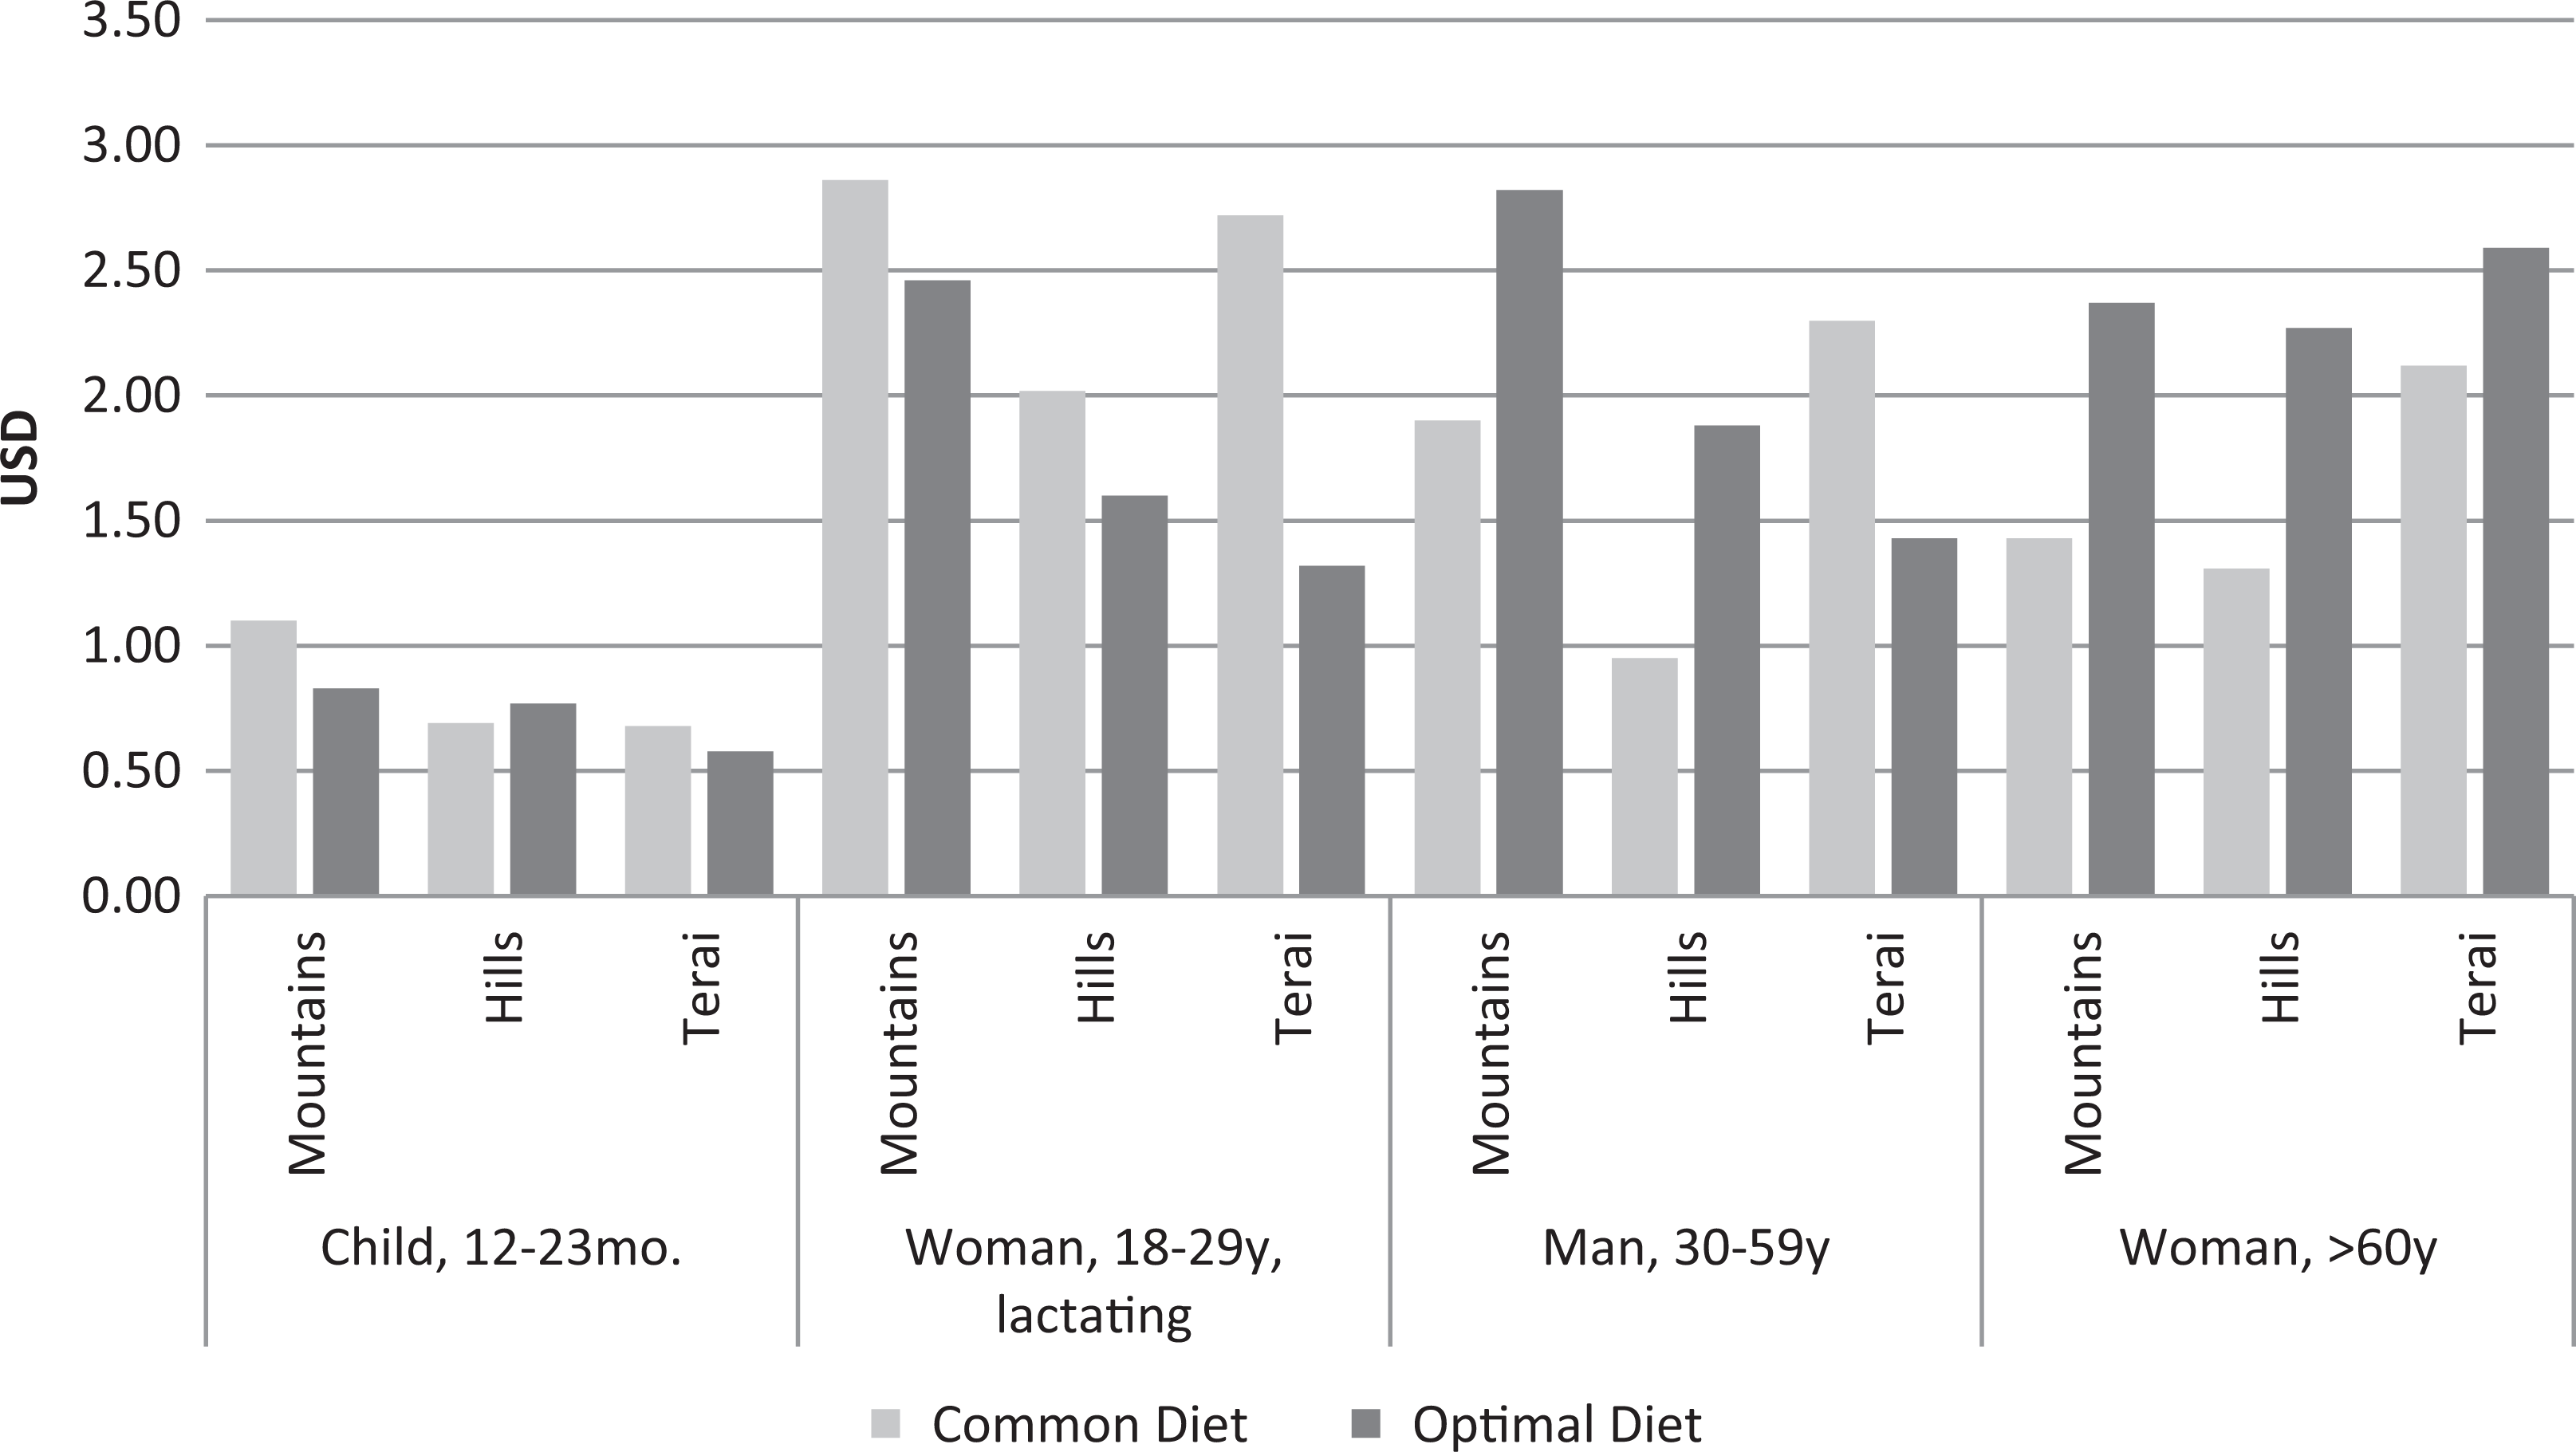
Daily cost (US$) of common versus optimal diet for individuals, by agroecological zone.
Discussion
Using the CoD method to model a commonly consumed versus optimally nutritious diet in 3 different agroecological zones of Nepal allowed us to estimate that current diets in the 3 participating communities lack key nutrients, in particular vitamin B12 and calcium. Calcium was the most common nutrient deficiency in the common diet in all 3 zones. Even the optimal diet often did not meet 100% of the calcium target for a woman over 60 years old, presumably due to decreased calcium absorption for postmenopausal women. 28,29 The common diet also lacked B12 for all individuals in the mountains and hills and for the older woman in the terai. The recurring calcium and vitamin B12 deficiencies shown in this analysis suggest that, even with the best possible combination of foods available, some foods are not eaten enough in the community as a whole, making it difficult for some households to eat a nutritious diet. Increasing maximum consumption limits for dairy, DGLVs, cruciferous vegetables, and fish increased calcium and B12 in the diet for the mountains and hills. The nutritional contrast between the 2 diets was less pronounced in the terai, where the nutrient deficiencies in the common diet were smaller in magnitude and variety than in the other 2 zones. Because Saigaun VDC is close to the India–Nepal border and cheaper markets in India, this terai community may have access to a wider range of nutritious foods.
Adding fish to the diet and increasing DGLV consumption when modeling optimal diets in the mountains and hills was the lowest cost solution to eliminating deficiencies. Small fish were not included in the common diets for the mountain and hill sites because reported consumption of fish in those communities was very low and there were no fish available in the market at the time of data collection. Without adding fish, it was virtually impossible to create a diet that contained adequate levels of calcium and vitamin B12 without compromising other nutrients or grossly distorting the cost. For households in those 2 VDCs to consume fish 2, 3, or even 4 times a day as suggested would require greater fish availability than there is currently. Although fish can be caught wild in mountainous streams and rivers, this practice likely would not be sufficient to supply the quantity of fish consumed in the modeled diets. Aquaculture expansion, particularly for the development of cold-water species that can survive at higher altitudes, could help to expand the availability of fish in Nepal’s mountains and hills. 30,31 Identifying and overcoming barriers to aquaculture expansion and incentivizing rural fishing industries could help to increase the market availability of fish in rural, high-altitude communities. Although we estimated fish prices for the mountain and hill sites, these prices were higher than in the terai to simulate increased expense of fish transport. Locally raised fish in the hills and mountains could be less expensive and therefore reduce the diet cost. Nevertheless, the inclusion of fish in the diet over other animal flesh foods even in the terai points to the value of small fish for improving dietary quality at a lower cost than other animal foods. Additionally, given that a typical meal pattern is based on 3 meals per day, recommending increased fish consumption to 3 or 4 times per day suggests a need to employ social and behavioral interventions targeted at increasing fish consumption within the household.
Households in the hills had the greatest number of nutrient deficiencies in the common diet, in part because the FFQ data used for this VDC were more restrictive than the other 2 zones. For example, the 25th percentile of respondents reported eating cooked rice 14 times in the past week and eating snacks including beaten and puffed rice 6 times. The common diet reflects this by requiring a higher minimum intake level for all types of rice. As a result, there is less room in the diet for other foods that provide essential micronutrients. The optimal diet for the hill site has lower minimum constraints for those foods and therefore more room for a wider variety of more nutritious foods, supporting the importance of eating a diverse diet with a variety of micronutrient-rich and energy-dense foods.
By comparing costs of the common versus optimal diets between zones, we identified significant financial barriers that may prevent households from achieving healthy diets in the mountains and hills. The near absence of red meat or poultry in the lowest cost diets (both common and optimal) suggests that the higher cost of meat may prevent families from purchasing and consuming it and that there are alternative sources of essential nutrients that can provide sufficient nutrients without meat. Small fish, especially when eaten with bones, represents a cheaper source of protein, calcium, and B vitamins than chicken, pork, or buffalo.
That the optimal diet costs more than the common diet in the mountains and hills but not the terai likely reflects the challenges of transporting food to remote, higher altitude areas of Nepal. The reasons for a cheaper optimal diet in the terai are less apparent. The more expensive household-level terai common diet contained 43 separate food items, compared to 22 items in the optimal diet. The terai consumption constraints were more restrictive for the common than for the optimal diet, perhaps due to economic constraints on terai households that may limit regular consumption of nutrient-rich foods, particularly animal products. These restrictions forced a larger variety of foods (in smaller quantities) into the modeled diet to achieve best possible nutrient adequacy. When constraints were relaxed, allowing terai households to consume larger quantities of key foods (such as fish or dairy), but a smaller variety of food items overall, the resulting price was lower than for the common diet. This stark cost difference between current and optimal diets was especially apparent for lactating mothers in the terai for the same reasons—the common diet was more diverse but at a greater financial cost than the optimal diet for that individual. In this case, achieving nutritional adequacy solely through dietary diversification adversely affected the cost and affordability of a nutritious diet. If a more nutritious diet is in fact less expensive in the terai as our research suggests, then achieving nutritional adequacy may be a function more of behavioral change than income generation or healthy food availability.
Assessing cost differences at the individual level allowed us to illustrate how optimal versus actual diets play out at the intrahousehold level. Because households are not unitary enterprises, different individuals in a family have differing nutrient needs and consequently different costs of meeting those needs. Although there were no clear trends in the cost results for the man and child, we saw consistent differences for women. The more nutritious diet was less expensive than the common diet for an 18 to 29 year-old woman in all 3 zones. Given higher nutrient requirements for lactating mothers, this was an unexpected result, possibly explained by the optimal diet’s less restrictive constraints, which allowed for higher consumption of specific nutrient-rich foods like fish and DGLVs at lower overall cost.
At all 3 sites, the cost of diet was higher for the woman >60 years old eating a more nutritious diet, presumably due to her increased nutrient needs. Low-income households with an older family member such as a mother-in-law may struggle to afford foods such as animal products that help meet those higher nutrient needs. Although many nutrition policies and interventions focus on young mothers and children, we must recognize the increased nutrient needs of older individuals and how their needs could affect a household’s ability to provide nutritious diets for all of its members.
Further analysis of these modeled diets and their cost in comparison to household income would show what portion of each community could actually afford these diets.
Limitations
This analysis is a modeling experiment, and therefore, the diets presented are theoretical. In all 3 zones, however, the lowest cost diets calculated by the CoD method consistently contained a rice staple paired with cooked lentils, vegetables, and a combination of dairy, meat, or fish, with cooking oil, seasonings, and salt included in daily intake. This meal pattern is consistent with food customs and availability observed in the study communities, so we conclude that the diets generated by the tool are similar to what people would actually eat.
The inclusion of fish and imputation of fish prices in the diets for the mountains and hills is also a theoretical exercise and limitation of this analysis. We seek only to illustrate what diets might look like if fish was consumed more frequently in those communities and at what cost to a household. Although participating households did not report frequent fish consumption during this season, and no fish were found in the market, fish is occasionally caught wild in mountain streams and rivers and raised on a larger scale in other regions.
The FFQ data provided a snapshot of what women in the study population ate during this particular (postmonsoon) season and provided an empirical basis for setting minimum and maximum constraints in the CoD calculations. Using FFQ data posed challenges for this analysis, however. First, FFQ data reflect what women reportedly ate, not necessarily what they would eat if there were no economic constraints to their dietary choices. The CoD method is designed for the latter situation, but using pile sorting to supplement FFQ information ensured a more comprehensive understanding of the diets consumed in these communities. Second, the CoD formula used to calculate constraints from pile sorting results was less restrictive than the 25th and 75th percentile cutoffs used to set constraints for the FFQ foods. This may have resulted in greater inclusion of the pile-sorting foods in the common diet than FFQ foods. Fortunately, the few foods without FFQ data tended to be rarely consumed, very similar to other FFQ foods, not available in the market, or of lower nutritional value. Consequently, they do not appear to be overrepresented in the calculated diets. Finally, because PoSHAN FFQ data were not available for other household members, we extrapolated women’s FFQ responses to provide a basis for setting a range of minimum and maximum consumption constraints for all adult household members. If, as previous research suggests, within the household women are allocated less nutritious foods than men in rural Nepal, then the true diets for other members could be more nutritious than the diets in this analysis. 32 Although initial minimum and maximum constraints for consumption frequency of each food item (for the common diet) were based on what the middle 50% of women reported eating and the same for all adult individuals, as explained above, the portion sizes and resulting modeled diets for each individual were specific to the gender, age, and energy profile of each individual.
It is also important to note that the cost analysis was done based on the foods available in local markets and did not account for in-kind donations or production costs of homegrown foods. The true cost of either diet might be less than these modeled diets, if it is more economical for a household to grow certain food items themselves. Because these data were collected in the postmonsoon season, which is considered a “lean” season in Nepal, estimating purchased diets is more realistic than for other seasons. Other research suggests that households rely more heavily on purchased food in the lean season because households have not yet harvested edible crops. 9 Therefore, modeling purchased diets may more accurately reflect diets than in more bountiful seasons. Further analysis comparing the cost of home-produced versus purchased food items would, however, provide valuable information on the costs and benefits of encouraging the home production of more nutrient-rich foods.
Finally, because the CoD method uses the EAR to establish nutrient adequacy for energy, if every individual consumed 100% of the EAR, energy intake would still be inadequate for 50% of the population, meaning that actual calorie requirements for some people in the study population may be higher than indicated here and a more nutritious diet would require higher energy intake, at a potentially higher cost. Setting micronutrient and protein requirements at the default 95th or 97.75th percentiles may have driven up the cost of the diet and required more micronutrient-rich foods than some individuals may need.
Conclusion
Using FFQ data from a site-specific study complemented by local women’s discussions provided an opportunity to compare the cost and nutrition of what is commonly eaten with what could be eaten in rural Nepal households—a function of the CoD tool that has not as yet been documented. By comparing a commonly eaten diet with a more nutritious, yet locally appropriate diet in VDCs in 3 different agroecological zones of Nepal, we estimated that the lowest cost diet commonly eaten by participating households in the study sites lacks key nutrients. The common diet for a household is particularly deficient in calcium in all 3 zones and vitamin B12 in the mountains and hills, suggesting a need for food-based dietary and agricultural interventions that introduce lower cost animal and fish products into the diet and encourage more DGLV and cruciferous vegetable consumption. Providing adequate calcium is especially challenging for postmenopausal women in these communities. Our results suggest that postmenopausal women may have higher cost diets, but young mothers may be able to achieve dietary adequacy at a lower cost if key foods are available. Given the CoD tool’s inability to simulate a low-cost and 100% adequate diet for older women, nutrition policies and interventions should recognize the higher nutrient and cost burden of a postmenopausal woman’s diet as well as that of young mothers and children.
The results of this study are hypothetical but suggest what could be achieved if dietary and aquaculture interventions expanded widespread fish consumption and availability beyond the terai. Supporting aquaculture research and development for cold-water fisheries in Nepal’s hills and mountains may improve diet quality in those regions. Similarly, the higher cost of all diets in the mountains points to a need for more investment in infrastructure in that zone, which would allow the more frequent and potentially less expensive transport of nutrient-rich foods from field to market, improving low-cost nutritious food availability.
Increasing availability of nutritious foods is not the only challenge presented by this analysis. The low DGLV and fish consumption reported by certain households could also be due to cultural or social food consumption practices. Interventions aimed at increasing consumption of such foods would complement policy changes and research aimed at increasing availability in the mountains and hills. Social behavioral interventions also could help shift diets in the terai toward more nutritious ones, especially if, as we estimate, a more nutritious diet could actually cost less than what is currently consumed.
Including these considerations in nutrition and agriculture policies, as well as investigating affordability and including a broader sample representative of different ethnic groups, agroecologies and farming systems could further inform agriculture, nutrition, and economic policies to improve food security and nutrition in Nepal.
Footnotes
Authors’ Note
E. Biehl planned and implemented women’s group discussions, analyzed data, and is the primary author of the article. S. Manohar and R. Klemm provided intellectual input and with K. West, P. Webb, and D. Gauchan oversaw PoSHAN data collection.
Acknowledgments
The authors thank the PoSHAN Community Studies team who supported data collection and provided valuable intellectual input. Save the Children UK provided technical support for the Cost of the Diet tool.
Declaration of Conflicting Interests
The author(s) declared no potential conflicts of interest with respect to the research, authorship, and/or publication of this article.
Funding
The author(s) disclosed receipt of the following financial support for the research, authorship, and/or publication of this article: The United States Agency for International Development funded this study through the US Borlaug Fellowship in Global Food Security and the Feed the Future Nutrition Innovation Lab.