
Abstract
Background:
Childhood obesity is currently one of the major concerns in pediatric field. In recent literature, correlation of obesity with some behavioral factors such as physical activity (PA) received attention.
Objective:
The purpose of this study was to determine the relationship between body mass index (BMI) and PA.
Materials and Methods:
This cross-sectional study was carried out in 2012 on 548 randomly selected 7- to 11-year schoolchildren from Zahedan, Iran. The underweight, normal weight, overweight, and obesity status were all based on BMI percentiles for age and sex. Moderate to vigorous PA during the previous 7 days was assessed by a modified version of the Physical Activity Questionnaire for Children.
Results:
The prevalence of underweight, normal weight, overweight, and obesity among the participants was 18.3%, 47.9%, 11.8%, and 22.1%, respectively. Overweight and obesity were significantly higher among girls than boys. Mean PA score in participants was 2.4 ± 0.5. The results showed the PA score was significantly higher among boys than girls. The PA score had a significant association with BMI (P = .018), and it was greater in normal participants than in obese participants.
Conclusion:
On the basis of observed data and due to the impact of PA on BMI as an indicator of nutritional status and health, teaching children to have better nutrition and lifestyle changes is very important. Therefore, more studies should focus on childhood obesity prevention programs to prevent nonoverweight children from becoming overweight or obese in the future.
Introduction
Childhood obesity is one of the major concerns in pediatric field. 1 Combination of increased caloric intake and decreased energy expenditure would causes obesity. In recent literature, correlation of obesity and some behavioral factors such as physical activity (PA) received attention. 2
World Health Organization estimates, by 2020, noncommunicable diseases would account for approximately three-quarters of all deaths in the developing countries. 3 Focusing on childhood precursors of obesity is increasing due to the behavioral and biological risk factors which might be an important risk factor for obesity in later life. 4 Therefore, highlighting PA among youth as a key factor in achieving efficient weight status would help them to prevent obesity in the future. Several studies have proven that sedentary behavior during childhood leads to a more passive lifestyle in the adulthood period. 5,6
Decreasing the level of PA may have a significant role in increasing childhood obesity rates. Although adults have been shown to overrate the level of PA of youth, most data support that the most children tend to be physically inactive. 7
Today’s reduced PA and sedentary behaviors, such as television viewing, using computer or playing video games, act as key factors of current obesity epidemic. 8 -11
Several studies suggested an active lifestyle might have an important role in optimizing growth and development during childhood and adolescence. 1,12 Baranowski et al, recently recommended comprehensive programs in school and community to advance PA among children and adolescents. 13
There are contradictory results on relationship between PA and weight changes especially among overweight children and adolescents. 10,14 -16
One of other concerns is role of parents in educating healthy lifestyle behaviors among their children. Evidence showed the education level of parents is positively related to the prevalence of optimal PA level. 17
Children of less educated parents with low income consume poor nutrient and energy-dense beverages more frequently instead of nutrient-dense beverages. 18
Although previous studies have determined the association between PA and overweight in developed countries, it is not clear if their findings can be generalized to other ethnic groups in different regions of Iran. Due to little research in these parts of Iran on children as well as different religious factors plus local and traditional factors besides other problems in the region, the aim of our study was to figure out the relationship between body mass index (BMI) and PA.
Materials and Methods
Study Participants and Geographical Area
In a cross-sectional study in 2012, data were collected from elementary schools at Zahedan (center of Sistan and Baluchistan province), Iran. This province is located at the southeast of Iran. This province is at the borderline of Pakistan and Afghanistan countries. All the selected children were Iranian. There are 2 ethnic groups in this part of Iran, Shiites and Sunnis, both of which are Muslim. In a stratified multistage random cluster study, 548 children of 7 to 11 years from 14 primary schools at Zahedan, Iran, were included. At the first phase, schools were divided into 2 regions (region 1 include 7 schools and region 2 include 7 schools) based on governmental decision. Each region considered as a stratify. In second phase, in each region the number of governmental and nongovernmental schools as well as the number of girls and boys schools were determined .Then the schools in each category were considered as a cluster, separately. Proportional sampling of size was used based on the regions and kind of schools. In the tertiary phase, in each school, the samples were chosen by considering proportion population in each class grade by randomization.
Measurements
A questionnaire including age, gender, weight, height, and parents’ level of education was completed for each participants. Informed consent was obtained from all participants and their parents. In all selected schools, the trained research staff completed the questionnaire for each participant directly. They were completed through interviews with students and/or their parents and by direct measurement of student height and weight. Parents’ levels of education were provided to researchers by parents. For selected sample size, their parents were invited by letter to come to schools on definite days during the week and interviews were done with their parents at school. The invited parents who didn’t like to participate in the study were excluded from the study also.
Body mass index calculated as the weight in kilograms divided by the square of height in meters (kg/m 2 ). Body weight was measured to the nearest 0.1 kg using a SECA digital scale. All of measurements were done by a trained staff and instruments were regularly calibrated during work. Height was measured to the nearest 0.5 cm using a wall-mounted stadiometer. Participants were standing without shoes and head in horizontal Frankfort plane. 19 Status of underweight, normal weight, overweight, and obesity were based on BMI percentiles for age and sex as proposed by standard CDC (CDC-2000). BMI of children and adolescents aged 2 through 20 years at or above the 95th percentile of BMI for age was labeled “obese,” between 85th and 95th percentiles was labeled as “overweight” and between 5th and 85th percentiles was labeled as “normal weight” and less than 5th percentile were considered as “underweight.” 20
Physical activity
The Physical Activity Questionnaire for Older Children (PAQ-C) is a self-administered, 7-day recall questionnaire. PAQ-C is suitable for elementary school-aged children who are in the school system currently and have playtime as a regular part of their school week. The original instrument used 9 questions to assess a child’s PA in a variety of situations and times (eg, school, playtime, after school, evening, weekend). Each of the items are scored on a 5-point Likert scale (activity minimum score of 1, activity maximum score of 5), and the average of the items is used to reflect the general PA level during the previous 7 days. 21
Statistical Analysis
Statistical tests were performed using SPSS/PC statistical program (version 15 for Windows). The t test was used for comparison of differences between groups. Analyses of variance were used to determine significant differences of PA and BMI category. χ2 test was used to determine significant differences of BMI category and parents’ level of education. Pearson correlation coefficient (r) was used to measure the degree of association between PA and age. Linear regression analysis was used to explore the predictive power of sex, PA, grade of education, parents’ educational level, and the kind of school (independent variable) in relation to BMI (dependent variable). All mean values were presented as mean (SD). A value of p <.05 was considered as statistically significant.
Results
This study included 548 children 7 to 11 years (292 girls and 293 boys). The prevalence of underweight and normal weight were 18.28% and 47.85%, respectively. Overweight and obesity was seen in 11.79% and 22.04% of participants, respectively. Among boys, BMI indicated underweight, normal weight, overweight, and obesity in 11.11%, 29.91%, 2.56%, and 6.49% of cases, respectively. These proportions were 7.17%, 17.94%, 9.23%, and 15.55% for underweight, normal weight, overweight, and obesity, respectively, among girls. Gender had a significant association with BMI (P < .0001). The results showed the overweight and obesity were significantly higher among girls than boys. The mean PA score in boys and girls were 2.51 (0.51) and 2.29 (0.47), respectively. The results showed the PA score was significantly higher among boys than girls (P < .0001; Table 1).
The Relationship Between Gender, BMI, and PA in Children Aged 7 to 11 Years at Zahedan in 2012.
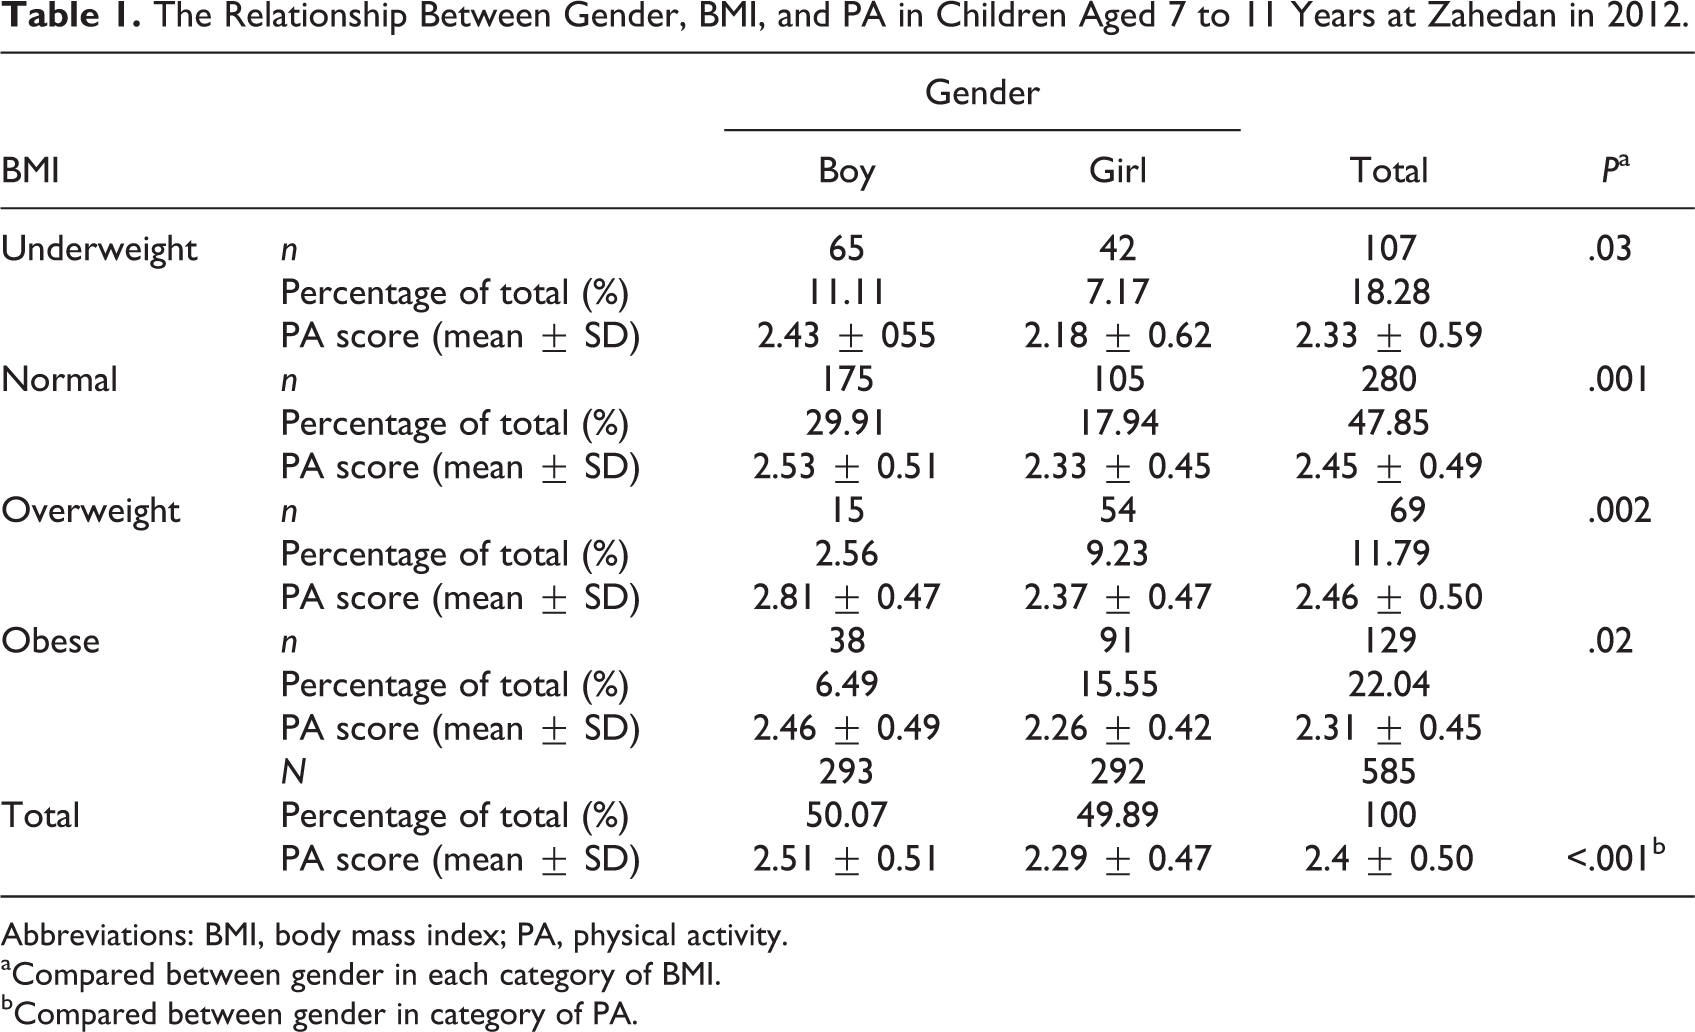
Abbreviations: BMI, body mass index; PA, physical activity.
aCompared between gender in each category of BMI.
bCompared between gender in category of PA.
The PA score had no significant association with age (P = .349, r = .039). The mean PA score according to BMI status of the studied participants was 2.40 ± 0.5 (underweight, normal, overweight, and obesity were 2.32 (0.58), 2.45 (0.49), 2.46 (0.5), 2.31 (0.45), respectively). The PA score had a significant association with BMI (P = 0.018). Results showed that PA score was greater in normal participants compared to obese participants (Table 2).
The Mean PA Score According to BMI in Children Aged 7 to 11 Years at Zahedan in 2012.a
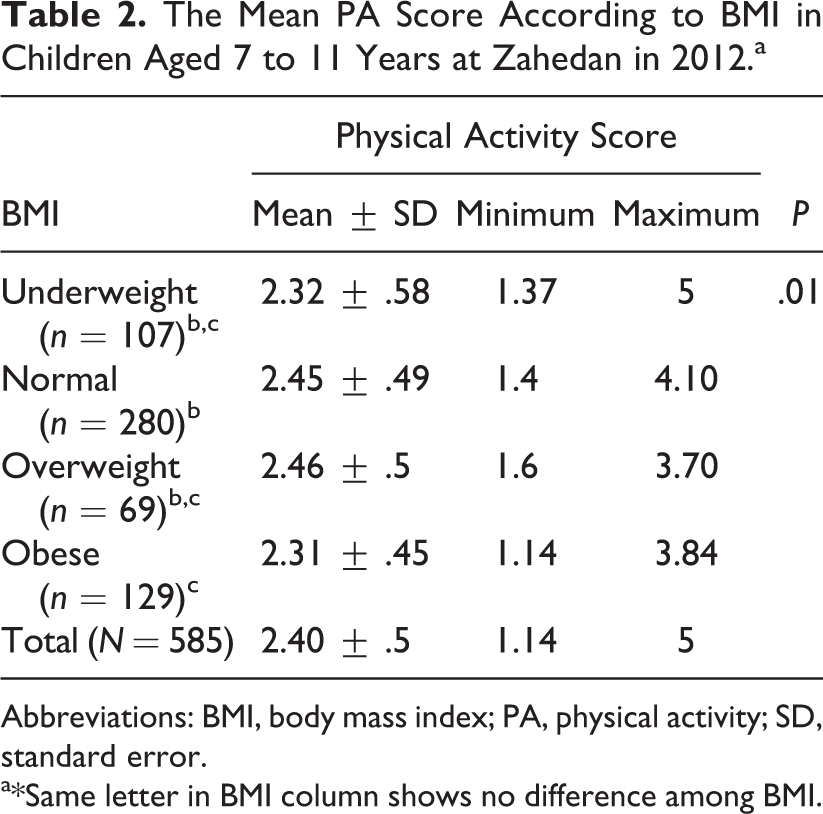
Abbreviations: BMI, body mass index; PA, physical activity; SD, standard error.
a*Same letter in BMI column shows no difference among BMI.
The results showed that parental education level had no significant association with BMI (Tables 3 and 4). Although paternal education had no significant relationship with PA score (Table 3), maternal education had significant relationship with PA score (p = 0.04). Also, results showed that PA score in mothers with diploma was greater than ones with middle school education (Table 4).
The Relationship Between Paternal Education Level With BMI and PA in Children Aged 7 to 11 Years at Zahedan in 2012.
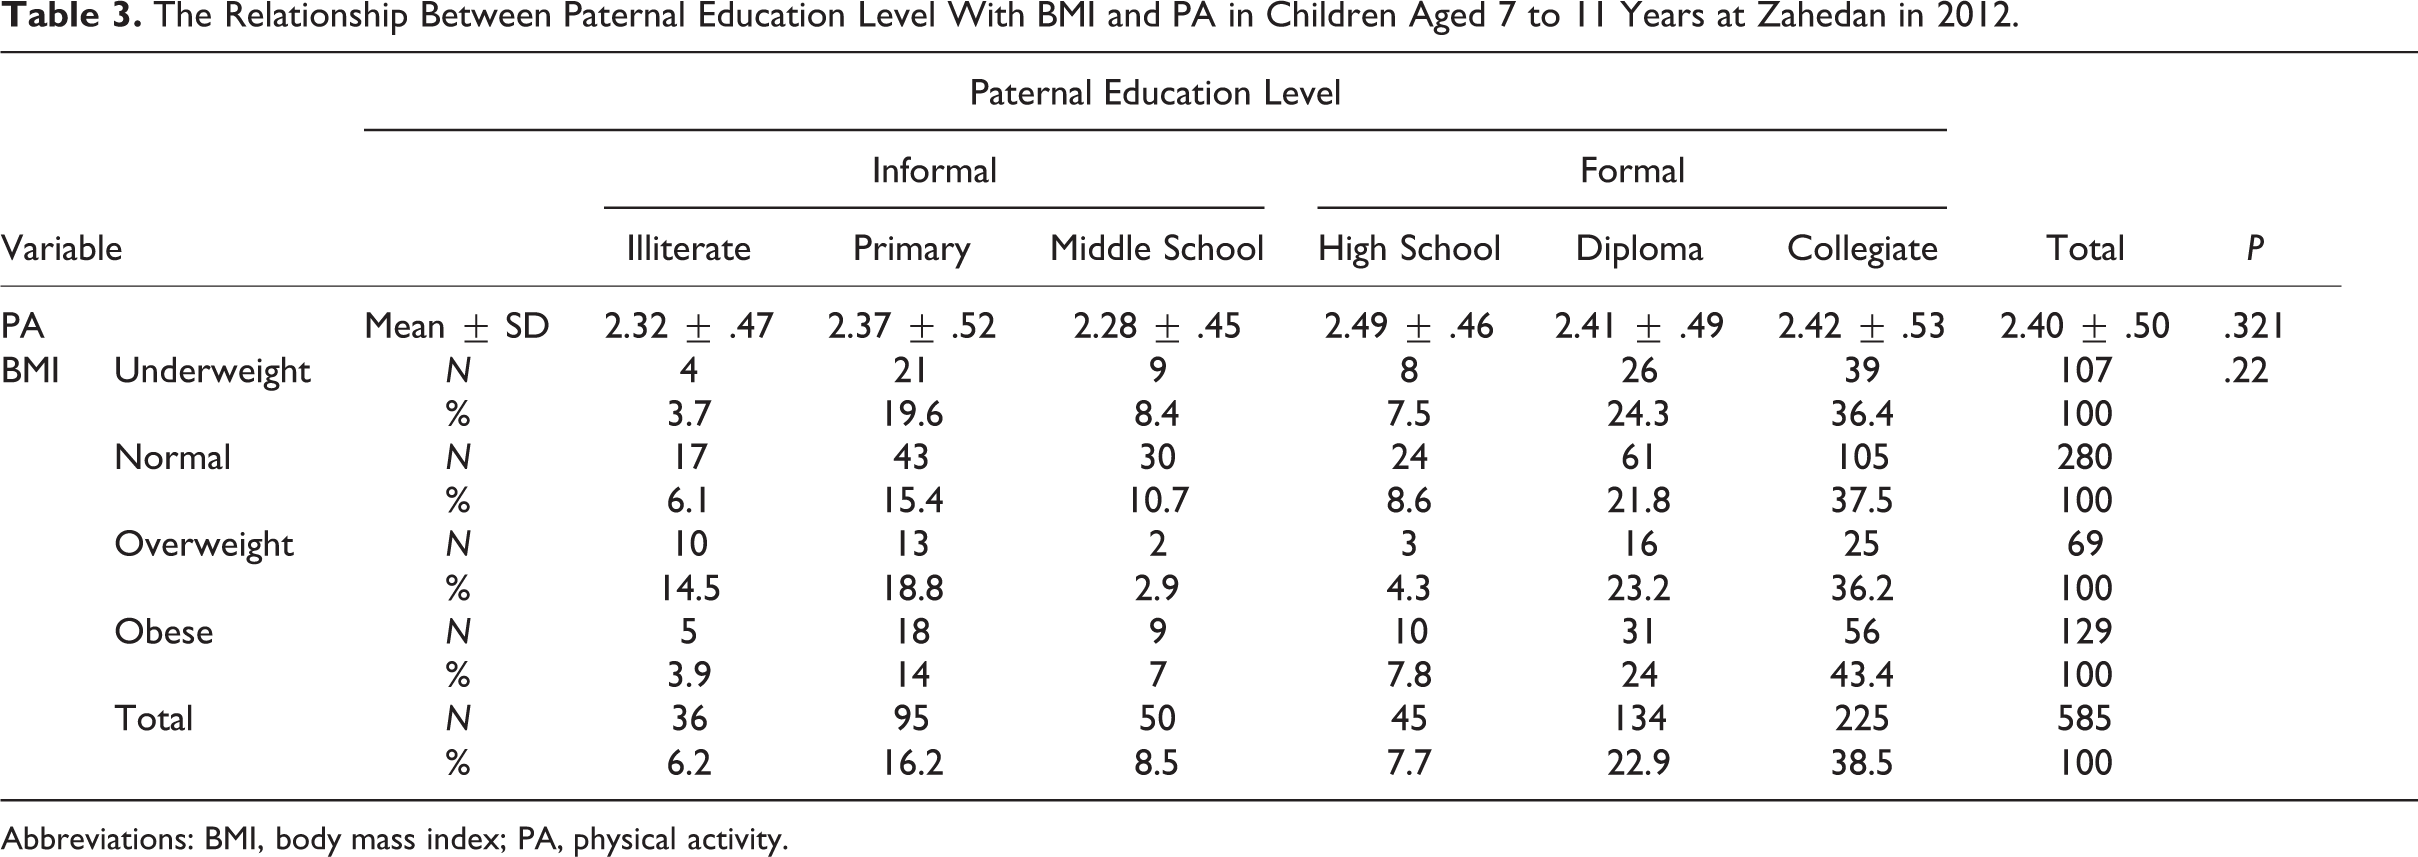
Abbreviations: BMI, body mass index; PA, physical activity.
The Relationship Between Maternal Education Level With BMI and PA in Children Aged 7 to 11 years at Zahedan in 2012.
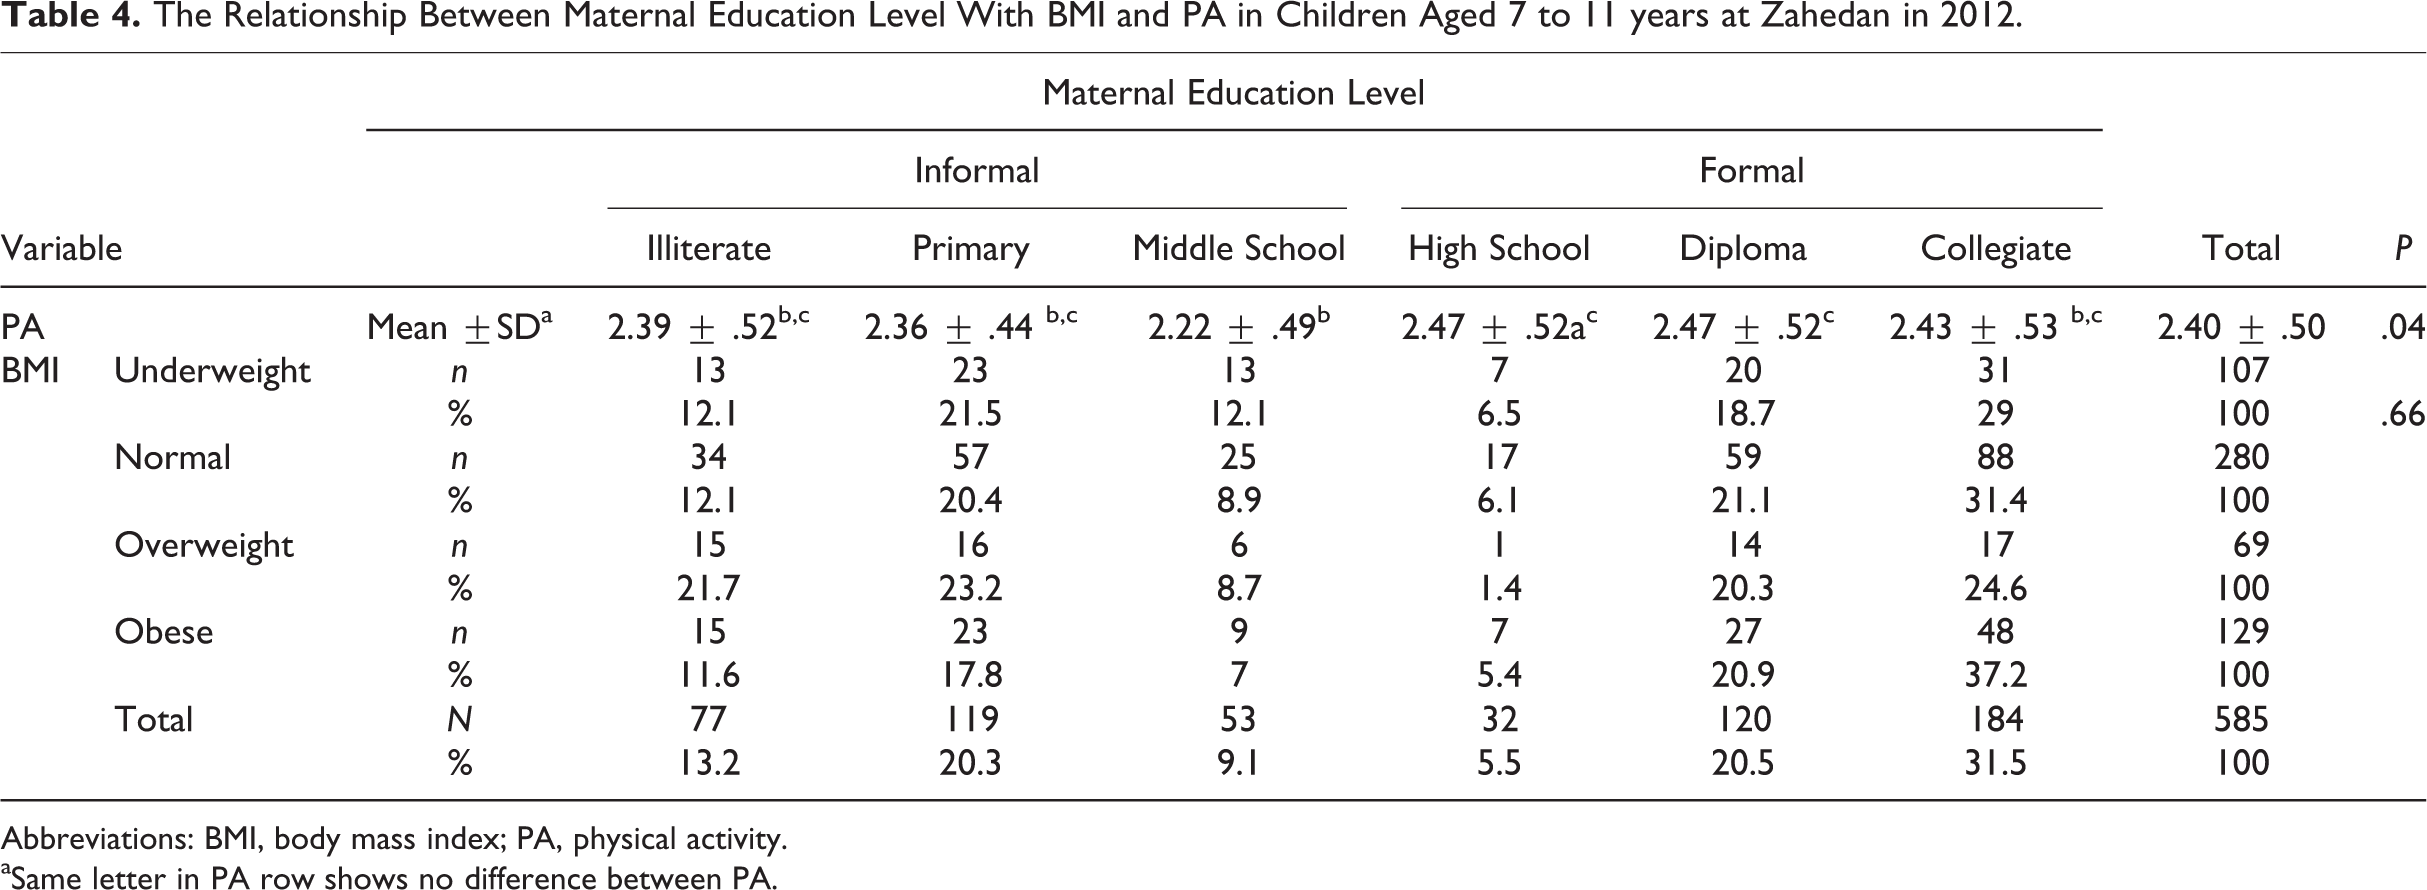
Abbreviations: BMI, body mass index; PA, physical activity.
aSame letter in PA row shows no difference between PA.
The results showed no relation among those independent variables, except sex and BMI, hence we didn’t show in the article (r = .299; R 2 = .089), nevertheless the results were shown in Table 5.
Linear Regression Analysis of Sex, Age, Physical Activity, Grade of Education, Parents’ Education, and Kind of School With BMI.
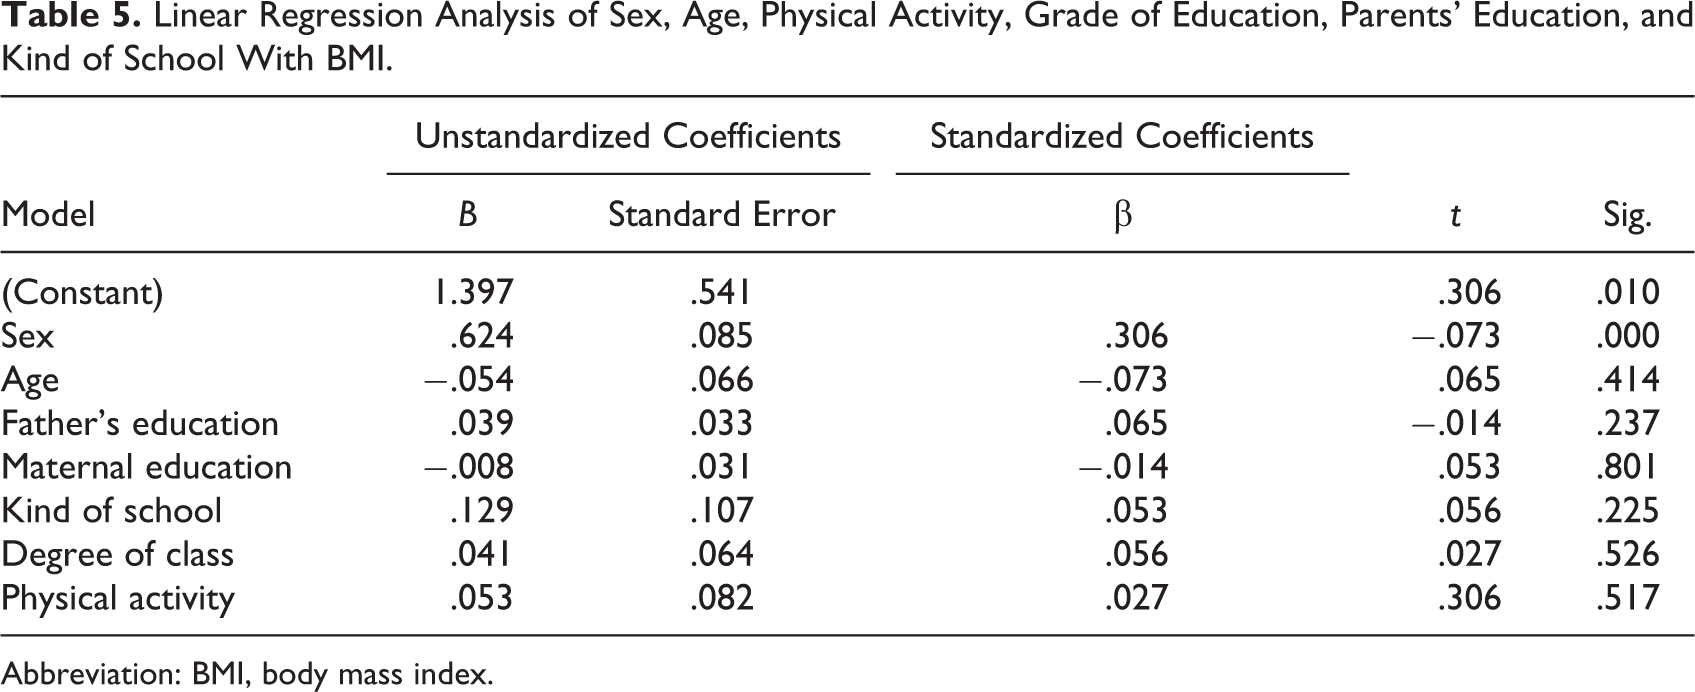
Abbreviation: BMI, body mass index.
Discussion
The results of current study showed that prevalence of underweight, normal weight, overweight, and obesity among the participants was 18.28% (11.11% of boys and 7.17% of girls), 47.85% (29.91% of boys and 17.94% of girls), 11.79% (2.56% of boys and 9.23% of girls), and 22.04% (6.49% of boys and 15.55% of girls), respectively. The current study showed that gender has a significant association with BMI and girls who are more overweight and obese than boys. In the study by Mohammadpour-Ahranjani et al, 22 the prevalence of overweight and obesity in adolescent Tehranian students was 21.1% and 7.8%, respectively. Also, their research showed prevalence of overweight among girls (23.1%). In another study by Kelishadi et al, 23 the prevalence of underweight, normal weight, overweight, and obesity in a national sample of Iranian children and adolescents were 13.9% (8.1% of boys and 5.7% of girls),72.7% (36.6% of boys and 36.2% of girls), 8.82% (4.3% of boys and 4.6% of girls), and 4.5% (2.5% of boys and 2% of girls), respectively, and there was no significant association between gender and BMI. In yet another study by Ogden et al, 24 the prevalence of overweight and obesity in the US children aged 6 to 11 years was 34.2%, with higher prevalence among girls (35.2% of girls and 33.2% of boys were overweight and obese). On the other hand, in a study by Karajibani et al 25 from different areas of Zahedan, a high prevalence of malnutrition was reported in this region, compared to obesity. The results of current study showed an increasing trend of obesity in the region. According to previous studies, the number of people with overweight and obesity has been increasing in developing countries as well as developed countries. 26 As a result, overweight and obesity is a health and nutritional problem in the world and in Iran. According to the results of the above research, the high percentage of obesity among girls could be attributed to poor eating habits including excessive consumption of cereals and fats.
In current study, the level of PA was higher in boys than in girls. In several studies, PA levels have been significantly higher in boys than in girls. 27 -30 In a study by Karppanen et al, 31 PA levels were higher in normal weight boys (2.91 (0.64)) compared to normal weight girls (2.59 (0.68)), but the differences were not statistically significant. In other research by Ostojic SM et al, 32 correlation between fitness and fatness in 6- to 14-year-old Serbian children was evaluated. Results showed boys had significantly lower BMI, waist circumference, and body fat compared to their female counterparts. The authors emphasized the necessity to identify children with weight problems and to develop early interventions for improving PA in children and prevention of childhood obesity. In a study by Abbott et al, 33 PA level had no significant difference between boys and girls. According to this study and other studies, exercise is higher in boys than in girls. Less PA in female than in male may be attributed to some local cultural, religious, and traditional beliefs, limited resources in sports field especially defined for women, less advertisement, and attractive program television and magazine for women gym and too much supervising of children by parents. All these factors may have some role in little participation of girls in PA programs. Thus, our findings suggest that Iranian females may be a good target for PA intervention to engage more in PA by teaching family and support from government.
There was a significant relationship between BMI (p = .018) and PA score in normal participants compared to obese participants, although the PA score had no significant differences in underweight and overweight participants. Many studies have shown that obese children are less physically active than nonobese children. 14,31,34,35 In another study conducted by Zalilah et al, 27 no significant differences at the activity level in the 3 groups of underweight, normal weight, and overweight were found. The findings from this study were contrary to the results from other studies. 10,14 -16 Therefore, PA can affect BMI.
In the current study, although the risk of obesity increased with higher education levels of parents, but parental education (father and mother) had no significant relationship with BMI. Goldman et al 36 found no relationship between parental education and obesity among a sample of Los Angeles Mexican American adolescents, similar to the results of our study. While in several studies, a significant association between parental educational level and BMI 14,37 was found. In the study by Danielzik et al, 38 there was an inverse association between parental educational level and frequency of overweight.
Parents play an important role in educating their children with healthy lifestyle behaviors. Evidence showed parental education could be a strong socioeconomic gradient related to eating behaviors and television viewing time. The finding of our study showed that mother’s education level has a significant influence on the PA of children . In the review by Van der Horst et al, 39 parent education was found to have direct association with adolescents’ PA. Kantomaa et al 40 reported high levels of parental education were associated with more activity in adolescents. However, in other research, children of higher educated mothers (tertiary vs primary/secondary) spent less time in moderate to vigorous PA and had more time in sedentary behavior. 41 Results on the association between parental and child PA levels are contradictory. Although better knowledge of relationship between social class and childhood obesity would lead to clear hypotheses about the relationship between parental education and PA. In the current study, maternal education had significant relationship with PA score. In this region of Iran, men are more involved in earning money and preparing better life for the whole family compared to women, even if the mother has a job opportunity. Men are spending more daily time outside home, and mother at home plays an important role in educating and guiding children.
In the current study, no significant positive relationship between PA and age was found. Hinkley et al 42 did not find a significant association between age and objectively measured PA, but Pfeiffer et al 43 showed that higher amounts of PA were positively related with age. Also, Walton et al 44 reported with increasing age, the level of activity is less among high school girls. However, some intervention programs in school system showed implementation strategies of short-term activity may have a beneficial effect on body fat percentage and cardiovascular fitness among overweight/obese children. 45
The current study has some strength. First, the study represents Zahedan region, which is central and one of the cultural heterogeneous parts of the country. Also, the study was performed by the same trained research team using standard tools for measuring PA. Of course, the study had some limitation. The research was undertaken in urban area of Zahedan, and our findings might not be representative of the entire students’ activity patterns and health in Sistan and Baluchestan province and Iranian children. Also, the study was based on self-reported PA measures rather than the objective measures of PA.
Conclusion
Based on the findings of recent study, there was a significant association between the level of PA with BMI, mother’s education level, and gender. Also, there was no significant relationship between BMI with parents’ educational level. Due to the impact of PA on BMI as an indicator of nutritional status and health, teaching children to have better nutrition and lifestyle changes is very important especially in this part of Iran. Therefore, future studies should focus on childhood obesity and childhood obesity prevention programs to prevent nonoverweight children from becoming overweight or obese.
Footnotes
Acknowledgments
We would like to thank all who participated actively in this project especially Miss Hediyeh Kafami khorasani, Mr Mostafa Arabi, and Mr Alireza Najafi for their invaluable help.
Declaration of Conflicting Interests
The author(s) declared no potential conflicts of interest with respect to the research, authorship, and/or publication of this article.
Funding
The author(s) received no financial support for the research, authorship, and/or publication of this article.