
Abstract
Background:
The Household Dietary Diversity Score (HDDS) was developed to measure household food access, one of the levels of food security. Previous research has shown dietary diversity is related to food security. However, the validity of the HDDS in the form developed by the Food and Nutrition Technical Assistance (FANTA) project—12 food groups, 24-hour recall—and most frequently used by development organizations and nongovernmental organizations has never been verified.
Objective:
To verify the construct validity of the HDDS.
Methods:
A Rasch model was used to test the extent to which the HDDS meets the criteria required for interval scale measurement, using data from 1015 households in Colombia and Ecuador.
Results:
Different dietary patterns between Colombia and Ecuador and 2 cultural groups within Ecuador required data to be split into 3 subgroups. For each subgroup, the food groups meeting the criteria and their difficulty ranking were different. Refined indices, containing only those food groups meeting the criteria, contained 7 items in Colombia, 10 for Kichwa households in Ecuador, and 9 for migrant households.
Conclusion:
The indicator in its current form does not meet all criteria. Even when analyzing culturally homogenous subgroups within a small region, the components of the indicator do not form a reliable way of measuring household-level food access.
Introduction
Although the definition of food security formed at the 1996 World Food Summit 1 is widely adopted, disagreement remains on the indicators that assess, quantify, and qualify food security and on how to operationalize these indicators at national, household, or individual level. 2 –5 Food security is measured in different ways. For example, anthropometric measures are used to monitor the growth of children younger than 5 years 2 ; recalls of food consumed in the past 24 hours or over a longer reference period are recorded to measure the intake of macronutrients and micronutrients 6 ; and data on food expenditure are used to define food poverty lines, 7 whereas experience-based responses such as the Household Food Insecurity Access Scale (HFIAS) elicit perceived consequences of not having enough food. 3 Research institutions and development organizations alike apply such indicators to identify food insecure households or analyze effects of interventions on food security. 3
The Household Dietary Diversity Score (HDDS) is a frequently used indicator of food security. It was developed as a quick-to-implement and easy-to-use survey-based indicator to measure the impact on household food access of programs with improvements in food security as their core objective. 8 The second version of the accompanying guide mentions that “An increase in the average number of different food groups consumed provides a quantifiable measure of improved household food access. In general, any increase in household dietary diversity reflects an improvement in the household’s diet,”8(p6) which suggests the HDDS might be used as a household-level indicator of food security—indeed, it is frequently used as such. 5 However, the validity of the HDDS has never been verified, making it impossible to substantiate claims that it is a useful indicator of food security. The objective of this article is to fill this glaring gap.
Rasch models were used to verify the construct validity of the HDDS. These models were specifically developed to test whether an additive scale consisting of several items measuring a single underlying construct meets the criteria required for interval scale measurement. 9 This approach differs from most other statistical techniques in that it starts from a mathematical model which meets the required criteria and tests the extent to which the data fit the model. When the data do not fit the model, it is not the model but the data which is considered wrong. By assessing the deviations of the HDDS from the criteria, specific shortcomings of the indicator can be highlighted. In effect, Rasch analysis provides the lens through which we look at the internal functioning of the indicator. Applying this methodology to analyze the construct validity of the HDDS is the main contribution of this article to the literature.
Household Dietary Diversity Scores
Dietary diversity refers to the variety of foods consumed by individuals or households. 3,10 An indicator of dietary diversity is a particularly interesting way to measure food security because it is simple to implement, can be administered at household and individual level, and is a useful outcome in itself. 11 There is a shortage of validity studies of survey-based dietary diversity indicators, especially regarding the way questions are posed and how these are handled and interpreted. 5,10 Particularly pressing issues are the responsiveness of food security indicators to improved food security, their discriminatory power in distinguishing food secure from food insecure households, and their validity across different cultural settings.
When measured at an individual level, dietary diversity scores are generally found to be a good proxy for micronutrient adequacy. 12 –17 Dietary diversity might not only be linked to dietary quality but also imply dietary quantity. According to Bennett’s Law, as people become wealthier, they switch from starch-dominated diets to more varied diets including vegetables, fruit, dairy products, and meat. 18 Although calorie intake might not increase above a certain level of wealth, Jensen and Miller 19 suggest people quickly shift to improving the taste of their food bundle when their incomes increase. Their findings are in line with classic theories of demand. 20 In other words, households with sufficiently diverse diets can be assumed to at least consume enough food not to be hungry. Studies confirm a positive relationship between household dietary diversity and household food security. 6,11,21,22 However, these studies were based on indicators differing in regard to their inclusion of individual foods versus food groups, number of food groups, weights, and recall period, making it hard to establish a definitive link. In fact, some authors even question what it is that is being measured by these indicators. 10,22
In particular, only 2 research articles are named on which the conclusion that “an increase in dietary diversity is associated with socioeconomic status and household food security” is based. 23 Of these articles, Hatloy et al, 17 in a case study in a southern county of Mali, indeed find such an association for socioeconomic status. For nutritional status, the association was only found in urban areas. Furthermore, their index for dietary diversity is based on 10 food groups, not the suggested 12. Perhaps, the most extensive work on this topic is by Hoddinott and Yohannes 11 who study the relationship between dietary diversity and a range of food security measures using data sets covering both rural and urban households from 10 poor- or middle-income countries. The authors find a robust positive relationship—independent of whether individual foods or food groups are used to measure dietary diversity—which holds over urban and rural areas, seasons, and recall period. However, in neither of these studies is the HDDS indicator used in the form promoted in the guidelines.
Dietary diversity is measured by counting the number of foods or food groups consumed over a certain reference period. These groups can be simply counted, or a weight can be attached to them based on their nutritional value. Some indicators also take into account the frequency at which the foods were consumed or specify a minimum portion size required for a food to be counted in the index (see Ruel 10 and Leroy et al 5 for a review of different indicators). Of the food group indicators, the HDDS analyzed in this article is probably the most widely used by development organizations. It was developed by the Food and Nutrition Technical Assistance (FANTA) and actively promoted by the United States Agency for International Development (USAID). Moreover, this index is the basis for the recent Food and Agriculture Organization of the United Nations (FAO) “Guidelines on measuring household and individual dietary diversity.” 23
The HDDS was developed to measure household food access and designed to be an easy-to-use and quick-to-implement index, making it ideal for impact evaluations of development programs. 8 It measures dietary diversity by counting the number of food groups that were consumed by the household over the last 24 hours. The indicator consists of 12 food groups: cereals; roots and tubers; vegetables; fruits; meat, poultry, and offal; eggs; fish and seafood; pulses, legumes, and nuts; dairy products; oils and fats; sugar and honey; and miscellaneous, such as condiments. These 12 food groups are based on the groups used to construct the FAO food balance sheets. 24 The value of the HDDS equals the number of food groups consumed in the last 24 hours. A higher score should reflect higher dietary diversity and hence better household food access. 8
This article is the first to evaluate the validity of the HDDS in the form promoted in the FANTA guidelines. We limit ourselves in scope to evaluating the construct validity of the indicator, that is, whether the different food groups contribute to a single underlying construct in such a way that the overall score on the indicator can be interpreted as an interval scale measure at household level. We do not analyze whether the scale indeed measures household food access but follow the indicator guidelines in assuming that it does. In other words, we do not study what is measured by the HDDS but verify how it measures.
Data
The construct validity of the HDDS was tested using data from a cross-border agricultural development project in Colombia and Ecuador. These countries are culturally close and economically similar. Both countries are considered upper/middle-income countries according to the World Bank classification yet have high inequality and poverty rates.
Data were collected in the Ecuadorian amazon basin and the southern mountain range in Colombia, which are among the poorest parts of the countries. In the Amazon basin, 59.7% of the population lives below the national poverty line, 25 and in Colombia’s southern Andes, 50.6% of the population lives below the national poverty line. 26
Data were collected in April and May 2012 through structured questionnaires, with interviews conducted by trained local enumerators. All interviewed households were small-scale farmers depending on agricultural production for most of their income. Respondents were either the head of the household or the person most closely related to the head of the household, such as a spouse. Since the data were collected for the baseline of a development project, the households needed to be representative for both project beneficiaries and control group households. Power calculations were conducted to ensure representativeness at the provincial level. In total, 510 households were interviewed in Colombia and 514 in Ecuador. After removing observations for nonresponse, the full data set contained 509 Colombian and 506 Ecuadorian households.
Interviews were conducted according to a detailed standardized protocol; enumerators received 2 weeks of training including field trials before starting data collection. Data were collected on family composition, including ethnicity of household members (note 1) and income. A complete list of the definitions of the variables used is provided in Online Appendix A. Agricultural production destined for own consumption was valued at farm-gate prices. The used HDDS surveys were made more specific for each country by adding commonly consumed foods to the specification of the food groups (see Online Appendix B). For example, food group 1, cereals, was specified for the Ecuador survey as “In the last 24 hours, did you consume any kind of cereal such as rice, maize, or wheat or any product made from cereals, such as bread, cookies, humitas, and so on?” (note 2). For Colombia, this question was specified as “In the last 24 hours, did you consume any kind of cereal such as rice, maize, or wheat or any product made from cereals such as bread, arepas, envueltos de choclo, noodles, puff pastries, toast, and cakes or any other food made from millet, sorghum, maize, rice, wheat, barley, oats, and so on.?” (note 3).
Descriptive statistics are shown in Table 1. For the analysis, the data from Ecuador had to be split into 2 cultural groups, Kichwa and migrant households, as will be explained in the Results section. For legibility, these groups are represented separately in the table.
Descriptive Statistics.a
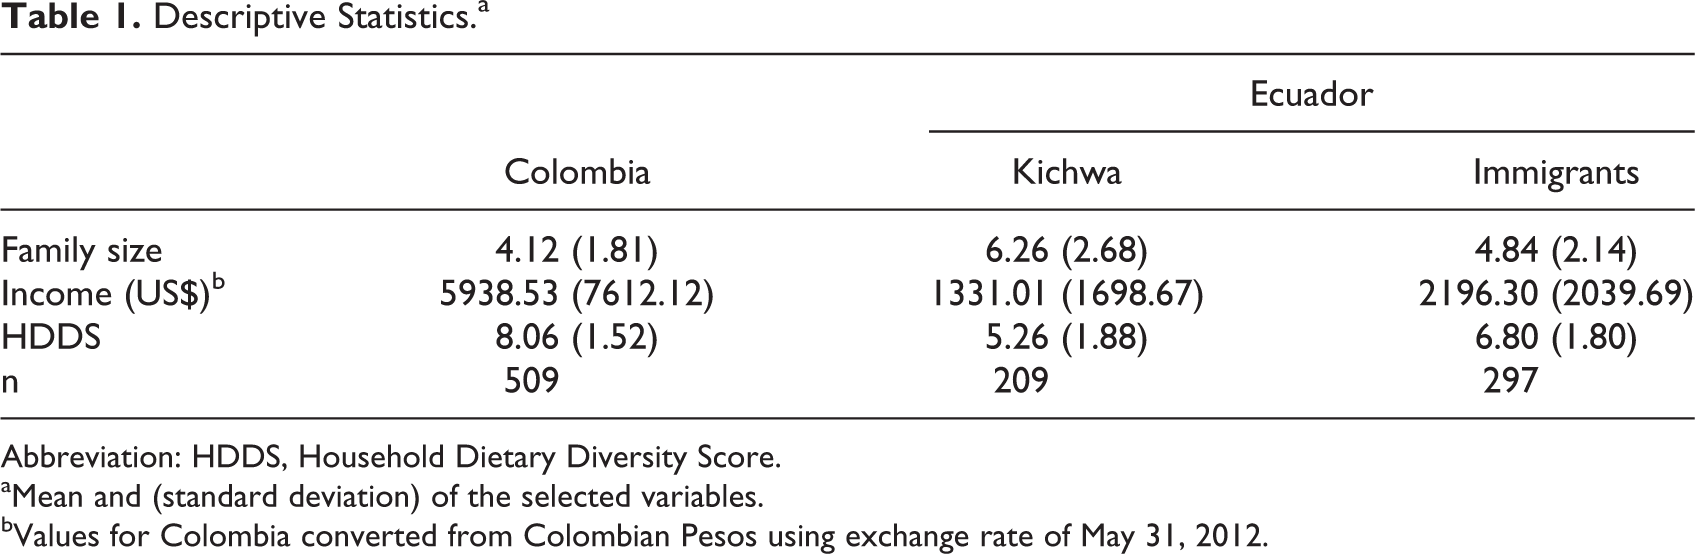
Abbreviation: HDDS, Household Dietary Diversity Score.
aMean and (standard deviation) of the selected variables.
bValues for Colombia converted from Colombian Pesos using exchange rate of May 31, 2012.
Methodology
Rasch models were developed by Rasch 9 to measure an individual’s level of a latent trait. The models assume that the probability of an individual’s response to a question depends only on item difficulty and individual’s ability. In this study, the latent trait is assumed to be household food access, as suggested by the developers of the HDDS. 8 The food groups making up the indicator are the items. Rasch models do not depend on a priori assumptions about item difficulty. Rather, item difficulty is an outcome of the analysis. Rasch models are most frequently applied in education and psychology, but commonly used in other human sciences, 27 and increasingly applied to medical research. 28
Rasch models have been used to study food security indicators before. They have been applied to test experience-based indicators, such as the Core Food Security Module developed by the US Department of Agriculture, 29,30 Latin American Household Food Security Measurement Scale (ELCSA), 31 Household Food Insecurity Access Scale (HFIAS), 32 and, most recently, the Arab Family Food Security Scale. 33 Rasch models allow evaluating whether items are equally difficult in different cultural settings because estimated item parameters are not sample specific. 34,35
Rash analysis assumes hierarchical ordering of items. In the context of the HDDS, this implies that households consuming the most difficult item—ie, the food group eaten only by those households with high food access—should also consume easier items. Although there is an extensive literature on dietary patterns which concludes that households shift to more expensive foods when their income increases, 36 implying some hierarchy between foods, it is not clear to which extent this hierarchy is accurately captured by the food groups as defined in the HDDS. The hierarchical ordering of items is essential for the applicability of Rasch modeling but cannot be tested directly. Not meeting this key assumption has several consequences, which are explained in the Discussion section.
Two other conditions an indicator of food access should meet in order to be a valid and reliable proxy of the latent trait could be tested directly using Rasch analysis. First, the indicator needs to be robust to cultural differences. Hence, conditional on the latent trait, item difficulty should be consistent between countries, cultures, and food habits. Second, the probability of an affirmative response to an item (food group) needs to be stable over the latent trait, such that each food group contributes positively and significantly to the overall score on the indicator. These conditions are necessary for the indicator to reliably distinguish households with high food access from households with low food access and to allow cross-cultural and intertemporal comparison of households based on the HDDS.
Its most simple form, the 1PL Rasch model (Equation 1), is based on the assumption that the probability of an affirmative answer to item i (eg, consumption of a food group) by person p is determined by the difference between the person’s ability θp (eg, food access status) and the difficulty of the item βi. In other words, the higher a person’s food access status and the less “difficult” a particular food group is, the more likely it is that this person is consuming that particular food group. Formally, the 1PL model is specified as follows:
This formula states that the log odds of the probability of an affirmative response of person p to item i is a linear function of the ability of person p (θp) and the difficulty of question i (βi).
A poor item fit might indicate that the item does not measure the same latent trait as the other items, but it might also indicate that the item is not as strongly correlated with the latent trait as the other items. A simple 1PL Rasch model assumes all food items are equally informative of a household’s ability. The more flexible parameterization of the 2PL model allows testing the correlation of item i with the latent trait, by adding an interaction term, αi:
The additional parameter, αi, determines the discriminatory power of the items, that is, it measures the extent to which an item helps distinguish high from low performers. The larger is αi, the more a small increase in θ increases the probability of an affirmative response to item i.
For interval scale measurement, each item should contribute positively to the latent trait, such that food access status increases with the consumption of each food group. In terms of the model, this implies αi > 0. If αi is not significantly different from 0, the probability of an affirmative response is no longer a function of θ. This implies that an individual with a highly diversified diet could not be distinguished from a household with a less diversified diet. More worrying are items (food groups) with a negative αi. Such items showed an inverse relationship with the latent trait, implying that the probability of consuming food group i decreased with increasing food access. As the HDDS score equals the number of consumed food groups, food groups with an inverse relation with dietary diversity will bias HDDS downward. Clearly, such items should not be included in a valid indicator.
A necessary precondition for any scale is that item response (food group consumption) should only depend on ability, not on any other individual- or household-specific characteristic. This precondition was checked using differential item functioning (DIF) tests, which allows testing whether individuals with the same latent trait but different consumption preferences respond differently to items. 37,38 Consumption preferences are likely to differ between cultures and regions. For example, fish consumption might be common in coastal areas but is linked to a highly diversified diet in rural areas. To verify this condition, prior knowledge of dietary patterns in the region was required.
For each subgroup of households in the sample, a refined indicator was constructed based on the relationship between individual items and overall score on the indicator. In a first step, food groups consumed by nearly all or none of the households were removed. Such items did not add value in distinguishing households with high food access from households with low food access. Furthermore, items with less than 10 observations per binary choice alternative might cause estimates to become unstable 39 and hence were removed. Second, the relationship of the remaining items with the total score on the indicator was visually verified with item response functions (IRFs). Well-functioning items should have a significant positive relationship with the overall score, indicating households consuming the food group had a higher probability of having higher food access. Badly functioning items were removed from the refined indicator. Item fit was further examined using item characteristic curves (ICCs) that show expected and observed probabilities for each item in a single graph. 27
The resulting refined indicators were tested for robustness and local independence. Robustness was checked by removing observations with low person-fit and verifying whether the ranking of items differed between the reduced sample and the full sample. Local independence was tested for by the significance of the correlation between response pairs. 38,40 All equations were estimated using Rasch analyses performed using R version 2.12.1, with packages irtoys and eRm. 41,42
Results
Consumption patterns of Colombian and Ecuadorian households were completely different, as is evident from Tables 2 and 3. Hence, separate Rasch analyses were performed for each country. Differential item functioning showed the existence of distinct dietary patterns for Kichwa and immigrant households in Ecuador, requiring separate analyses for these 2 subgroups. Such a difference was not found in the Colombian sample. Therefore, 3 distinct analyses had to be performed, as shown in Figure 1. The consequently large amount of analyses performed implies that not all results could be reported in the main text; selected results are presented in online Appendix C and D (note 4). In the next section, results of the analysis for Colombia will be discussed, followed by those for the DIF analysis in Ecuador (see Ecuador: DIF) and the HDDS verifications for Kichwa (see Kichwa Households) and migrant households (see Migrant Households).
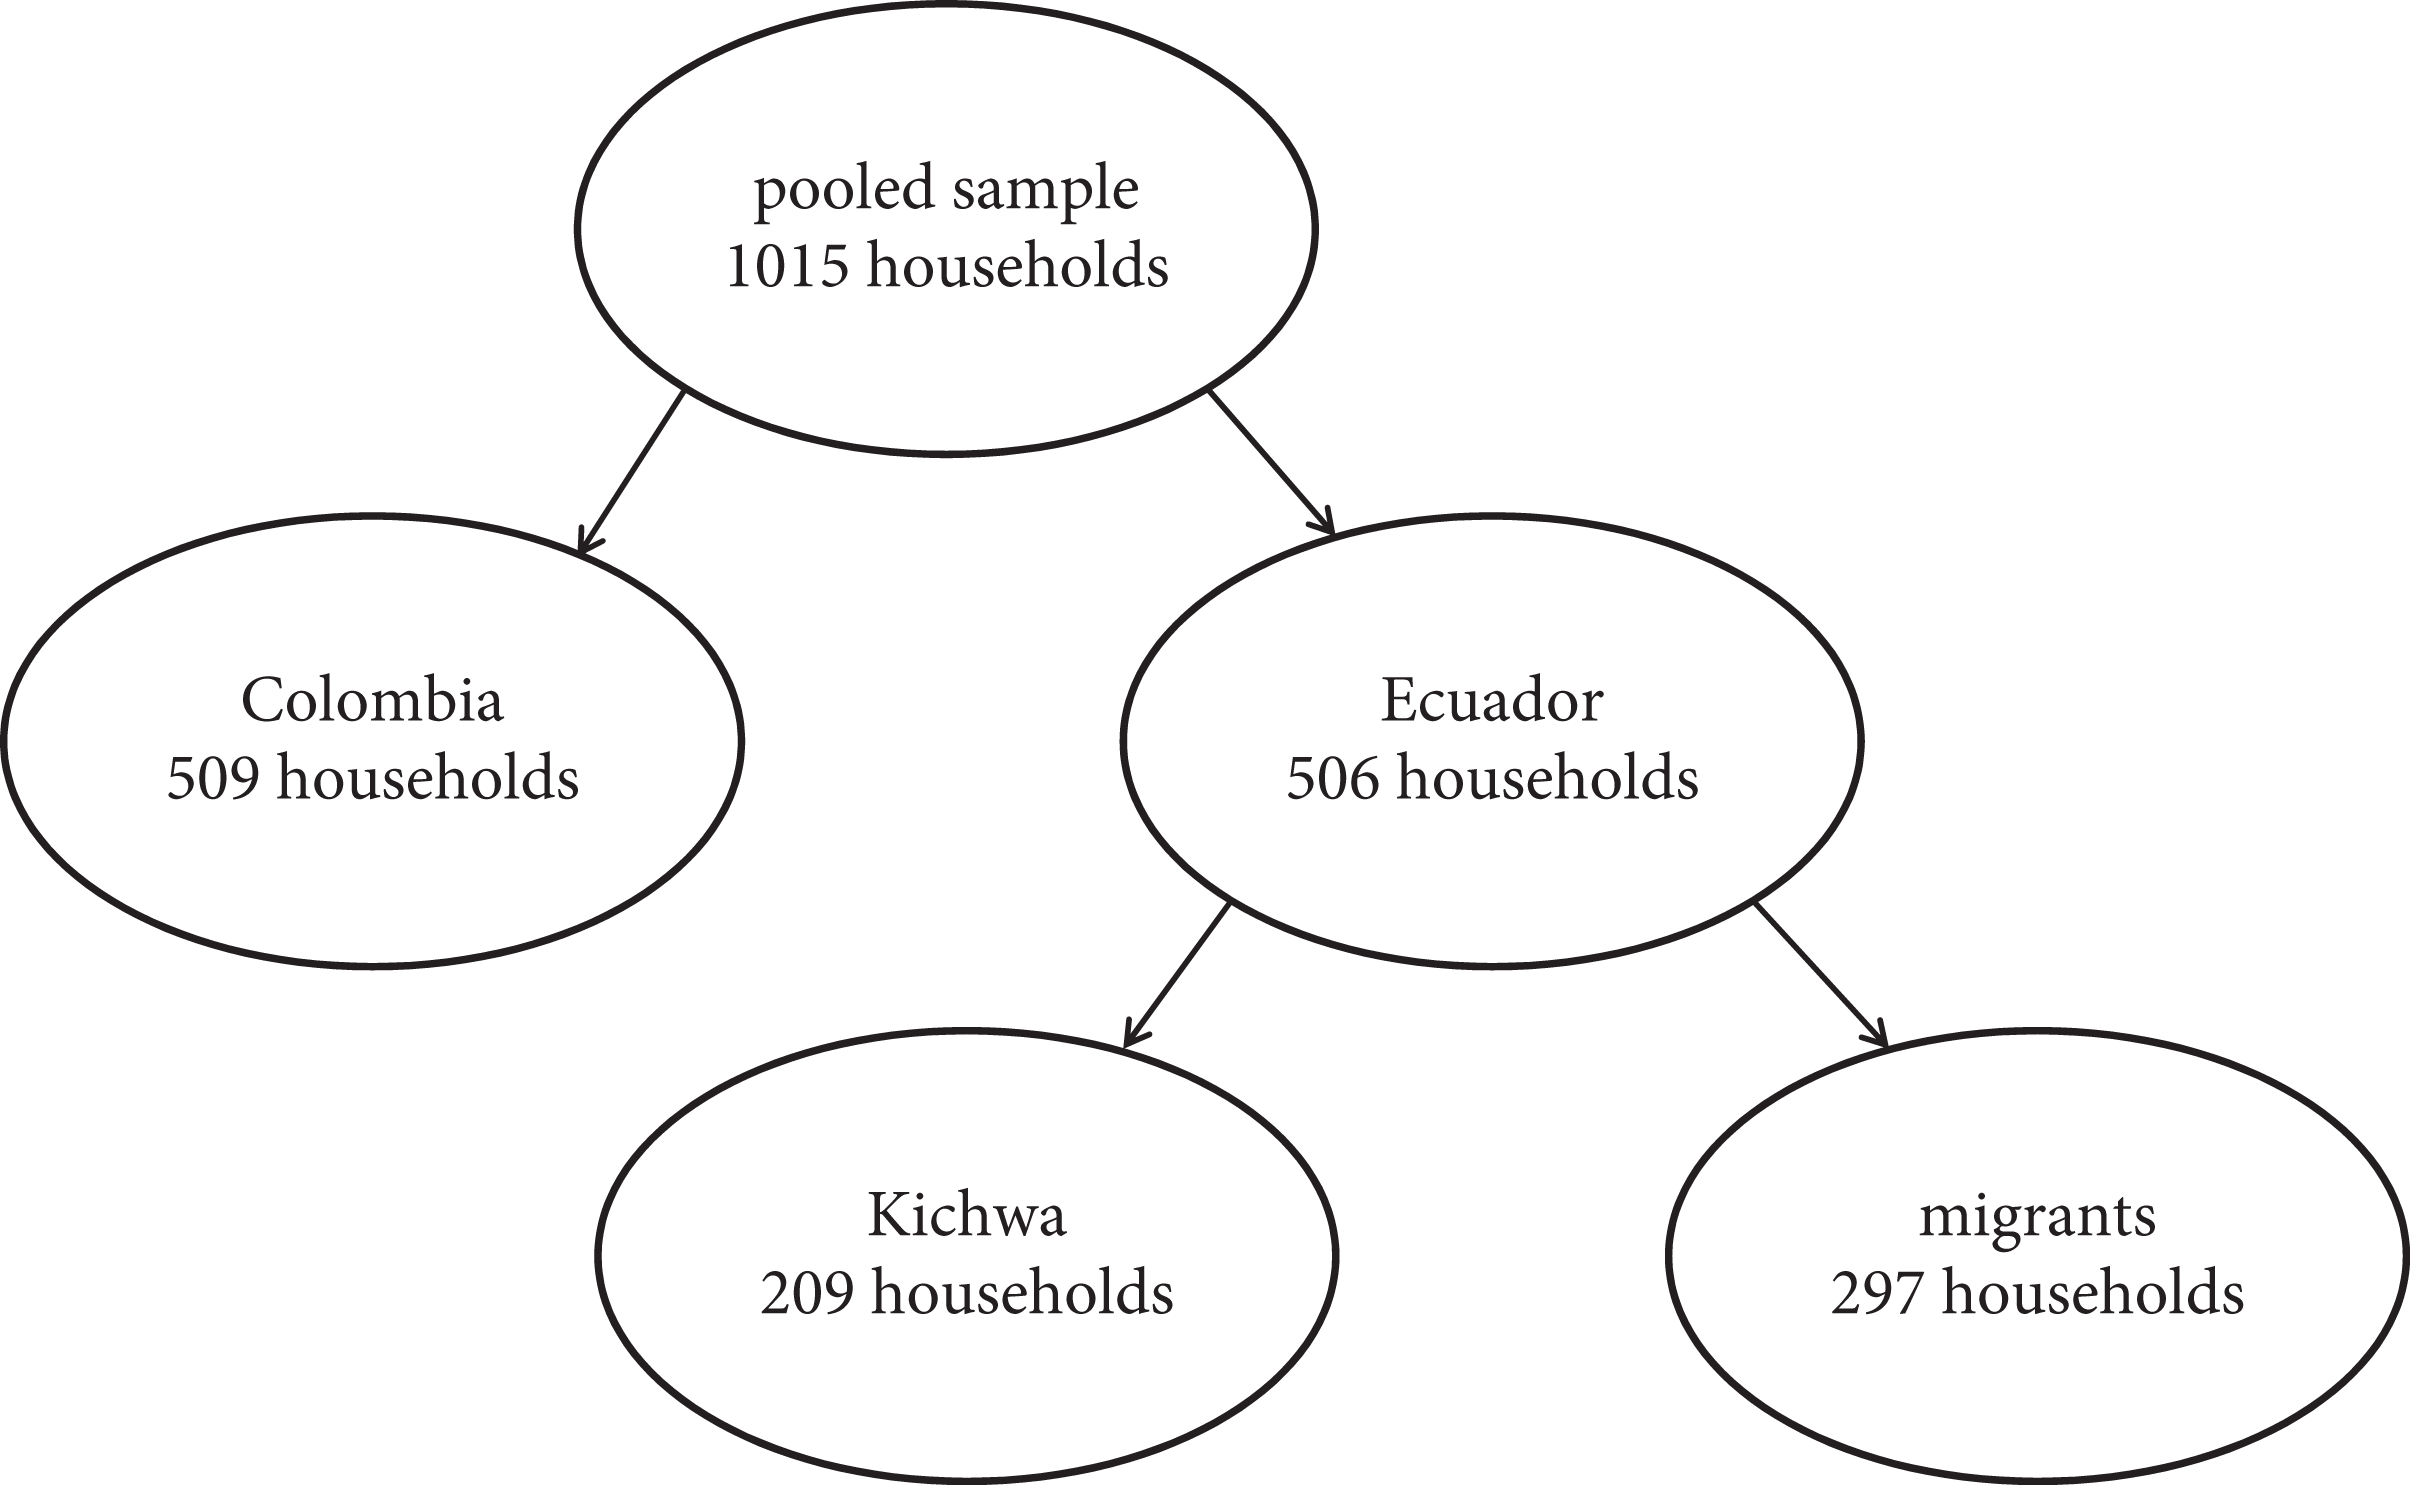
Structure of the Results section.
Food Group Consumption in the Colombian Sample.a
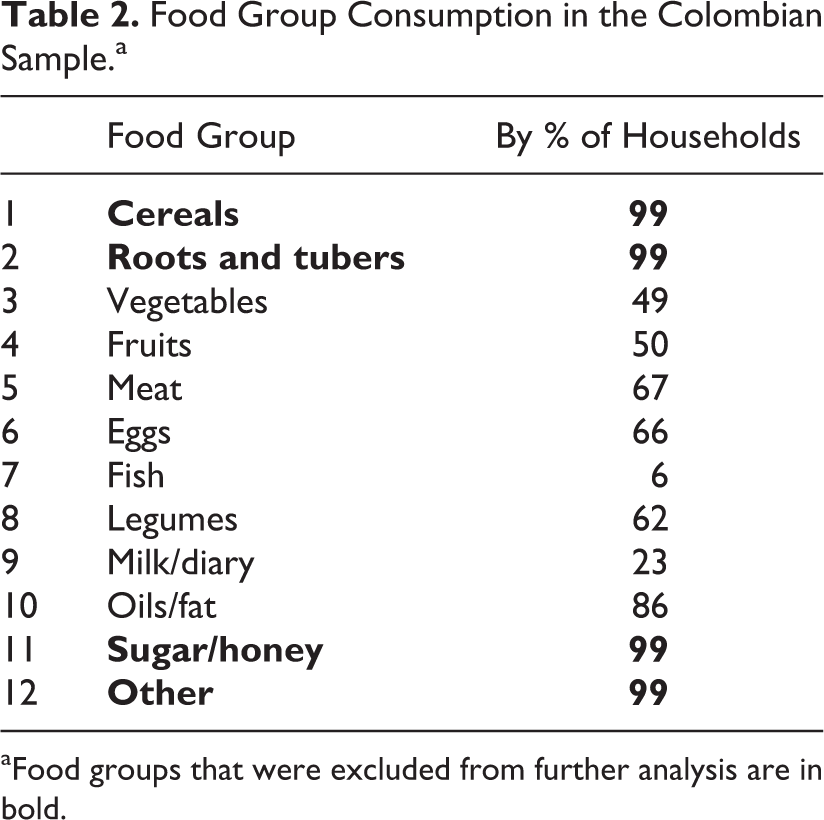
aFood groups that were excluded from further analysis are in bold.
Food Group Consumption by Ecuadorian Households Across Different Ethnic Groups.
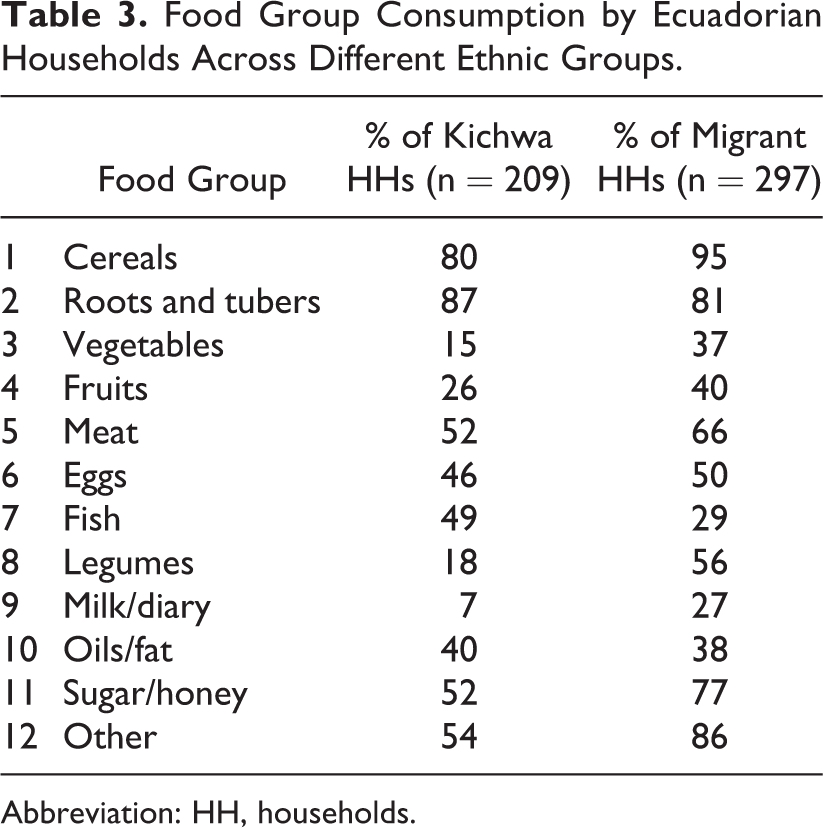
Abbreviation: HH, households.
Colombia
Food groups consumed by nearly all or very few households reduce the variation in the HDDS indicator and hence its efficiency. In the Colombian sample, this lack of variation was a cause for concern: 99% of households consumed the food groups 1 (cereals), 2 (roots and tubers), 11 (sugar/honey), and 12 (other) during the 24 hours before the survey (Table 2). The nearly uniform consumption of these food groups meant they did not add explanatory power in differentiation between households with high and low food access. Therefore, their removal did not make the overall indicator less precise but was necessary to ensure the stability of the estimates of the model. 39
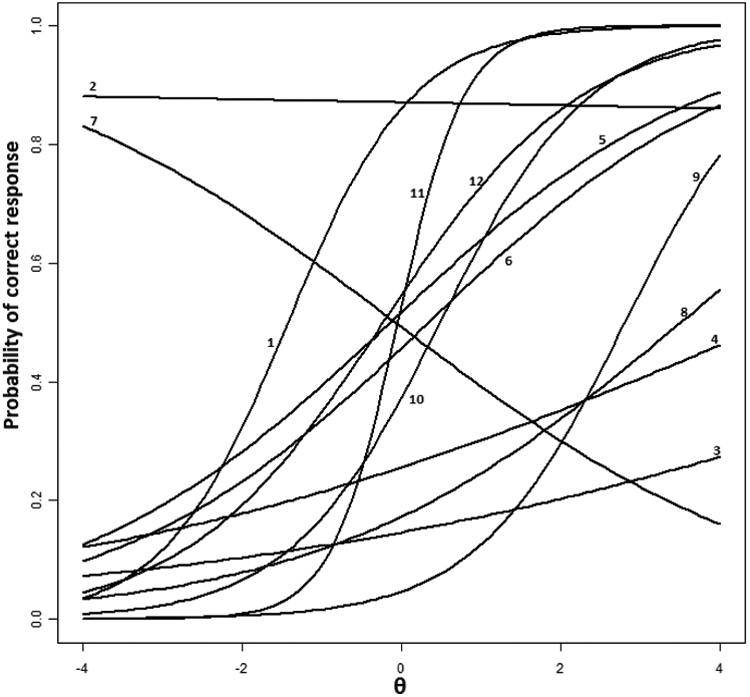
The relationship between individual items and the overall score was evaluated with IRFs of an estimated 2PL Rasch model (Figure 2). Item response functions showed the probability of an affirmative response for each item as a function of the latent trait, household food access. The higher was food access (on the horizontal axis), the higher should be the probability of consuming the food group (on the vertical axis). The numbers on the different curves correspond to the items (food groups) provided in Table 2. All food groups appeared to behave as expected: all curves show an upward slope.
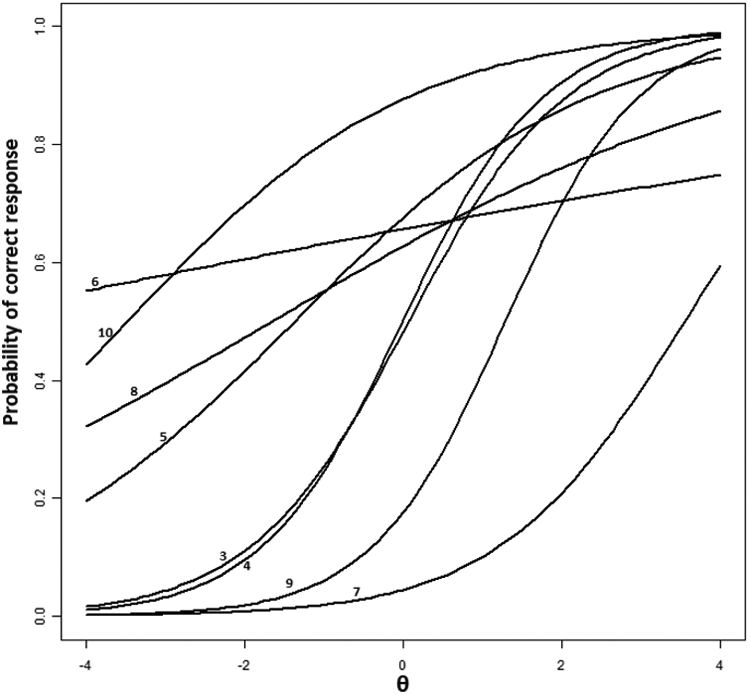
Item response function (Colombia). Note: numbers indicate food groups defined in Table 2.
If 2 items had similar discriminatory power, α, but differed with respect to their difficulty, β, the curve of the most difficult item (higher β) would be plotted toward the right-hand side of the figure. For instance, food group 3 (vegetables) and 7 (fish) had similar discriminatory power (α equaled 1.006 and .858, respectively), but vegetables (β = .07) were a considerably easier item than fish (β = 3.55). Hence, the IRFs of fish and vegetables were almost parallel, but the curve of vegetables was located to the left of the curve of fish.
The α determines the slope of the IRFs: items with high discriminatory power have steeper slopes. For instance, food group 5 (meat) and food group 8 (legumes) had similar βs, but the slope of the IRF of meat was steeper than the slope of the IRF of legumes because the latter had a smaller α. In other words, the food group meat had more power in differentiating between households with high and low food access.
The IRF of food group 6 (eggs) was rather flat, which indicated the probability of consuming eggs might be independent of the latent trait. A test confirmed that the discriminatory power of food group 6 was not significantly different from 0 (P = .22), so the item was removed from the refined scale. Eggs might not explain household food access because they are an important component of the daily diet in Colombia, independent of the socioeconomic status of the household. 43 Most households might eat eggs frequently but not daily. In our sample, eggs were consumed by two-thirds of the interviewed households (Table 2). All 7 remaining food groups had a positive and significant relationship with the latent trait and were therefore included in the refined scale.
Item fit was verified by visual inspection of the ICCs for each of the 7 remaining items. Item characteristic curves are similar to IRFs and show the probability of consuming the food group (vertical axis) as a function of the household’s food access (horizontal axis). Item characteristic curves also show the predicted probability of an affirmative response with its 95% confidence interval represented by vertical lines and the actual observed probability of an affirmative response represented by a dot. Item fit is high when the predicted probabilities are close to the expected probabilities. For example, for the food group meat (Figure 3), predicted probabilities corresponded well to actual observations. Results for other food groups were similar.
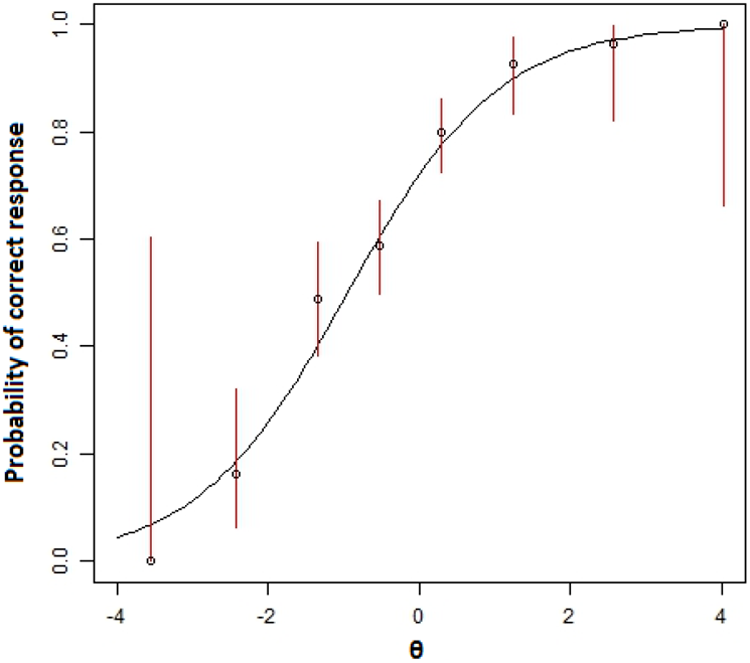
Item characteristic curve (ICC) of food group 5 (meat).
Results of the robustness check supported the model. Although removing the 6% of observations with low person-fit (P < .02) did affect the size of the coefficients, it did not affect their difficulty rankings vis-à-vis one another. Local independence held. The nonparametric reference model test showed interitem correlations between 2 of the 21 item pairs, or roughly 10%. Based on the null hypothesis of independence, this is no cause for serious concern. Further testing to find the source of dependencies based on principal component analysis resulted in a maximum eigenvalue of <1.3, with remaining eigenvalues slowly decreasing in size. Eigenvalues below 1.5 are generally considered as insignificant, confirming local independence. 44
Ecuador: DIF
The amazon basin where the Ecuadorian data were collected had 2 ethnic groups with distinct dietary patterns. Originally, the region was inhabited by the indigenous tribe of the Kichwa, but since the oil boom of the 1970s, large groups of mestizo migrants have settled in the region and currently make up almost half the population. 45,46 A glance at the summary statistics for food groups consumption shows marked differences in diet between these groups (Table 3). Milk and dairy products were, for instance, consumed by only 7% of the Kichwa households, whereas 27% of the migrant households reported having consumed this food group in the previous day. This suggested that the pooling of the data from Ecuador might cause validity problems.
A formal test confirmed the occurrence of DIF (online Appendix E) between the ethnic groups (P < .001), implying that a single index for the Ecuadorian case did not meet condition 3 of cultural robustness. When the items showing the strongest DIF were removed one by one until they no longer showed any DIF (P = .352), only 5 food groups were left in the final model: 1, 3, 8, 9, and 11. Such a small number of groups is not very meaningful, as the resulting indicator can take only 5 values and is probably relatively insensitive to changes in food access. By not pooling the data, valuable within-group information on specific diets was preserved. Hence, the subsequent analysis was performed separately for each of the 2 cultural groups (note 5).
Kichwa Households
None of the food groups was consumed by so few or so many households to require removal from the indicator. The least frequently consumed food group, milk, was consumed by 15 households (Table 3). Item response functions for all food groups based on the 2PL model are shown in Figure 4. In order for a food group to usefully contribute to the additive HDDS, the likelihood of its consumption needed to increase with an increase in the latent trait, reflected by a positive and significant slope. Food groups 2 (roots and tubers) and 7 (fish) both appeared to violate this condition.
Item response function (Ecuador, Kichwa household). Note: numbers indicate food groups defined in Table 3.
The IRF of food group 2, roots and tubers, was a flat line. The item had low discriminatory power (α = .04) and extremely low item difficulty (β = −48.01). The food group was consumed by 87% of the Kichwa households, but their consumption was practically independent of their food access situation, meaning the group added no explanatory power to the overall indicator. It is likely that this food group was consumed by all households on a regular but not daily basis, and therefore, its consumption had no power in explaining household food access.
The negative slope on food group 7 (fish) indicated the likelihood of consuming fish decreased with increasing food access. The predicted likelihood of consuming fish decreased from 80% for households with little dietary diversity to less than 20% for households with a highly diversified diet. Previous research found fish to be an important part of the diet in Kichwa communities, and consequently, its consumption was common, although more so in rural communities than in towns. 48 No sources were found mentioning an inverse relationship between income and fish consumption, although a possible explanation for the observed effect could be a development project of the provincial government of Napo which donated fish ponds to indigenous households in the region. Such a project was mentioned by respondents in a second survey round conducted in summer 2013 (note 6). If only food insecure households were eligible for this program, it would explain the observed inverse relationship of fish consumption with overall dietary diversity.
Removing observations with low person-fit to verify robustness resulted in dropping 6% of observations. Differences between the full and the reduced sample were negligible. Ranking was unaffected, and coefficient size hardly changed. Local independence tests based on interitem correlation showed that 6 of the 45 tested pairs, or 13%, showed significant correlation (P < .05). Further analysis of the source of the variation indicated sampling variation rather than structural variation. The highest eigenvalue was 1.58; other eigenvalues were only slightly lower.
Migrant Households
No food groups required removal from the refined indicator for migrant households because of too high or too low consumption frequency (Table 3). The most frequently consumed food group was cereals, which was consumed by 95% of the population. Only 15 households did not report its consumption. Because this exceeded the critical threshold of 10 observations per dichotomous choice alternative, 39 the food group was not removed.
Food groups 5 (meat) and 8 (legumes) appeared to have negative slopes (Figure 5), warranting their exclusion. Inspection of the coefficients of the 2PL model indeed showed that the slope of food groups 5 and 8 was negative (α = −.11 and α = −.16, respectively), but testing revealed that this slope was not significantly different from 0 at the 5% confidence level. These food groups were removed from the refined indicator.
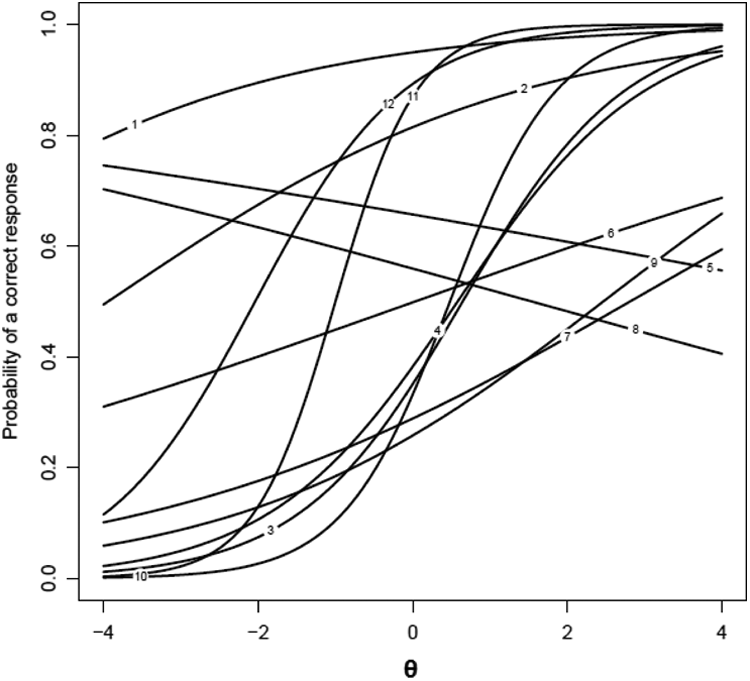
Item response function (Ecuador, migrant household).
Upon inspection of the ICC curves for migrant households, food group 7 (fish) was found to have low item fit. Many more households than predicted consumed fish at the lower tail of the distribution, meaning its consumption did not increase considerably with higher levels of food access (Figure 6). The χ2 test for item fit confirmed this conjecture; the null of good item fit was rejected (P = .013). Therefore, food group 7 was removed from the refined scale. Retesting showed the remaining items to have good fit.
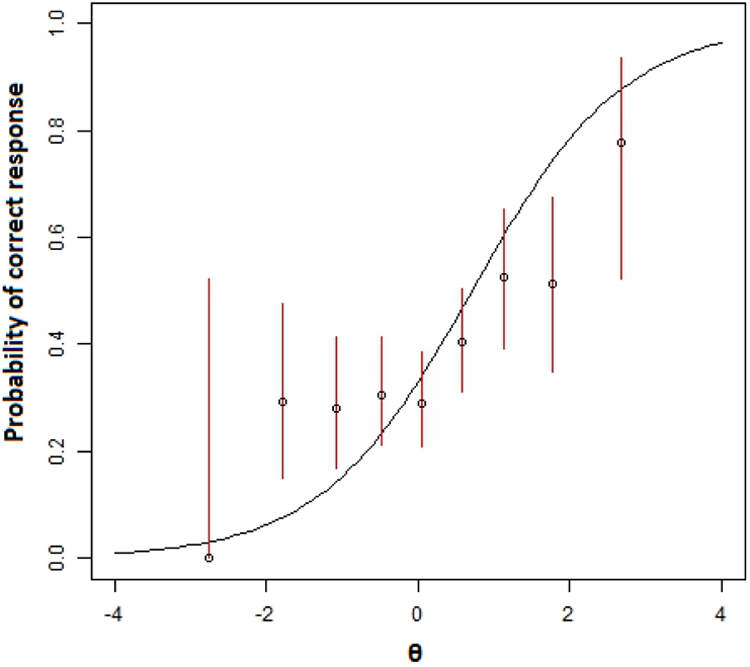
Item characteristic curve (ICC) of food group 7 (fish) for migrant households.
The resulting scale was checked for robustness by removing the 5% of observations with low person-fit (P < .02). This removal had a minimal effect on coefficient sizes and did not affect their ranking. Local independence did offer some cause for concern. Of the 36 item pairs tested for interitem correlations, 6 were found to be significant (17%). Further testing of the source of the variation gave a maximum eigenvalue of 1.52. In other words, the observed local dependence was likely caused by sampling variation.
Discussion
In this article, the HDDS developed by the FANTA project was analyzed using Rasch models. In particular, it was verified whether the indicator met the criteria required for interval scale measurement. Meeting these criteria would imply the HDDS can be used as a household-level indicator of food access. Such validity at household level is relevant for both development and research organizations, as it would allow attribution of project impact to specific outcomes. Rasch models allow differentiation between the discriminatory power and the difficulty of items, revealing the relative importance of individual food groups in differentiating between levels of food access. In our data, this importance differed markedly between countries and between groups within Ecuador. Therefore, in its current form, the HDDS did not meet the criteria.
For most applications of Rasch modeling, the assumption of hierarchical ordering of the items is essential. In our application, this would imply that the food groups can be ranked ex ante based on their difficulty. It also implies that a household that consumes the most difficult item should have consumed the other, easier, items. For dietary diversity, such a strict hierarchical ordering is difficult to establish, as it depends on locally prevailing market conditions (availability and price) and cultural preferences. Yet, in poor and food insecure regions, it is reasonable to assume that more food secure households consume more and less accessible food groups. It is hard to believe that households switch completely from one diet to another or no longer consume certain food groups as they grow richer. In this sense, a hierarchical ordering of food groups is likely. On the other hand, changing dietary patterns may not be completely captured by the HDDS. For instance, food secure and food insecure households may both eat meat, but more food secure households may switch from chicken to beef. The HDDS is insensitive to such changes. A second argument supporting the applicability of Rasch analysis is the main conclusion—that some food groups are not correlated with the overall HDDS score or with the consumption of other food groups—could be reproduced using “simple” descriptive and comparative statistics. Therefore, even if the key assumption of hierarchical ordering was not met, in the context of this article, the consequences appear to be limited. Importantly, in this article, Rasch analysis was not used to calibrate the indicator, which would require precise estimates of item parameters and hence would be more sensitive to the consequences of invalidating the assumption.
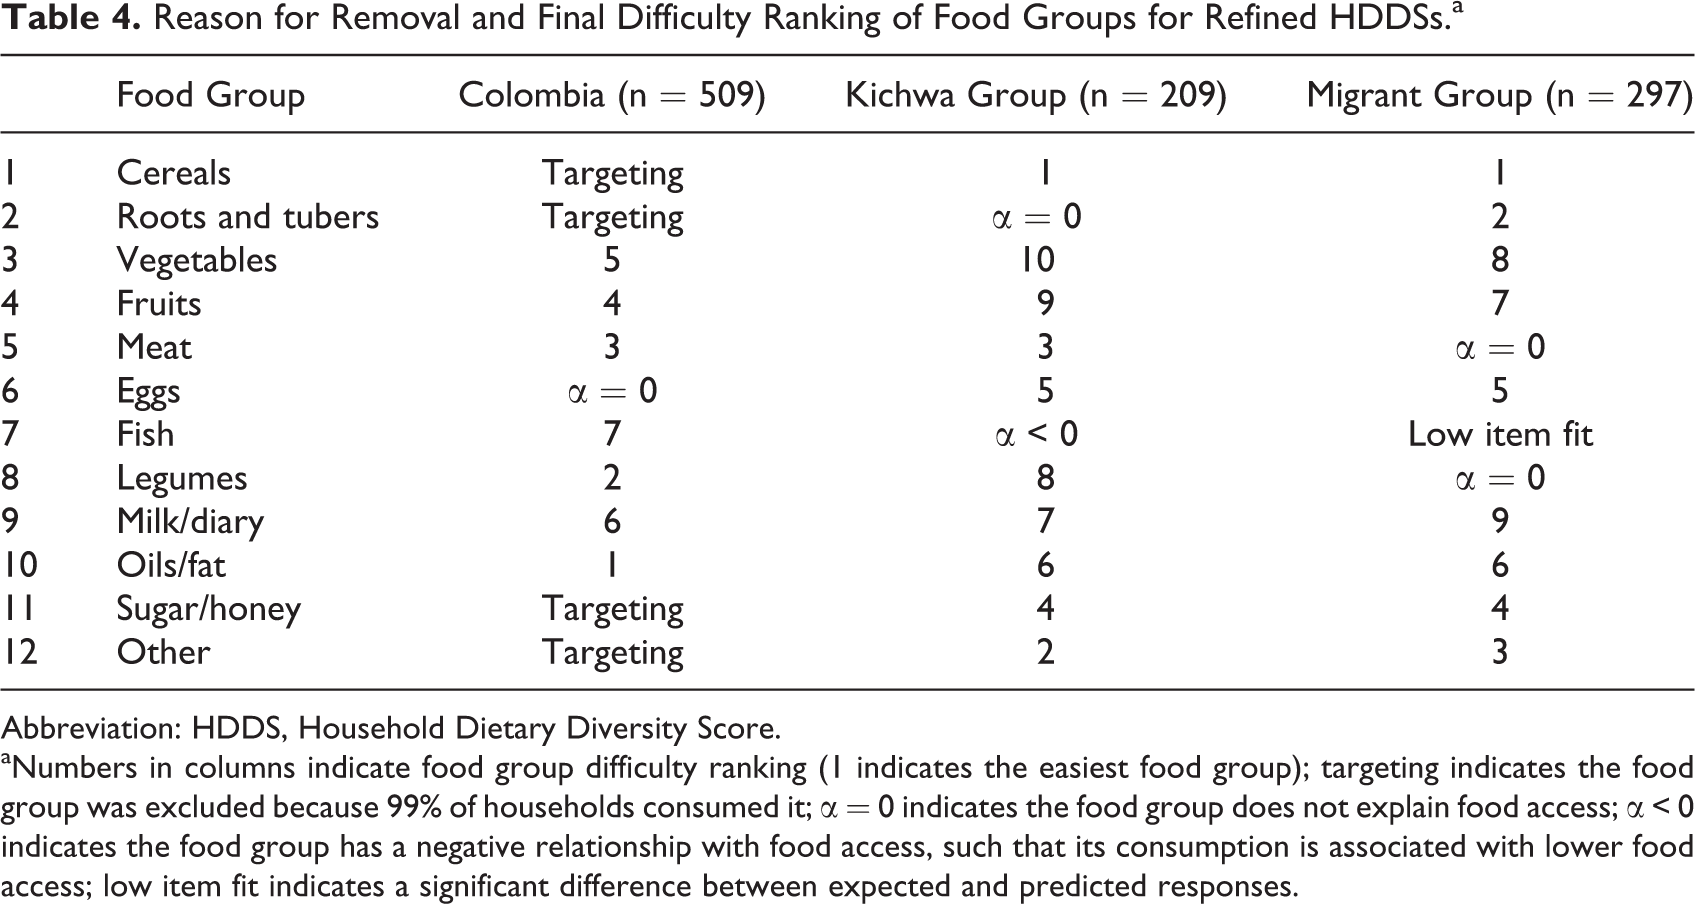
Assuming hierarchical ordering of the food groups, Rasch models can be used to test 2 conditions that a valid indicator of food access should meet: (1) cross-cultural validity and (2) an increasing probability of an affirmative answer with increasing food access. The pooled data, combining data from Colombia and Ecuador, did not meet the condition of cross-cultural validity. More worryingly, even within the sample of Ecuadorian households, significant differences in dietary patters between Kichwa and migrant households were detected. Data had to be split into 3 different groups—Colombian, Kichwa, and migrant households—which were analyzed separately. For each of these groups, items (food groups) not meeting the second condition were removed from the scale until a “refined” HDDS was found that did meet all conditions. An overview of the 3 resulting scales is given in Table 4. It contains for each food group either the reason it was omitted from the scale or its difficulty ranking in the overall scale. The most difficult food groups were most likely to be eaten by households with the highest food access score.
Reason for Removal and Final Difficulty Ranking of Food Groups for Refined HDDSs.a
Abbreviation: HDDS, Household Dietary Diversity Score.
aNumbers in columns indicate food group difficulty ranking (1 indicates the easiest food group); targeting indicates the food group was excluded because 99% of households consumed it; α = 0 indicates the food group does not explain food access; α < 0 indicates the food group has a negative relationship with food access, such that its consumption is associated with lower food access; low item fit indicates a significant difference between expected and predicted responses.
There are large differences between the 3 refined indicators in the number of food groups they contain and in the difficulty ranking of these food groups. In the Colombian data, 7 food groups made up the refined indicator: vegetables, fruits, meat, fish, legumes, diary, and oils. These results correspond well with the literature as the refined index mainly contains foods with high nutritional values such as fruits, vegetables, and animal source products. The results for the Ecuadorian subgroups were less convincing. For Kichwa households, the food groups roots and tubers as well as fish were excluded from the final index, and for migrant households, the groups meat, fish, and legumes did not meet the conditions. Especially, the noninclusion of meat and fish in the overall index for both groups is cause for concern, as animal source foods are of crucial importance for macronutrient and micronutrient intake in developing countries. 49 Moreover, as there appears to be a direct link between consumption of animal source foods and dietary diversity (Brown, et al 50 as cited in Ruel 10 ), the exclusion calls into question what the HDDS really measures (note 7).
There were substantial differences in the importance of each food group in the overall index between countries and even within a country. This holds even though 2 culturally similar neighboring countries were studied. In its current form, the HDDS has no cross-cultural validity, a problem mentioned previously but not tested by Ruel. 10 The DIF analysis showed that the indicator is not even necessarily valid within a country, as in Ecuador, dietary patterns differed between groups with a different cultural background. This lack of cross-cultural validity is problematic as it prevents direct interpretation of the value of the overall indicator. Before interpreting this value, it is essential to have a thorough understanding of local dietary patterns, even when a survey or project concerns only a small area within a single country. Clearly, requiring extensive knowledge before being able to interpret a simple, easy-to-use indicator limits its usefulness for deployment in the rapid assessments required by development projects.
A potential cause of the limited accuracy of the HDDS at household level might be its focus on only the foods consumed in the last 24 hours before the survey. 24 In that case, a straightforward way to overcome this inaccuracy is to increase the recall period. In a study using a 15-day recall period for dietary diversity, Drewnowski et al 51 noted diversity increased steeply over the first 3 days of recall, after which further increases became small. In other words, 24-hour recall might significantly underestimate true diversity when measuring dietary diversity at an individual or household level. Specifically, it might reduce the inaccuracy stemming from food groups that are eaten frequently but not daily.
Other factors that might increase the construct validity of the indicator are redefining the included food groups, adding weights, consumption frequency, and establishing minimum portion sizes. Food groups could be redefined based on nutritional values, as is already being suggested specifically for iron deficiency 23 and is common in studies in the field of nutrition. 10 Weights could be added to account for the distinct nutritional value of food groups, as is already done by the Food Consumption Score used by the World Food Programme. 52 The frequency of consumption might also be considered, which is particularly important in the presence of habit formation. Then, households might prefer those foods consumed as a child even when alternative food baskets become affordable. 53 Finally, minimum portion sizes should be considered. Ruel 10 gives an example from Ghana, where fish consumption appeared high until it was found out fish meal was added in small amounts to porridge, obviously limiting its nutritional contribution. Different indicators take one or several of these factors into account, but knowledge of the contribution of each factor to the overall accuracy of the indicator is lacking. Further research is needed to specify and quantify the trade-offs involved.
Conclusion
The HDDS was developed as an easy-to-use and quick-to-implement survey-based assessment tool to allow measuring the impact on household food access of programs with improvements in food security as their core objective. Although its accompanying guidelines suggest that an “increase in household dietary diversity reflects an improvement in the household’s diet,” our results show the indicator should be cautiously interpreted. The HDDS does not allow comparing food access between different countries. Moreover, even in a small region within a single country, the indicator should not be used without sufficient knowledge of local dietary patterns. When dietary patterns differ between groups within a region, scores should not be aggregated for the region as a whole. Even within these relatively homogenous groups, there is a limited fit between the included food groups and the underlying latent trait, such that the components of the indicator do not form a reliable way of measuring the variable of interest: food access.
Several problems were encountered with regard to the food groups making up the indicator. The gravest problem encountered was the inclusion of a food group with a negative relationship with the latent trait, implying that households were more likely to consume the food group when they had lower food access. Such items should never be included in an additive scale. In each of the 3 groups studied, there was at least 1 item that had no relationship with the latent trait, reducing the indicator’s accuracy. Such items cause incorrect classification of households into food security states. Both problems might be avoided by redefining the included food groups, adding weights, consumption frequency, and establishing minimum portion sizes. Until these issues are satisfactorily resolved, the HDDS should not be used as an indicator of the food access status of individual households.
Footnotes
Acknowledgments
The authors thank Paul de Boeck for his support with the methodology and interpretation of the results and Carl Lachat for the insights regarding the nutritional implications.
Authors’ Note
Wytse Vellema was responsible for data cleaning, writing, and layout. Sam Desiere performed all analyses. Marijke D’Haese supervised the process, recommended the literature, and coordinated writing and analysis.
Declaration of Conflicting Interests
The author(s) declared no potential conflicts of interest with respect to the research, authorship, and/or publication of this article.
Funding
The author(s) received no financial support for the research, authorship, and/or publication of this article.