
Abstract
Background:
Sub-Saharan Africa is the only region in the world where hunger is prevalent in over one-third of the population, with smallholder farming households, producers of over 80% of Africa’s food, facing both calorie and micronutrient deficiencies. With agricultural systems serving as the main source of all nutrients, little is known about the extent to which agricultural diversity in different seasons can meet macro- and micronutrient needs in rural Africa.
Objective:
Linkages between nutrient diversity and food species were investigated.
Methods:
A case study was conducted in Western Kenya to assess the seasonal nutrient diversity, seasonal nutrient accessibility levels, and food perceptions in 30 smallholder farms, 7 markets, and among 97 focus group discussion participants, respectively. All present food plant and animal species were inventoried and assigned to 1 of the 7 major Food and Agriculture Organization–defined food groups. Based on 2 macronutrients and 5 micronutrients, dendrogram-based nutrient functional diversity metrics were calculated.
Results:
On-farm and market food species offered all 7 macro- and micronutrients under investigation, regardless of seasonal variation in species numbers. Although there were varying seasonal nutrient accessibility levels in markets, farms were especially effective in readily availing 4 of the 7 nutrients. However, the main food shortage months coincided only with maize shortage, but a diversity of local foods, deemed to be of low cultural and culinary preferences, were available.
Conclusions:
Nutrition education on the importance of a diversity of local foods in meeting dietary needs, thus stimulating the demand side, can contribute to achieving year-round household food security.
Keywords
Introduction
Despite the global agricultural surpluses, 1,2 more than 1 billion people still remain hungry. 3,4 Ironically, smallholder farming households, producers of around 80% of food supply, make up approximately 60% of this population. 5,6 Sub-Saharan Africa (SSA) still experiences the highest hunger rates, 7 with more than 90% experiencing constant or recurrent lack of access to sufficient quantity and quality of food. 8 Hunger in the form of insufficient calories is only half of the issue, yet a major but often overlooked challenge affecting about 3 billion people worldwide in both affluent and developing countries is that of micronutrient deficiencies. 7,9,10 The most common micronutrient deficiencies include those of iron, vitamin A, iodine, zinc, and folate, 10 which can coexist with sufficient or excessive macronutrient intake. 7 As expected, the majority of these people affected by micronutrient deficiencies live in developing countries, particularly in SSA. 7
Global measures on addressing undernutrition and nutritional deficiencies among the poor’s diets have focused on the 3 most common micronutrient deficiencies of iron, vitamin A, and iodine, 7,11 and often singly, 12,13 without addressing other essential limiting nutrients, 7,14 as well as focusing on all these nutrients together. 10,14 The main source of all nutrients for human consumption is through agricultural systems, 14 and African smallholder farming systems that are characterized by a diversity of food crops 15 can contribute to achieving diversified diets. It is suggested that increased agricultural output of micronutrients is likely to be achieved through diversification of cropping systems, 9 characterized by not only maize but also underutilized grains, pulses, fruits, vegetables, starchy roots, and tubers. 16 Although rural smallholder farming systems in developing countries are mainly characterized by high levels of agricultural diversity, 17 one of the strategies to increase agricultural productivity has been by promoting simplified and intensive cropping systems. 1,4,18 For example, cereal-based cropping systems dominate new African farm production, 14,19 despite their limited nutrient contribution, consisting mainly of carbohydrates and small protein amounts but few micronutrients. 9 As a consequence, less diverse agricultural systems will be unable to produce enough micronutrients to meet year-round dietary needs, especially in most of the developing world that relies heavily on agriculture for human nutrition. 9 Still, nutrient-dense indigenous foods are available such as jew’s mallow (Corchorus species), 20 slender leaf (Crotalaria species), spider plant (Cleome species), 21 among others. However, as compared to the major staples, these local foods have only a small share in cropping systems, 19,22 -24 often due to lack of research and development 25,26 and consequently lack in data on nutrient contents of the different species in the local and global databases (eg, Kenya and Food and Agriculture Organization [FAO] databases). 27,28 This constraint necessitated either the merging or the omission of some of these indigenous species. For example, several jew’s mallow (Corchorus) species, such as Corchorus acuntangulus, Corchorus olitorius, Corchorus trilocularis, and Corchorus tridens were grouped together. There was also omission of indigenous fruits with unavailable nutrient composition data, such as black plum (Vitex doniana) 27 and kei apple (Dovyalis caffra).
As a tool in visualizing the existing nutrient diversity, nutritional functional diversity metrics enable the assessment of the extent of nutrient diversity of cropping systems. The need for the metrics arise from the understanding that species richness does explain the difference in the identity and number of species but not necessarily the functional trait differences in the identified species. 29 With its origins in ecology, the output of functional diversity metrics reflects how different the functional traits are in a given area. 29,30 The lower the functional diversity, the higher the similarity in the functional attributes (eg, if only staples are available) and the higher the functional redundancy. While functionally similar crops offer limited nutrient diversity, redundancy in functional traits is not always bad, especially in the face of changing climate where failure of 1 crop can be replaced by a functionally similar crop. 29 Although having sufficient food quantity and quality at the household level is a prerequisite for adequate nutrition, on its own it’s insufficient for improved nutrition. 31 Nutrition security goes beyond food access to food consumption, 32,33 coupled with health status determinants, such as access to adequate health services, sanitary environment, and maternal care practices. 32 Thus, nutrition security is a function of factors related and not related to food. 34
Other studies have utilized metrics to assess the nutrient content and diversity of African smallholder farms.
29,30,35
-38
For some of these studies, the nutrient data have been based on the presence or absence of on-farm food species.
29,30
Although recent research using national-level data has enabled incorporation of the presence/absence of market food purchases
39
and quantities of foods produced and/or supplied,
35
-38
these measurements of nutrient diversity are yet to integrate the important dimension of food utilization, which is best captured using household-level data.
35
Food utilization refers to the ability to consume and benefit from food, and one of the factors determining this is the nutrient value of food.
40,41
Extending the data used to crop abundance, livestock diversity and number, and income ranges, this article aims to contribute to a comprehensive understanding of the linkages between agricultural and nutrient diversity in smallholder farming households, by way of a case study of smallholder farmers in Western Kenya. This article examines whether there are linkages between food plant/animal species and nutrient diversity in smallholder farms. To do this, the study seeks to answer the following 2 research questions: What nutrients are available for smallholder farmers to meet a balanced diet? How does seasonal food accessibility compare to income levels in the study sites?
Methodology
Study Area and Data Collection
The study was conducted in September/October 2012 and July/August 2014 seasons in Mumias and Vihiga districts, Western Kenya. With Western Kenya as one of the most densely populated rural areas in Kenya, the population density in Mumias and Vihiga districts is at about 600 and 1100 people/km2, respectively. 42 With its high population density, Western Kenya is also one of the high potential rural areas in the country that is characterized by a predominance of smallholder farms. 43 The region also faces the burden of under- and overnutrition 44 (see Table 1 for details on the anthropometrics in the case study areas). Mumias and Vihiga districts mainly represent the humid Lower Midland and Upper Midland agroecological zones, 45 respectively (Figure 1). Mumias and Vihiga districts were selected as study sites with an aim to represent different agroecological zones and thus most likely a different level of agrobiodiversity, with an added advantage of geographical closeness to each other. Table 2 shows details on geographical, climatic, and agricultural characteristics of the 2 districts.
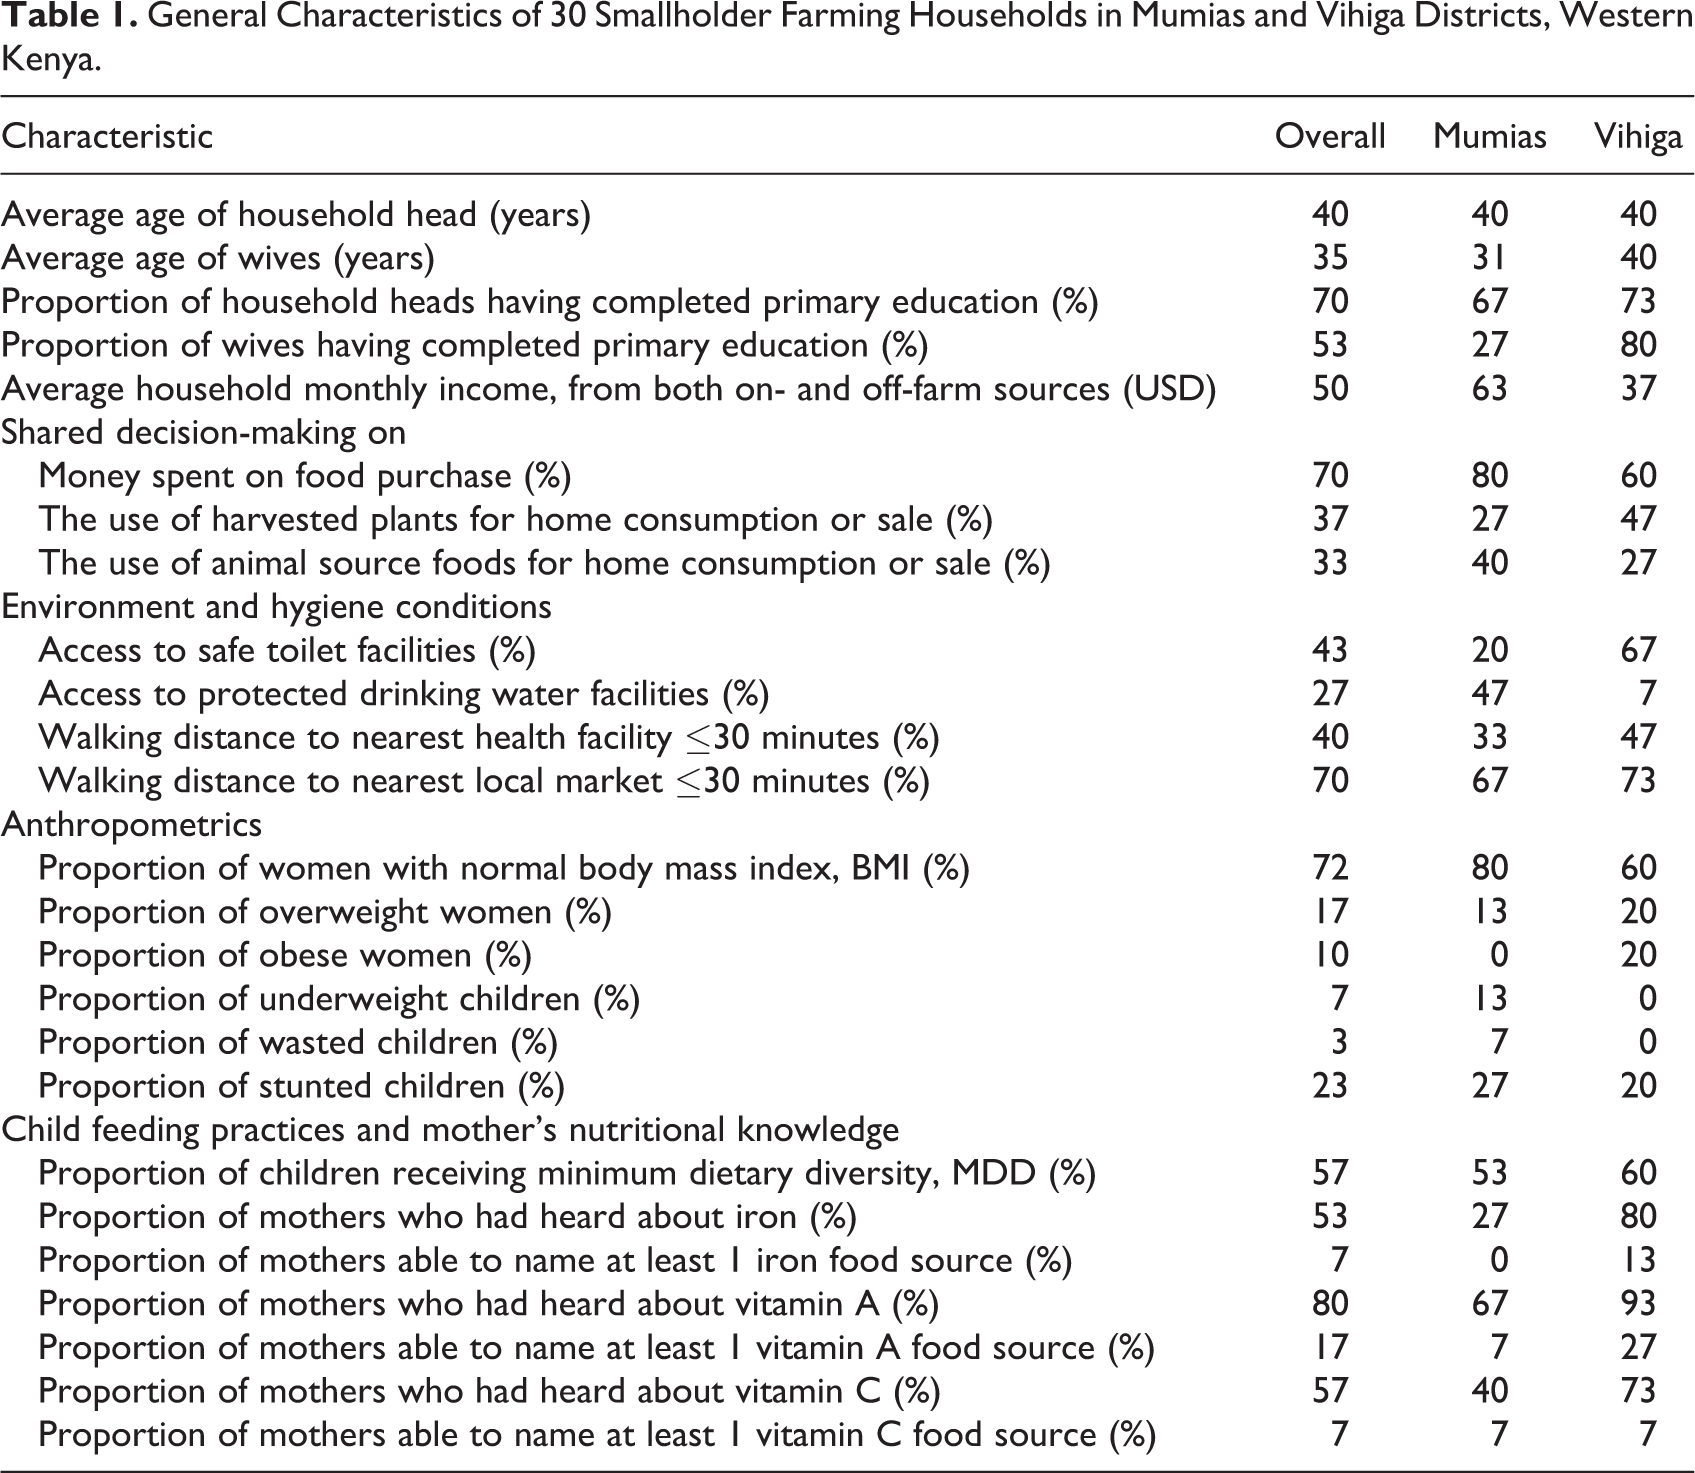
General Characteristics of 30 Smallholder Farming Households in Mumias and Vihiga Districts, Western Kenya.
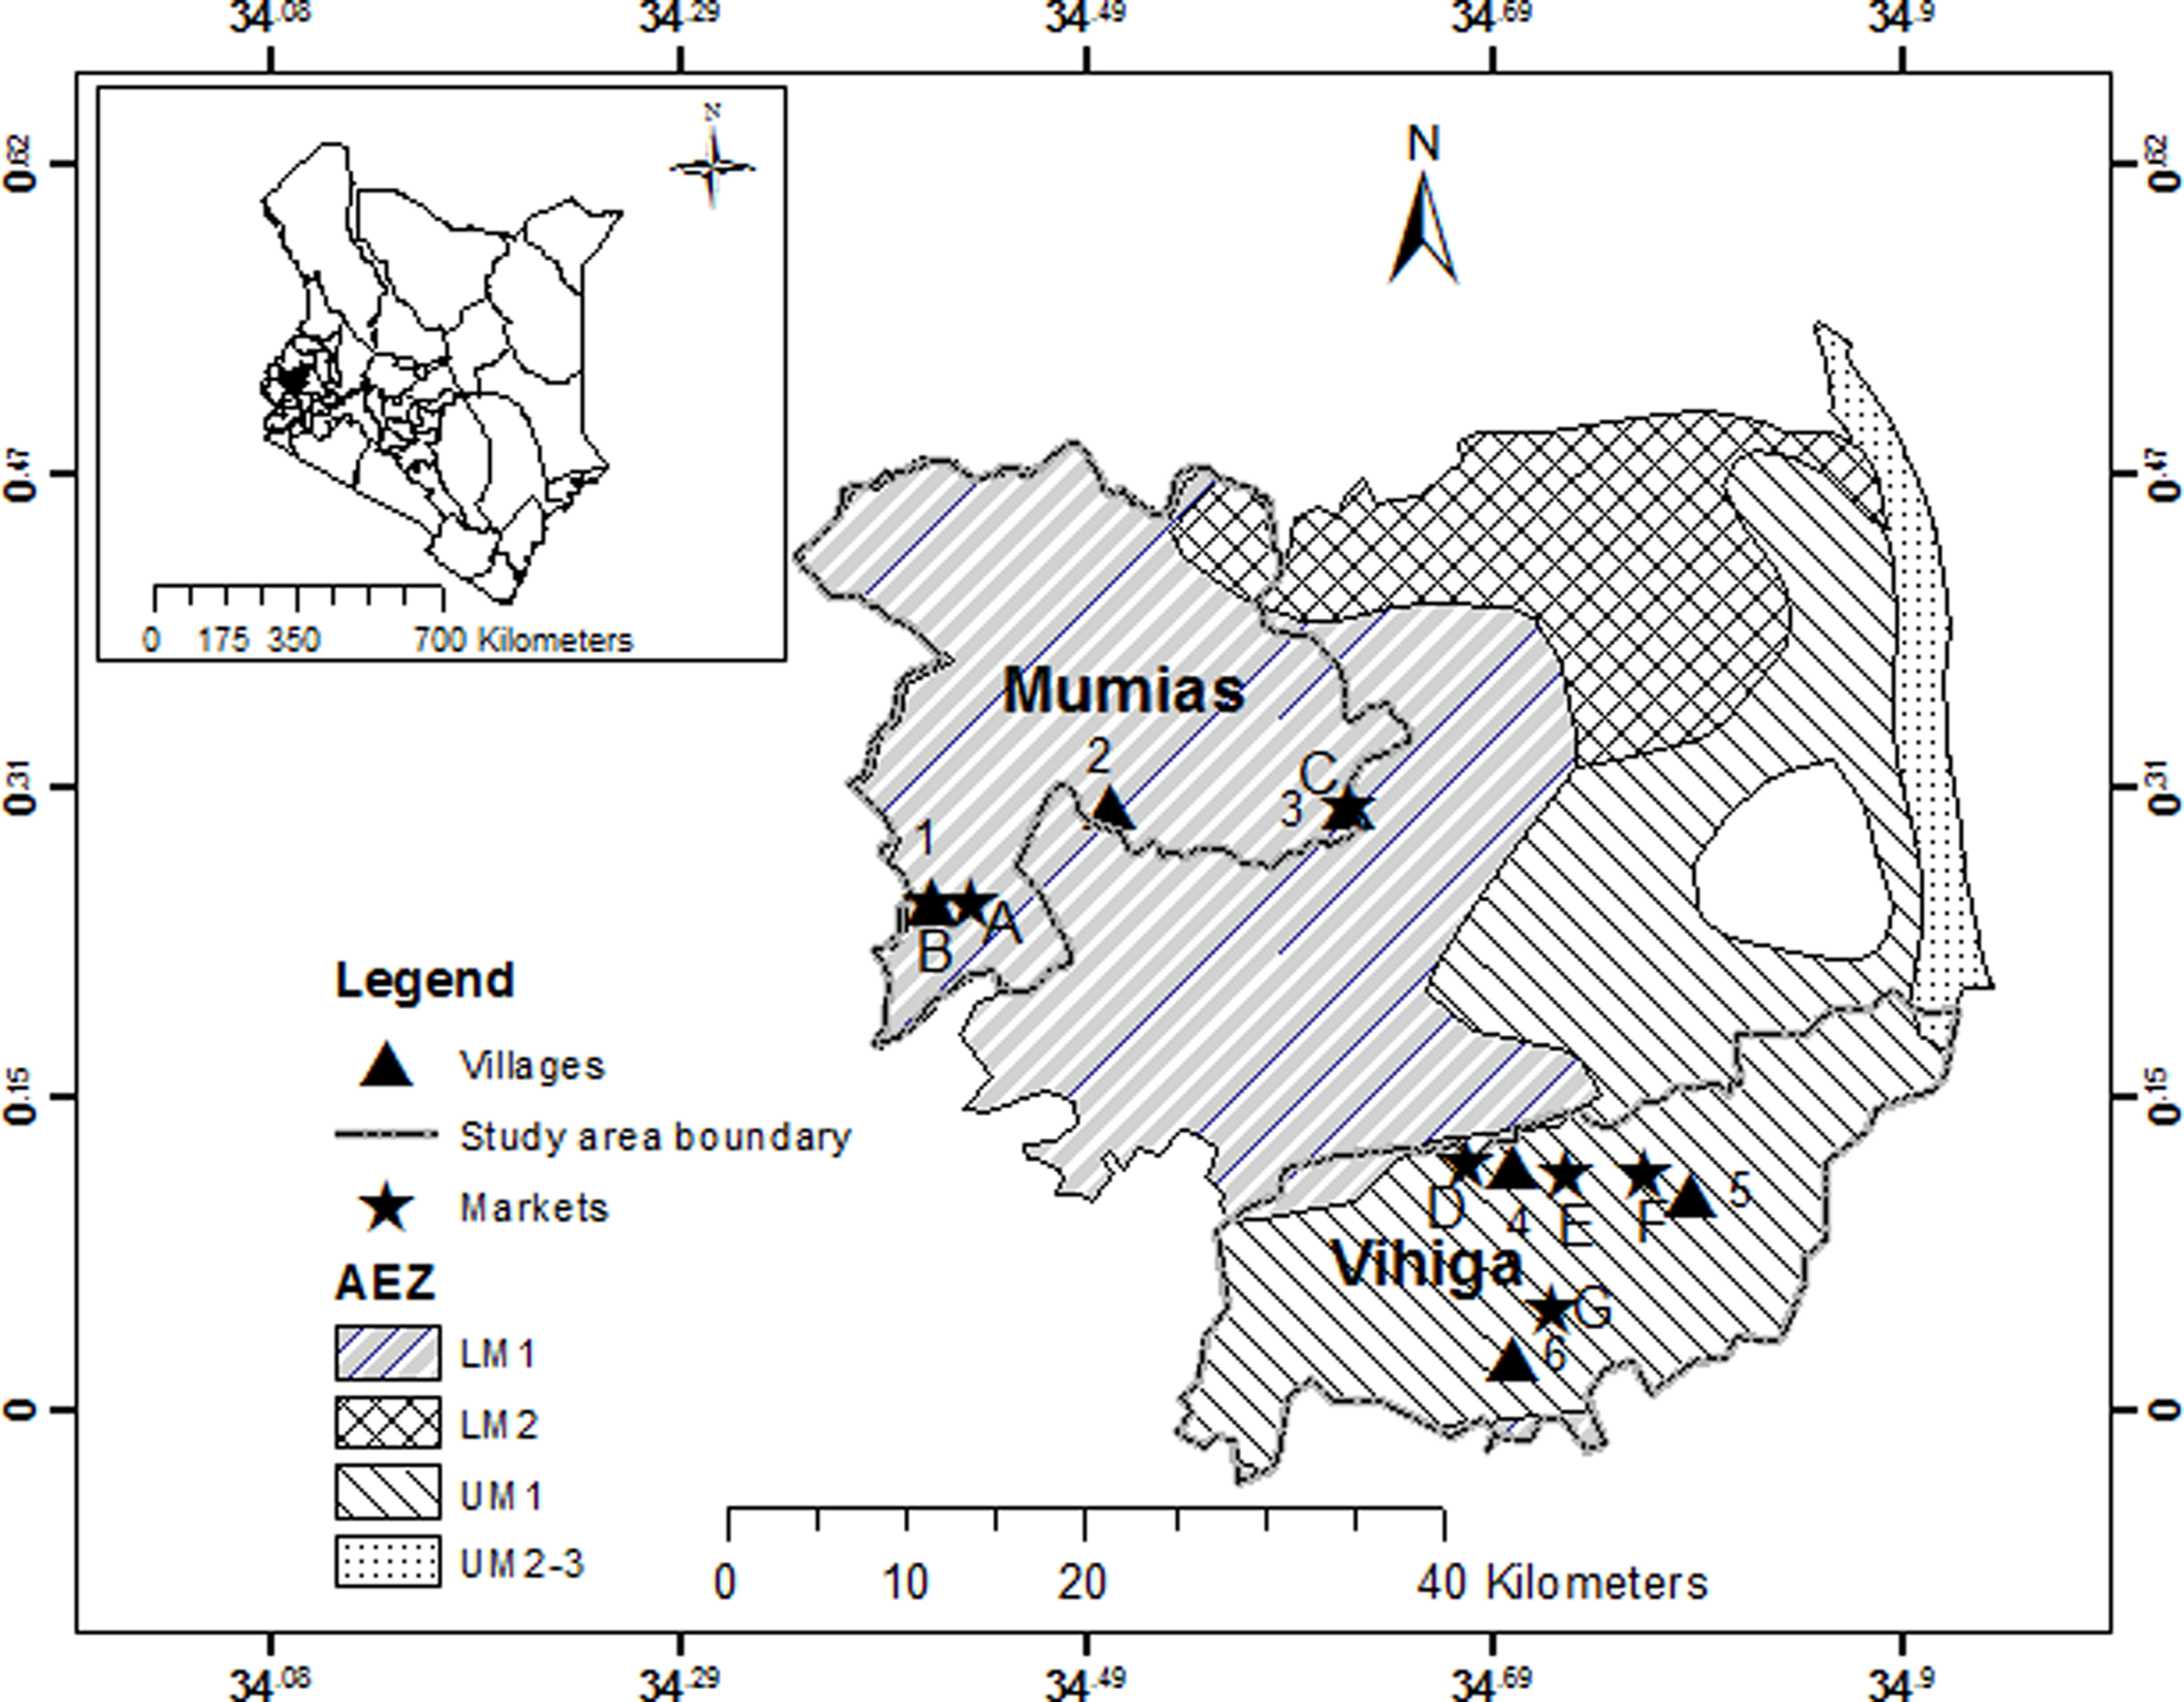
Map of study area in Western Kenya (dark shade in the inserted map), with Mumias and Vihiga district categorized as humid lower midland (LM1) and humid upper midland (UM1) agroecological zones, respectively. The village (triangle symbols) codes are 1 = Khushipari A, 2 = Emahanga, 3 = Busokho, 4 = Hombala, 5 = Wambenge, and 6 = Lodondo. The market (star symbols) codes are A = Buhuru, B = Mumias, C = Makunga, D = Kilingili, E = Mudete, F = Chavakali, and G = Majengo (adapted from Ng’endo et al. 22 ).
Overview of Geographical, Climatic, and Agricultural Characteristics of Mumias and Vihiga Districts, Western Kenya.
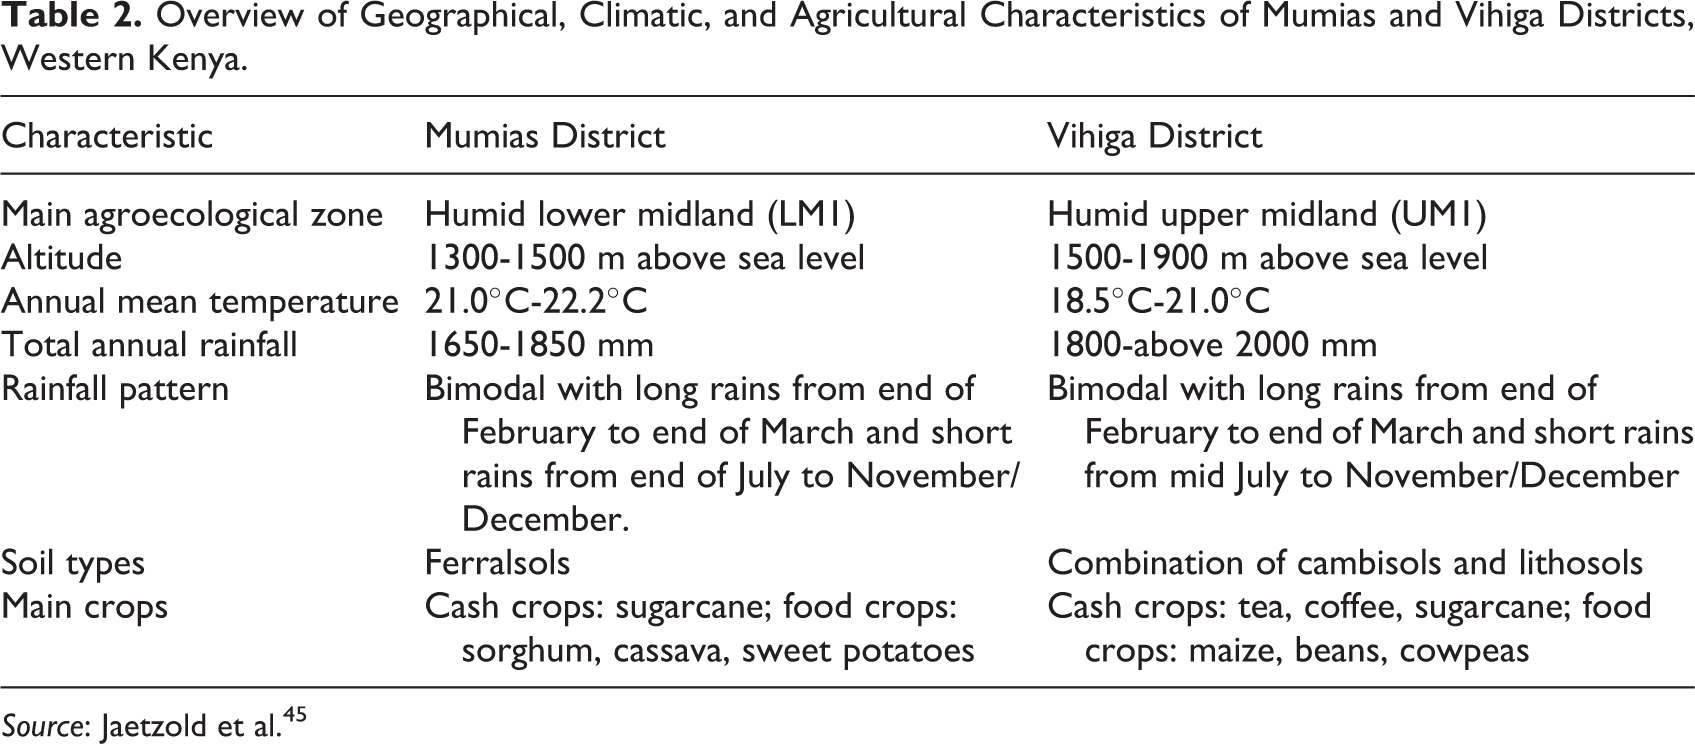
Source: Jaetzold et al. 45
The present study was conducted in tandem with a larger, cross-sectional research project entitled “Improving nutrition through local agrobiodiversity.” For the present study, data collection was conducted through farm surveys, focus group discussions (FGDs), and market surveys. The farm survey purposefully selected 6 villages in order to cover the above mentioned different climatic zones, 3 villages in Mumias and 3 in Vihiga districts (Figure 1), out of 30 villages from the larger study. 46 The latter were sampled according to district village lists with number of households per village applying a “probability-proportional-to-size” approach, 47 with larger villages given a greater chance of selection than smaller villages. A total of 30 households, 15 in Mumias and 15 in Vihiga districts, in the 6 villages (5 households per village) were then randomly selected to represent 10% of the 300 households sampled by the larger study. In both September/October 2012 and July/August 2014, the same smallholder farming households were surveyed. On each farm, the head of the household and/or the spouse were interviewed by using a semi-structured questionnaire to collect data on (1) basic demographic and socioeconomic household characteristics, (2) names, production data, and uses of food plant and livestock species/varieties produced on the farm, and (3) products of plant and livestock species available and/or consumed by households. Data on living conditions of the households (toilet, water, and health-care facilities), nutritional knowledge of the interviewed mothers and child feeding practices, and anthropometric measurements of the women and their children aged between 6 and 23 months were obtained from the above mentioned larger study.
The body mass index (BMI) for women (n = 29) were calculated from their weight and height measurements (weight in kg/height in m2) to estimate their nutritional status, according to the World Health Organization. 48 One woman was excluded from the BMI analysis due to pregnancy. The nutritional status of the children aged 6 to 23 months was assessed based on their anthropometric measurements and expressed as Z scores for each of the 3 indicators of undernutrition: stunting, wasting, and underweight. 49 The feeding practices of the 6- to 23-month children were assessed based on one of the infant and young child feeding indicators, minimum dietary diversity (MDD). 50 The MDD is defined as the percentage of 6- to 23-month children who receive food from 4 or more food groups per day. 50
In September/October 2012, purposive sampling was utilized in assembling FGD participants 51 who were smallholder farmers. The FGDs were conducted in the 6 villages where the farm surveys were conducted. On the chosen day, 2 gender-disaggregated FGDs 52 were held. This is because it was deemed men and women may offer different views on the same set of questions and they talk more openly when separately grouped. With an aim of enhancing the discussions, 53 a range of varying age-groups were selected in each FGD session so as to stimulate diverse views during each session. Although aiming for between 8 and 12 participants 51,53 in each of the FGD participant recruitments from different areas of each village, the actual turnout ranged from 6 to 11 members, with a total of 97 participants in the 12 FGDs. In consultation with the local contact person in each village, the FGD sessions were held at a central venue in the village. A semi-structured checklist was used to guide the discussion and collect data on (1) incentives and disincentives of diversified and specialized farming systems and (2) seasonal calendar of locally available foods belonging to 6 of the major FAO-defined 54 food groups, according to FGD participant statements on their main use: (i) cereals, (ii) starchy roots/tubers/green bananas, (iii) vegetables, (iv) fruits, (v) pulses/nuts/seeds, and (vi) animal source foods. In each village, the set of 2 specific food groups to be discussed by participants in 1 FGD session were randomly selected. To document the differences in gender views on similar food groups, the second FGD session in each village focused on the same set of 2 food groups.
Smallholder farming households in both the farm survey and FGDs participated in the selection of the 7 major local markets near the surveyed villages in Mumias and Vihiga districts (Figure 1). During both the September/October 2012 and July/August 2014 seasons, the same 7 markets were surveyed, with a total of 65 and 66 market traders interviewed in the 2 seasons, respectively. Simple random sampling was adopted to select the market traders, 55 representing the different market stands with an aim of sampling the whole market. With this, at least 10% of market stands representing each food group were randomly sampled for market trader interviews. In cases where the market trader randomly selected was unavailable to answer the questions, a different market trader representing the same stand was purposefully sampled. 56 A semi-structured questionnaire was utilized to collect market data on (1) edible food plant and animal species available, (2) sources of produce, and (3) selling prices of different foods. Ethical clearance for the present study was approved by the Central University Research Ethics Committee at the University of Oxford, UK. Research permission was granted by the National Council of Science and Technology, Nairobi, Kenya. Oral consent was obtained from each participant by the first author prior to conducting the interviews. Anonymity of respondents interviewed was adhered to when writing up the data collected.
Data Analysis
To determine the extent that availability of different food species (in both farms and markets) improves nutrition, the contents of 7 major nutrients: 2 macronutrients (carbohydrates and proteins), 3 vitamins (folic acid, vitamins A and C), and 2 minerals (iron and zinc) for the different food species were compiled. The selection of these nutrients not only enabled comparability of data with a similar study, 30 but they also represent the first 4 out of the 5 micronutrients (folic acid, vitamin A, iron, zinc, and iodine) that are deficient in Kenya, according to the report of Ministry of Public Health and Sanitation. 57 To compile the nutrient contents of the different food species, 9 different food composition databases were used 21,58 -65 as it was not possible to get the nutrient contents of all food species from a single food composition table. Priority was given to databases with a focus on the African region so as to enhance regional comparability.
Detailed nutrient composition data were missing for some closely related species, hence they were grouped together, and the nutrient data for any of them and were applied to the rest of the group members. This was the case for (i) Amaranthus cruentus subspecies hybridus and Amaranthus hybridus complex, collectively classified as amaranth (Amaranthus species) (ii) Cleome hirta and Cleome gynandra, collectively classified as spider plant (Cleome species); (iii) Corchorus acuntangulus, Corchorus olitorius, Corchorus trilocularis, and Corchorus tridens, collectively classified as jew’s mallow (Corchorus species); (vi) leaves of Cucurbita maxima and Cucurbita moschata, classified as leaves of pumpkin (Cucurbita species); and (v) fruits of C maxima and C moschata, classified as fruits of pumpkin (Cucurbita species). The nutrient contents of some local foods were completely missing from the different food databases, necessitating their exclusion from the nutrient food list. The omitted food species were (i) black plum (Vitex doniana), (ii) java plum (Syzygium cuminii), and (iii) tree tomato (Solanum betaceum). Two of the spices/condiments, tea (Camellia sinensis) and coffee (Coffea arabica), were also omitted. Their exclusion from the final analysis is mainly because their antinutritive effects could be of more importance, 66 and as they were exclusively cash crops, their home consumption was also negligible.
To identify different food clusters on the basis of their nutrient composition, functional diversity analysis was conducted with R software Version 3.1.2 67 using an R script by Remans et al. 30 For the analysis, 2 data sets were utilized: (i) a list of the 7 nutrients for all the farm or market species (nutrient × species matrix) and (ii) a list of species per site, in this case either farm or market (species × site matrix). First, the nutrient × species matrix was used to calculate multivariate distances between food species, based on the uniqueness in nutrient composition and content, which resulted in clustering food species into a dendrogram. The branch lengths of the dendrogram were then summed up from the number of species per site in the species × site matrix. 30 To capture the different parts of a single food species, different food parts consumed from each species were analyzed separately, for example, leaves and fruits of pumpkin (Cucurbita) species. Second, the species × site matrix utilized different approaches to generate market and farm abundance data. For the species × farm site matrix, the on-farm food species abundance data were obtained by counting individuals of each food species that produced yields for the respective year, after which the harvested amounts were converted to 100 g of its annual yield. For the species × market site matrix, the abundance data on market food species were directly related to access, where it comprises the use of both average smallholder farming household income per month and market selling price data, as a way to compare accessibility of diversity in markets. 68 The analysis was done in 3 steps: (i) the market selling price data were converted to price per 100 g of market food species, after which, (ii) the price data were then converted to the percentage of average smallholder household monthly income, and (iii) the resulting percentage was then used as the market abundance data. The larger the abundance data, the larger the access of the smallholder farming household, in terms of price compared to income. 68 To categorize the market food species by 3 levels of food access (low, medium, or high), the cutoff points for 3 equal groups in the market abundance data were carried out using Statistical Package for Social Sciences (SPSS) version 22.0. 69 As the ranges in the market access values differed between 2012 (1.3-25.7) and 2014 (1.5-23.6), the cutoff points used to categorize whether market accessibility in 2012 was low (1.3-4.5), medium (4.6-12.3), or high (above 12.3) differed from those categories for low (1.5-5.3), medium (5.4-10.3), or high (above 10.3) market accessibility in 2014.
For both matrices (nutrient × species and species × site), the nutrient composition was listed per 100 g of food species: carbohydrates (g/100 g), proteins (g/100 g), total folic acid (µg/100 g), vitamin A (µg/100 g), vitamin C (µg/100 g), iron (mg/100 g), and zinc (mg/100 g). The nutrient values for uncooked food species were used, as the nutrient contents vary greatly depending on the cooking method. The resulting raw nutritional values were then standardized by dividing them by the average dietary reference intake values of the corresponding nutrient for both women and men aged 19 to 50 years. 70 The resulting value represented the recommended daily intake value of a nutrient that the food species provides.
To determine the seasonal availability of different food species, a combination of views from both female and male FGD participants were compiled. To calculate the percentage of the 30 surveyed smallholder farming households perceiving food hunger across the different months, hunger months, derived from household hunger scores, were obtained from the above mentioned larger study. 46 Household hunger score is an indicator that serves as a proxy for household food security by measuring household hunger (computed according to standard questions by Ballard et al 71 ).
Results
Characteristics of Surveyed Smallholder Farming Households
Each household mainly comprised a nuclear family with the majority of households (93%) headed by male. The mean age of the household head and the spouse was 40 and 35 years, respectively. In all, 70% of the household heads and 53% of their wives had completed primary school. The total household income (from both on- and off-farm activities) was at an average of 50 USD per month, although this average masks the considerable difference in average income between the 2 districts (at 63% and 37% in Mumias and Vihiga districts, respectively), as shown in Table 1. There were also varying levels of shared decision-making on various uses of money for food (Table 1). With regard to the environment and hygiene conditions, less than half of the respondents had access to safe toilet facilities (43%) such as pit latrines, and protected drinking water facilities (27%) such as piped water or rain water collection. The nearest health facility and local market were within close proximity (up to 30 minutes walking distance) for 40% and 70% of the respondents, respectively. Although none of the women were underweight, more than half (72%) had normal BMI, 17% were overweight, and 10% were obese. Few of the children were underweight (7%) and wasted (3%), while the prevalence of stunting was slightly higher (at 23%). More than half (57%) of the children received MDD. Regarding nutritional knowledge of the caregivers, more than half of the mothers had heard about iron, vitamins A and C, but less than 20% could name at least 1 food rich in any of the 3 nutrients (Table 1).
Species and nutrient diversity through on-farm and market food species
There was a slight nonsignificant increase in on-farm food plant and animal species from September/October 2012 (49 species) to July/August 2014 (52 species; see supplementary material). A similar trend was observed in the markets, with 45 and 48 food items available during the 2012 and 2014 seasons (see supplementary material), respectively. Seasonal increase in on-farm species richness was accompanied by a rise in on-farm functional diversity, from 8.86 to 9.55, in the 2012 and 2014 seasons, respectively (Figure 2). The functional diversity dendrograms also clustered food species with similar nutrient characteristics together, highlighting 3 main patterns in the grouping of food species: (i) one nutrient is provided by multiple species in different food use groups (see supplementary material), (ii) some food species provide more than 1 nutrient, and (iii) while others are excellent sources of 1 main nutrient, hence remaining ungrouped in the dendrogram, for example, folic-acid-rich jew’s mallow (Corchorus) species (Figure 2). During both seasons, regardless of the change in species numbers, all the 7 macro- and micronutrients under investigation were available, either through availability of the same food species or by replacement of some food species with others in both farms (Figure 2) and markets (see supplementary material).
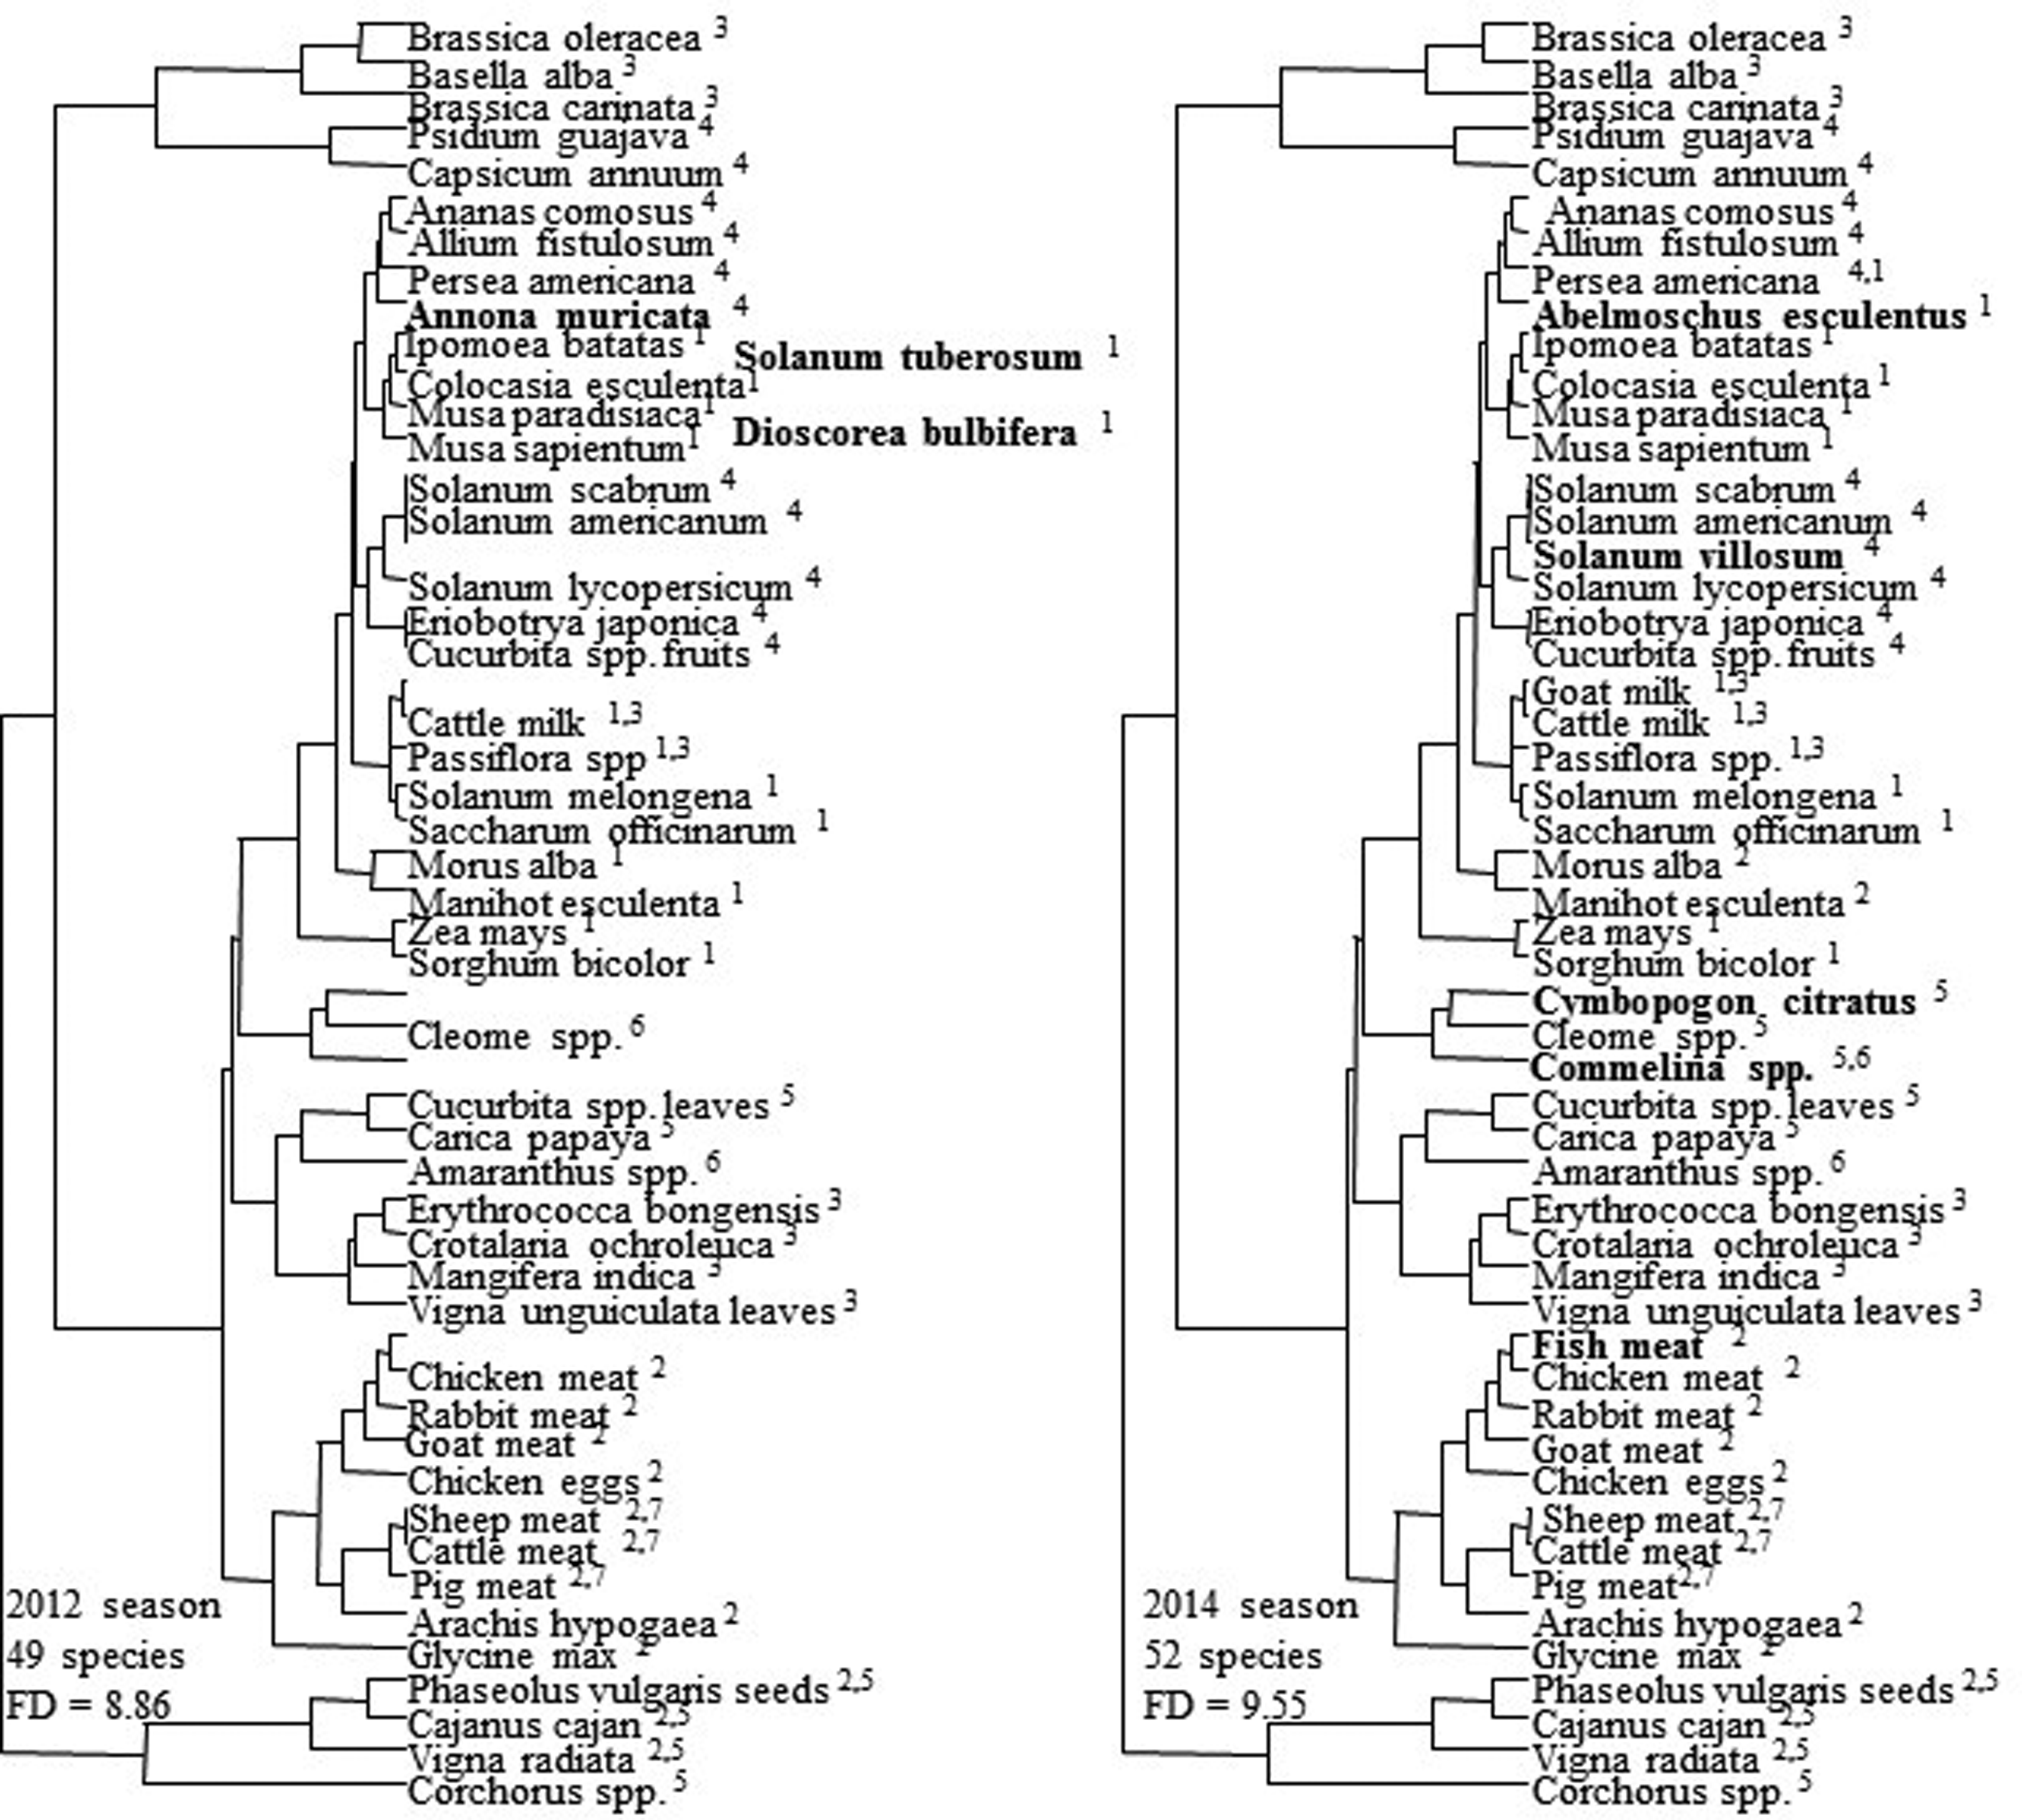
Functional diversity dendrograms comparing on-farm food species richness and average functional diversity (FD) during the 2012 and 2014 seasons in 30 smallholder farms of Mumias and Vihiga districts, Western Kenya. The dendrogram species are clustered based on their content of 7 nutrients under investigation coded as 1 = carbohydrates, 2 = proteins, 3 = vitamin A, 4 = vitamin C, 5 = folic acid, 6 = iron, 7 = zinc. Missing species in either dendrogram indicate those unavailable in that particular season but present in the other season. Species in boldface indicate those that are unique to that season.
While the dendrograms show the potential of farms and markets in providing all the 7 nutrients, accessibility of both on-farm and market food species differed. In the markets, the accessibility of the same food species varied per season. During both seasons, there was low accessibility of food species rich in zinc (Figure 3). The 2 main available food sources rich in zinc were animal source foods (beef) and pulses/nuts/seeds, such as mung bean (Vigna radiata), common bean (Phaseolus vulgaris), groundnut (Arachis hypogaea), and sesame (Sesamum indicum).
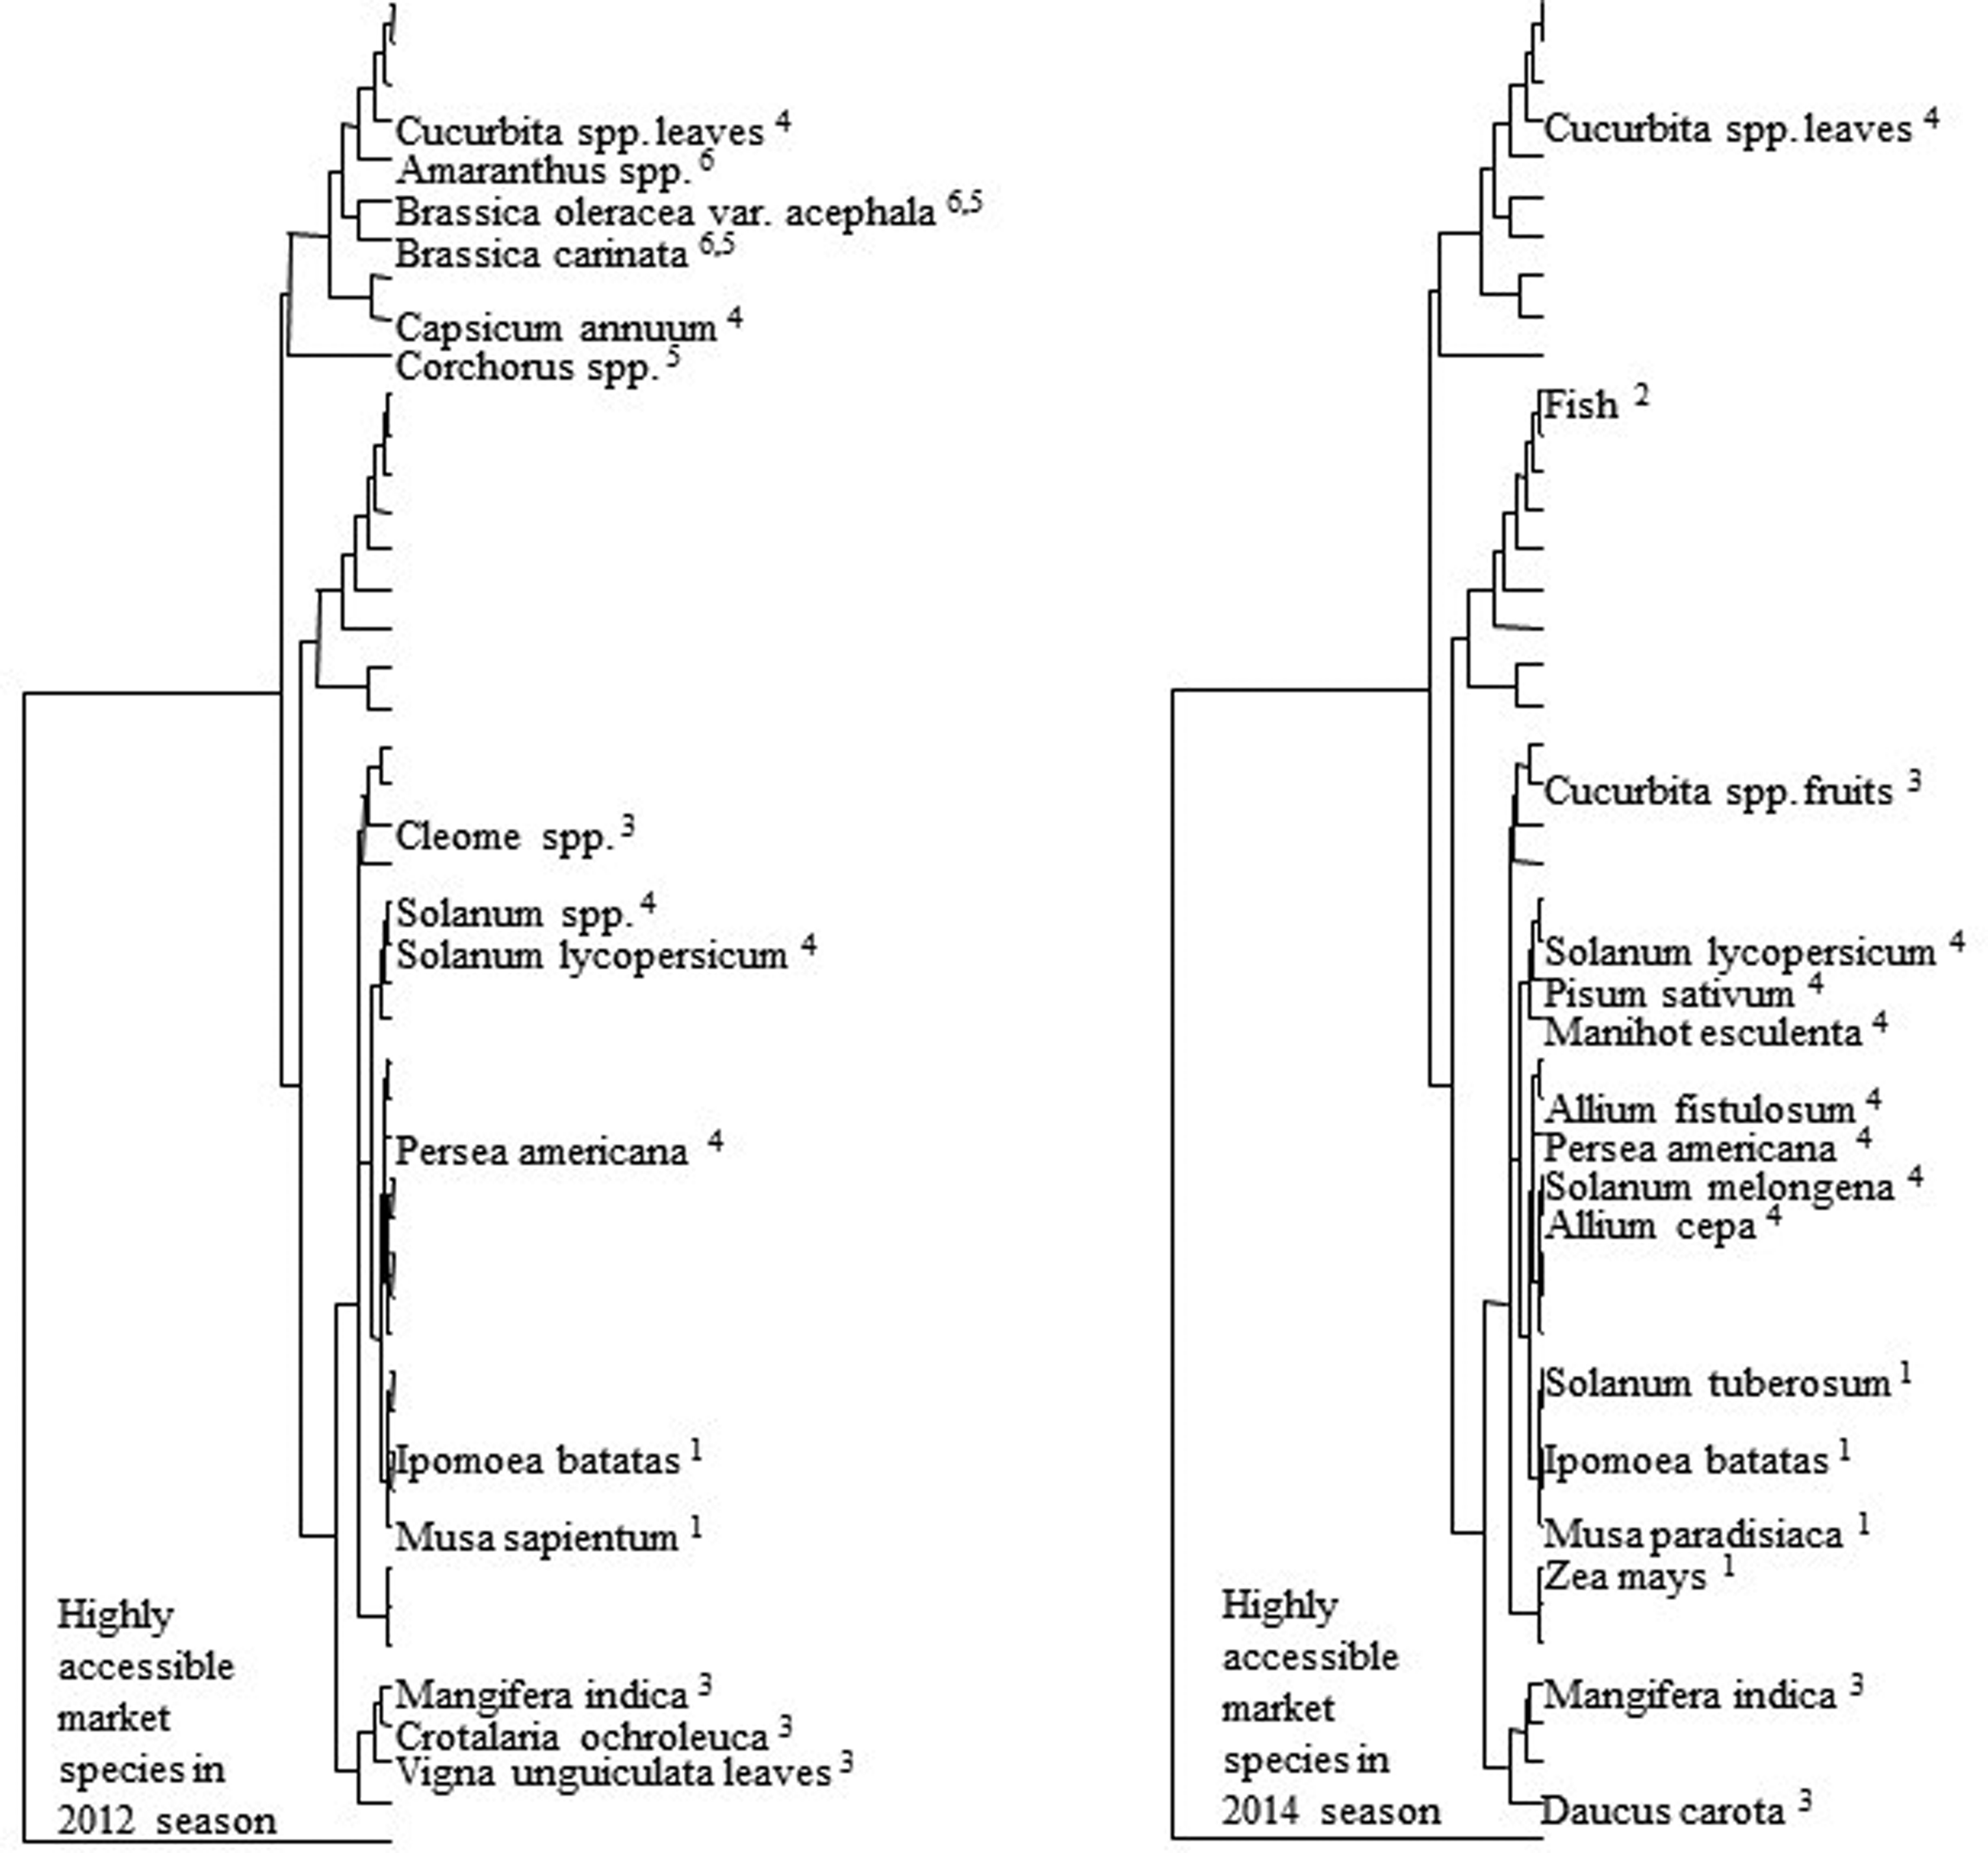
Functional diversity dendrograms comparing highly accessible food species during the 2012 and 2014 seasons in 7 markets of Mumias and Vihiga districts, Western Kenya. With the exception of zinc, these market species are rich in the remaining 6 nutrients under investigation, coded as: 1 = carbohydrates, 2 = proteins, 3 = vitamin A, 4 = vitamin C, 5 = folic acid, and 6 = iron. Missing species in each dendrogram indicate those that are not highly accessible in that particular season, though in most cases they may still be available but accessible at low or medium levels.
In addition to zinc, protein-rich foods in the 2012 season and those high in both folic acid and iron in the 2014 season had low to medium accessibility levels (see supplementary material). In the farms, meat from chicken, pigs, goats, rabbits, sheep, and cattle in the 2012 season, and meat from the latter 4 in the 2014 season were not used for home consumption by varying proportions of households.
On-farm food shortage months and cultural perceptions of foods
The majority of the smallholder farming households perceived the main food shortage months to fall between April and June (
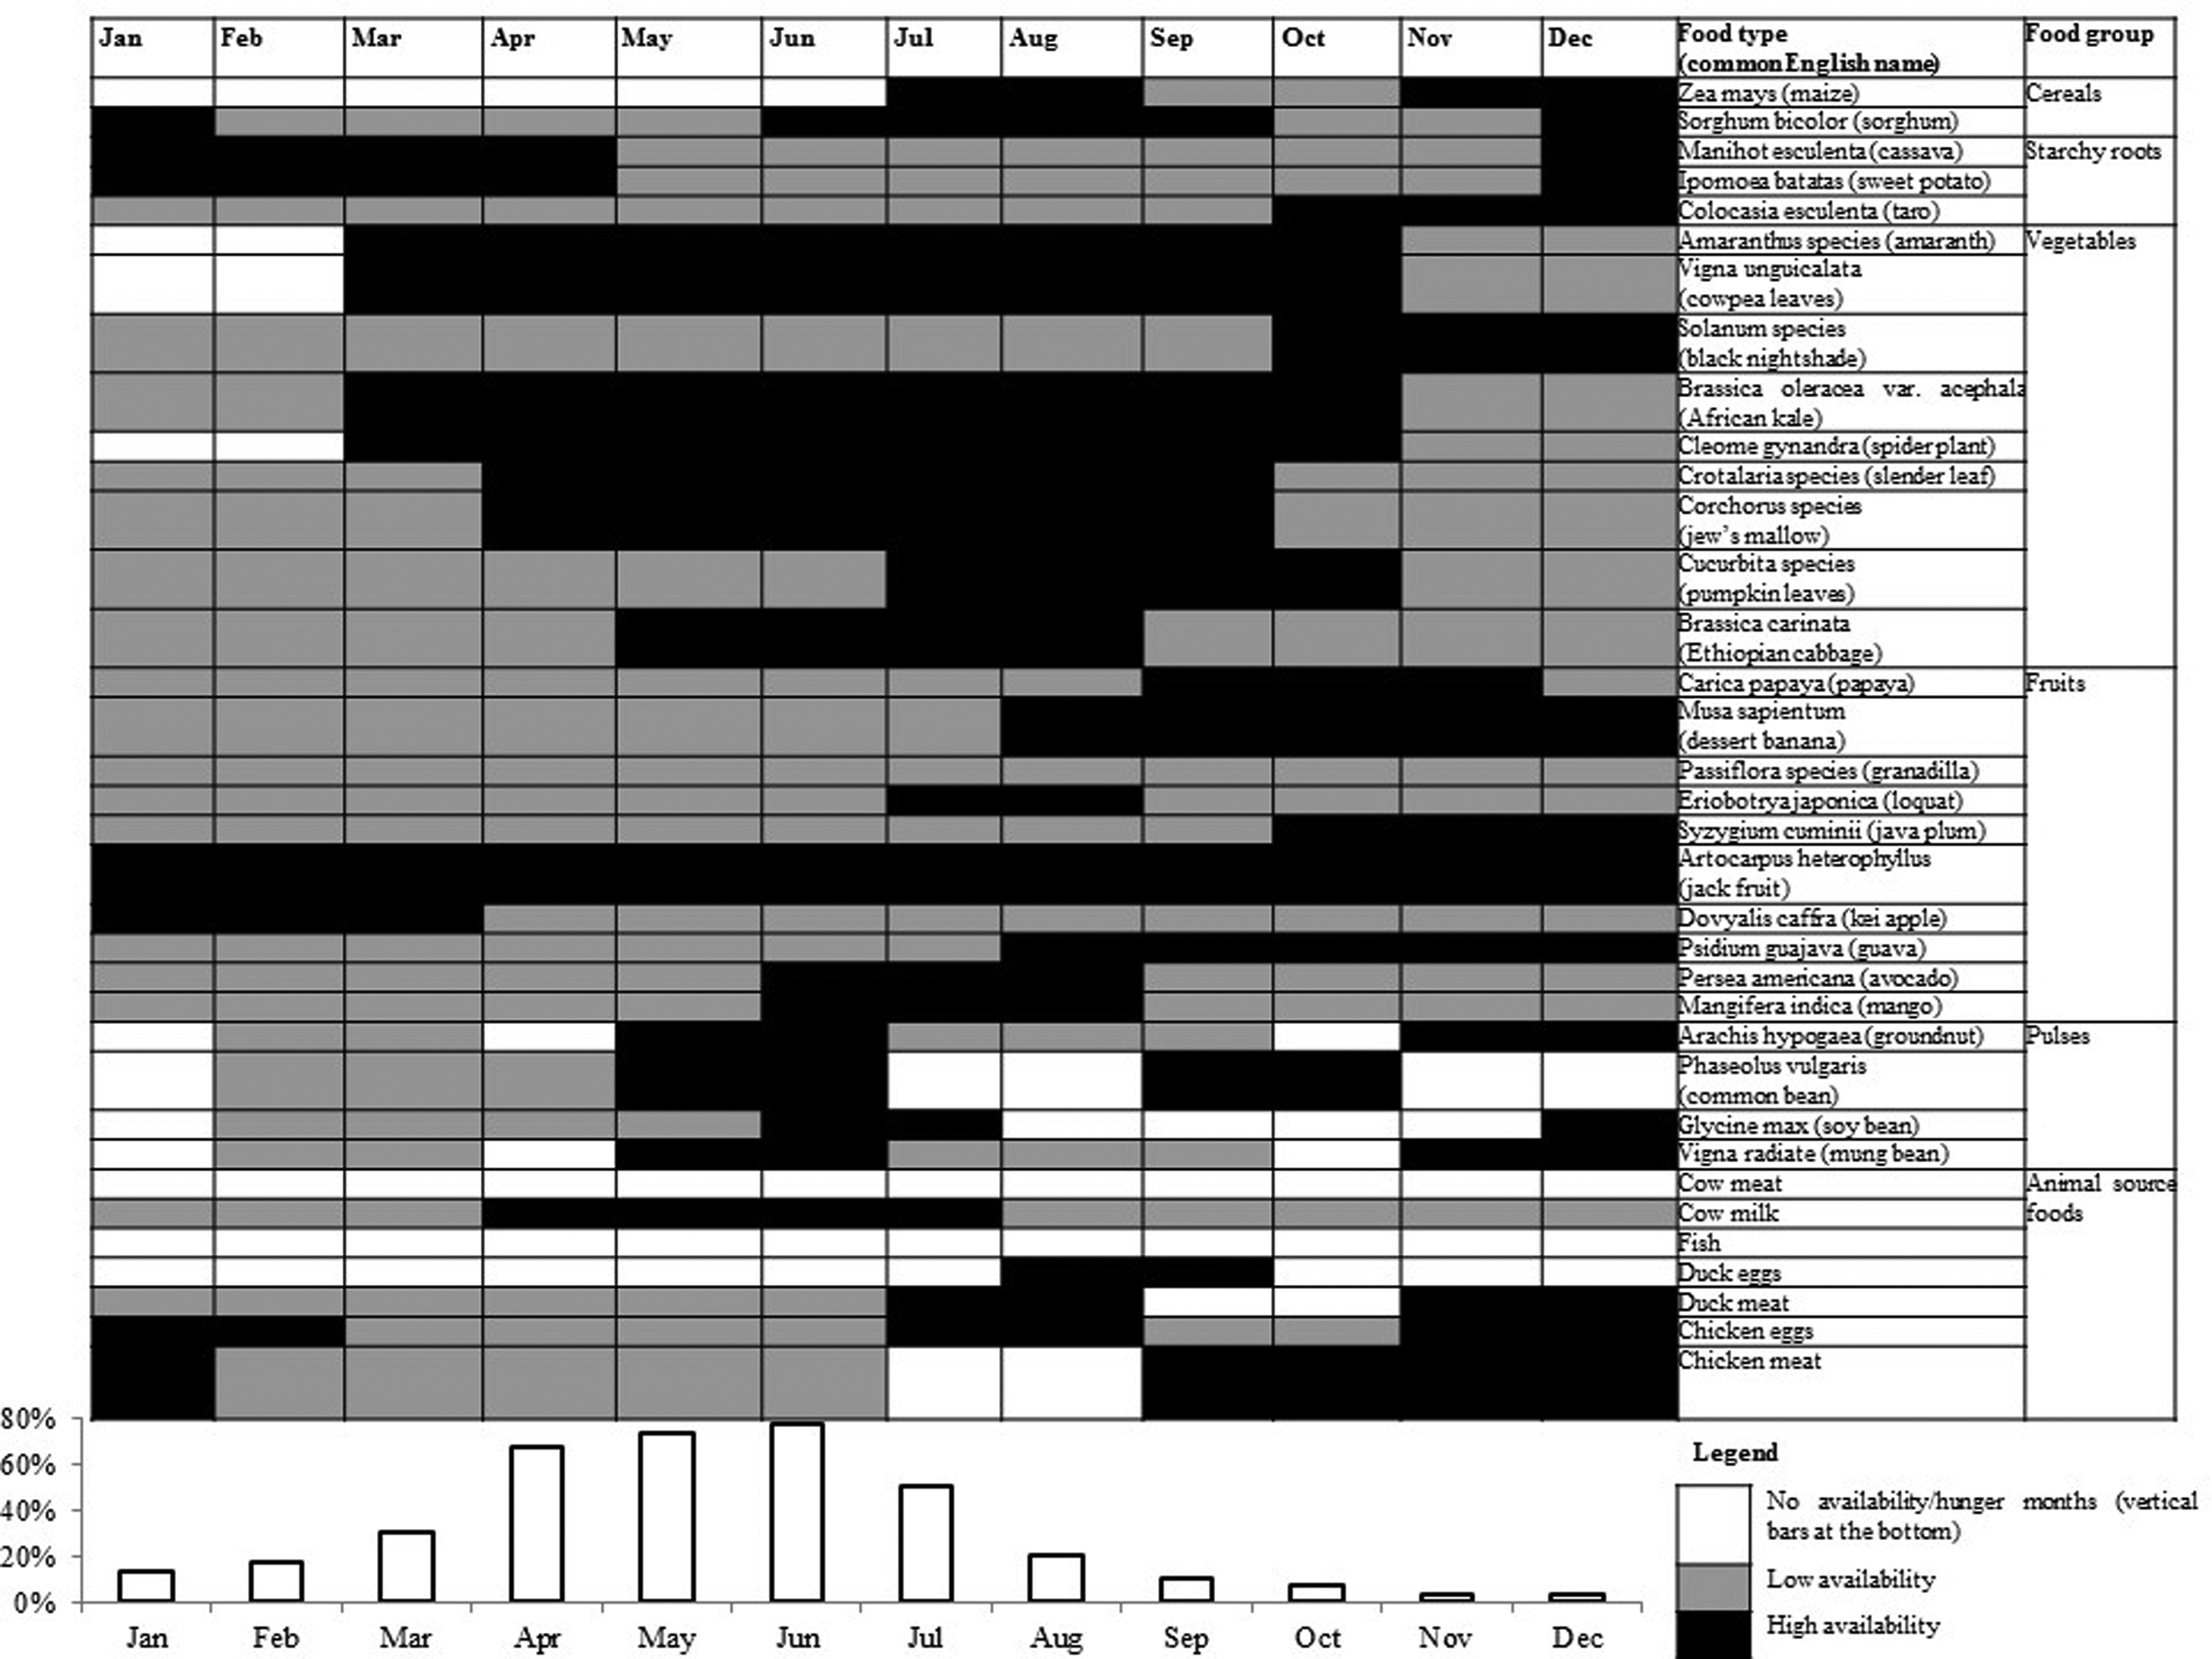
On-farm seasonal availability of major food groups as perceived by focus group discussion participants (n = 97) with corresponding hunger months as perceived by smallholder farming households in Mumias and Vihiga districts in 2012 (n = 30).
The FGD participants considered sorghum as a traditional food that was mainly consumed by those who are accustomed to it. Further, it was not perceived to be good for visitors as it takes too long to cook (about 2 hours), it’s bitter during the hot and dry season hence one needs to add local seasoning to it, and it takes long to chew it. Consequently, even when its availability is high, farming households can survive without it and buy maize instead.
Among the vegetables, pumpkin leaves (Cucurbita species) were highly regarded by both male and female FGD participants, mainly due to their soft texture when cooked. However, they are available in high amounts only after the peak hunger season (Figure 4), while alternative local vegetables available during the hunger season are less preferred for various reasons. According to women FGD participants, cowpea leaves (Vigna unguiculata) take a long time to cook (about 2 hours). In addition to this, men FGD participants reported that since cowpea leaves have both dry and wet season varieties, the dry and hot variaties have a bitter taste hence requiring addition of a local seasoning to improve the taste. One also has to keep on chewing incessantly, and this could lead to social embarrassment. Jew’s mallow (Corchorus species) could also lead to social embarrassment as it’s slippery and one cannot hold it well as the leaves are quite long. Slender leaf (Crotalaria species) were also considered to have a poor taste and requiring a long process to cook them, where one needs to add milk and keep the soaked leaves overnight before cooking them. Similar opinions on taste and time-consuming preparation were reported for the black nightshade (Solanum species), with women FGD participants stating that, “although black nightshade [Solanum villosum] can be given to visitors, one needs to know how to cook it as it can be very bitter. With the modern and improved black nightshade [Solanum scrabrum], it is not as bitter and it can be given to visitors, but only when cooked well, that is, mixed with milk when cooking so as to reduce the bitterness. If this is not done, it will be very bitter as well.” It was also considered time-consuming to prepare amaranth (Amaranthus species), as it has to be mixed with other vegetables.
Although jack fruits (Artocarpus heterophyllus) were highly available year-round, the FGD participants observed that only 30% of the households in the area grew the fruit, and a variable proportion of the remaining 70% purchased jack fruits if desired for consumption. Mangoes (Mangifera indica) and avocados (Persea americana) were the highly available fruits in June, the peak hunger month (Figure 4). Mangoes, especially the indigenous varieties, were also mainly grown on-farm. Interestingly, perceptions on avocados were brought up by both men and women during FGDs on 2 food groups: “fruits” and “fats/oils.” The fruit was predominantly grown by most households and in turn rarely purchased from markets. For its role as a fat/oil, FGD participants rendered avocados to be equitable to a local margarine brand (“blue band margarine”) and as not everybody liked the margarine, avocados as fats/oils were considered as unpopular and deemed unfit to be given to visitors. Nonetheless, none of the listed fruits were completely unavailable throughout the year (Figure 4). Even when in low availability, respondents reported that they don’t buy guavas (Psidium guajava) as they are considered as fruits for children, not for adults, and eating too much of them could result in stomach problems. In addition, women FGD participants stated that, “When highly available, it is not easy to sell guavas as there is no market for them since they are considered as fruits for everyone. Even when they are stolen on farms, we don’t worry as we regard them as ‘free fruits’ which don’t belong to anyone.”
Different types of common beans (Phaseolus vulgaris) were perceived differently by the respondents. For one of the common beans highly available between May and July, men FGD participants were of the opinion that, “although it is a high-yielding type, ‘ndombolo’ common bean type has a low market demand for two reasons: firstly, its black colour makes rice dishes turn from white to black. Secondly, it causes stomach upsets.” Yet another high-yielding common bean type highly available in May and June was poorly perceived, with women FGD participants stating that, “even if ‘bucas’ is a high-yielding common bean type, it is tasteless.” Conversely, 2 other common bean types (‘okuodo’ and ‘rosebella’) were considered to have a sweet taste, while a third type (‘wairimu’) was perceived by women FGD participants as “good for health as it increases blood flow and it is also used in preparing flour for use by children.” Despite soy beans (Glycine max) being highly available in June, women FGD participants suggested that they were less liked as they are tough to chew.
Among animal source foods, all the respondents reported that fish and cow meat were unavailable on-farm and instead sourced from markets year-round, when required. When highly available, chicken meat was considered more valuable than beef, mainly because it was also used for traditional purposes, such as payment of bride price. Despite that duck meat could serve as an alternative meat source, men FGD participants reported that, “although ducks reproduce at a faster rate and they have good meat, traditionally they are considered as dirty animals, as they mostly feed on leftovers and in turn also spoil our farm crops.”
Preferences for different farming systems
An understanding of the various incentives and disincentives for maintaining different farming systems was sought during the FGDs and in the farm survey. Although 97% of the surveyed smallholder farming preferred to have had diversified farms, the 2 main reasons for their farms not being as diversified were the high cost of inputs (67%) and land scarcity (53%). The high cost of inputs was also the main disincentive for maintaining agrobiodiverse farms for both men and women FGD participants. The main motivation factors for agrobiodiverse farms were that it served as a source of household food security and income, among women and men FGD participants, respectively. With regard to specialized farms, men FGD participants perceived that such farms required less labor and management. In addition to this, they generally preferred growing cash crops, but the prevailing poor market prices for crops would be their main disincentive for maintaining specialized farms. Among women FGD participants, inasmuch as specialized farms would serve as a source of income, maintaining a low diversity of crops was likely to result in household food insecurity as well as the temporary use of lump sum money associated with sale of cash crops.
Discussion
Availability and Accessibility of Nutrients in Different Seasons
In this study, increase in seasonal on-farm species richness was accompanied by a rise in functional diversity, a similar trend observed in other studies on Western Kenya smallholder farms, 29,30 suggesting that species richness and functional diversity are interconnected. 72 Despite the seasonal variation in species numbers in both the farms and markets, availability of the 7 nutrients remained constant. The constant nutrient functional diversity could be because sites, for example, farms, with low species numbers can still have high functional diversity if the crops are diverse enough to cover the different nutrient traits, 29,30 and the converse is also true. During different seasons, the dendrograms also show that multiple foods offer 1 nutrient, implying that food species missing during 1 season can be replaced by other foods offering similar nutrients in a different season. While simply adding more species may have little effect on adding functional traits to the community due to functional redundancy, 73 these additional species are likely to replace those affected by the changing climate, maintaining functional diversity and resilience of farming systems. 29
While seasonal nutrient availability remained constant, farms were especially effective in readily availing 4 of the nutrients (proteins, vitamin A, folic acid, and iron) during both seasons, as the market accessibility of these 4 nutrients varied. Farms were also essential in provision of zinc, a micronutrient with low accessibility in the markets during both seasons. With the main zinc sources in this study as some of the legumes and animal source foods, zinc from both sources was least accessible in the markets during both seasons. In the farms, there was low consumption of animal source foods, as the available domestic animals were either sold or kept as assets. Similar findings on out-of-home consumption of animal source foods have also been reported in other low-income countries. 74,75 Despite the out-of-home consumption of animal source foods, some of the readily available legumes provided an alternative zinc-rich food source for home consumption. Markets were good at provision of a selection of food species rich in carbohydrates and vitamin C, with medium to high levels of accessibility during both seasons. While increased market food access could increase household food security, 41 these nutrients were also available in farms. Hence, both farms and markets could play overlapping roles in maintaining accessibility of all the nutrients during the different seasons. Although some food species offer more than 1 nutrient, there is no food species that offers all the 7 nutrients in sufficient quantities, suggesting the need for a diverse diet to meet the nutrient needs in the different seasons. Several studies support that a diverse diet, which is preferably based on locally available foods, is needed to meet nutritional needs in low-income settings. 76,77
Although even more than these 7 nutrients are needed for a balanced diet, the amounts of these nutrients are highly important, 78 with adequacy likely to be reached with increased dietary diversity 79 based on increased agricultural diversity, especially for low-income countries. 35 Beyond nutrients, there are also other numerous health-promoting bioactive substances, which make a diverse diet even more important. 80,81 As an agrobiodiversity indicator, the functional diversity approach remains a robust explanatory tool 72 in visualizing nutrient availability trends, not only in farms but also in markets. For the latter, we have demonstrated its application for use as an indicator of market food affordability 82 by bringing into focus food price and income levels in determining access levels. 35 Integration of both seasonal farm and market agrobiodiversity is a step toward making holistic and clear agriculture–nutrition linkages, especially as there still is limited evidence on how agriculture contributes to nutrition. 35
Food Shortage Months Coincide With Low Preference for a Diversity of Local Foods
Factors not directly related to nutrients may have contributed to poor consumption of a diversity of local foods. The coinciding of hunger months with a lack of maize in Western Kenya was also reported by Djurfeldt. 83 As in most of Africa, maize is considered the most important crop in Kenya 84 and is the most common food crop grown by the rural poor households 85 since its transition to a staple crop during World War I, 86 replacing traditional millet and sorghum varieties. 19 With small farm sizes coupled with living in densely populated areas, a majority of the smallholder farming households are unable to achieve year-round maize self-sufficiency and hence they are bound to be net maize buyers. 87 In this study, the hunger months start to peak between April and June. These 3 months are also part of the cropping season, with farmers mainly planting and pruning their crops. April is a difficult month for the majority of smallholder farming households in Western Kenya as schools have closed and there are extra people to feed. 83 The dwindling of maize supplies further coincides with annual peak maize prices in May and June. 87 During these months, it is likely that smallholder farmers with diminishing on-farm maize supplies are also most likely unable to purchase maize at its highest price. With over 90% of the Kenyan population depending on maize as the staple crop, 85 it is likely that households equate these months, characterized by low maize on-farm availability and market accessibility, to hunger months. This finding is supported by this study’s FGD results from both men-only and women-only farmers where 2 types of hunger experienced in the surveyed areas were described, starting with the rare lack of food availability in both farms and markets (this had happened in 2008 during the post-election violence and during the 1982 coup attempt, where money availability did not guarantee food purchase due to the challenging political environment). The more common type of hunger, characterized by low on-farm food availability but high market food availability at a higher price, occurred annually between January and June. This period coincided with the dry season where water was found in limited quantities, and as rainfall was not consistent, maize did not grow well during this period. Households were forced to rely more on harvested maize stocks, which declined during this period, exacerbated by the small farm sizes. Consequently, a majority of the households (90%) had to buy maize, the staple crop. During this period, maize in local markets was usually sourced from the neighboring Rift Valley region, and it costs twice as much as it had during the wet season (where 2 kg of maize cost about 1.5 USD).
During these maize shortage months, a diversity of other local foods is available in variable amounts, but the low preference for these alternative foods accounts for their underconsumption. This finding is backed up by a study in Ethiopia characterized by year-round availability and accessibility of wild and local fruits, which further overlaps with times of acute food and nutrition insecurity. Despite this, there is low fruit utilization as a result of the peoples’ cereal-based dietary habits and their cultural perception. 25 Similarly, in south-west Uganda, only in times of food scarcity some indigenous vegetables are used, and their use is limited to a relish. 88 Thus, it is likely that, rather than the nutritional value of food, intrinsic factors such as food preferences and attitudes may play a bigger role in shaping the use value attached to the existing biodiversity. 89,90 Although traditional cultural practices are likely to enhance optimal use and conservation of biodiversity, 91 modern maize-dominant production systems have also led to a shift from the more diverse precolonial farming systems. These systems are characterized by a diversity of traditional foods that are better adapted to the local conditions, 19 which are more likely to enable food and nutrition security to be achieved in the face of changing climate. This recent change in farming systems also suggests that diets do evolve over time, and they can also further change toward more diversity.
In addition to poor perceptions of locally available foods, other probable factors for low appreciation of a diversity of local foods in this study could include poor knowledge of the importance of the different nutrients coupled with low education levels of the mothers who were the main caregivers. In this study, the mothers provided their infants with the MDD because they are considered as fragile hence the need to take keen care of their dietary needs during the preweaning stage (0-5 months), 92 but this does not necessarily happen thereafter when early weaning introduces children to nutrient-poor cereal-based foods, mainly porridge devoid of milk and bulky solid foods that are difficult for the child’s developing gut to digest. 92,93 The education level and nutritional knowledge may in turn influence the main decision maker on the use of the different foods. In this study, most of the decisions regarding foods (those purchased, the use of harvested plants and animal source foods) are shared. The main decision maker on the use of animal source foods, one of the main sources of zinc, was the spouse of household head, and probably with knowledge of the importance of the nutrient, they would be more empowered to make better food decisions. However, increased knowledge of caregivers in isolation does not necessarily translate to nutrition behavior change. 94 Even if better nutritional knowledge may not result in better informed dietary choices, it may still be helpful in benefitting from the unappreciated alternative foods, if there could be possibilities for smallholder farming households to sell them and the money generated used to purchase staple foods (such as maize) as well as to improve their overall livelihoods.
One approach that is likely to increase the existing on-farm diversity is to tackle disincentives for maintaining diversified farms. As the extent of on-farm diversity is ultimately determined by farmers’ decisions, it’s necessary to understand their motivations and demotivations. This study suggests that there needs to be a balanced understanding of motivations for both women and men farmers, as this study shows that the use of harvested foods is either a shared or household-head-only decision-making process. In this study, the views of both men and women smallholder farmers suggest the main avenues for increased high on-farm agrobiodiversity to be provision of opportunities for agrobiodiversity to serve as a source of food security and income as well as measures tailored to meet high input costs. Although the relative cost of basic inputs such as water may be comparable in both diversified and monoculture systems, the cost of fertilizers and insecticides is likely to be lower in diversified farms, 73 with such farms likely to concomitantly reduce the impacts of pests and diseases while increasing soil fertility. 12 In a case study in rural Thailand, farmers with diversified farms spent less money on fertilizers and pesticides as compared to those with monoculture farms, who required stronger incentives to practice agrobiodiversity. 95 In this study, a lingering but less explicitly expressed concern during the FGDs was that diversified farming systems are likely to reduce allocated space for the main crop as well as possible negative intercrop interactions, where both could lead to lower crop yields. While diversified systems are more likely to reduce crop damaging effects than simplified production systems, increased diversity also does reduce densities of the main crop, which may in turn affect quantities of harvested produce. 96 The likely interference with existing crop yields is likely to hinder risk-averse smallholder farmers from diversifying their farms. Furthermore, farmers are more likely to adopt agrobiodiversity practices if their adoption offers them personal, rather than societal, benefits. 73
There are various categories of motivations, ranging from direct incentives (that reduce investment costs, such as lowering input costs, providing cost-sharing, and price guarantee arrangements) to indirect enabling incentives (that influence a farmer’s decision to adopt agrobiodiversity, such as market development, producer support services, and accessibility and availability of basic inputs). 97 -99 Different forms of direct incentives that have been implemented have had limited to no impact on increased on-farm agrobiodiversity, especially among the most vulnerable smallholder farmers. Although market price guarantees of maize for smallholder farmers in Zambia has not interfered with the overall crop diversity (but it has led to a decrease in the share of land dedicated to these crops), the incentive has benefitted wealthier smallholder farmers rather than poorer ones. 100 Although the farm input subsidy program in central and southern Malawi led to increased production of maize and tobacco, the 2 crops for which fertilizer, seed, and pesticide costs are subsidized, it also resulted in simplified farming systems. 101 Implementation of these programs have proved unsuccessful in multiple ways in other African countries, 102,103 recommending that a shift to supporting indirect enabling incentives, for example, infrastructure and research and development, could yield higher returns on the financial investments. 103 For example, a preference for indirect enabling incentives (such as market development and provision of extension services) was suggested by smallholder farmers if they were to adopt diverse farming systems of vegetable-agroforestry in Vietnam 104 and conservation agriculture with trees in Eastern Kenya. 105 Therefore, selection of context-specific indirect enabling incentives is likely to catalyze adoption of agrobiodiversity to serve as both a food security and an income source, the main motivation factors for maintaining agrobiodiverse farms that were articulated by the surveyed smallholder farmers in this case study.
Conclusions
This study shows that locally available on-farm and market food species meet existing macro- and micronutrients needs in different seasons, suggesting a link between agricultural and nutrient diversity. In the markets, there are varying seasonal accessibility levels for most of the available food species, which may influence households to strive for on-farm food sufficiency when market food prices are high. Despite the rich diversity of foods offering diverse nutrients on-farm, there is a general low appreciation for most of this diversity, as food shortage months coincided with a lack of maize, the main cereal in the study area, yet during this same period other starchy foods were available that could replace the maize while in addition a diversity of other food groups were present to contribute to a diverse diet. Although this study is limited by a comparison of seasonal food availability data across different years which could have overlooked year-specific food production factors, as well as a lack of quantitative dietary intake amounts that limited the ability to comment on the adequacy of macro- and micronutrients among the study participants, the study offers important insights into the form and extent of interactions across the availability-accessibility-utilization pillars in the food and nutrition security equation. Results on the low food perception and nutritional knowledge suggest that, in order to achieve sustainable food and nutrition security, agricultural interventions need to also take into consideration such factors that are not directly related to nutrients. It is likely that increased awareness creation and nutritional education on the importance of the local foods in meeting dietary needs may increase value for these local foods so that even if they are not necessarily preferred by households, they could be bought by consumers in rural or urban areas who are informed on their nutritional benefits. Hence, by also creating opportunities for smallholder farmers to sell their produce in markets, the incomes raised could contribute to meeting high input costs as well as having extra money to buy other produce in markets that is available year-round but at different accessibility levels. This, in turn, is likely to contribute to year-round food and nutrition security among smallholder farmers in Western Kenya and beyond.
Footnotes
Acknowledgments
We are grateful to all the farmers, local administration, and contact persons who participated in this study. We would also like to thank Dr Roseline Remans (Bioversity International – Ethiopia) for providing the R Script utilized in the functional diversity analyses, to Balqis Mohamed Rehan (University of Oxford), Julia Wagemann (European Centre for Medium-Range Weather Forecasts), Oliver Mundy (Independent Consultant), and Takeshi Inagawa (University of Oxford) for assistance with debugging, running, and explaining the R script. We also thank Dr Patricia Daley (University of Oxford, UK) and the anonymous reviewers for their invaluable comments that enabled the improvement of the initial and final drafts, respectively.
Declaration of Conflicting Interests
The author(s) declared no potential conflicts of interest with respect to the research, authorship, and/or publication of this article.
Funding
The author(s) disclosed receipt of the following financial support for the research, authorship, and/or publication of this article: This research was partially funded by a small grant from the Federal Ministry for Economic Cooperation and Development (BMZ), Germany, implemented by Bioversity International, Regional Office for Sub-Saharan Africa, Nairobi, Kenya. The Rhodes Trust also funded the tuition fees of the first author to undertake this study in partial fulfillment for the Degree of Doctor of Philosophy at the University of Oxford.
Supplemental Material
Supplementary material for this article is available online.
References
Supplementary Material
Please find the following supplemental material available below.
For Open Access articles published under a Creative Commons License, all supplemental material carries the same license as the article it is associated with.
For non-Open Access articles published, all supplemental material carries a non-exclusive license, and permission requests for re-use of supplemental material or any part of supplemental material shall be sent directly to the copyright owner as specified in the copyright notice associated with the article.