
Abstract
Background:
To address vitamin A (VA) deficiency, an array of interventions have been developed for increasing VA status among young children. With numerous possible combinations of interventions, however, comes the need to take decisions regarding which intervention or combination of interventions is most cost effective for achieving VA deficiency reduction targets.
Methods:
Detailed intervention-specific, “macro-region”-level data in Cameroon are used to generate estimates of the costs associated with delivering VA to children aged 6 to 59 months.
Results:
In Cameroon, our estimates of costs per effectively-covered child (ie, children at risk of inadequate intake of VA who are exposed to an intervention and who achieve adequate intake) each year (2 rounds of Child Health Days [CHDs]) were US$3.31 for VA supplements. VA fortification of edible oil and bouillon cube was US$2.95 and US$2.41, respectively, per child effectively covered per year, and biofortification of maize was US$5.30 per child effectively covered per year. Combinations of interventions could reduce costs (eg, delivering additional interventions that affect VA status through the CHDs). Spatial differences in costs within Cameroon were also evident, for example, delivering high-dose VA capsules through CHDs leads to a cost of US$0.77 per child reached in the northern regions compared to US$1.40 per child reached in the southern regions.
Conclusion:
The costs associated with alternative VA interventions in Cameroon differ spatially, temporally, and in their cost-effectiveness. Choosing the appropriate combination of interventions can produce a more efficient portfolio of interventions to address VA deficiencies and VA-related deaths.
Introduction
Vitamin A (VA) deficiency is responsible for 2.3% of deaths of children younger than 5 years of age. 1 To address VA deficiency, an array of interventions have been developed for increasing VA status among women of reproductive age (WRA; 15-49 years) and young children (6-59 months of age), for example, high potency VA supplements (VASs) distributed during Child Health Days (CHDs), VA fortified foods such as edible oils or bouillon cube, biofortified staple crops, and behavioral change communication (BCC) to promote exclusive breast-feeding for children aged 0 to 6 months, and additional consumption of VA-rich foods. Along with this array of alternative interventions, however, comes the need to take decisions regarding which intervention or combination of interventions is most cost-effective in achieving VA deficiency reduction targets.
Our group has developed a novel approach using bioeconomic optimization modeling to select the combination of intervention strategies which most efficiently addresses the problem of VA deficiency in targeted population groups (Vosti et al 25 ). This set of analyses requires information on the distribution of VA deficiency, the estimated impact of related interventions on VA status or the risk of deficiency (Engle-Stone et al 9 ), and the cost of delivering these interventions. The present article describes how the program cost estimates were developed.
Available data suggest that some VA interventions are more cost-effective than others. 2 However, existing cost estimates for alternative VA interventions are generally less useful to policy makers than they could be because they incompletely address or ignore (a) detailed differences in costs within and between interventions, (b) differences in costs that depend on the combination of interventions or sequence of interventions, (c) subnational variation in the intervention-specific input use or input costs, (d) supervision and other overhead costs not associated with intervention implementation/product delivery, and (e) start-up costs versus operating costs for some interventions. Moreover, available estimates tend to assess costs at a single and generally very short time step, which can overlook important changes in costs over time.
This article addresses these and other issues in the context of current and planned VA interventions in Cameroon. More specifically, detailed intervention-specific, “macro-region”-level data are used to generate estimates of the costs associated with delivering VA directly to young children via high-dose VA capsules distributed during CHDs and both directly and indirectly to young children via the fortification of oils, bouillon cubes, and the biofortification of maize, which can affect children’s intakes directly through consumption of the VA-rich food or indirectly through breast milk enriched in VA because of increased maternal dietary VA intake. Estimates of coverage are set alongside costs to arrive at measures of cost-effectiveness. Costs and measures of cost-effectiveness are shown to vary widely across regions and over time in Cameroon. Implications of these results for the design and management of national VA intervention strategies are presented and discussed.
Overview
Cameroon is a small, but very diverse, country. Ecologically, the country contains 3 distinct ecological zones (from the semiarid north to the moist-tropical south), each supporting distinct agricultural production patterns and diets of resident populations. Two major urban areas, Yaoundé and Douala, contain 23% of the national population as of 2014.
Vitamin A is currently consumed through a variety of foods rich in VA, such as carrots, orange-flesh sweet potatoes, squash, dark leafy greens, yellow–orange tree fruits, melons, and so on. However, although it is possible to grow VA-rich foods in some areas of the country, many children and WRA have VA deficiency or low VA status. 3 Consequently, several platforms have been developed to deliver VA to these target populations.
Child Health Days are programs enacted in many developing countries to provide children aged 6 to 59 months with high-dose VA capsules, deworming (DW) tablets, and various other health products and services (polio vaccinations, health care messages, etc). Generally, these programs take place twice per year, last up to approximately 1 week, and involve large national communication components and community-based or door-to-door campaigns to locate and treat targeted children. Cameroon has implemented semiannual CHDs since 2008. 4
Large-scale food fortification (LSFF) programs make use of commercially processed foods (eg, edible oil and bouillon cubes) as vehicles to deliver VA. These foods are fortified with VA by integrating a VA-rich premix into the food at some stage of processing. Currently, Cameroon has promoted a national program that includes mandatory fortification of refined edible oil with VA for use throughout the country. VA-fortified bouillon cubes have also been introduced independently by at least one private company (note 1).
Biofortification is a relatively new intervention for providing additional micronutrients. Briefly, widely consumed staple crops are identified and bred using traditional plant-breeding methods to increase the amounts and/or bioavailability of key micronutrients, such as VA, iron, and zinc. 5 Vitamin A-rich orange-flesh sweet potatoes, orange maize, and yellow cassava are examples. Seeds or vegetative planting material for these micronutrient-rich crops are made available in agroecological zones where these crops are traditionally cultivated or could be cultivated. The hope is that these nutritionally enhanced crops will replace traditional counterpart staples in the fields and in the diets of rural and urban consumers, thereby contributing to the reduction in VA deficiency.
Finally, BCC strategies attempt to change food production, food consumption, and/or child feeding/child care practices. 6 Regarding VA, such strategies aim to, for example, increase the production and/or consumption of VA-rich foods or to encourage breast-feeding practices that are consistent with World Health Organization (WHO) guidelines (exclusive breastfeeding 0-6 months and continued breastfeeding to at least 2 years). There is an array of teaching/messaging packages and methods for their delivery and a variety of organizations that promote them (eg, Helen Keller International and Scaling up Nutrition).
Cost Definitions
Before getting into specific costs related to VA interventions in Cameroon, it is important to define and differentiate different types of costs. Fixed costs are costs that must be paid to run the program, independent of the number of units of services delivered. These costs do not depend on the number of children or WRA reached by the interventions but are necessary for their implementation. Examples of fixed costs are the initial planning meetings and other costs associated with program advocacy, which are required regardless of number of children served. Additionally, some related office rental or salary costs are incurred.
Costs that change according to the number served are also known as variable costs. These costs include the number of VA capsules given during CHDs or amount of premix needed in LSFF (note 2). Operating costs are costs associated with operating the programs, and they come after start-up costs and may include both variable and fixed costs. Finally, in the context of this article, marginal costs are additional costs required when adding an intervention onto an existing set of interventions. For example, if the cost for reaching a child with VA capsules during a CHD is US$1.09, the marginal cost of adding an intervention such as DW tablets to the CHD may be lower than US$1.09 per child reached due to program costs already paid for by delivering VA. Subsequently we will calculate the marginal costs of adding interventions to an existing VA delivery platform. We will refer to these terms throughout the text.
Methods
Methods for Obtaining Program Costs
To determine the costs of VA programs in Cameroon, we used budgets from existing programs, where available. Those obtained were for CHDs that delivered VA capsules and DW tablets and edible oil fortified with VA. In some cases, the budgets were adjusted or adapted to isolate certain interventions or to estimate the costs of a similar intervention, as described subsequently. When actual budgets were not available, we constructed the costs using known unit costs of program components combined with expert knowledge.
Biofortification of maize is currently not implemented at a large scale in Cameroon. A crucial component of our analysis was the organization of an expert workshop in April 2014 to estimate the costs of a potential maize biofortification program. During this workshop, we used a commonly employed method for costing nutrition initiatives called “activity-based costing”. This approach was developed in the 1970s and 1980s for manufacturing but is now applied more broadly. 7 First, a complete set of activities is identified for each intervention. For example, activities required for delivering a biofortification intervention include the multiplication of seeds, creation of field schools, quality control activities, supervision, and so on. These activities are then costed using unit costs of specific components of these activities such as vehicle rental, fuel by distance, Per Diems, and so to produce a final total. 8
Child Health Days
The data for this exercise were primarily drawn from budgets created for the second round of the CHD 2013 by the United Nations Children’s Fund (UNICEF) Cameroon and Helen Keller International (HKI) Cameroon. The budgets were explained and, in the case of a potential micronutrient powder (MNP) distribution, augmented with the help of experts (note 3).
The CHDs in Cameroon operate on a semiannual basis (during the fall and spring of every year) and target all children aged 6 to 59 months of age. They normally include the distribution of high potency VASs, DW, often catch-up immunization, and sometimes oral polio vaccine (OPV). For our purposes, we were only interested in the interventions that contribute to VA status, namely VASs and DW (Engle-Stone et al 9 ). Vitamin A, DW, and catch-up vaccinations are always performed while polio vaccines are distributed only once a year. There are also occasionally some other smaller health interventions depending on the desire and budget of participating organizations. 4 To isolate these categories, we first removed costs directly related to other vaccinations. All details related to oral polio vaccine and other vaccination costs were not known, but we attempted to eliminate from the analysis items that were specifically directed solely toward vaccinations besides polio (eg, vaccination teams, vaccination training, vaccine costs, etc).
The total overhead cost of a CHD is assumed to be the cost of all aspects of a CHD except costs related to the purchase of VA capsules, DW tablets, or polio vaccine. Since we were also not currently focused on polio (because it does not influence VA status) but were not able to sort out costs directly related to delivering polio orally door to door, we assumed that 10% of the total cost of a CHD is the cost of delivering polio vaccine. This is due to the need for planning around this service and an assumed share of supervision and freight costs for delivering the oral polio vaccines. We thus removed this amount from our calculations. Finally, based on information from local experts, we assumed that if a CHD delivered just 1 of the 2 products (VA capsules or DW tablets), the total costs would be 90% of the total overhead cost (excluding the capsules and tablets) of these 2-product CHDs. Each additional intervention added to the CHD would then add 10% of total overhead costs; this reflects the high cost of starting a CHD, but the low marginal cost of adding an additional product to an already existing CHD (note 4).
We also consider whether MNP, a powder that contains multiple micronutrients including VA, would be a cost-effective approach. It could be given through the CHD and thus would be an additional 10% of the 2-product CHD costs (plus the MNP packet costs). Potential MNPs are estimated to cost approximately US$0.03 a packet. 10 We assume that 60 packets are delivered to each child with each CHD or US$3.60 per child per year in supply costs. In the case where MNP is the only intervention for the CHD, the cost of delivering the MNP would be 90% of the adjusted CHD cost.
Costs were reported based on the 10 administrative regions of Cameroon plus Yaoundé and Douala. The CHD implementation in most of the regions was managed by the Ministry of Health, UNICEF, and other partners. However, the Littoral region (located in Southwest Cameroon and including the city of Douala) was managed by HKI. This made differences in how costs were allocated across categories. To avoid making assumptions about how costs were allocated to similar activities across Cameroon, we instead grouped costs separately for the Littoral region and for the other regions and then aggregated up to the national level.
We divided the costs of the Littoral region into 7 categories: (1) distribution, the actual distribution of the VA capsules to the children through door-to-door visits or through fixed points as well as direct communication to households about the program itself; (2) the VA capsule costs including freight and delivery costs; (3) supervision, the labor per diems, transportation, and other costs related to managing the project at different levels. This also includes costs of supervision, for example, management by HKI and their overhead costs; (4) training activities, given to all the teams and schools involved in the CHDs; (5) other communication of the program via TV and radio; (6) evaluation of the program and data collection activities; and (7) central administrative costs divided among the different regions.
The other 9 regions were administered by UNICEF and others, and the activities are divided somewhat differently based on their budgets. They also include supervision and funding by the other organizations involved in the CHDs, namely, UNICEF, WHO, and the Cameroon Ministry of Health. The costs represent the total overhead costs of the program, without catch-up vaccinations but with polio. The estimate for the total indirect costs is 10% of the total costs for each region (note 5).
We also evaluate costs based on 3 macro-regions of Cameroon, grouping the administrative regions of the Extreme North, North, and Adamaoua in the North macro-region, the southern 7 regions in the South macro-region and the cities of Yaoundé and Douala in the Cities macro-region.
Large-Scale Food Fortification
The data for this exercise were drawn primarily from budgets created by Helen Keller International Cameroon, which along with UNICEF, the Ministry of Health and the Ministry of Mines and Industry of Cameroon, helped manage the roll-out of the oil and flour fortification programs. 11 The budgets were complemented with the help of experts who have worked in the area of child nutrition for years and specifically on the VA fortification of oil and fortification of flour with iron, zinc, and selected B vitamins in Cameroon (note 6). The refined edible oil (and flour) fortification program in Cameroon took approximately 3 years to implement (2008-2011).
Biofortification
The data for biofortification estimates in Cameroon were drawn from budgets developed during a workshop involving experts on biofortification in Cameroon (April 2014). The participants were from the Ministry of Agriculture of Cameroon, the Institut de Recherche Agricole pour le Developpement (IRAD), and Helen Keller International. Biofortification is the process of breeding varieties of crops (normally staple crops) with higher than average amounts of key micronutrients such as VA, zinc, and iron. The following are cost calculations for just VA biofortification of maize, although future costing will be done for cassava and sweet potatoes. Yellow cassava and orange maize are just beginning in Cameroon (they started in the 1980s but did not progress very far) and sweet potatoes are at an even earlier planning stage.
Results
This section reports the costs of each intervention of the aforementioned types of VA interventions: (1) VA, DW tablets, and/or MNP delivered during semiannual CHDs, (2) large-scale industrial fortification, and (3) biofortification of orange maize—each of which is currently or could be implemented to provide VA to at-risk children 6-59 months. For each type of intervention, we define marginal costs and describe potential cost savings due to combinations of interventions and start-up and operating costs. We also explain our costing of these interventions within the context of Cameroon and provide estimates of total costs and costs per child reached or effectively covered by the intervention.
Child Health Days
Table 1 presents these costs and each activity’s share of the total CHDs for the 9 regions supported by UNICEF. Costs for the Littoral region follow a similar pattern but are categorized differently and are in a separate table available upon request. Categories such as Per Diems and communication costs accounted for 27% and 18%, respectively, of total costs, while the actual capsules represent only 5% of total costs or just 3 cents per child reached.
Costs by Activities (Fall of 2013).a,b
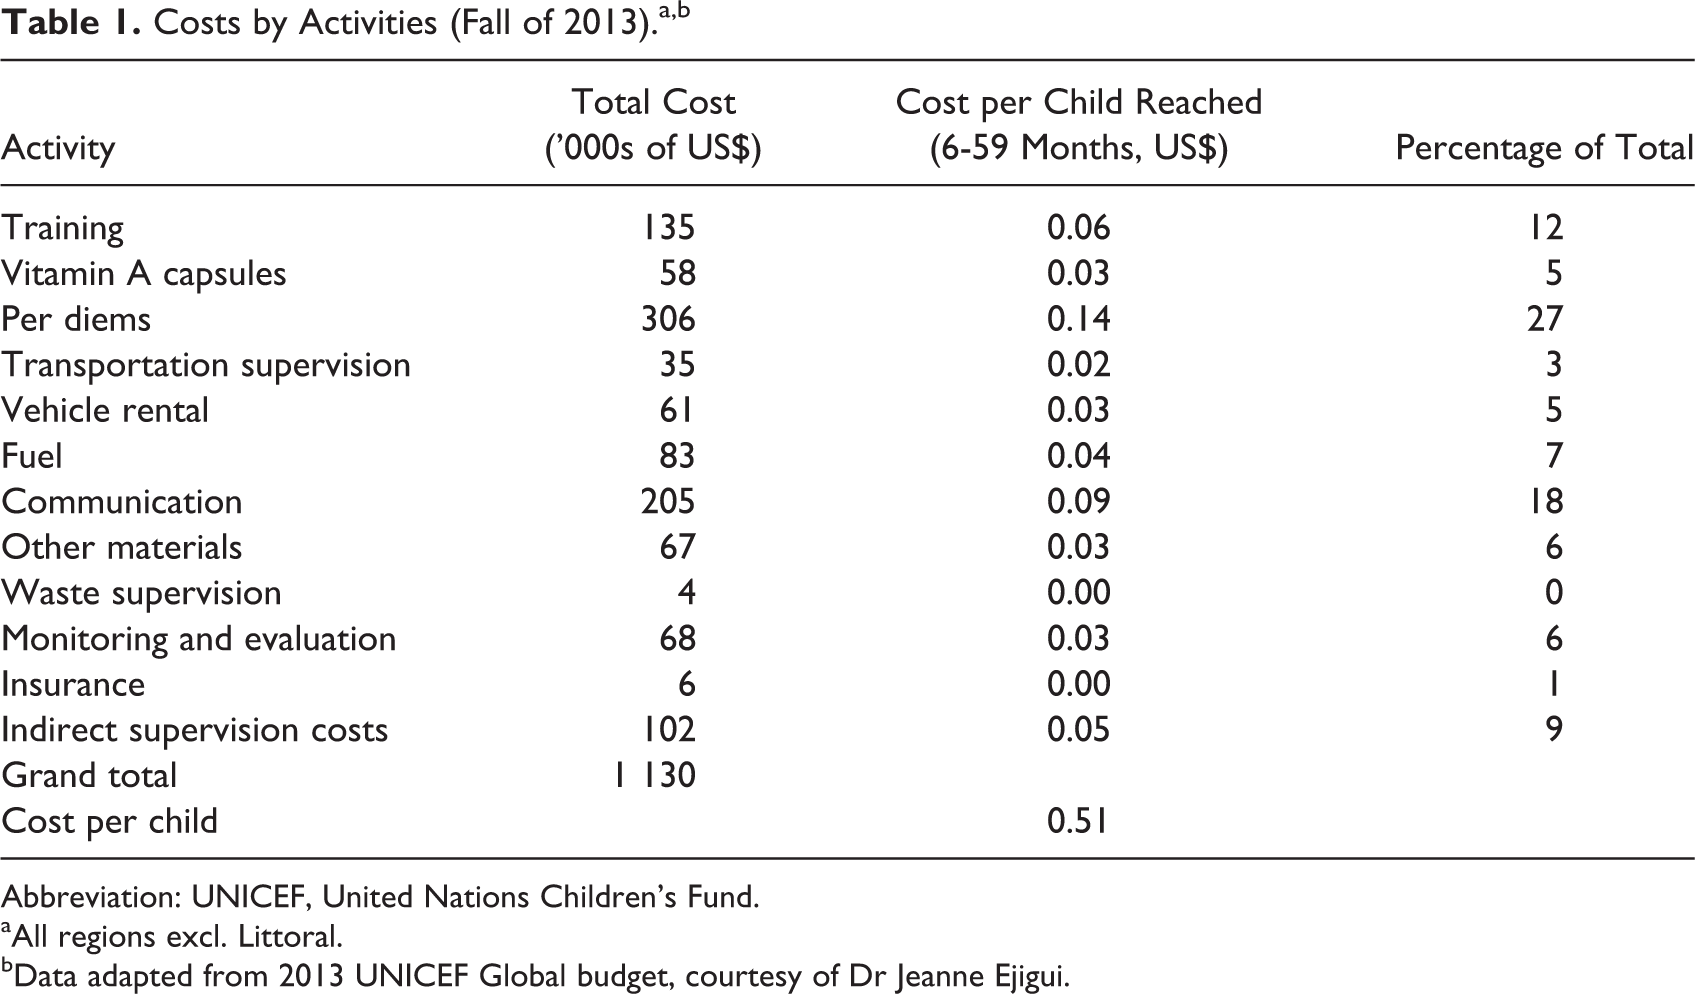
Abbreviation: UNICEF, United Nations Children’s Fund.
aAll regions excl. Littoral.
bData adapted from 2013 UNICEF Global budget, courtesy of Dr Jeanne Ejigui.
The following section examines the regional breakdown of the CHD that only delivers VA capsules, while later we report total costs of different combinations of interventions. Table 2 is a summary of costs by region for the CHD campaign on October 15 through October 27, 2013. This also includes the cost per child “reached,” which is, in the case of the CHD, the cost per child who received a VA supplement.
Summary of the Costs of CHD for VA capsules only, Fall of 2013 (1st Round), by Region and Macro-Region.a
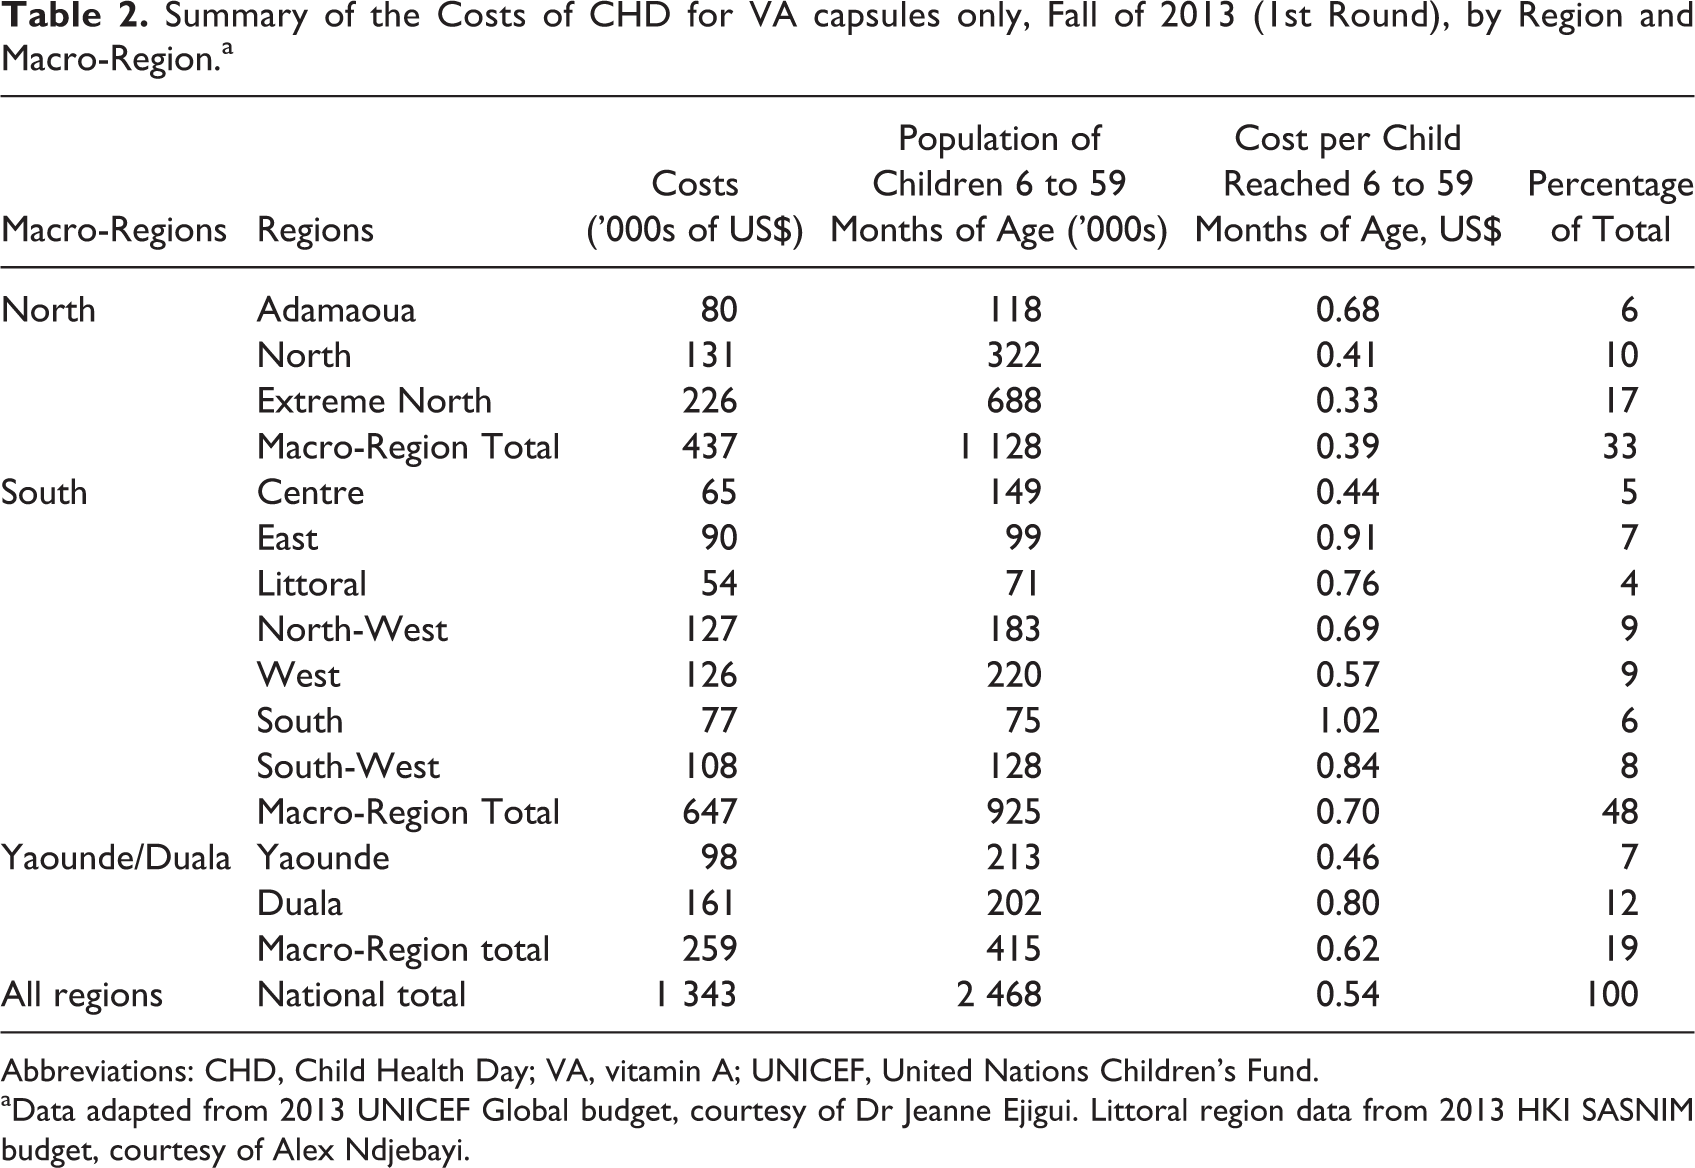
Abbreviations: CHD, Child Health Day; VA, vitamin A; UNICEF, United Nations Children’s Fund.
aData adapted from 2013 UNICEF Global budget, courtesy of Dr Jeanne Ejigui. Littoral region data from 2013 HKI SASNIM budget, courtesy of Alex Ndjebayi.
The table shows that the region with the highest cost share is the Extreme North (17%). This is associated in part with the larger population of children 6 to 59 months of age in this region. The macro-region with the highest cost share, however, is the South, and the cost per child is also the highest there on average. These results will be analyzed further in the section on spatial cost considerations.
Potential interventions using a CHD platform are given in Table 3 for 2 CHD rounds. The total cost of the different combinations of interventions is given by macro-region (North, South, and Yaoundé/Douala).
Yearly Total of CHDs by Combination and Macro-Region (2 rounds).a
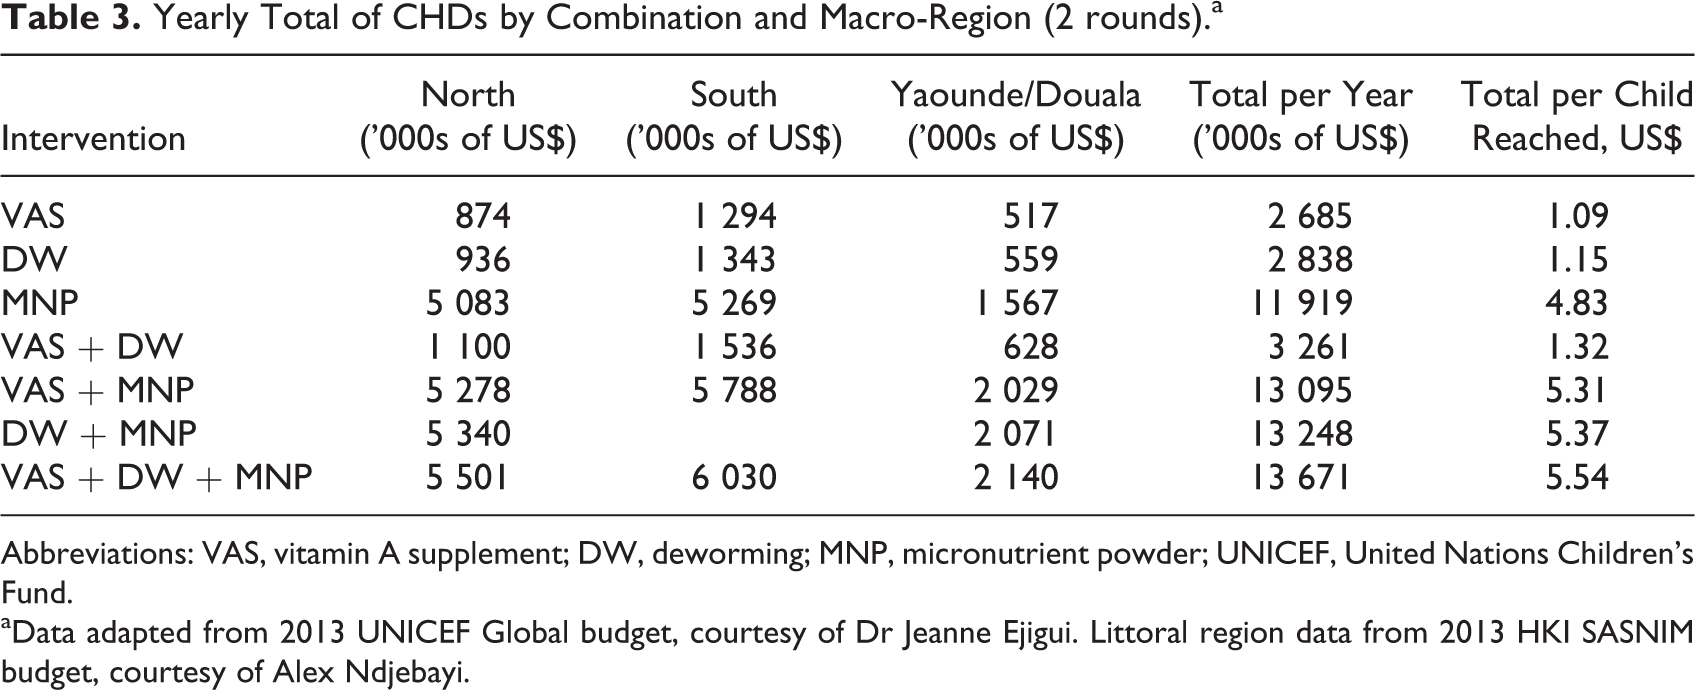
Abbreviations: VAS, vitamin A supplement; DW, deworming; MNP, micronutrient powder; UNICEF, United Nations Children’s Fund.
aData adapted from 2013 UNICEF Global budget, courtesy of Dr Jeanne Ejigui. Littoral region data from 2013 HKI SASNIM budget, courtesy of Alex Ndjebayi.
VA distribution is the lowest-cost intervention due to the lower costs of the capsules relative to DW tablets and especially the MNP packets (approximately US$0.06 for high-dose VA capsules vs US$0.18 for DW tablets and US$3.60 for MNP packets per child per year; note 7). The MNP interventions are the most expensive because of the relatively high cost of the MNP packets themselves, even when the program is combined with VASs and/or DW, and thus constitutes only 10% of other costs associated with the CHD, and the distribution of MNP still increases the program cost by more than US$4 per child per year. By contrast, adding DW tablets to a CHD distributing VA capsules, the cost only increases by US$0.23 per child per year. Of course, MNP packets are not only for improving VA status but also reducing anemia and thus might be less costly when benefits from multiple micronutrients are taken into account (the same could be said for the DW costs).
Again, Table 3 highlights the spatial differences in costs for Cameroon, despite a greater population of children aged 6 to 59 months in the North macro-region than the South macro-region (1.7 mil vs 1.3 mil), it is more expensive to implement the program in the South because of differences in population density and cost allocations. The exception is including an MNP program that increases substantially with an increase in the number of children, as expected given the US$3.60 for MNP packets per child per year.
Large-Scale Food Fortification
Refined edible oil start-up costs: Initial 3 years
The start-up costs are those that were incurred during the initial 3 years of the edible oil fortification program. The costs are divided into 12 cost categories, as derived from the budgets used for the oil fortification program.
The program started with a baseline survey of dietary intake and biochemical markers of micronutrient status. The data on intake and nutritional status were collected during a national survey among WRA and children 12 to 59 months of age in Cameroon, which allowed for an assessment of which fortifiable foods are widely consumed. 3 Also, at the beginning of the project, the technical capacity of the industries and needs for future technical assistance were assessed. Six edible oil production facilities were chosen, and equipment for integrating the VA premix into the oil was provided. 12
The “Development of Norms” cost category under the “industrial assessment” in Table 4 refers to the process of presenting the fortification program to industry leaders and health workers and setting new industry standards.
Start-Up Costs of Edible Oil Fortification (3 years).a
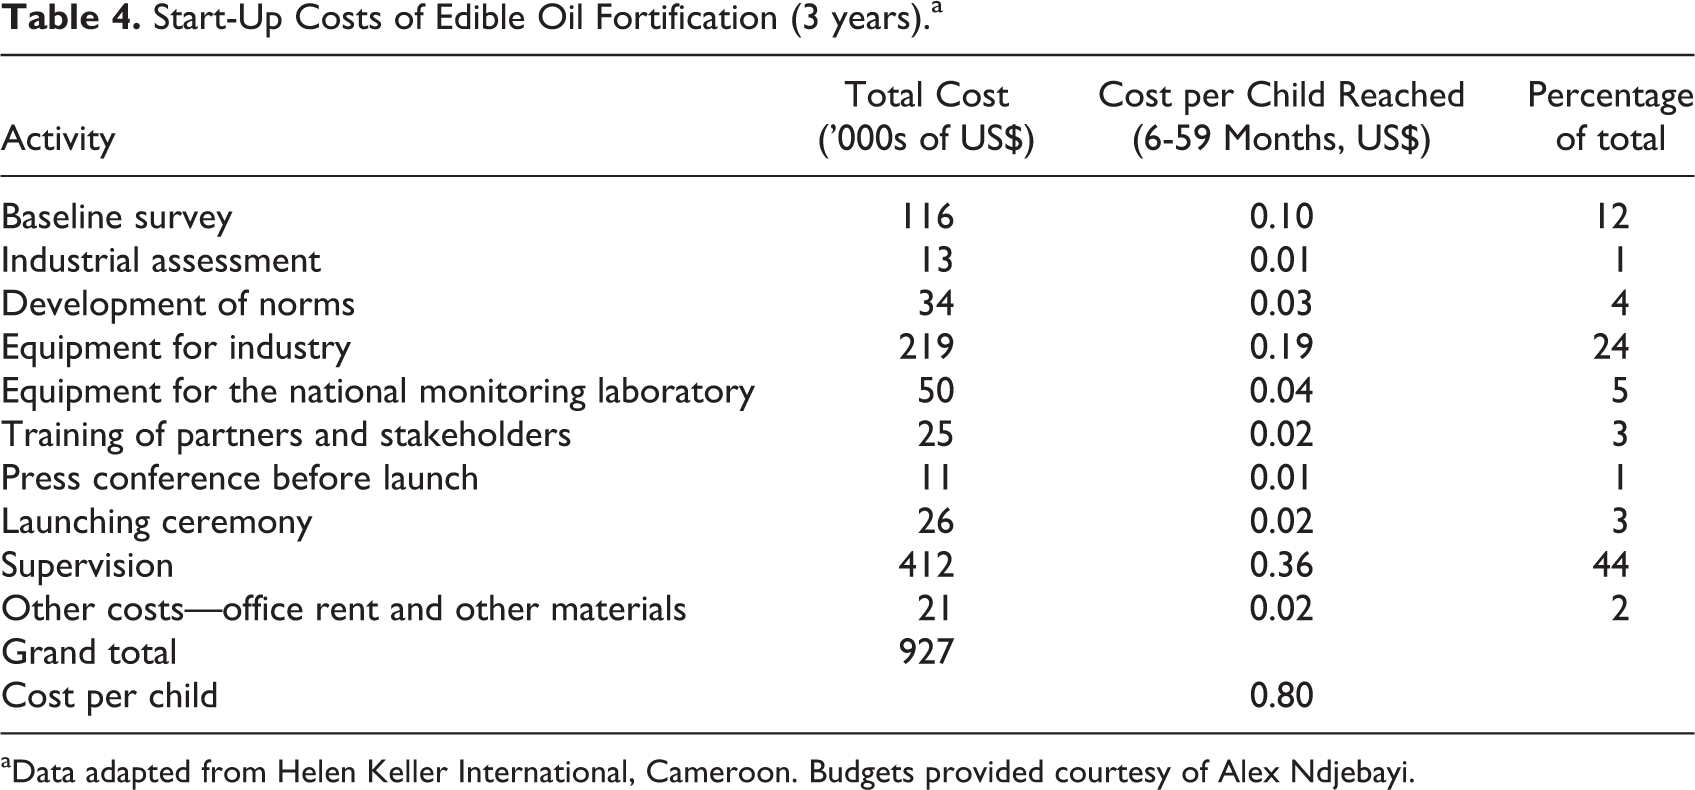
aData adapted from Helen Keller International, Cameroon. Budgets provided courtesy of Alex Ndjebayi.
Along with set-up costs for the oil industry, there were additional costs for the provision of government monitoring and evaluation that would periodically assess fortification levels in oil. For this to occur, the program purchased equipment for analysis for the national laboratory to analyze samples of fortified oil as part of program monitoring activities. In Cameroon, fortification of VA in oil is required now by all companies selling in the market and thus necessitating periodic monitoring and evaluation (note 8).
Training and communication costs were the smallest proportion of total start-up costs (7%), while supervision and planning of the program represented the largest proportion (44%). Finally, office rental and material costs represent 2% of total costs.
Operating costs for oil fortification
The operating costs associated with maintaining the program consist of 3 basic categories, VA premix, monitoring and evaluation, and other costs as shown in Table 5.
Variable Costs of Edible Oil Fortification (For Each Year After Year 3).a
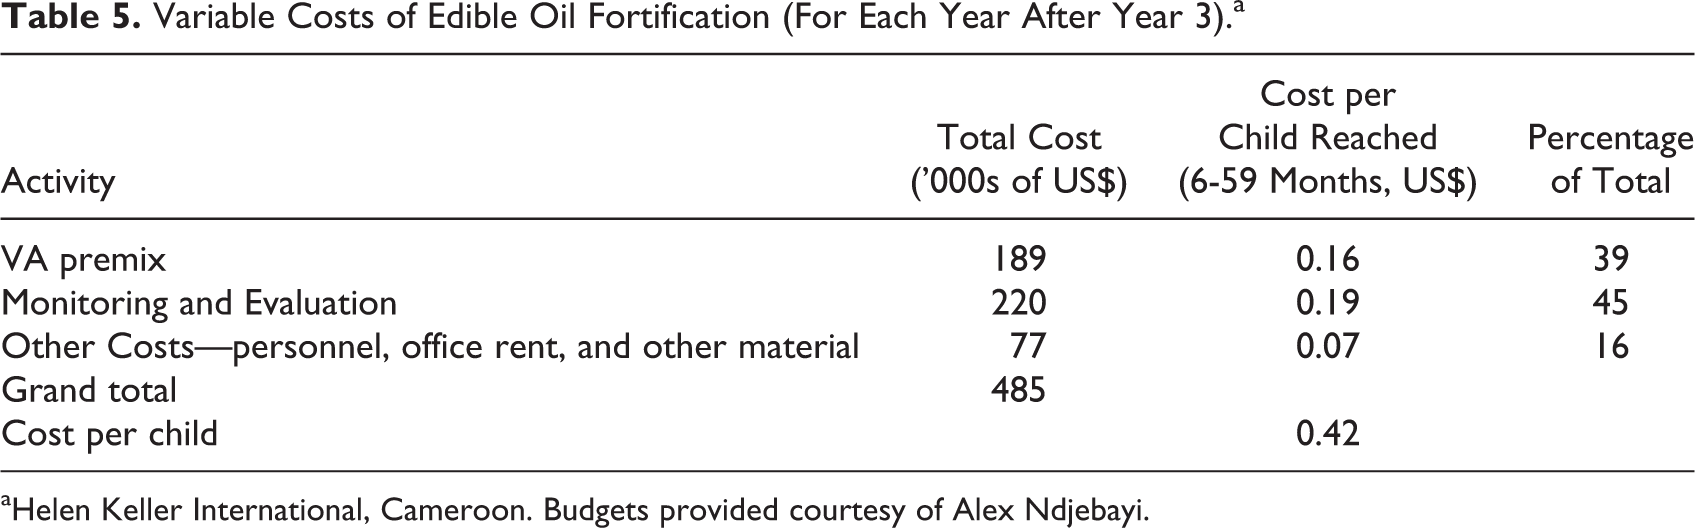
aHelen Keller International, Cameroon. Budgets provided courtesy of Alex Ndjebayi.
Vitamin A premix was first provided by the program (donors) for 6 months but in keeping with yearly costs, we report the cost of a year of premix whereby half of the year is provided by the firms themselves. In Cameroon, firms have taken over the procurement and analysis of VA in their oil. Experts testify that the cost burden did not shift noticeably to the consumers in terms of a higher price of oil, the industry bearing the relatively small cost increase in return for marketing the presence of VA in their product (note 9). Additionally, monitoring and evaluation activities are currently limited in Cameroon but are important components of a fortification program, should be paid for, and thus are recorded here. Monitoring and evaluation encompass the equipment needed to assess fortification levels of oil as well as the different labor costs associated with conducting evaluations of fortification rates in Cameroon, both at the industry level and at market level. The category “Other Costs” includes some supervision costs (one-third of a year of the supervision costs during the start-up phase) as well as office rental and other materials.
Bouillon cube start-up costs: Initial 3 years
Another product that is a promising candidate for VA fortification in Cameroon due to its broad-based use in food preparation is the bouillon cube. 13 Costs are similar to those for edible oil fortification and include a baseline intake survey, the development of norms, supervision costs, and other costs. Some costs of similar activities are, however, different due to the smaller number of firms (there are only 3 main producers of bouillon cube in Cameroon) and shorter travel times (bouillon cube is only produced in Douala), which translates into lower supervision and industry assessment costs. Total start-up costs are US$743 640 or US$0.24 per child reached, which are lower than the US$927 155 and US$0.80 per child of edible oil fortification.
Potential bouillon cube operating costs
Operating costs again come in 3 categories: (1) premix; (2) monitoring and evaluation; and (3) other costs such as supervision, rent, and materials.
The total cost of premix for bouillon cubes is cheaper than that for edible oil because it is used just for a few firms (US$0.03 as opposed to US$0.16 per child reached for oil). The total cost per child reached of US$0.13 per year for bouillon cubes is also lower than that for fortified edible oil, US$0.42, and for the CHD interventions examined.
Combining oil and bouillon cube fortification costs
Currently, only refined edible oil is being used as a food vehicle for VA. Adding another food vehicle for VA, such as bouillon cubes, can help increase the impact of programs on the VA intake and status of the Cameroonian population. The costs of starting this program are less than costs would have been if the oil fortification program was not already in existence. For example, baseline data are already available from the initial survey, and some supervision costs and indirect costs can be avoided because of the knowledge already accumulated from past experience. We assume that the supervision and indirect costs are equivalent to 1 year of supervision costs of the original oil program. All other categories of costs must be paid or require costs that are specific to bouillon cube fortification.
Operating costs for bouillon cube are also similar to those discussed earlier because additional VA premix must be purchased, additional supervision is required, and monitoring and evaluation must take into account a different industry. Total start-up costs are US$339 246 or US$0.12 per child reached, and operating costs are US$370 393 or US$0.13 per child reached per year.
Combining fortification costs for VA in oil and bouillon cube simultaneously
These costs change slightly if both oil and bouillon cube begin at the same time. The start-up costs could take advantage of a combined baseline survey, the costs of developing norms, launching the press conference, and the launching ceremony could be combined. Other costs such as premix, monitoring and evaluation, training, and the industrial assessment would have to include the full cost of each program. For supervision and the category Other Costs, we assume that the costs for 1 program such as oil fortification are equivalent to the costs of supervising 2 programs such as oil and bouillon cube. This is reasonable given the difficulties in starting any LSFF program but the relative ease of supervising 2 rather than just one. There are no savings with operating costs, as the programs each have a unique cost structure. Total start-up costs are US$1050985 or US$0.36 per child reached, and operating costs are US$855 488 or US$0.29 per child reached per year. While costs increase due to 2 fortification programs rather than 1, they are less than strictly adding the 2 together, and the extensive reach reduces costs per child reached to less than for edible oil alone.
Large-Scale Food Fortification conclusions
Large-scale food fortification may be a cost-effective way of delivering VA to the target population in Cameroon. There are, however, important cost issues that need to be taken into consideration as described earlier. There are also cost savings that could occur if food fortification programs are combined at inception or if additional fortification programs are built on top of already existing programs thus utilizing past experience. Table 6 is a summary table of the estimated costs of different scenarios for single and combined VA fortification programs in Cameroon.
Start-up (First 3 years) and Operating Costs (Yearly after Start-up) of Large-Scale Food Fortification of VA.a
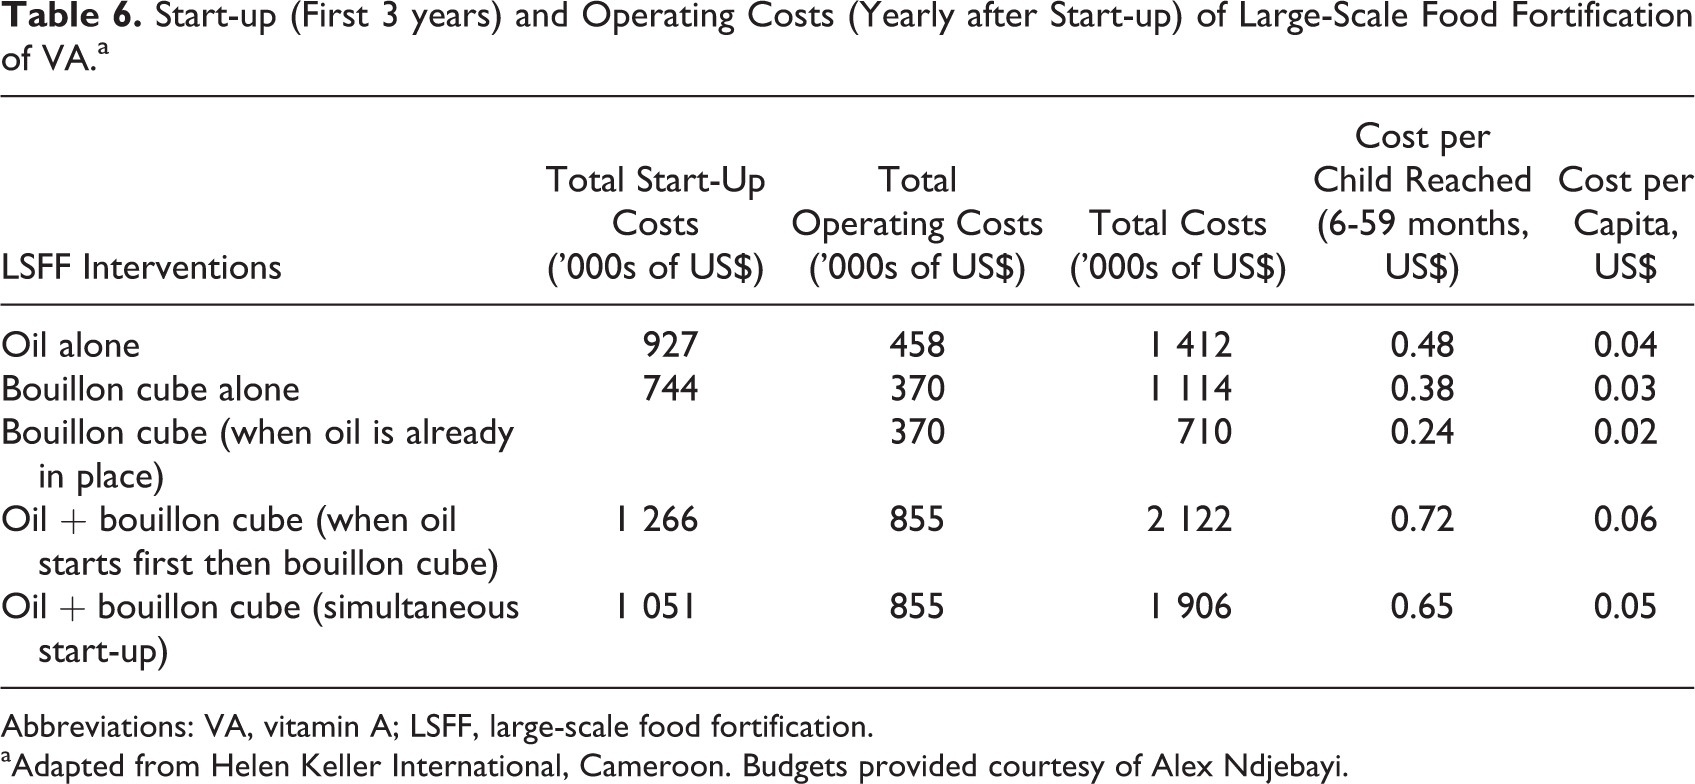
Abbreviations: VA, vitamin A; LSFF, large-scale food fortification.
aAdapted from Helen Keller International, Cameroon. Budgets provided courtesy of Alex Ndjebayi.
Biofortification
Vitamin A maize
Maize biofortification was begun by the Ministry of Agriculture in Cameroon in the 1980s, but due to lack of funding, it did not progress past the initial research and development stages. It was fairly successful in Nigeria and in Zambia, reaching a large percentage of these populations and could potentially be successful in Cameroon as well. 14
For this analysis, we assume that varieties of VA maize have already been developed, which is the case in nearby Nigeria so that the costs associated with original research and development are zero (note 10). However, there is still government approval, adaptive breeding, and seed multiplication that must take place in Cameroon; a biofortification adaptation process lasting up to 3 to 5 years. Table 7 presents a summary of the different cost categories and amounts involved in a maize biofortification program in Cameroon. A description of each of the cost categories is as follows (note 11).
Maize Biofortification Cost Summary (Total over 3-5 years).a
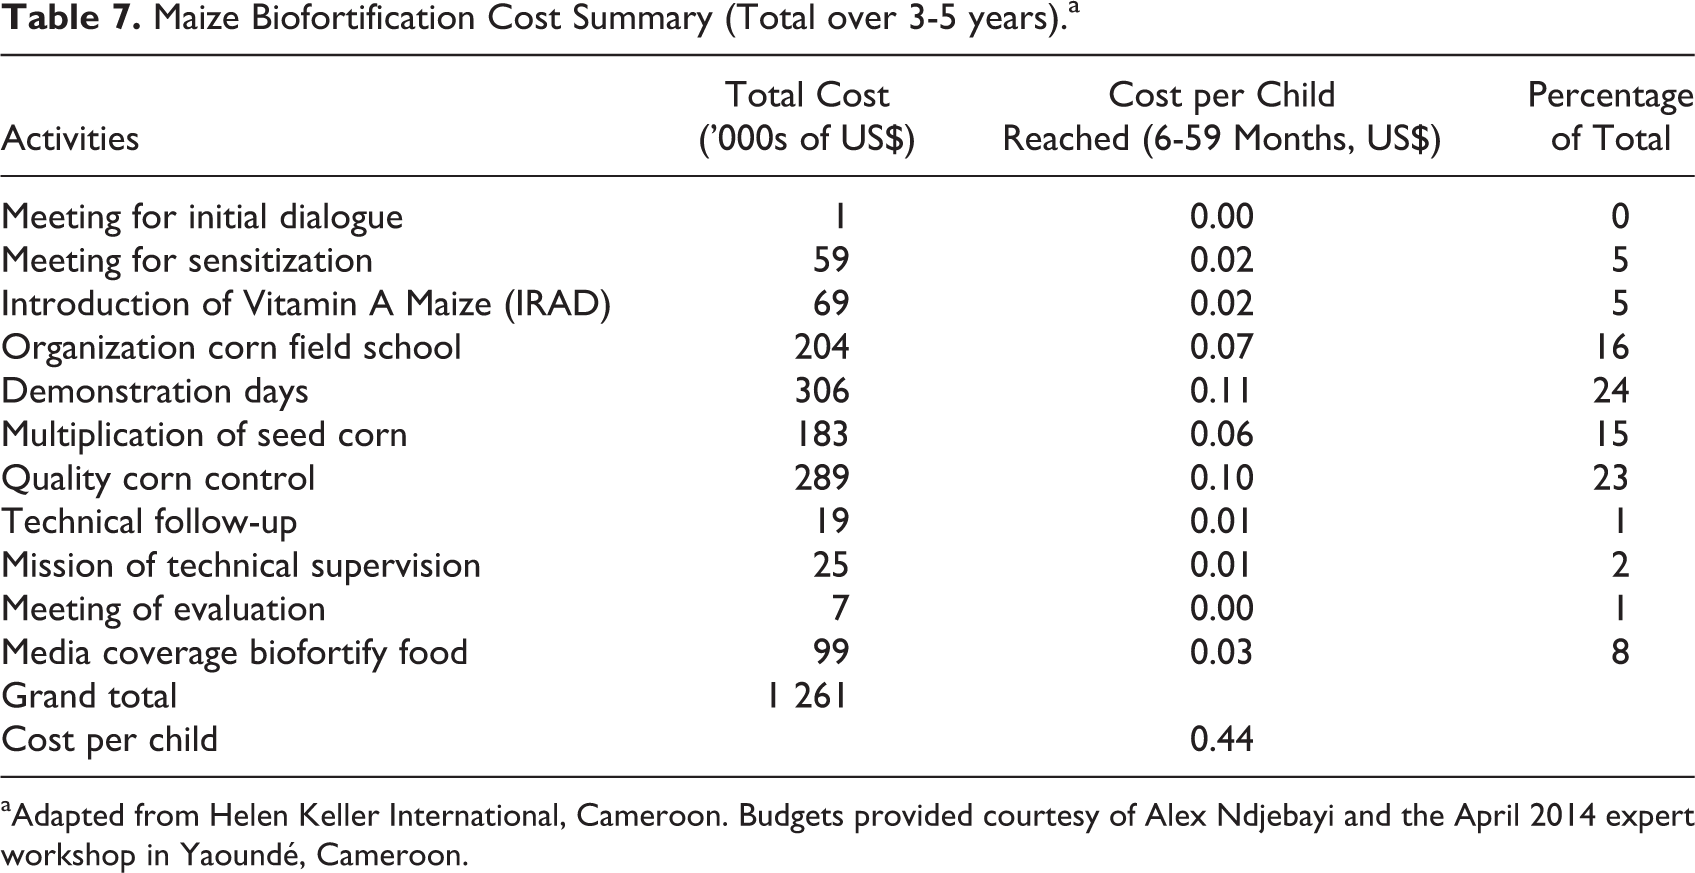
aAdapted from Helen Keller International, Cameroon. Budgets provided courtesy of Alex Ndjebayi and the April 2014 expert workshop in Yaoundé, Cameroon.
Introduction of VA maize
The introduction of VA maize first involves an initial dialogue with key stakeholders (agricultural ministry officials, participants from agricultural universities, nongovernmental organizations [NGOs], and international organizations), followed by several meetings to introduce the different varieties to the regions and brainstorm the best approaches for a given area. These “sensitization” meetings are organized at the regional and departmental level; Cameroon has 10 regions and 58 administrative departments (arrondissements in French).
Vitamin A initial testing
Before the introduction of VA maize to the larger population, it must first be tested by the agricultural research institute of the Ministry of Health in Cameroon, IRAD. They will determine the appropriate varieties that suit the agroclimatic zones and preferences of Cameroon. In the case of VA maize, Nigeria shares many of the same environmental and cultural features and thus varieties used there should be suited for Cameroon.
Vitamin A maize field schools
Maize field schools are then established to make the selected variety available to key farmer operators. The objective of IRAD and others in the government and NGO sector is not just to make the crop available but to develop pilot farms to demonstrate how to cultivate and market the biofortified crop. Each school helps farmers throughout the crop production process, from preparing the soil and planting the crop to managing the crop (fertilizing, using pesticides, and tilling the field) to harvesting and packaging the maize. We envision 3 schools for each of the 58 departments.
Field school demonstration days
During the production of the biofortified maize, the pilot farms will hold demonstration days for the public. This will be done twice, once during the growing season and another during the harvest. Farmer organizations, local leaders, and others will be invited. Also at harvest time, they will be given their own seeds to plant for the next season. There will also be the purchase of local media to promote the events.
Multiplication of the maize seeds
The operators of these pilot farms will also be responsible for multiplying the seed given to them by the Ministry of Agriculture. Some of this seed will then be given out to local farmers and later sold.
Technical supervision and quality control
The process of field testing and multiplication of seeds must be supervised by agricultural extension workers and seed inspectors. This is coordinated at the national level with extension workers and inspectors assigned to each of the pilot farms and seed multipliers.
Communications
Another aspect of biofortification is to inform the public. Besides the field schools and the demonstration days, the biofortification program involves TV/radio and print media purchases to inform the public about malnutrition and the benefits of biofortified crops.
Evaluation
Finally, monitoring and evaluations are performed by the national supervisory team on a quarterly basis throughout the process.
Operating costs of biofortification of maize
One of the benefits of VA-rich maize and other biofortified crops is that once they are accepted by farmers and consumers, the operating costs required to maintain them are smaller than the start-up costs. It would necessitate a yearly laboratory testing of the biofortified crops by IRAD or another part of the agricultural ministry as well as a portion of the quality control costs every year reported above. It also includes maintenance breeding for crops for which seed cannot be saved (orange maize) and to ensure that varieties remain competitive vis-à-vis pest resistance and yield over time. Still, this operating cost would be less than maintaining VA supplementation programs or even industrial fortification, which requires ongoing purchase and incorporation of premix. We assume a temporal pattern of costs for a 10-year biofortified program, where years 5 through 10 include extra costs for quality control of maize and added communication costs about the variety and benefits through TV and radio.
Most costs for maize are paid up-front, initial planning meetings, the introduction of VA maize, the field schools, multiplication of maize seed, and supervision. Other costs, such as media coverage and quality control costs, are spread over time at a decreasing rate.
Biofortification conclusions
The process of biofortification is still evolving. The first real exposure to the public occurred only in 2007 with the introduction of the orange-flesh sweet potatoes in Uganda. 15 We use experts to determine what the costs of a future maize biofortification program in Cameroon. We also assume that the research and development of the biofortified foods have already occurred thus a much shorter time frame is envisioned (3-10 years rather than 15-30).
One cost we do not consider in this analysis is the cost to the consumer. It is assumed that the price of VA maize will not be more than its alternative. This may not be the case; it may be that biofortified foods carry a premium due to the added trait. It remains for future research to determine what the social cost contribution might be for a VA biofortified food.
Spatial Cost Considerations and Combining With Benefits
The costs for the 3 interventions mentioned earlier for Cameroon are divided by region where appropriate. The CHDs and biofortification have some differences in costs by region (note 12). We saw especially that CHDs have differences in costs across most activities according to the specific region. If we begin to combine it with the benefits to children aged 6 to 59 months, we will get a clearer picture of the cost-effectiveness of the interventions and the spatial variation in costs.
Figure 1 shows a regional graph of Cameroon which includes the yearly cost per child 6 to 59 months of age reached (2 doses). This graph is a spatial representation of twice (2 rounds) the cost per child reached as shown in Table 2. Clearly, there is a spatial pattern in the costs, with higher costs per child reached in the southern regions than in the northern regions.
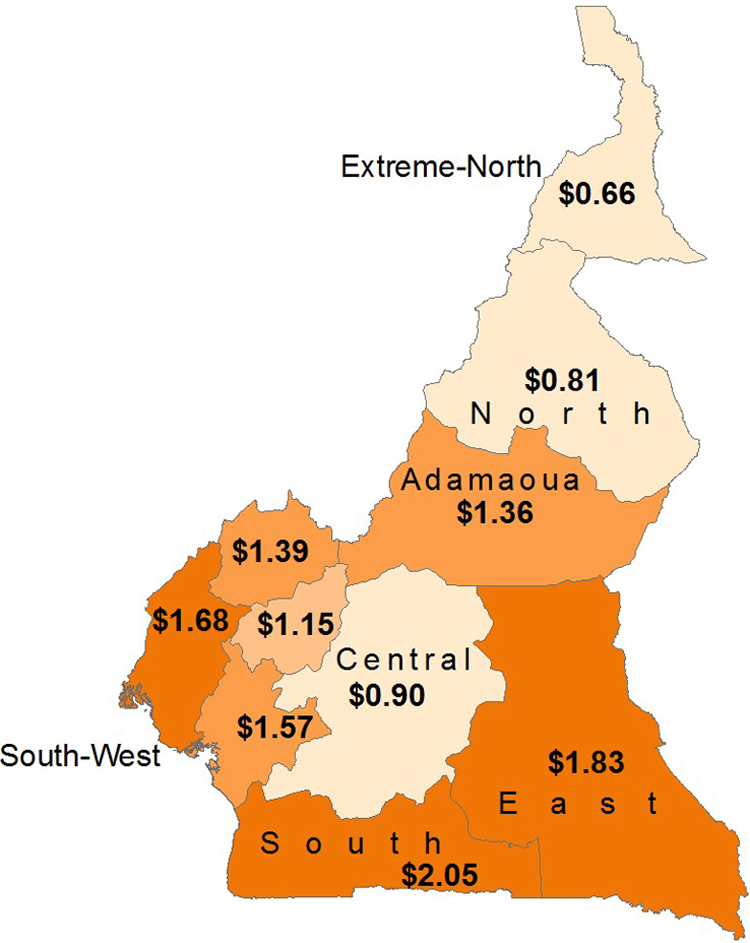
Cameroon 2013 high-dose VA capsule distribution costs, by region. Yearly cost per child 6 to 59 months of age reached (2 doses). Data adapted from 2013 United Nations Children’s Fund (UNICEF) Global budget, courtesy of Dr Jeanne Ejigui. Littoral region data adapted from 2013 HKI SASNIM budget, courtesy of Alex Ndjebayi.
Figure 2 examines this pattern more closely using 2 of the regions—the North (Nord) and South (Sud) region and along the individual activities. Figure 2A denotes the absolute costs of each category, while Figure 2B compares cost per child reached. Looking at the absolute costs (Figure 2A), the largest expenses, regardless of region, are the Per Diems for the personnel and communication to the public about the program (on the regional and national level). Looking at the cost per child reached (Figure 2B), we note that VA capsules have virtually the same cost per targeted child since they are allocated according to the child population (note 13). Most of the categories differ, however, due to 2 main reasons. First, there are centralized costs, such as communication, on a regional level that are distributed fairly equally among the regions regardless of the size or density, resulting in a lower cost per child for the North than the South. The other reason is that the population density of the South is much lower (2.24 children/sq km) than the North (7.29 children/sq km), causing expenses such as fuel and vehicle rental to be higher per child in the South relative to the North. These major differences among the regions appear to account for the differences across other regions as well. The exception might be the South-West, which has a high cost per child but has a similar population density as the low-cost North region (7.38 children/sq km). Transportation costs may not explain the South-West, rather, this is due to the centralized costs distributed to a region with a relatively lower population of children.
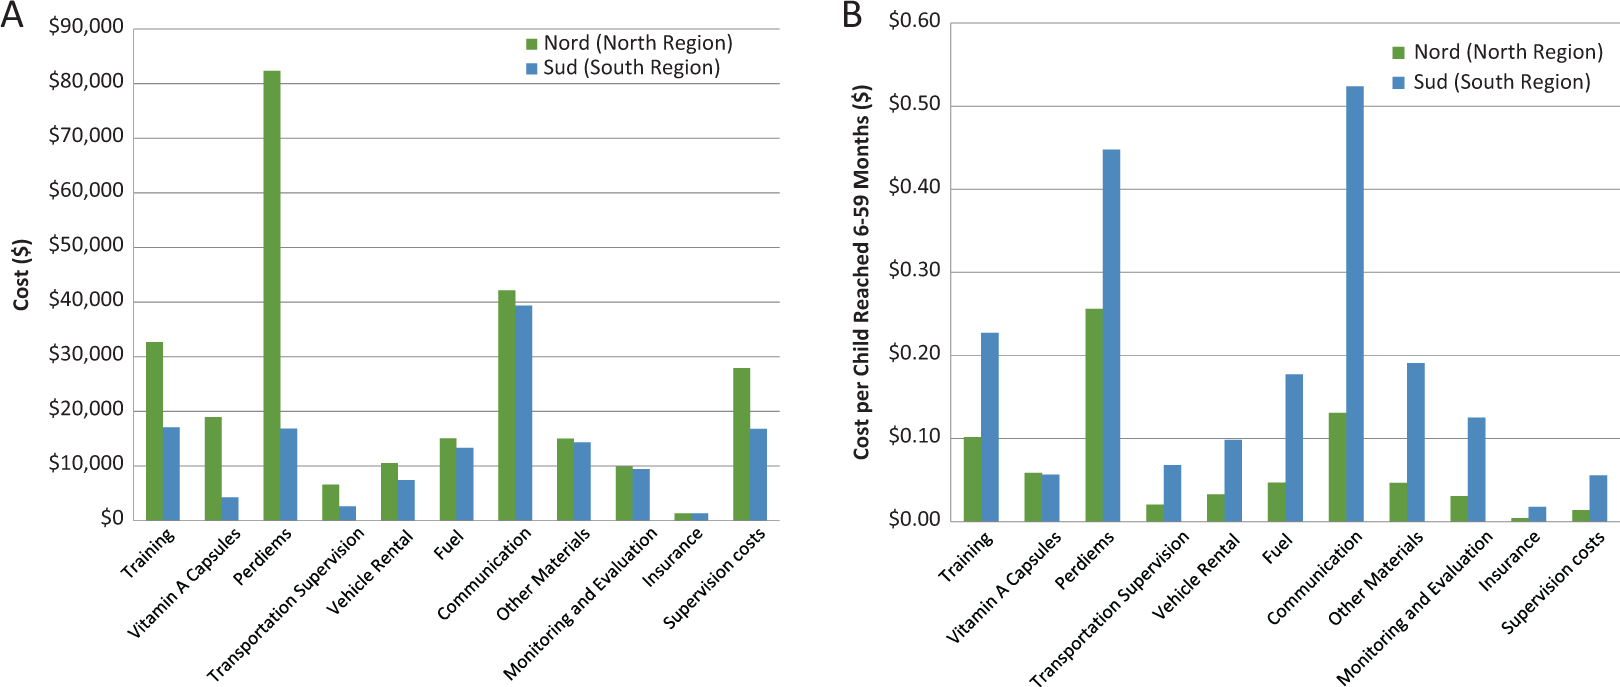
Spatial differences in components of costs of Child Health Days between the North and South regions (2013). A, Total cost by Category. Data adapted from 2013 United Nations Children’s Fund (UNICEF) Global budget, courtesy of Dr Jeanne Ejigui. Littoral Region Data from 2013 HKI SASNIM budget, courtesy of Alex Ndjebayi. B, Cost per child reached. Data adapted from 2013 UNICEF Global budget, courtesy of Dr. Jeanne Ejigui. Littoral Region data from 2013 HKI SASNIM budget, courtesy of Alex Ndjebayi.
Combining costs with benefits
So far we have considered total program costs for 3 types of interventions in Cameroon and introduced the benefits in terms of the cost per child “reached.” Of course, cost per child “reached” is not the only way, and/or necessarily the most desirable way, to express nutritional benefits when hoping to reduce VA deficiency and have an impact on loss of life. The companion benefit paper has alternative measures of benefits to nutrition interventions, 13 which includes not only children reached but also coverage (the number of individuals at risk of deficiency or inadequate dietary intake of VA who are exposed to an intervention or combination of interventions) or effective coverage (the number of individuals at risk of inadequate intake of VA who are exposed to an intervention and who achieve adequate intake because of an intervention or combinations of interventions; note 14).
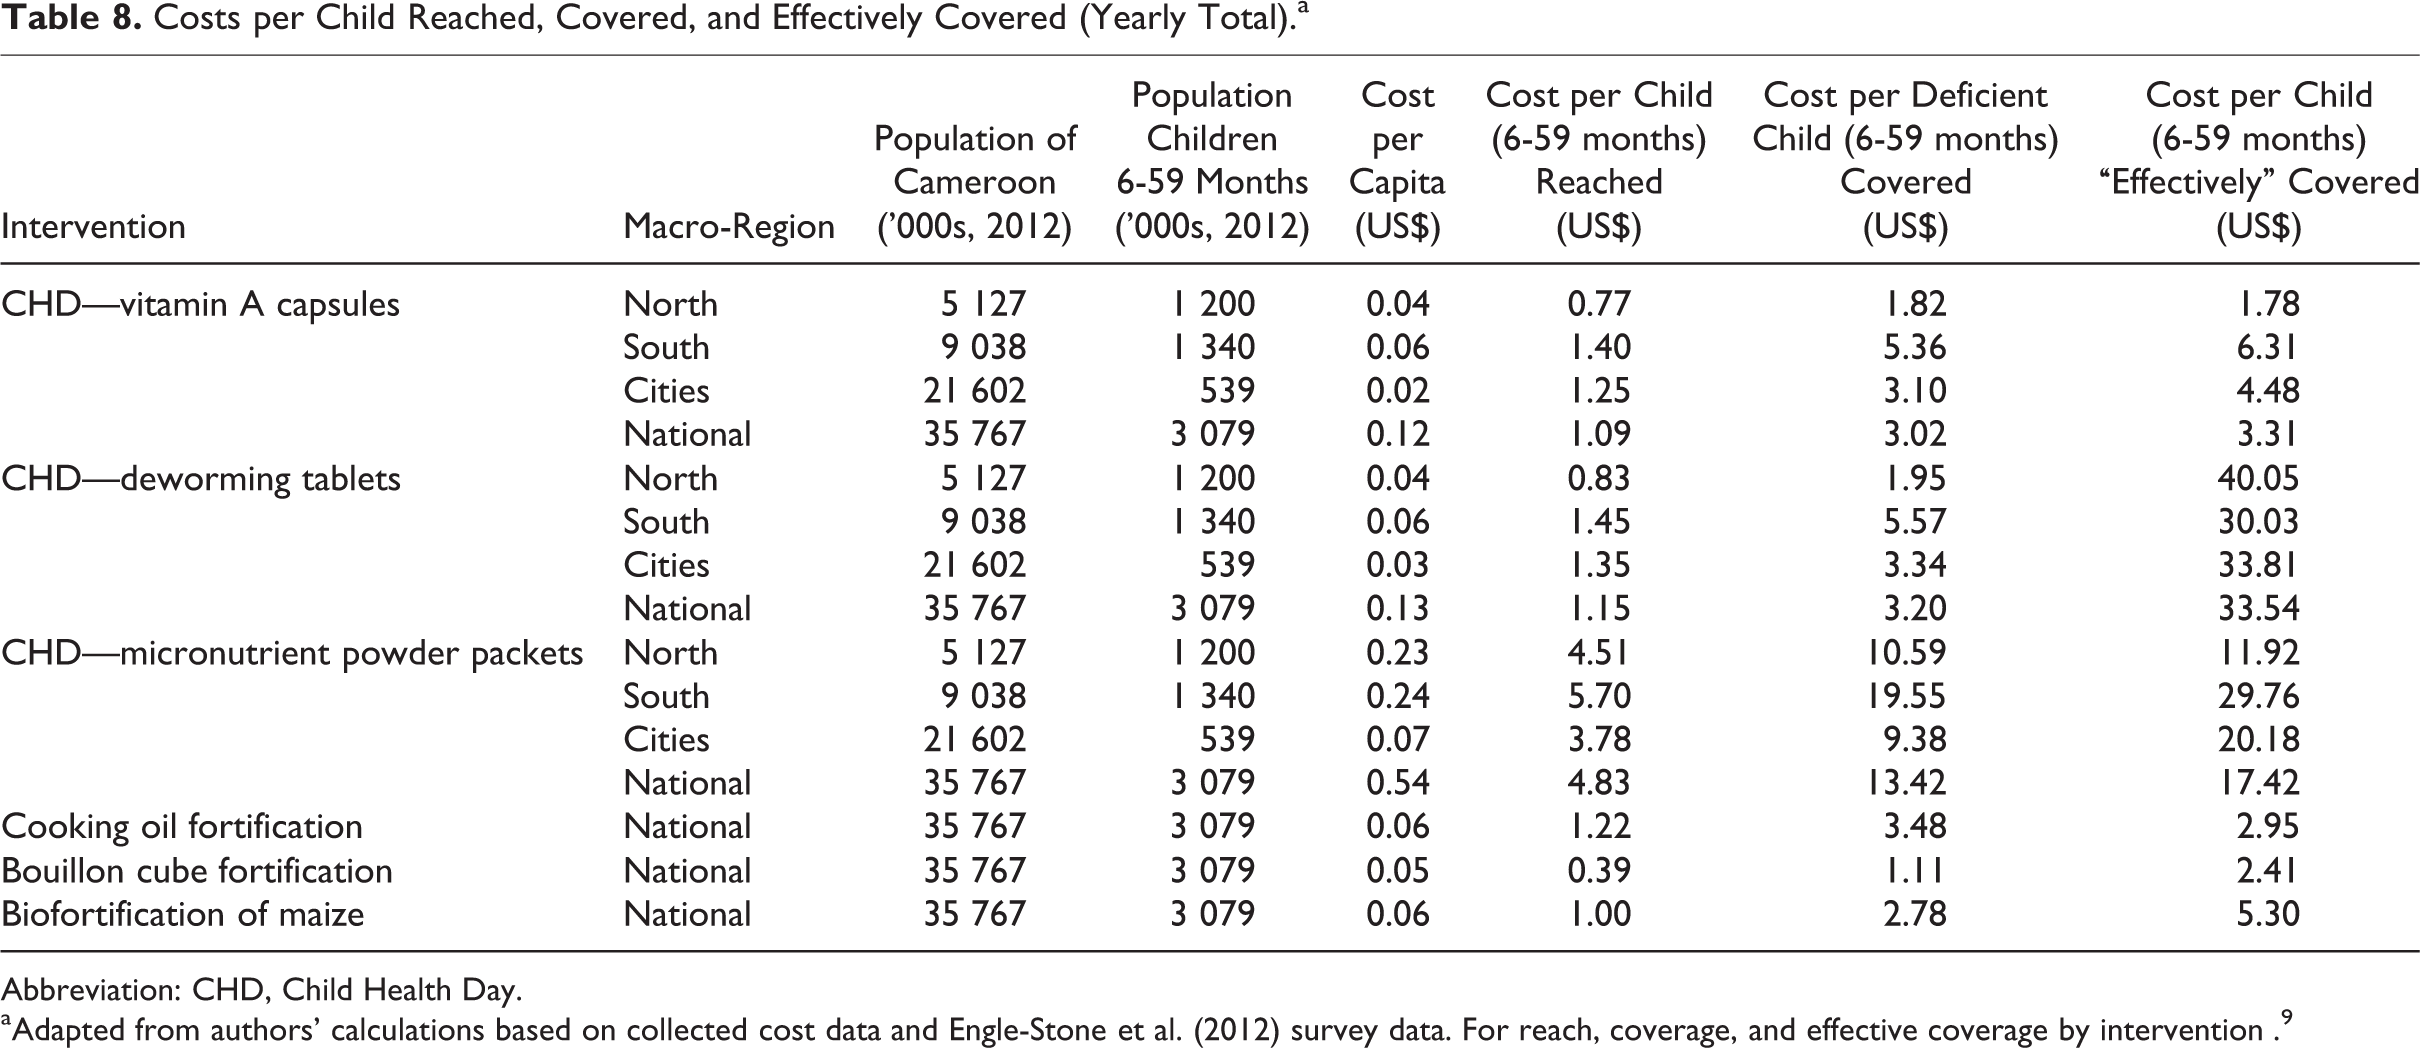
We use the single intervention specific cost tables given earlier combined with the different effectiveness denominator to produce a table of costs per child reached, covered, and effectively covered. Table 8 shows the results by intervention and macro-region.
Costs per Child Reached, Covered, and Effectively Covered (Yearly Total).a
Abbreviation: CHD, Child Health Day.
aAdapted from authors’ calculations based on collected cost data and Engle-Stone et al. (2012) survey data. For reach, coverage, and effective coverage by intervention . 9
Cost per child generally increases as one proceeds from reach to effective coverage, reflecting the narrower size of the relevant population (note 15). One can overestimate the cost-effectiveness of a program by focusing only on reach, especially if one is interested in impacts. Moreover, different benefit levels may produce a different ranking of interventions. For example, biofortified maize is comparable to CHDs on a national level when looking at reach but becomes approximately US$2.00 more expensive per child (6-59 months) when looking at the cost per child effectively covered. This shows essentially that the 2 programs have nearly identical reach but that VA capsules delivered during CHDs are more cost effective at solving the issue of VA inadequacy. The same is true for the DW tablets: since they are distributed along with VA capsules through the CHD, they both have the same reach and cover the same number of deficient children (reach and coverage) so that the only difference in those definitions is the higher cost for DW tablets. However, if one looks at the interventions’ ability to provide effective coverage (moving children with inadequate intake out of VA inadequacy), delivering VA capsules is far more cost effective (US$3.31 per child vs US$33.54 per child).
Equity aspects are addressed in part in the cost per child covered column, essentially the intervention’s reach to deficient children. Often the issue is not necessarily which vehicle is cheaper but which one will reach deficient populations. The relative cost per child covered ranges from a high of US$13.42 for MNP to a low of US$1.11 for VA fortified bouillon cube.
Another conclusion evident from the table is the very cost-effective LSFF programs. The VA fortification of bouillon cubes is over twice as cost-effective nationally as a CHD distributing VA only. Edible oil fortification is comparable with CHDs at the national level; however, if you only look at the operating costs after oil is already in place (as it is currently in Cameroon), it is lower than the CHD program with only VA supplements (US$1.01 vs US$3.31 per child effectively covered). The caveat for these results is that the food fortification costs do not take into account the cost to a household of buying fortified oil or bouillon cube; consumers must purchase edible oil or bouillon cube whereas VA capsules through CHDs are free to the household (except for the time required to receive the capsules). Thus, more for edible oil than bouillon cube, poor households might choose cheaper foods.
Cost-Effectiveness Across Alternative VA Interventions
Having a range of both the costs and the benefits associated with VA interventions gives policy makers a clearer picture of which intervention or set of interventions to choose from. It also allows one to analyze increases in cost-effectiveness within a type of intervention or across interventions. Focusing on only costs per child reached may overestimate the benefits of a given intervention, while having benefits but no cost leaves out the resource constraints associated with VA programs.
Using measures of cost-effectiveness, we saw in the third Section that there were cost savings associated with combining different interventions within an invention type (eg, combining an edible oil and bouillon cube fortification program). A way to achieve greater results per dollar spent may be to combine different interventions not just within a specific type but over several VA interventions. Inevitably, this will increase the total cost, but it will also likely increase the benefits. The degree that benefits increase is dependent on the combination of interventions and the definition of benefits chosen. For example, a CHD that delivers VA capsules and MNPs would have the same reach and coverage but will increase effective coverage. Similarly, 2 interventions may reach more young children but if the second delivers small quantities of VA, it may not increase effective coverage.
Table 9 provides an example in Cameroon by analyzing the costs and benefits (effective coverage) of a VA intervention added to an already existing VA capsule and DW tablet CHD and VA edible oil program, a hypothetical bouillon cube food fortification program and MNP packets delivered through the CHDs. All of the additional interventions have increased effective coverage to 1 416 455 children but cost-effectiveness is much less than the current situation (US$13.95 per child effectively covered instead of US$3.09). It may be that the additional 16 million dollars incurred by including the hypothetical interventions (bouillon cube and MNP packets through the CHD) could be better spent on a more cost-effective combination that would also cover an even greater number of additional children.
Comparing Different Intervention Combinations: An Example (2012).a
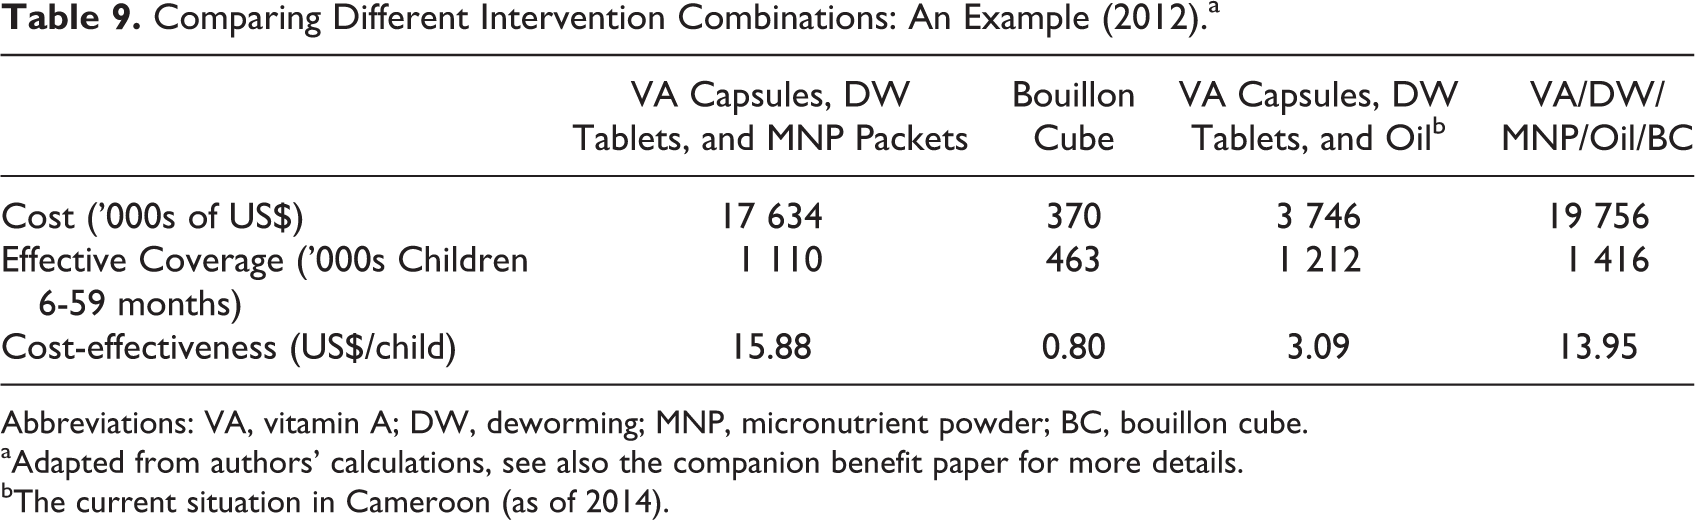
Abbreviations: VA, vitamin A; DW, deworming; MNP, micronutrient powder; BC, bouillon cube.
aAdapted from authors’ calculations, see also the companion benefit paper for more details.
bThe current situation in Cameroon (as of 2014).
Discussion
The costs and benefits of the VA interventions analyzed earlier have been explored in some detail in the literature, with more articles pertaining to the cost of VA interventions delivered through CHDs and LSFF than to biofortification programs. Table 10 summarizes the results of selected studies regarding the costs and benefits associated with 3 types of VA interventions.
Summary of Costs Associated With Selected VA Interventions.
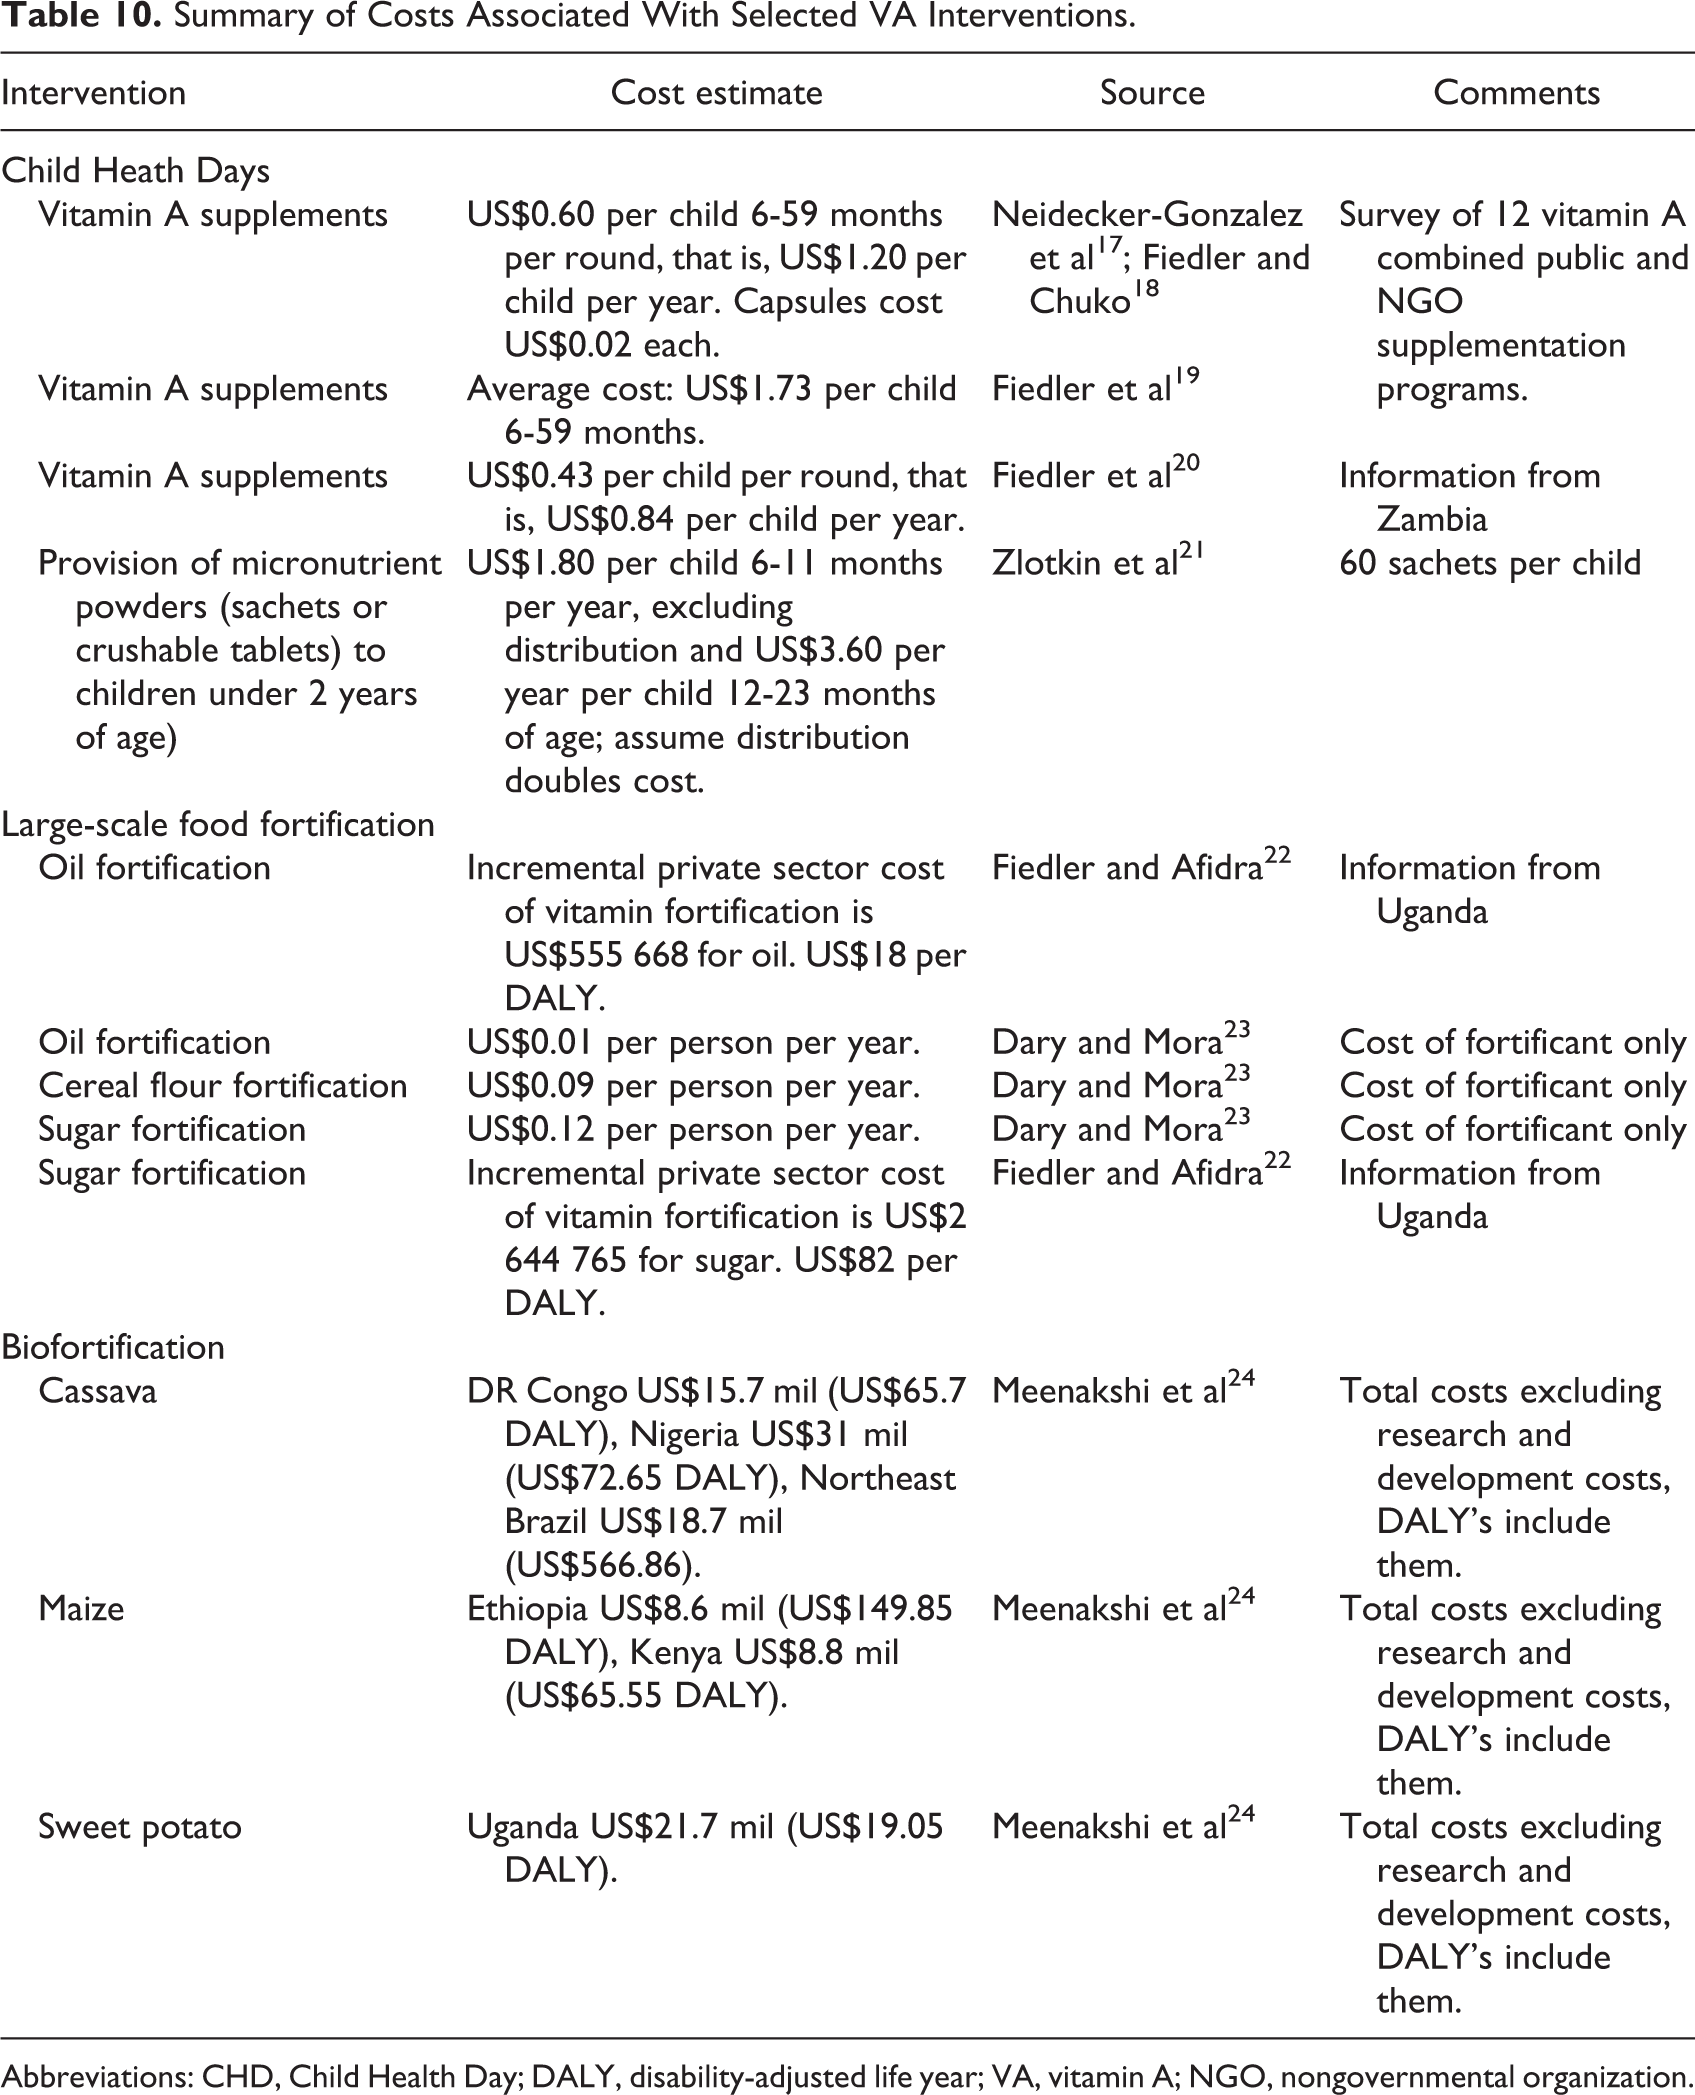
Abbreviations: CHD, Child Health Day; DALY, disability-adjusted life year; VA, vitamin A; NGO, nongovernmental organization.
The literature points to variation in costs associated with VA intervention programs—delivery of twice-yearly, high-dosage VA capsules via CHDs can range from US$3.60 per child, 6 to 59 months of age, per year while the cost of BCC programs can reach US$139 per participant reached. In the case of biofortification, costing literature is scarce, and it is necessary to use some hypothetical costs for the maintenance of high yield varieties at the end of the biofortification process. In each of these articles, the total costs of an intervention are determined and then paired with some measure of benefits such as cost per beneficiary, cost per death averted, or cost per disability-adjusted life year (DALY).
Most studies typically focus on one type of intervention rather than exploring a portfolio of interventions; Fiedler and Lividini 16 provide a welcome exception. Our research is similar to Fielder and Lividini, 16 in that it examines the costs associated with different types of interventions in order to identify an optimal portfolio.
Our estimates of costs per child reached for a VA supplement CHD is largely consistent with the literature. If we compare our cost per child who received VASs, our estimate is only slightly lower than the average, US$0.54 per child reached during a single CHD (US$1.08 for the annual pair of CHDs) as opposed to US$0.60 per child reached in a single CHD (US$1.20 for the annual pair of CHDs). 17,18 Our estimate is also slightly higher than US$0.43 per child reached or US$0.86 per year calculated by Fiedler et al 20 for Zambia.
The literature for LSFF usually looks at costs per capita rather than costs per child reached. Our results are largely consistent (Table 10); our estimates of US$0.06 per capita for edible oil and US$0.05 for per capita for bouillon cube lie between US$0.01 for oil and US$0.09 for cereal flour estimated by Dary and Mora. 23
Finally, our estimates of biofortification costs are considerably less than those of Meenakshi et al 24 (US$1.2 million for maize instead of US$8.8 million in Kenya for maize). This is because our estimates for Cameroon do not include the initial research and development phase of the biofortified crop.
Limitations and Conclusions
The results presented earlier have some limitations. They are constrained by the quality and quantity of data available. In the cases of VA capsules and DW distribution through CHDs and LSFF of edible oil, the costs are known, however, the other VA interventions, not currently operating in Cameroon, rely on our estimates. These estimates have been meticulously constructed by a panel of experts but nevertheless represent less than the ideal. Even when budgets are available, these represent a specific time and context and caution should be taken when using estimates for a different time and/or place. In particular for CHDs, these can vary greatly from year to year depending on a donor’s level of commitment as well as support from multiple donors. Any 1 year might not adequately reflect the true cost of implementing such a program. Programs may also stray from their initial budgets and actual costs may differ from the planned costs we collected. Where possible, such as for some overhead of participating institutions in the CHD, we tried to collect final costs rather than planned costs. Also, marginal cost assumptions are made in order to separate out costs of interventions from a delivery platform (eg, assumptions made to allocate costs of CHDs to delivery of VA capsules, DW tablets, and/or MNPs). These assumptions may not be correct.
We also show that there are spatial and temporal differences in costs across regions for some of the VA interventions. However, the ability of policy makers to exploit these differences to make more cost-effective programs is unknown. Some interventions such as VA fortification of edible oil or bouillon cube may only be able to be implemented on a national basis. And it may be politically infeasible for region-specific strategies involving CHDs.
Finally, we present some alternative portfolios of VA interventions in the previous section. This gives a limited set of the marginal costs and benefits associated with alternative VA intervention programs, but it does not give a full range of possible choices available to policy makers. Our research also does not include the costs of all possible VA interventions or delivery platforms such as behavioral change initiatives or delivery of VA exclusively through health centers.
Despite these limitations, the detailed costs and analysis presented here can aid policymakers and researchers interested in providing VA to children 6 to 59 months in Cameroon and potentially other countries in a more cost-effective way. It does this in several ways.
First, it gives a comprehensive picture of costs of VA interventions in Cameroon. It includes detailed costs of 3 different types of VA delivery platforms currently in use or being explored: CHDs, LSFF, and biofortification as well as costing 6 types of VA interventions: high-dose VA capsules and DW tablets through CHDs, VA fortified edible oil and potentially VA fortified bouillon cubes, and a potential MNP program delivered through CHDs.
Second, the article analyzes the differences among VA interventions spatially, temporally, and/or in terms of cost per child reached, cost per deficient child covered, and cost per child effectively covered. This allows for policy makers in Cameroon to make more informed choices about which VA interventions are most cost-effective and what to expect should they choose to vary their set of current VA interventions or include additional VA interventions in their national portfolio. Comparing costs per child effectively covered are especially informative because they combine costs with data on benefits (Engle-Stone et al 9 ) to measure the impact and not just the reach of a VA intervention or set of VA interventions.
Third, these methods and results can, with some additional research, be used to cost and compare other potential VA interventions for Cameroon (eg, BCC initiatives, other food fortification vehicles, biofortification of additional staple crops and delivery of other VA interventions through the CHD). They can also be complemented by including additional at-risk groups (eg, WRA) or additional micronutrients that address other nutritional deficiencies (eg, zinc or iron).
Fourth, this article contributes to the overall costing methodology of VA interventions. Specific issues addressed include: what marginal cost allocation might be appropriate for interventions added to an existing CHD or LSFF program, how subnational costs could inform more cost-effective changes to existing CHDs, and how different measures of cost-effectiveness can change the relative ranking of VA interventions and combinations of interventions; e.g. comparing children reached to children effectively covered across interventions.
Finally, while the section in this article on cost-effectiveness compares a few different possible VA combinations, the costs also provide part of the inputs into an optimization model that can compare a comprehensive set of possible combinations (Vosti et al 25 ). This model is developed to exploit the differences in cost-effectiveness of different interventions and combinations of interventions in order to find the set of interventions that would maximize benefits of VA interventions for the lowest cost. As seen in Table 9, interventions can always be added to increase benefits, but that the additions can come at great cost. Understanding how these mix and match to maximize benefits in ways that are both affordable and cost-effective can help inform the choices made by policymakers in Cameroon.
Footnotes
Authors’ Note
The findings and conclusions contained within are those of the authors and do not necessarily reflect positions or policies of the supporting organizations.
Acknowledgment
This manuscript is based on research funded in part by a grant to the University of California, Davis by the Bill & Melinda Gates Foundation, and incorporates data from previous work supported by the Michael and Susan Dell Foundation, UNICEF, and Sight and Life. We also thank Dr Jeanne Ejigui, Nutrition Officer for UNICEF in Cameroon, for her help with providing data and expert guidance in its use and interpretation, and Christian Zoa for the additional costing information and budgets. Guy Alexander Mballa provided timely and expert research assistance. We thank the HKI-Cameroon team and the participants of 2 workshops convened by HKI-Cameroon in Yaoundé. Errors are those of the authors alone.
Declaration of Conflicting Interests
The authors declared no potential conflicts of interest with respect to the research, authorship, and/or publication of this article.
Funding
The authors disclosed receipt of the following financial support for the research, authorship, and/or publication of this article: Grant #OPP1122856 to the University of California, Davis by the Bill & Melinda Gates Foundation.