
Abstract
Background:
Vitamin A (VA) intervention programs in developing countries do not generally consider spatial differences in needs or in intervention costs. New data from Cameroon reveal nonuniform spatial distributions of VA deficiency among young children and of costs of some of the programs designed to address them.
Methods:
We develop a spatially explicit, intertemporal economic optimization tool that makes use of subnational dietary intake data and VA intervention program costs to identify more efficient sets of interventions to improve VA nutrition among young children aged 6 to 59 months in Cameroon.
Results:
The model suggests substantial changes in the composition and geographic foci of VA intervention programs vis-à-vis a business-as-usual scenario. National VA-fortified edible oil and bouillon cube programs are cost-effective, even when start-up costs are considered. High-dosage VA supplementation delivered via Child Health Days is most cost-effective in the North macro-region, where needs are greatest and the cost per child effectively covered is lowest. Overall, the VA intervention programs suggested by the optimization model are approximately 44% less expensive, with no change in the total number of children effectively covered nationwide.
Conclusions:
The VA intervention programs should consider spatial and temporal differences in needs and in the expected benefits and costs of alternative VA interventions. Doing so will require spatially disaggregated strategies and the data and political will to support them, longer planning time horizons than are currently used in most developing countries, and long-term funding commitments.
Introduction
The search for new and more effective entry points for addressing poverty concerns, especially intergenerational poverty concerns, in developing countries has begun to focus more attention on problems of maternal and early childhood health and nutrition, 1,2 on the investments needed to address them, 3 –5 and on the expected biophysical and economic benefits of these investments. 6,7 Indeed, policy makers and donors are increasingly committed to making the needed policy changes and to making the needed funds available to achieve the overall objectives of reducing the prevalence of nutrition problems, such as micronutrient (MN) deficiencies, and their associated health consequences.
However, even in an unconstrained funding environment (which we will not likely ever encounter), decision makers should not aim to engage in all nutrition intervention programs everywhere and forever. Priorities need to be established regarding which nutrition-related problems to focus on, which target populations deserve more/less attention, and on the urgency with which to achieve agreed-upon objectives. Multiple intervention delivery platforms for addressing a given nutrition problem (eg, vitamin A [VA] deficiencies) often exist, or can be developed, and can have different costs 8,9 ; these costs should influence programmatic choices.
Although there is general agreement on the need to prioritize the nutrition problems to be solved and to target interventions toward those in need, data constraints, lack of clarity and consistency in defining populations “in need,” and the lack of a framework for helping to inform policy discussions focused on challenging trade-offs have led to somewhat rudderless discussions at national and international levels. Researchers have, for some time now, called for a more comprehensive, interdisciplinary approach, 3 and some have begun to address this issue, 10 but current approaches fail to completely address the challenges associated with estimating the nutritional benefits associated with combinations of nutrition intervention programs (especially of multiple interventions undertaken simultaneously, the results of which cannot be simply “summed up” to calculate effective coverage or total costs) or to develop and implement optimization modeling frameworks that choose from all possible combinations of interventions over time and space, allowing for beginning and curtailing site-specific interventions in the search for efficient intervention packages.
This article is part of a series of articles that describe a new approach/tool for selecting MN interventions, using the example of VA programs for young children in Cameroon. The rationales for the modeling approach and for selection of this example are described by Brown et al 11 . The preceding articles in this volume have provided definitional clarity and helped fill very important information gaps in the case of selected at-risk populations for VA in Cameroon. Engle-Stone et al 12 provides subnational estimates of VA dietary inadequacy and of the expected benefits in terms of effective coverage of specific national and subnational intervention programs and combinations of them, for young children and for women of reproductive age (WRA). Kagin et al 9 provide estimates of the costs of designing and managing alternative VA intervention programs, at the subnational and national levels, where appropriate.
This article takes these important contributions and places them in a spatially explicit, intertemporal economic optimization framework that is designed to help target VA intervention programs across macro-regions over a 10-year planning time horizon in the context of Cameroon, so as to meet agreed-upon effective coverage objectives at lowest cost. The model results are compared with those of programs pursued under a constructed business-as-usual (BAU) scenario. This comparison provides a measure of the efficiency gains of making the set of programmatic changes suggested by the model (note 1).
Linear programming techniques have long been used in economics to solve resource allocation problems of this nature. 13 The approach has been applied to addressing an array of issues in energy, 14 agriculture, 15 the environment, 16 and in nutrition 17,18 (note 2).
The next section introduces an economic optimization model tailored to address VA intervention programs and briefly discusses how the model works. The third section discusses data used by the model. The fourth section presents the results of the BAU VA intervention scenario for young children in the context of Cameroon. Fifth section presents the effective coverage and cost results of the economic optimization model and compares these results to those of the BAU scenario. Sixth section summarizes the results and discusses their implications for policy.
Methods
The Optimization Model
The economic optimization model described below establishes a spatially explicit, intertemporal framework that takes as inputs the nutritional benefits of alternative VA interventions (as generated by the nutrition model set out and described in Engle-Stone et al, 12 ) and the costs associated with planning and undertaking alternative VA interventions (generated by the cost model set out and described in Kagin et al, 9 ; note 3). The model then combines the information on benefits and costs to find efficient solutions.
More specifically, the economic optimization model is linear and maximizes discounted effective coverage (EfCvg; note 4), that is, the number of young children aged 6 to 59 months (note 5) with inadequate dietary intake of VA, who are exposed to an intervention and who achieve an adequate dietary intake of VA because of an intervention or combinations of interventions, in different geographic areas (j) and in different time periods (t). See equation 1.
The index t represents time, which is measured in annual increments and T identifies the final year of the decision-making time frame. For this analysis, the decision-making time frame covers a period of 10 years, that is, T = 10.
The index j represents geographic units, which can represent states, regions, macro-regions, and so forth; in this analysis, the following macro-regions were constructed for Cameroon—the northern 3 regions (North [N]), the southern 7 regions (South [S]), and the 2 major metropolitan areas of Yaoundé and Douala (Cities [C]). The variable r is the discount rate applied to future benefits. 19
Practically, decision makers do not choose levels of VA effective coverage per se, rather they choose 1 or more VA interventions that achieve different levels of effective coverage (EfCvg; note 6). So, technically (equation 2), the model captures this practical decision-making process by selecting combinations of VA interventions from 2 sets of candidate interventions; one set contains VA interventions that can only be deployed at the national level (Yk ,t ), for example, an edible oil fortification program, and another set that contains VA interventions that can be deployed at the subnational level (Xk ,j,t ), for example, high-dose VA supplementation (VAS) delivered during Child Health Days (CHDs), but which can be implemented nationwide if the model determines that this is an element of the most cost-effective strategy for a given year. For any combination of interventions selected (k), total effective coverage (EfCvg) will be the sum of VA interventions’ collective effects on young children over all macro-regions (j), over all periods of time (t).
The choice vector Yk ,t represents the set of candidate interventions included in the model that can only be deployed at national level in any given time period (t). In this analysis, those are fortified cooking oil, fortified bouillon cubes, and biofortified maize. Moreover, and very importantly, these national VA programs generally take several years to plan and to launch, during which (by assumption) no nutritional benefits are generated, but costs are faced; one of the key features of this intertemporal optimization model is that it can allow sufficient time for costs and benefits of these long-term projects to play out.
The choice vector Xk ,j,t represents the set of candidate interventions included in the model that can be deployed at the subnational level (hence the inclusion of subscript j). In this analysis, subnational geographic units are the 3 macro-regions identified above and the candidate interventions in each macro-region are high-dose VAS, micronutrient powders (MNPs), and deworming (DW) tablets, all of which are distributed semiannually to children via the CHD distribution platform.
Funding limitations tend to be the most important constraints faced by policy makers and those designing and managing VA intervention programs (note 7). Equation 3 captures this constraint.
The variable TC is the cost of planning and implementing each candidate intervention (k), in each time period (t), in each macro-region (j). Note that some candidate interventions must be deployed nationally (Yk ,t ) while others can be deployed subnationally (Xk ,j,t ). The sum of the costs associated with all of the chosen interventions must be less than or equal to the total amount of funds available (TF) over the entire decision time horizon (note 8). The variable i is the discount rate applied to program costs (note 9).
The Optimization Process
Conceptually, the model searches over all candidate VA interventions programs over time and space, to find the combination of VA interventions that is the most efficient. The model’s search for efficient solutions can be managed in the following 2 ways: the model can find the least-cost combination of VA interventions that achieves a given policy objective (eg, effectively covering a given number of children), or, the model can find the combination of VA interventions that effectively covers the largest number of children, given a prespecified budget constraint.
In the context of VA interventions, it is important to note that the benefit and cost “steps” that the model must address in searching for an economically optimal solution are generally large, that is, decision makers must take each candidate intervention as a “package” that cannot be divided into smaller geographic or temporal segments or deployed with significantly more or less intensity without expending considerably more time or financial resources. For example, for this analysis, every subnational VA intervention that is chosen must be undertaken in at least 1 entire macro-region, for at least 1 year, and undertaken at the intensity specified by the program as captured in the cost model. 9 Doing so will generate the annual benefits for that macro-region as provided by the nutrition model. 12 Choosing any given candidate intervention therefore will imply large resource obligations and may generate large numbers of effectively covered children, but these are “all or nothing” choices for decision makers. Such a “lumpy” decision-making process requires a special linear programming approach, one that allows for large steps in the solving algorithm. A mixed-integer linear optimization program is used to solve the model and to determine the maximum coverage achieved, given funding constraints. 20
Finally, it is important to note at this juncture that the economic optimization model outlined above and used to generate the policy simulation results presented below includes a broad array of policy options. Indeed, the model was designed to identify and measure the efficiency gains associated with the most flexible policy-making setting possible (note 10). In reality, not all of the candidate alternatives may be available to decision makers at a given point in time in a given policy-making setting. The model can be adapted to address this issue. We will come back to this issue in the Discussion section.
Data
In what follows, we focus on VA deficiencies and on one key target population—children 6 to 59 months of age. Data for the economic optimization model are provided by the nutrition model 12 (which uses detailed, nationally representative dietary intake data to estimate the effects of alternative VA interventions on effective coverage) and the VA intervention cost model 9 (which uses detailed program planning and implementation cost data to generate estimates of costs of alternative combinations of VA interventions). Nutrition benefit and cost estimates are macro-region and year-specific, and are generated for all possible combinations of candidate interventions. Figures 1 and 2, respectively, provide examples of effective coverage estimates and implementation costs associated with selected VA interventions. More specifically, Figure 1 depicts effective coverage estimates for a subset of alternative intervention strategies, for each macro-region, for 2011 (note 11; 1 of the 10 years included in the optimization models decision time horizon). Note that some programs contribute substantially more to increasing effective coverage than do others, for example, VAS compared with VAS+DW provides an estimate of the marginal contribution of the DW intervention to achieving adequate VA dietary intake.
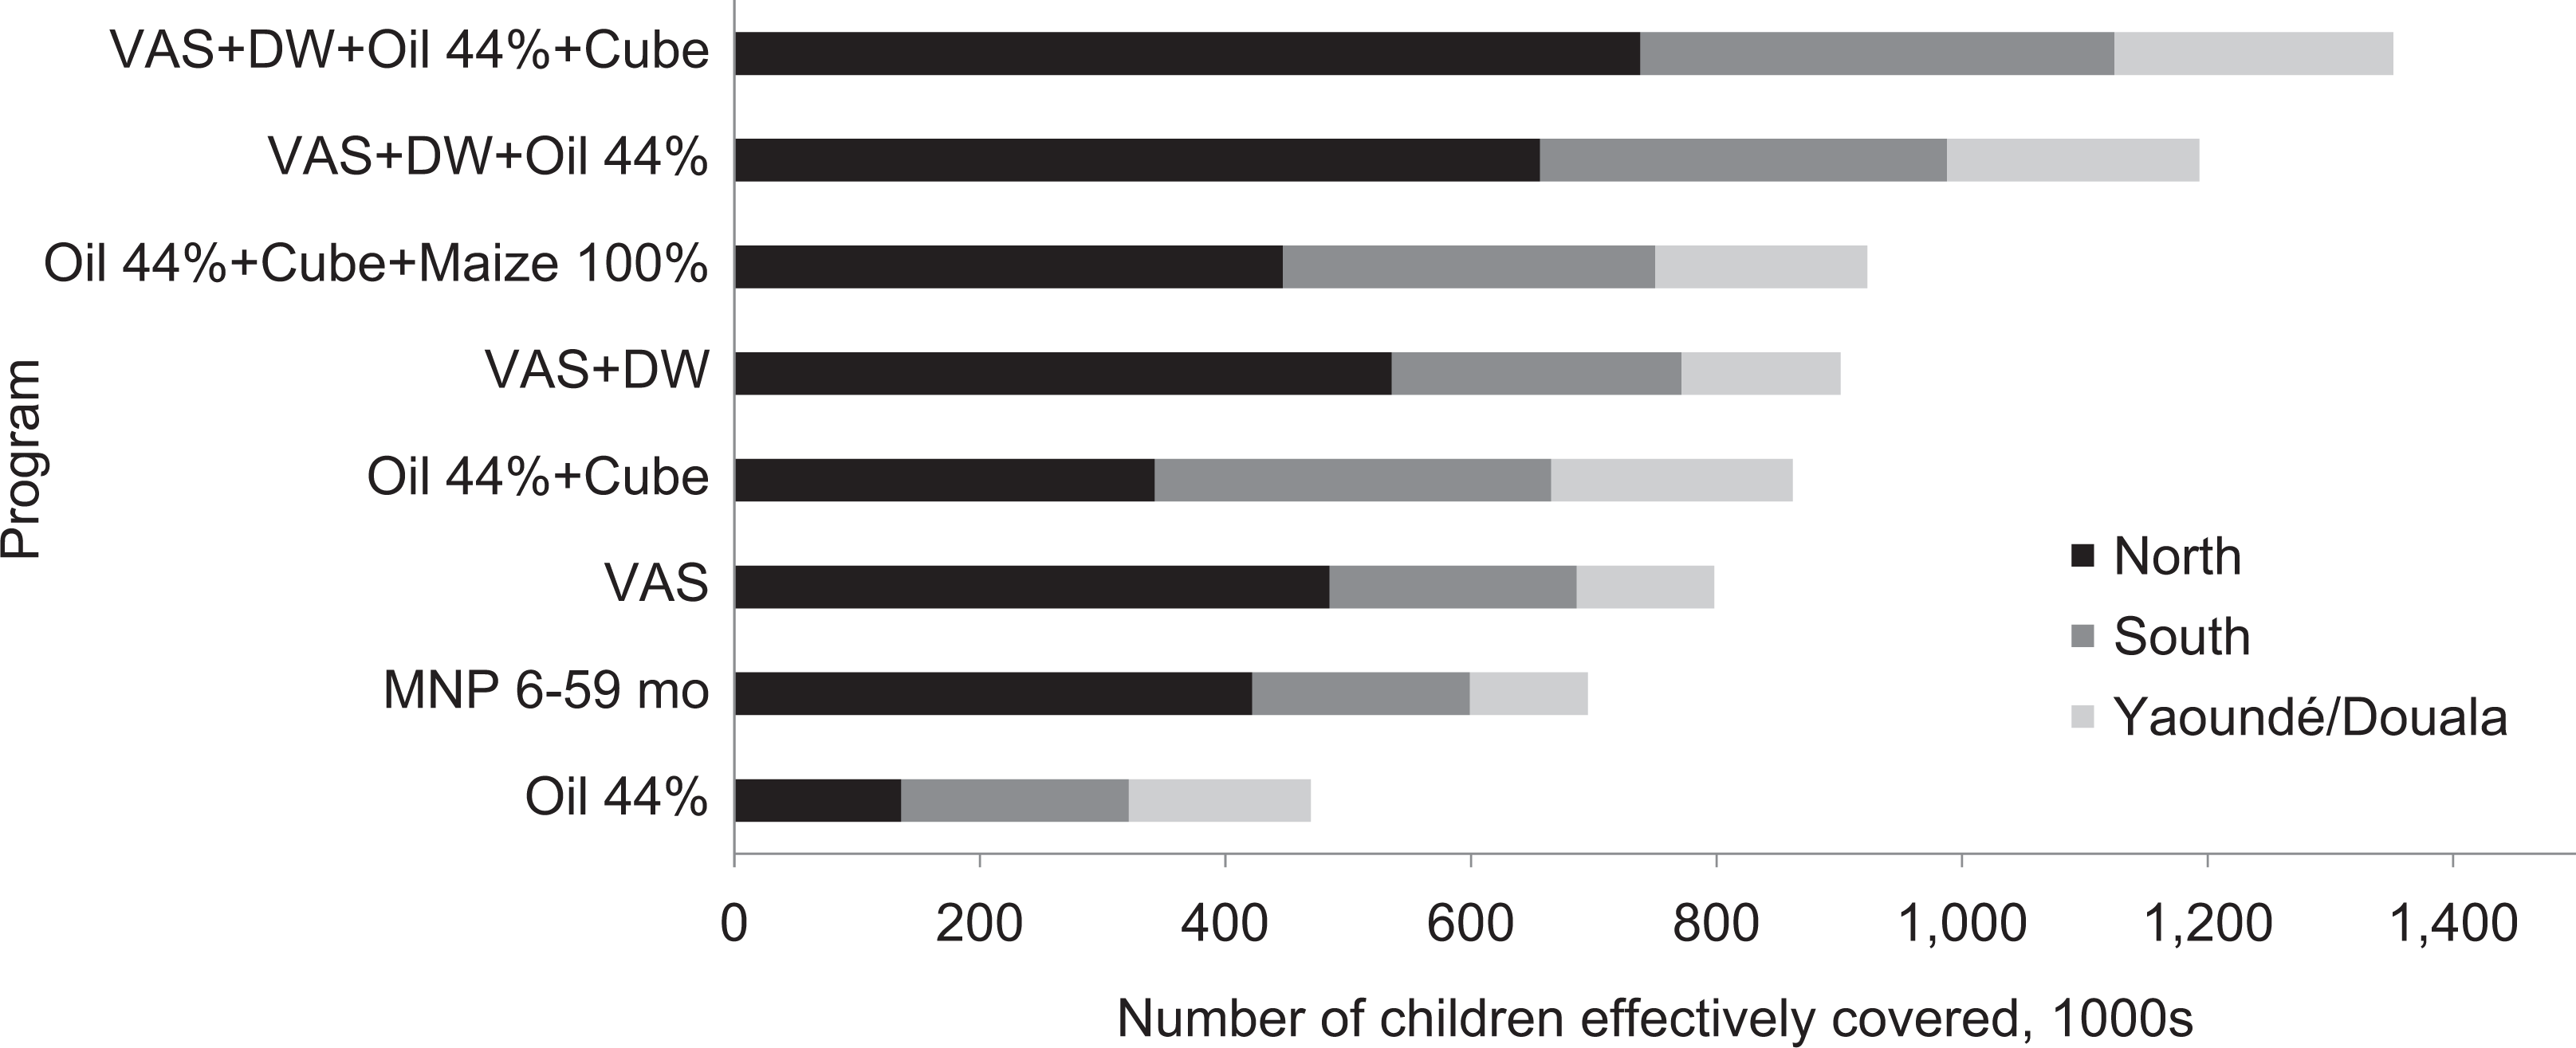
Number of children effectively covered by selected combinations of vitamin A intervention programs, by macro-region, 2011. Adapted from Engle-Stone et al 12 . Row labels containing multiple entries represent combinations of interventions. Business as usual (BAU) is represented by the VAS + DW + oil 44% row. VAS indicates high-dose vitamin A supplementation undertaken during CHDs; Oil and Cube, national programs to fortify edible oils and bouillon cubes; DW, deworming tablets distributed to young children during CHDs; MNP, micronutrient powder packets distributed to young children during CHDs. Oil 44% refers to fortification with vitamin A at measured concentrations, which were 44% of the target concentration.
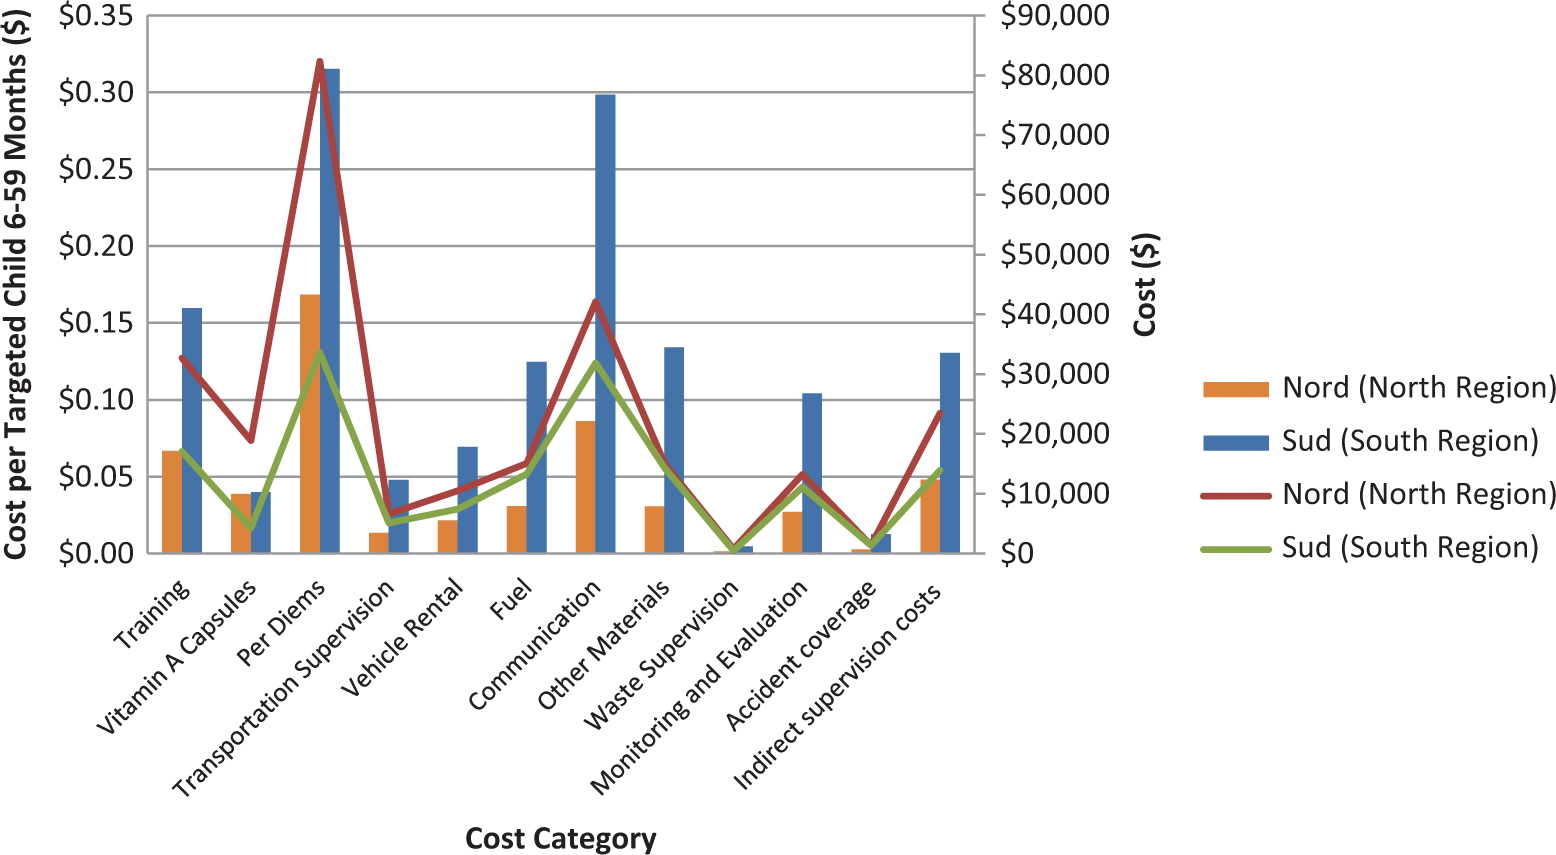
Cost (US$) of distributing vitamin A supplementation (VAS) during CHDs in the North and South regions, by cost category. Adapted from Kagin et al. 9 Total outlays are reported on the right-hand vertical axis using “thin” lines; cost per targeted child are reported on the left-hand side axis using “thick” vertical bars.
Figure 2 reports the costs of CHDs for the North and South regions, in terms of total outlays (right-hand vertical axis and “thin” lines) and in terms of cost per targeted child (note 12; left-hand side axis and “thick” vertical bars). Visually (by summing up the vertical distance between the blue and orange thin lines) one can see that the total cost of CHDs in the South region is larger overall than a similar program in the North region. Examining the differences across regions in the vertical cost category bars indicates that differences are attributable to operational costs (eg, training, per diems, fuel, communication, monitoring and evaluation, etc) that are associated with cross-region differences in the extent and quality of transportation infrastructure and in the effectiveness of CHD communication activities—per unit costs of VA capsules are identical, nationwide.
Two additional comments related to the data used by the economic optimization model merit mention. First, estimated changes in population size over the 10-year model simulation period have been incorporated into the model (note 13). Second, changes in dietary habits that may accompany migration patterns were not included in the current analysis, but theoretically could be.
For the 10-year simulations that follow, the economic optimization model takes as inputs at the macro-regional level and at an annual time step: (1) the effective coverage estimates associated with all possible combinations of VA interventions and (2) the costs associated with all possible combinations of VA interventions. The model finds the optimal combination of VA interventions, that is, the combination that most cost-effectively achieves a preset effective coverage objective, or, the combination that achieves the greatest effective coverage, given funding constraints.
Results
Business as Usual in Cameroon—Costs, Benefits, and Spatial Patterns in Cost-Effectiveness
For the past several years, Cameroon has maintained a nationwide set of VA interventions designed to reduce VA deficiencies among young children. These have included VAS and DW tablets distributed twice annually via the CHD platform and an edible oil fortification program. We construct a BAU scenario based on these interventions, assuming they are continued for a decade (note 14). Table 1 presents a consistent and nationally uniform pattern of these VA interventions over a 10-year simulation time horizon, the annual flow of estimated benefits (again, in terms of effective coverage for children 6-59 years of age), and the annual costs of these programs. Changes in the number of beneficiaries are related to changes in the size of the target population. On average, the BAU set of national VA programs effectively covers approximately 1.3 million children per year at an annual cost of approximately US$3.7 million.
BAU in Cameroon—Interventions, Effective Coverage, and Program Costs, by Year, at National Level.a
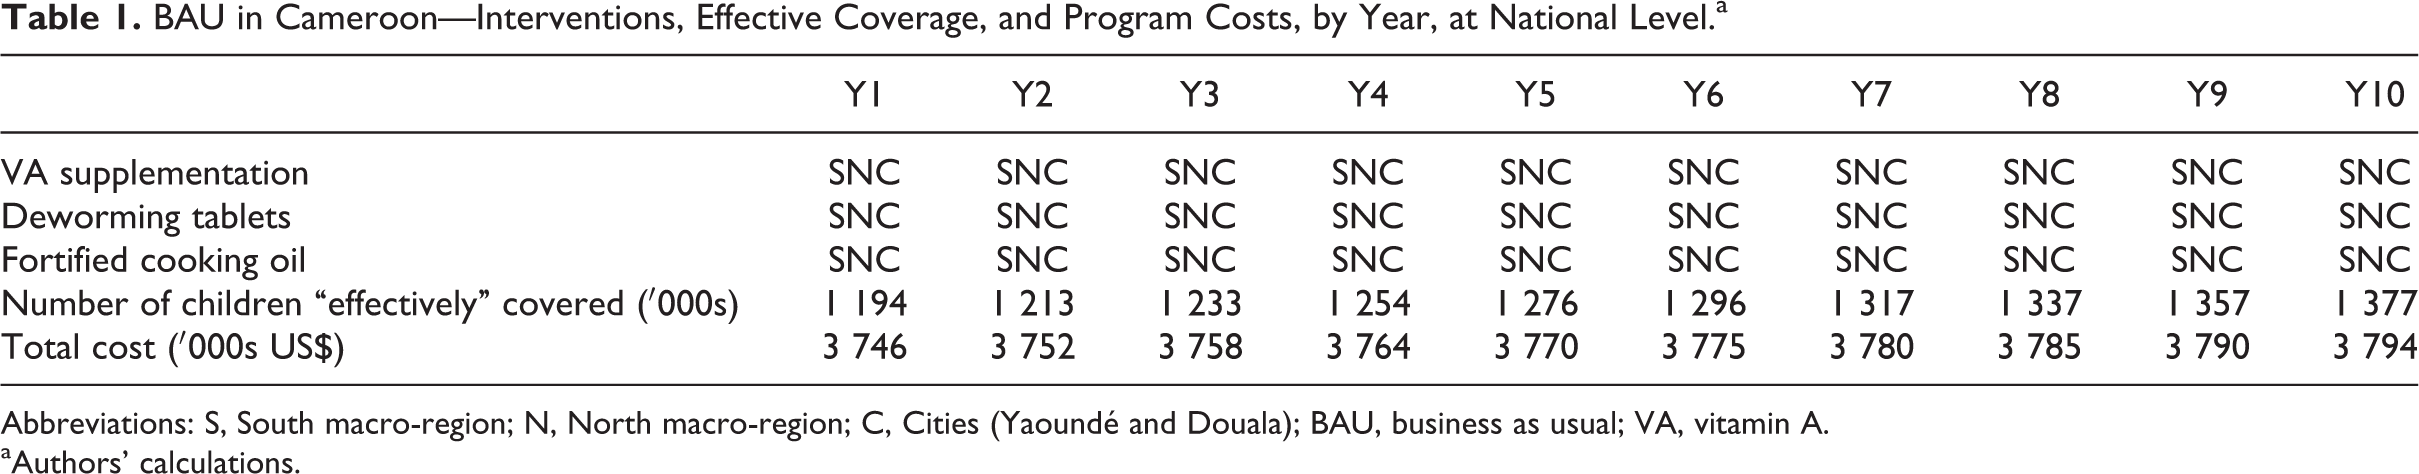
Abbreviations: S, South macro-region; N, North macro-region; C, Cities (Yaoundé and Douala); BAU, business as usual; VA, vitamin A.
aAuthors’ calculations.
Table 2 provides a 10-year summary of the benefits and the costs of this temporally and spatially uniform collection of VA interventions and its cost-effectiveness—over 12.9 million children are moved from inadequate to adequate VA intake, at an average cost of US$2.93 per child effectively covered. Note that the majority of effectively covered children reside in the North macro-region and that their effective treatment is much more cost-effective than that of their counterparts in the South macro-region, and somewhat more cost-effective than identical interventions in the Cities macro-region (note 15).
BAU in Cameroon—10-Year Summary of Effective Coverage, Cost, and Cost-Effectiveness, Nationally and by Macro-Region.a
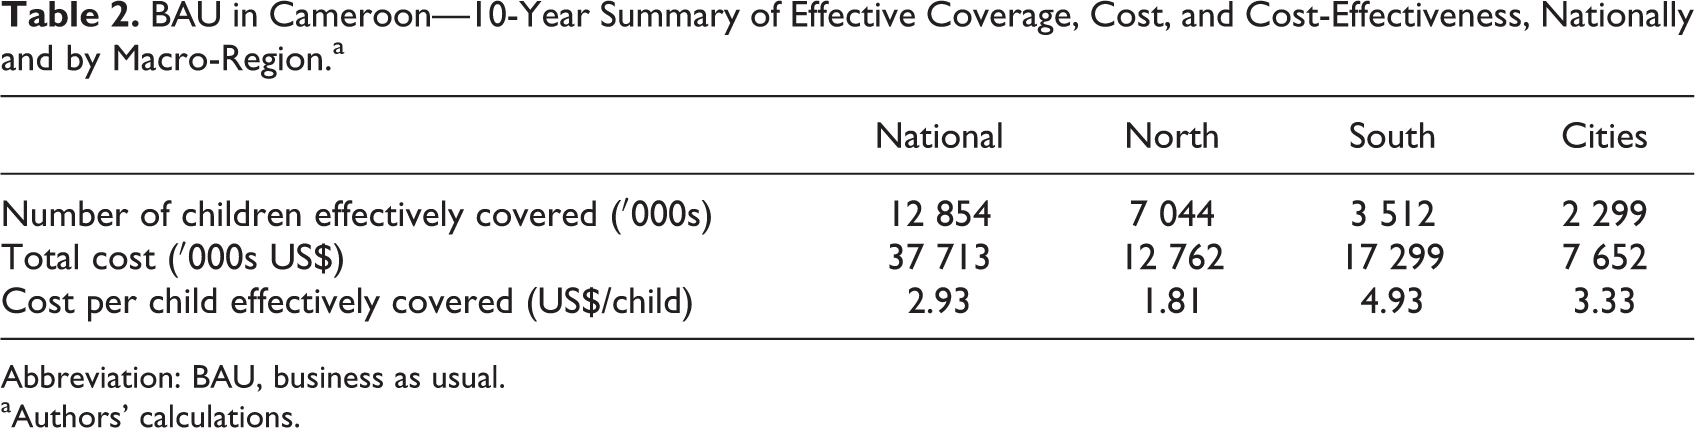
Abbreviation: BAU, business as usual.
aAuthors’ calculations.
As one might expect given the data presented in Figures 1 and 2, the national cost-effectiveness measure presented in Table 2 (column 2) masks substantial spatial variation in cost-effectiveness (Table 2, columns 3-5), suggesting that there may be ways of altering the mix of interventions chosen over space, and perhaps time, to achieve similar levels of effectiveness (number of children effectively covered) at lower costs, especially if additional candidate interventions are available.
An application of the economic optimization model to Cameroon—nonuniform spatial and temporal patterns in VA interventions
The economic optimization model is now used to assess the extent to which VA interventions can be reallocated over space and time to achieve the same level of effective coverage (over the 10-year simulation time horizon, ie, ∼12.9 million children), but at a lower cost. Decision makers are presumed to feel some urgency in addressing VA deficiencies, so a discount rate of 3% is applied to nutritional benefits (note 16).
In this simulation, 3 new candidate interventions, 1 subnational and 2 others national in scope, are added. Each macro-region will now have the option of distributing MNPs that contain VA during CHDs in any given year over the 10-year simulation time horizon. Policy makers will also be able to choose to invest in a bouillon cube fortification program and a maize biofortification program (note 17), both of which face start-up costs but generate no benefits over the first 3 years, and face lower costs and generate nationwide benefits beginning in year 4 (note 18). Recall that VA deficiencies were not distributed uniformly across the country. 11 The same was true for some of the costs associated with managing one important delivery platform, CHDs. 9
Table 3 reports the results of this new simulation; once again, the optimization model is free to choose the most cost-effective combinations of VA interventions over time (10 years) and space (3 macro-regions). The combinations of interventions that emerge from this economically optimal simulation differ from the BAU scenario in several fundamental ways.
Optimal Solution for Cameroon—Interventions, Effective Coverage, and Program Costs, by Year and by Macro-Region.a
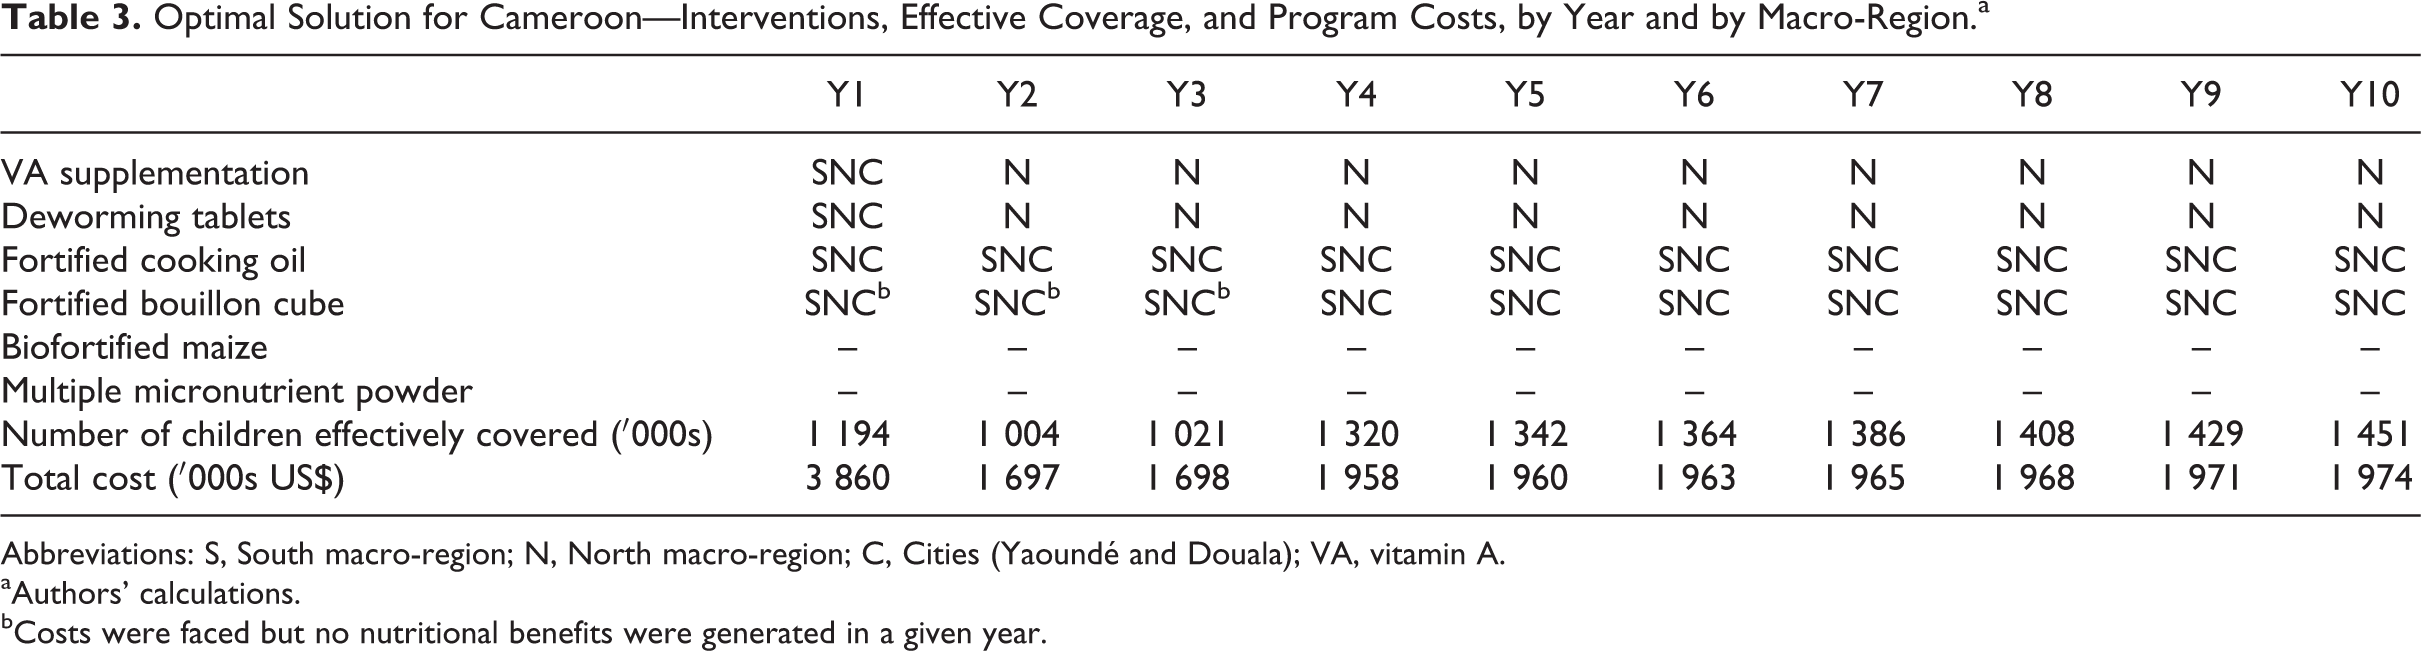
Abbreviations: S, South macro-region; N, North macro-region; C, Cities (Yaoundé and Douala); VA, vitamin A.
aAuthors’ calculations.
bCosts were faced but no nutritional benefits were generated in a given year.
First, and foremost, the subnational interventions (which appear in Table 3 as dichotomous indicators of macro-region-specific activities: S = South, N = North, and C = Cities) focus primarily on the North macro-region vis-à-vis the BAU scenario, exclusively so beginning in year 2, where VA deficiency was most common and where the costs of CHDs (the delivery platform used to distribute VAS, DW tablets, and MNP) are lowest per targeted child.
Second, and related, the distribution of DW tablets is never recommended in the Cities and in the South after year 1.
Third, the national bouillon cube fortification program is adopted and maintained, even though the program faced 3 years of start-up costs and only begins to generate benefits in year 4.
Fourth, the national maize biofortification program is not pursued. The effect of increased levels of pro-VA carotenoids in maize on the adequacy of VA intakes (a function of the prevalence of inadequate VA intakes, the proportion of children currently consuming maize, and the assumed VA content of the maize) among children aged 6 to 59 months is too low to justify the costs of the program, even if the international community paid the Research and Development costs associated with basic seed development. 9
Fifth, although DW contributes little to improving VA status among young children, it is chosen in the North macro-region (and in the South and Cities macro-regions in the first year) because it is a very inexpensive intervention to add to CHDs.
Finally, the optimization model never selects MNP as a cost-effective strategy for reducing VA deficiencies, even in the North macro-region—VAS, which is also distributed via the CHD delivery platform, is a more cost-effective option for delivering VA (note 19).
Measuring the efficiency gains of spatially and temporally flexible intervention schemes
Table 4 reports the effective coverage and fiscal consequences associated with adopting the collection of VA interventions suggested by the optimization model. Nationally, approximately13 million children are effectively covered (as was approximately the case for the BAU scenario), at an overall cost of approximately US$21 million, which represents US$1.63 per effectively covered child (compared to US$2.93 per effectively covered child in the BAU scenario).
Optimal Solution in Cameroon—10-Year Summary of Effective Coverage, Cost, and Cost-Effectiveness.a
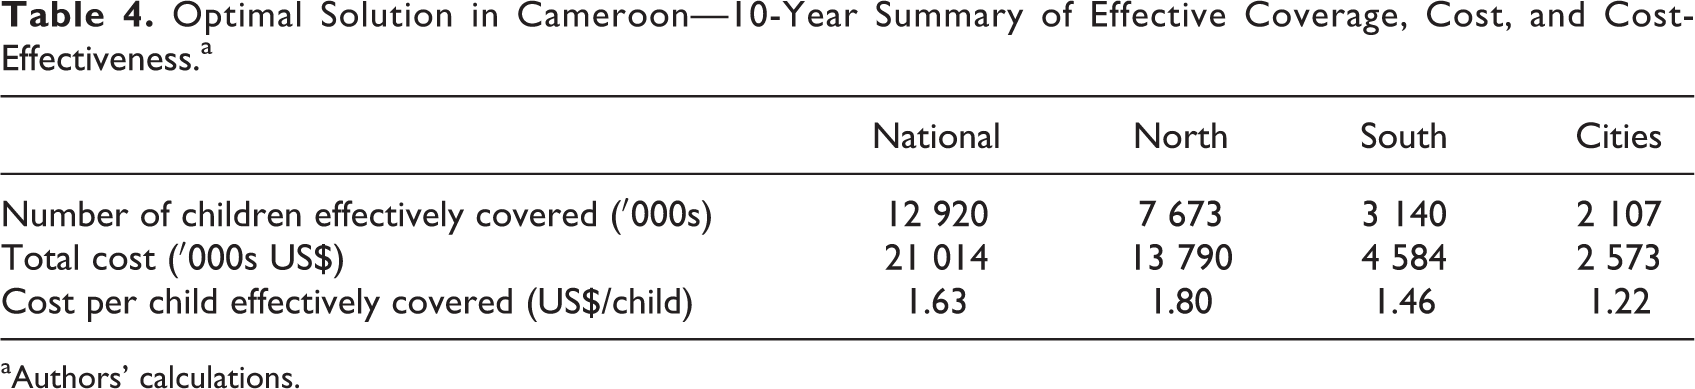
aAuthors’ calculations.
Subnationally, vis-à-vis the BAU scenario, the model suggests substantial shifts in VA intervention expenditures from the South and Cities macro-regions to the North macro-region; expenditures increase in the North macro-region by approximately 8%, but fall by approximately 74% and 66%, respectively, in the South and Cities macro-regions. But this very large spatial reallocation of VA intervention program expenditures is not expected to cause proportionately large differences in effective coverage. Indeed, the combination of VA interventions suggested by the model (which include 1 new intervention, VA-fortified bouillon cubes) increased effective coverage by approximately 9% in the North macro-region, while decreasing effective coverage in the South and Cities macro-regions (where CHDs are effectively halted early in the simulation period) by approximately 10% and 8%, respectively.
Table 5 reports the cost savings and the additional outlays associated with shifting from the BAU scenario to the more efficient scenario suggested by the economic optimization model. Curtailing the distribution of DW tablets in South and in the Cities throughout most of the simulation period saves approximately US$3.5 million. Curtailing VAS in the South and Cities macro-regions after year 1 (effectively shutting down CHDs in those areas; note 20) saves approximately US$15.9 million. Adding a national bouillon cube VA fortification program costs about US$2.9 million over the simulation period. The net savings over the entire simulation period are approximately US$16.7 million, or approximately 44% of the outlays required by the BAU scenario. Again, the total number of effectively covered children increased under the optimal combination of VA intervention programs, though the spatial distribution of effectively covered children changed somewhat.
Effective Coverage and Efficiency Gains Associated With Shifting to Optimal VA Intervention Programs Over a 10-Year Time Horizon.a
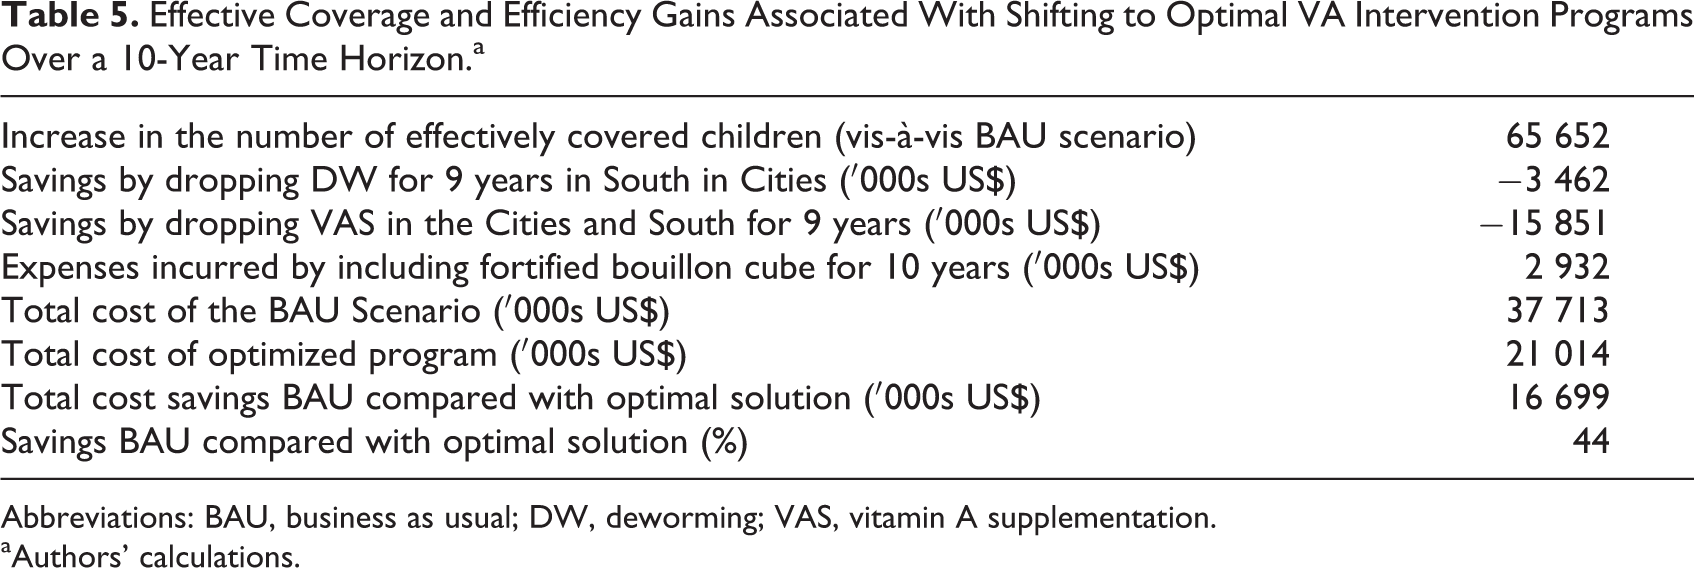
Abbreviations: BAU, business as usual; DW, deworming; VAS, vitamin A supplementation.
aAuthors’ calculations.
The costs associated with (1) designing and implementing the dietary and biomarker data collection; (2) undertaking the required laboratory and dietary data analyses; (3) collecting and analyzing the intervention cost data; and (4) developing and testing the nutrition, cost, and economic optimization models was approximately US$900 000—this represents approximately 5% of the 10-year savings associated with shifting from the BAU strategy to the strategy suggested by the economic optimization model.
Discussion
The economic optimization model applied to VA intervention programs focusing on young children in Cameroon demonstrates that there are large potential efficiency gains associated with shifting from the BAU approach involving a spatially homogeneous, nationwide CHDs and fortified edible oil to an approach that allows for shifting resources to geographic areas of greater need (and where implementation costs were lower), terminating subnational interventions when appropriate, and implementing a broader set of low-cost national food fortification programs. The cost savings associated with such a policy shift, while meeting the same national effective coverage achieved under the BAU scenario, were approximately 44%. The data collection and research costs required to develop the model would require only about 5% of the accrued savings over the 10-year simulation period. Moreover, these research investments would allow for simulating the effects and cost-effectiveness of other VA interventions and of other MN interventions.
However, deciding upon and implementing the collection of interventions identified by the model could be challenging for several reasons. First, while the efficient scenario achieved roughly the same national objective as the BAU scenario (∼13 million children effectively covered), the geographic distribution of the beneficiaries is different—the target populations in the North macro-region benefit more than those in the South and Cities macro-regions, where effective coverage declines somewhat. Second, and related, more human and financial resources associated with VA intervention programs would flow to the North under the efficient scenario. Resource flows to the South and Cities macro-regions would fall considerably. Both of these outcomes may be viewed as inequitable or politically unacceptable and hence pose challenges to implementation. If so, the model could be used to identify alternative sets of more politically viable VA intervention programs that would achieve the same macro-regional benefits as those achieved under the BAU scenario, at costs lower than those faced in the BAU scenario but higher than those reported in Table 3.
More important, this decision support tool was developed to provide a new framework for thinking about designing and managing VA intervention programs in developing countries. We now can answer specific questions related to the benefits, costs, and cost-effectiveness of sets of alternative VA intervention programs that could not be answered before, and these new answers can help inform policy discussions. However, this tool, along with every tool like it, is incomplete in several ways.
First, VA is not the only MN that young children in low-income countries lack. Future work will expand the number of MNs in the model (note 21). But including a larger suite of MNs into the model will prompt discussions and hard choices regarding the relative importance (in the model, the relative “weights”) that decision makers allocate to different MNs, for example, how important is achieving sufficient dietary intake of VA compared to (say) iron? For MNs that affect child mortality, the Lives Saved Tool (LiST; note 22) offers a way of “weighting” alternative MN interventions according to their abilities to directly and indirectly reduce child mortality. For other MNs, for example, vitamin B12, no such link with mortality exists, so other ways of identifying the value to society of reducing vitamin B12 deficiencies will have to be applied. Moving beyond measures of effective coverage or mortality to (eg) disability-adjusted life years (DALYs) will also help address this issue.
Second, and related, some of the interventions that affect dietary VA also affect other health and nutrition outcomes of interest for young children. For example, DW tablets minimally affect VA uptake but have other benefits that are short-term in nature and observable to caregivers, and hence may be viewed as a “leader product” from the point of view those aiming to make delivery platforms such as CHDs more attractive, effective, and efficient. The current version of the model does not include this or any other non-VA benefit.
Third, the model presented here focuses exclusively on young children (and 1 large cohort of them aged 6-59 months). Other groups and subgroups may merit attention. For example, WRA also face VA deficiencies in some areas of Cameroon and the model has the potential to include them as beneficiaries. However, given the size of the WRA population (which is many times larger than that of children aged 6-59 months) and the VA interventions that can reach them (fortified foods, essentially), if WRA and young children are put on “equal footing” in the model, dramatic increases in funding would have to be made available to achieve the effective coverage rates for young children reported here, as resources would flow first to the very large number of WRA that can be effectively covered by relatively inexpensive fortified food programs, and only then to more expensive programs targeting children. In the end, decision makers may have to implement dual targets (one for WRA and another for children), essentially weighting one group as more important than another.
Fourth, the results presented here focus exclusively on effective coverage in terms of dietary intake, that is, the number of children consuming diets containing inadequate quantities of VA, who are “shifted” to diets containing sufficient VA, thanks to 1 or a combination of VA intervention programs. There are other metrics of success that can be incorporated into the model, for example, reach or coverage. The most efficient collection of interventions suggested by the model will be sensitive to the choice of indicators of success, and these choices should also be part of the overall policy discussion.
Fifth, in the model, the nutritional benefits associated with the VA intervention programs do not “follow” children over time, so the cumulative effects of these interventions cannot be estimated. This could have implications for some of the cognitive and other benefits of VA interventions that require sustained adequate dietary intake. However, the VA interventions included in the model have high levels of coverage, and the model could be used to identify cost-effective strategies for achieving effective coverage rates that are higher than those achieved in the BAU scenario.
Finally, and as is always the case for modeling exercises such as the ones presented here, the reliability of model results depends on the accuracy and detail of the data, and the assumptions made in preparing the data for use. Data availability is a challenge for both benefits and costs. In particular, matching nutrition benefits to intervention costs is difficult because, among other things, they are derived from different sources and cover different time periods.
We acknowledge these shortcomings and will address many of them in future work. However, the tool makes several fundamental contributions, some of which are useful today for guiding national and other policy discussions related to VA interventions in developing countries.
First, the model demonstrates the value (in terms of efficiency gains) of extending the decision time horizon beyond the 6-month or 1-year time frame that is commonly used in the context of VA intervention programs in developing countries today. Doing so broadens the set of candidate VA interventions that can be considered, especially including those that face high, multiyear start-up costs and generate benefits only after these are paid.
Second, the model obliges its users to examine more carefully: what the term subnational might imply—the subnational geographic units (or contiguous clusters of them); policy autonomy and the willingness or ability to take independent action at subnational level; the types of interventions that are or could be crafted to be subnational and those that are not; the start and stop periods of national and subnational interventions, which may be more tightly interwoven as the number of interventions increases; and stakeholders’ preferences over target populations that may benefit more/less from given intervention programs.
Third, the model provides a logical and empirically based method for examining spatial and intertemporal trade-offs among VA interventions that are included in the model and establishes a conceptual framework (at least) to guide discussions around innovative VA interventions that are not yet included in the model.
Fourth, it reminds decision makers and scientists of the data and of the research required to examine these trade-offs, and hence the need for systematic investments in data collection, cleaning, storage, and analysis.
Fifth, the model can be used to assess the costs (in terms of efficiency losses) of maintaining nationwide VA intervention programs managed on annual or shorter time frames, and the efficiency gains associated with making specific incremental changes to BAU practices. It will be up to policy makers to assess economic and political wisdom of investing the time, money, and political capital needed to change BAU practices to reap the efficiency benefits that the economic optimization model identifies and measures.
Finally, for reasons set out above, the example results of the economic optimization model presented here should not be used to modify nutrition policy in Cameroon, or anywhere else. Rather, the primary objective of this exercise is to provide a new framework for examining trade-offs among alternative VA interventions and to identify the data and methods required to make this framework concrete. Future work will generate a more complete VA model that is better suited to produce results that are useful in policy discussions. Future work will also focus on developing similar models for other MNs, and wrestling with the thorny issues of linking models for young children with those for other at-risk populations. But even when the VA and other models are complete and tested for Cameroon, changing MN intervention policies should always be accompanied by discussions with representatives of all stakeholders, by other information, and by monitoring and evaluation activities to ensure that the predicted efficiency gains associated with changes in MN intervention programs are realized.
Footnotes
Acknowledgments
We thank the HKI-Cameroon team, including Xavier Crespin and especially Ann Tarini, Martin Nankap and Alex Ndjebayi, and the participants of 2 workshops convened by HKI-Cameroon in Yaoundé. We are grateful for the contributions of Georges Okala, Japhet Tata, and Christian Bela of the Ministry of Public Health of Cameroon for supervision during the national nutrition survey. We also thank Dr Jeanne Ejigui, Nutrition Officer for UNICEF in Cameroon, for her help with providing data and expert guidance in its use and interpretation. We are grateful for guidance provided by Senoe Torgerson and Shasha Jumbe at the Bill & Melinda Gates Foundation. We also acknowledge the comments and suggestions provided by participants in seminars/presentations at UC Davis, Tufts University, the International Food Policy Research Institute, and the Micronutrient Forum in Addis Ababa and meetings that preceded it. We benefited greatly from comments and suggestions provided by careful and thoughtful reviewers. Guy Alexander Mballa provided timely and expert research assistance. We thank Marjorie Haskell, Janet Novotny, and Keith West for comments on the estimation of VA benefits, and Erica Rettig, Hanqi Luo, Jehan Sparks, Janet Peerson, Ryan Murphy and Kevin Dodd for statistical and research advice.
Authors’ Note
The findings and conclusions contained within are those of the authors and do not necessarily reflect positions or policies of the supporting organizations. All errors are those of the authors alone.
Declaration of Conflicting Interests
The authors declared no potential conflicts of interest with respect to the research, authorship, and/or publication of this article.
Funding
The authors disclosed receipt of the following financial support for the research, authorship, and/or publication of this article: This manuscript is based on research funded in part by grants to the University of California, Davis by the Bill & Melinda Gates Foundation, the Michael and Susan Dell Foundation, and Sight and Life.