
Abstract
Distributed acoustic sensing (DAS) has shown potential for traffic monitoring: when applied to fiber optic cables installed near roadways, it can capture vibrations from roadway activities, including higher-frequency surface waves from the dynamic interaction between vehicles and the road surface, and low-frequency pseudo-static signals from ground deformation because of loading and unloading near the fiber. While prior studies have largely focused on vehicle monitoring using telecommunication cables offset from roadways, this study explores the use of DAS for pedestrian monitoring, which introduces new challenges because of lower amplitude and variability in movement patterns. The primary experimental site featured fiber optic cables embedded in the roadway, providing strong fiber–road coupling and high-sensitivity, high-resolution capture of pedestrian activity. Controlled experiments were conducted to simulate walking, jogging, running, and jumping. Signal characteristics were examined in relation to movement type, speed, the individual pedestrian, the DAS gauge length, and variations in data processing, such as decimation, filtering, initial roadway strain, and min-max scaling. Random forest (RF) and K-nearest neighbor (KNN) algorithms were used to identify pedestrian ID from the jump data, demonstrating the ability to capture subtle differences in movement. To complement these controlled experiments and address real-world variability, additional pedestrian signals were explored from a secondary site where fiber was buried along a water pipeline beneath an active road in a residential area. Despite increased noise and reduced coupling, pedestrian signals remained detectable, providing additional evidence for DAS sensitivity to pedestrian movements. These findings support the broader applicability of DAS for pedestrian-aware urban traffic monitoring.
Distributed acoustic sensing (DAS) is a fiber optic sensing technology that leverages a standard fiber optic cable to create a densely sampled array of vibration sensing points using coherent Rayleigh backscattering along the fiber. This enables high-resolution spatiotemporal monitoring of strain and vibrations with applications across diverse domains, including earthquake detection ( 1 – 5 ), structural health monitoring ( 6 – 10 ), and bioacoustics ( 11 – 15 ). In the context of traffic monitoring, DAS has primarily been applied to existing fiber optic infrastructure near roadways to detect and track vehicle activity ( 16 – 21 ). This study shifts the focus to explore the potential of DAS for monitoring pedestrians rather than vehicles—a less studied application that introduces new challenges because of the lower amplitude and variability of pedestrian-induced signals.
A series of controlled experiments was conducted on an instrumented roadway in Richmond, California, where fiber optic cables were embedded directly into the road surface. This setup, while not representative of typical telecommunication deployments, offered a unique opportunity to observe the DAS performance under pavement-integrated fiber coupling conditions. Therefore, it could be viewed as a way to approximate an upper bound on the signal quality and detection sensitivity. Activities including walking, jogging, running, and jumping were simulated, and the collected data were analyzed to assess the potential role of DAS in future pedestrian-aware traffic management systems.
To complement these controlled experiments, this study also analyzed data from a second site in Oakland, California, where a fiber optic cable was buried beneath an active roadway in a residential area. This configuration presents a more realistic setting, with vehicle traffic, environmental variability, and reduced coupling between the fiber and the road. Pedestrian signals identified at this site demonstrate that DAS can detect human activity even under noisy, mixed-use conditions. These observations provide supporting evidence for the broader applicability of DAS in urban environments where fiber deployments could vary in relation to installation depth, proximity to road surface, and ambient noise conditions.
DAS Measurements and Gauge Length
A DAS system consists of three main components: the fiber optic cable, the DAS interrogator, and computational resources ( 22 , 23 ). The interrogator is connected to one end of the fiber. It operates by launching a series of light pulses down the fiber optic cable and monitoring the backscattered light that returns to the interrogator. As the pulse travels down the cable, some of the light gets scattered because of inherent inhomogeneities in the cable. A small fraction of this light travels back along the fiber to be detected by the receiver in the interrogator (Figure 1). The location on the fiber where the backscattering light originated can be computed from the time delay, speed of light, and refractive index of the fiber glass. Computational resources are then used to process, visualize, and store the data.
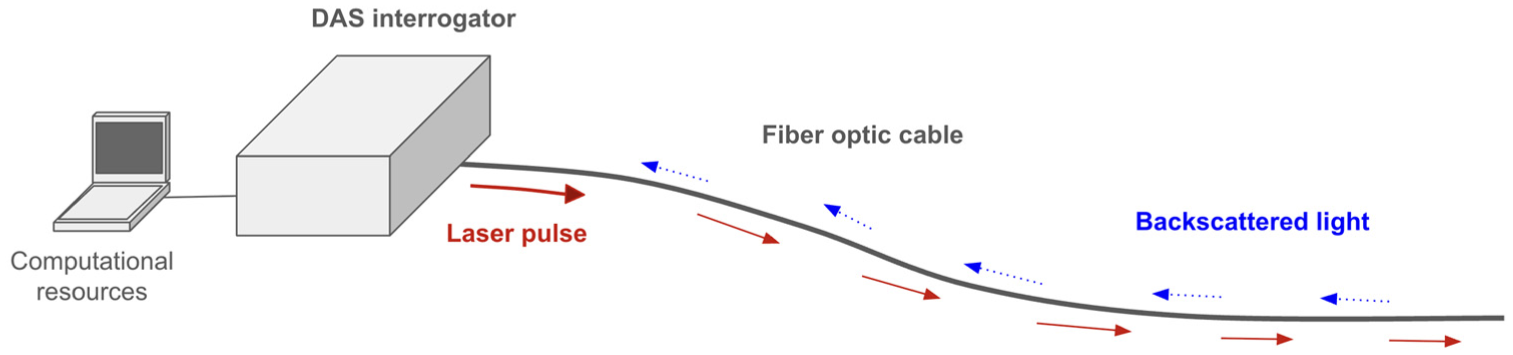
A DAS system consists of the fiber optic cable, DAS interrogator, and computational resources.
When a disturbance occurs on the fiber (e.g., vibrations coming from a distance reaching the fiber or a physical force applied to the fiber), it induces a phase change in the backscattered light. The phase change is directly proportional to the strain in the optical fiber over the gauge length of the fiber, allowing the system to pinpoint the location as well as the magnitude of the disturbance along the length of the fiber. The phase change is proportional to strain in an optical fiber over a single gauge length, described by Equation 1 ( 23 , 24 ),

where
The gauge length is a critical parameter in DAS that determines the spatial resolution of the measurements. It represents the length of the fiber segment over which strain is effectively averaged by the interrogator (
25
,
26
). The gauge length also influences the range of detectable wavelengths. For a given wavelength
The gauge length is distinct from channel spacing, which refers to the distance between consecutive measurements along the cable. At each sampling step, the data is recorded at each channel (i.e., measurement point). Therefore, the data is obtained as a two-dimensional (2D) array with dimensions of channel and time. The channel dimension represents the individual sensing points along the fiber optic cable, and the time dimension represents the time series of signals detected by each sensing point:
Advantages and Applications of DAS
DAS offers multiple advantages as a sensing technology. It enables measurements along long distances of cable (up to tens of kilometers), provides high sampling rates (up to kilohertz), and relatively high spatial resolution (as small as 1-m spacing between consecutive sampling points) (
29
). In addition, DAS can capture a wide range of frequencies, including acoustic (
Traffic monitoring is a growing research area for DAS. Prior studies have mainly focused on applying DAS to existing telecommunication fiber optic cables installed along roadways, often buried or placed within underground conduits, with recent developments in vehicle traffic estimation, vehicle detection, characterization, and classification ( 16 – 21 ). Research has demonstrated that vehicle movements near roadside cables can be captured by DAS because of surface waves from vehicle-road interactions, as well as the ground deformation caused by the vehicle’s weight. Unlike traditional traffic sensors, such as inductive loops, piezoelectric sensors, and Mach–Zehnder interferometers—typically installed at fixed points ( 33 – 36 )—DAS uses a continuous fiber optic cable to capture distributed vibration signals along the fiber length. This allows for spatially continuous measurements over long distances, offering a distinct advantage when monitoring large or sparsely instrumented road networks, including rural or underserved areas that lack conventional sensor coverage.
However, research into using DAS for pedestrian monitoring remains limited, with pedestrian signals often overlooked or treated as noise rather than the intended measurement targets ( 37 – 39 ). Hubbard et al. investigated DAS sensitivity to non-vehicular activities, including a cyclist, a pedestrian, and a dog, but the application of DAS for pedestrian monitoring was not the focus ( 40 ). Unlike vehicles, pedestrians generate lower-amplitude vibrations because of their lighter weight and exhibit movement patterns that are inherently more varied in gait ( 41 , 42 ), speed, and activity type. This presents a need and an opportunity to explore the potential of DAS for capturing signals from pedestrian activities, which could provide valuable insights into road usage and support safety for non-motorized users.
Objective
This study investigates the feasibility of using DAS for pedestrian monitoring, a less explored application compared with vehicle tracking. By focusing on pedestrian activities, such as walking, jogging, running, and jumping, this study aims to characterize signal variations based on movement type and individual differences. Key objectives include evaluating the influence of the DAS system parameters (e.g., gauge length) and data processing configurations, as well as exploring the potential of machine learning algorithms to identify individual pedestrians from their activity-specific signals.
Methods
This study analyzed data collected at two sites: a primary site where fiber optic cables were embedded directly into the road surface, and a secondary, complementary site where the fiber was installed in conjunction with a buried water pipeline beneath an active roadway. While the embedded fiber configuration differs from typical telecommunication deployments, where cables are often placed in a trench or buried at an offset distance from the roadway, it provided a controlled environment that had increased mechanical coupling between the fiber and road surface. This allowed for clearer signal detection and an assessment of DAS performance under near-ideal installation conditions. The secondary site presented a more realistic urban setting with reduced coupling and overlapping signals from vehicle traffic. Together, these sites support a broader evaluation of DAS for pedestrian monitoring. The following section outlines the site characteristics, experimental design, data acquisition, processing, and analysis.
Primary Site: Directly Embedded Fiber
The instrumented roadway at the University of California, Berkeley’s Richmond Field Station served as the primary experimental site (Figure 2). Fiber optic cables were placed in small grooves that were cut into the old pavement surface, then overlaid with a new layer of asphalt concrete. This installation, developed by Hubbard et al., who were the first to demonstrate the use of this roadway for traffic monitoring ( 40 ), enabled physical contact between the fiber and the road surface with reduced lateral offset and depth. This study leverages this existing installation, using the original fiber layout without additional modifications.
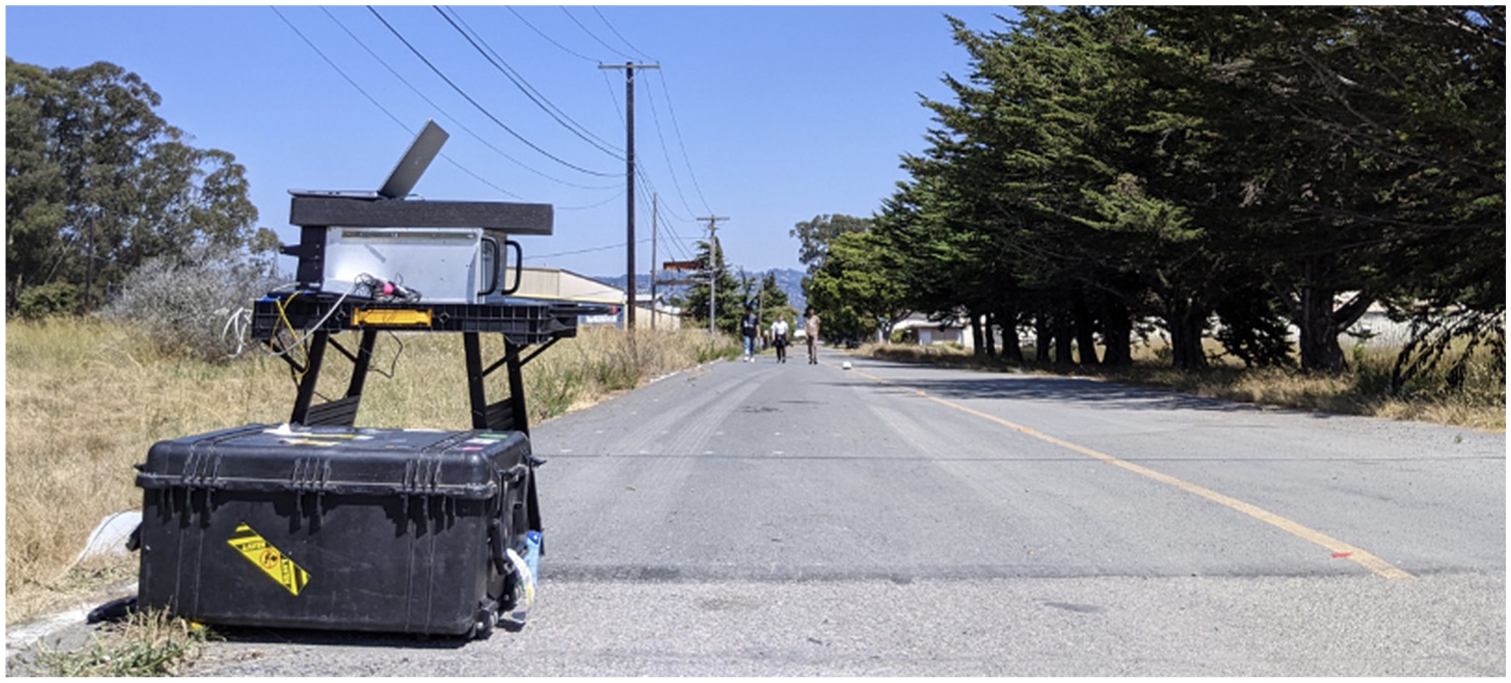
Instrumented roadway in Richmond, California, where the start of the cable is connected to a distributed acoustic sensing interrogator.
The roadway is approximately 100 m long, with about 700 m of cable installed in a snake-like pattern, with each longitudinal section spaced about 40 cm apart (Figure 3). The cable is arranged into eight longitudinal sections, seven of which span the overall length of the roadway. In this study, the analysis is limited to these seven full-length sections. During a road event, vibrations affect the entire fiber; therefore, all sections of the cable capture the event.
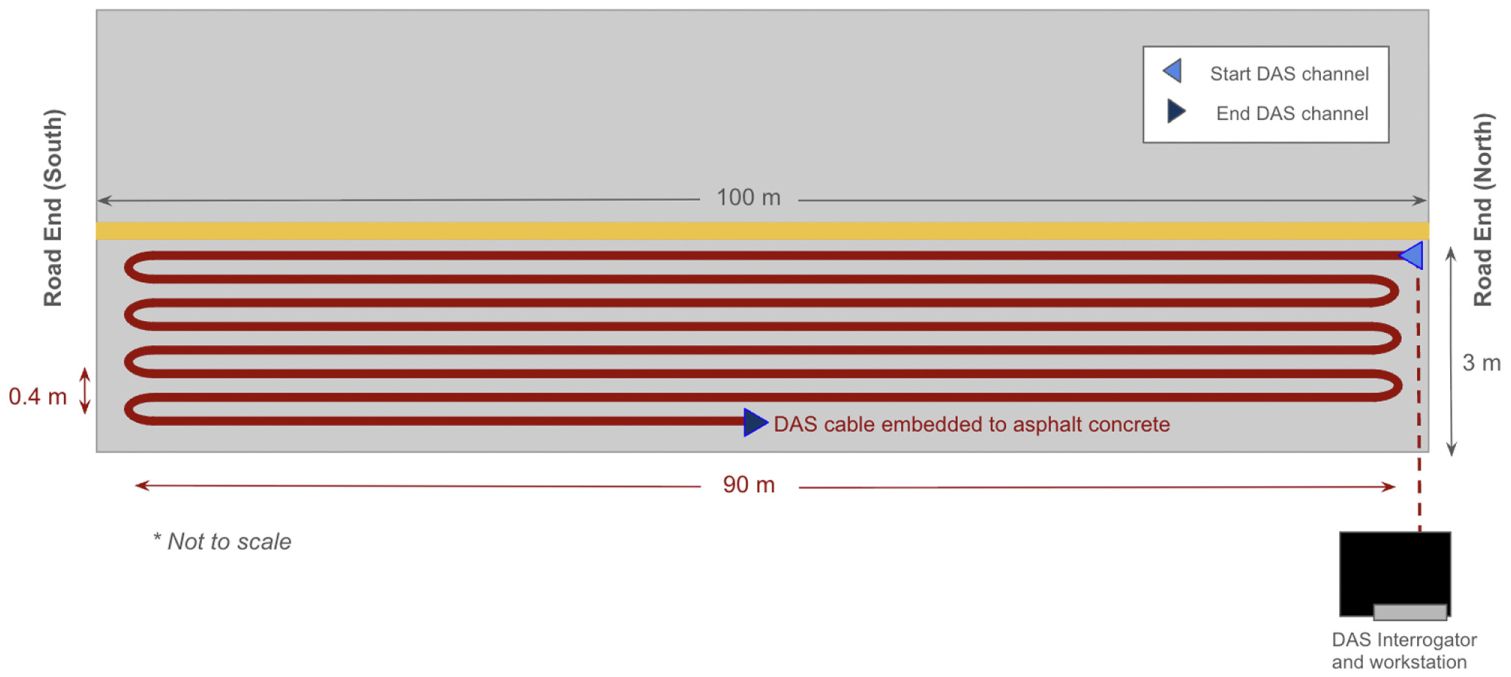
Layout of the embedded fiber. There are eight longitudinal sections of the cable, with seven spanning the full length of the roadway. The longitudinal sections are spaced approximately 0.4 m apart. The start of the cable is connected to a DAS interrogator.
Experimental Design
Controlled experiments were conducted on the embedded fiber roadway to understand the nature of the signals associated with different pedestrian activities. The DAS measurements were collected using an OptaSense ODH4 interrogator with channel spacing of 1 m, sampling rates of 10 kHz and 20 kHz, and gauge lengths of 2.04, 4.08, and 8.17 m. The experiments were divided into three parts, consisting of different pedestrian activities and road users..
Experiment Part 1: Individual Pedestrian—Walking, Jogging, Running
Three pedestrians participated in this experiment, with each pedestrian instructed to travel individually along the length of the roadway. They sequentially performed three activities: walking, jogging, and running, with each activity covering approximately one-third of the roadway length. This setup aimed to capture DAS signals generated by natural movements of one pedestrian at a time and to analyze differences in signal patterns and magnitudes associated with each type of movement.
Experiment Part 2: Individual Pedestrian—Regularly Spaced Jumping
Three additional pedestrians participated in this experiment, each performing the jumping activity individually. Each pedestrian was instructed to jump at nine prespecified locations along a lateral line on the roadway. The jumps were performed at consistent intervals, varied at 1, 2, and 5 s between consecutive jumps. The data analysis focused on different stages of the jump, including the preparation phase, lift-off, and landing. The goal was to capture the dynamic strain signals generated by the jumps and analyze how these signals vary with different jump intervals and locations. Pseudo-static signals were also analyzed to understand the loading and unloading effects on the fiber optic cable.
Experiment Part 3: Multiple Pedestrians—Jogging Together
In this experiment, three pedestrians jogged together along the length of the roadway, performing the activity in three distinct configurations: side-by-side, single file (one behind the other), and staggered diagonally. Each configuration aimed to simulate different patterns of group movement and examine the DAS signals produced when multiple individuals move at a similar speed and in similar ways. The analysis focused on understanding how the spatial arrangement of multiple pedestrians influences the recorded strain signals, including potential overlaps or interference effects between individual contributions.
Pseudo-Static versus Dynamic
When road users, such as vehicles and pedestrians, move on the roadway, the interaction between the road user and roadway induces deformation of the fiber optic cable embedded into the concrete asphalt material. The signals produced by these moving objects can be processed into two components: dynamic and pseudo-static. The dynamic component is characterized by the propagating surface waves caused by the dynamic user-road interaction resulting from the roughness of the road; the pseudo-static signals result from slower, weight-induced deformations of the roadway (17–19, 21 ).
This study analyzed the pedestrian signals across several frequency components (Table 1). A digital filtering approach was applied to isolate the relevant components while removing noise. For extracting the dynamic component, a third-order Butterworth high-pass filter at 5 Hz was first applied to the original data, followed by a third-order Butterworth low-pass filter at 20 Hz, creating a bandpass response in 5–20 Hz. To extract the pseudo-static components, a third-order Butterworth high-pass filter at 0.1 Hz was first applied to the original data to remove low-frequency drift and baseline variations. Then, low-pass filtering at 2, 3, and 4 Hz was applied to isolate different bands of the slow-motion signal. All filtering was implemented using zero-phase filtering to preserve temporal relationships and avoid phase distortion.
Signal Components Obtained from Raw Time Series
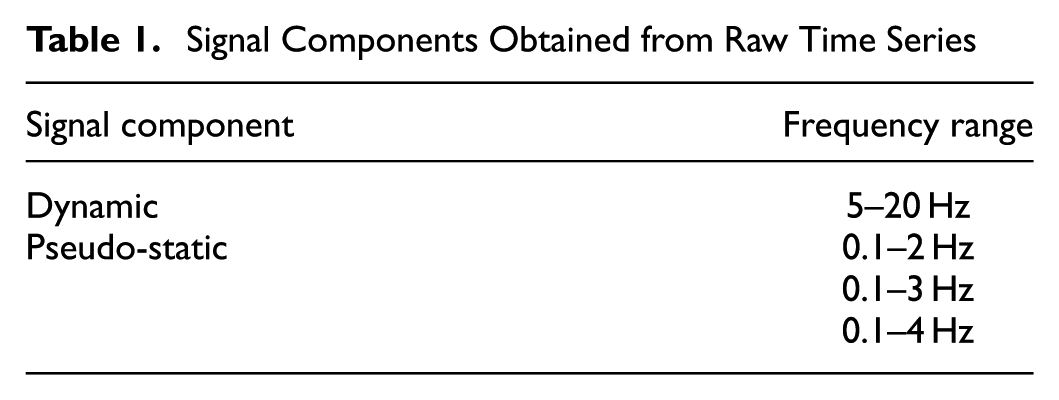
The filtering approach was implemented in two steps (high-pass followed by low-pass) rather than as a single bandpass filter to allow modular control over the frequency content of interest and facilitate reuse of the high-pass filtered data for different low-pass cutoffs. This also made it easier to evaluate the sensitivity of pseudo-static components to low-pass cutoff frequency while maintaining a consistent high-pass baseline.
Frequency Band Extraction and Waterfall Plot
Frequency band extraction (FBE) is a technique used to quantify the energy content in a time series within a specified frequency band over time. This method is applied to each channel’s data and proceeds as follows.
The time series is divided into frames of fixed length.
Each frame is detrended, windowed (e.g., Hann window), and transformed into the frequency domain using the Fast Fourier Transform (FFT).
The power spectrum is computed from the squared magnitude of the FFT output and scaled.
The mean power is calculated over the target frequency range, producing a single value for that frame and channel.
This process is repeated across all frames to produce a time series of band-limited energy values.
Mathematically, the FBE algorithm for a given channel ch with the time series xch is described by Equation 2,


where
The resulting FBE values are visualized as a 2D waterfall plot, where time progresses along the x-axis, distance along the DAS fiber on the y-axis, and color intensity represents the energy level in decibels (dB) computed from spectral density in
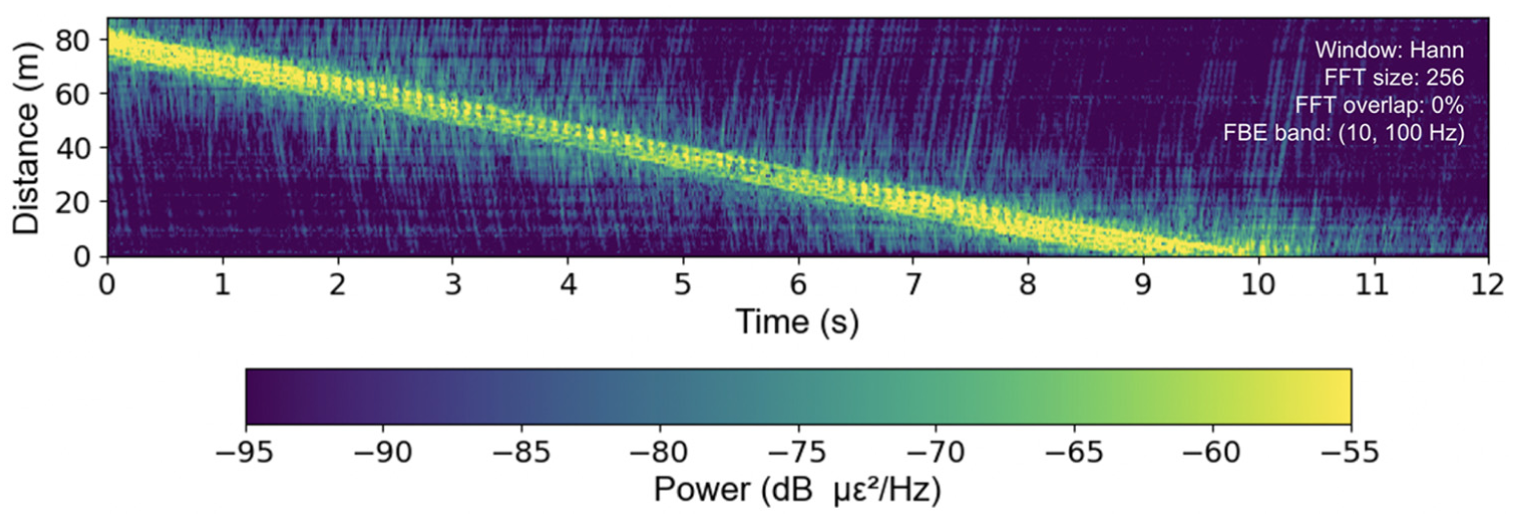
Example of a waterfall plot collected when a vehicle drove from the south to the north end of the roadway. The trajectory of the vehicle as it travels along the roadway is shown by the yellow line, indicating higher FBE values.
Machine Learning Classification for Pedestrian Identification
A goal of this study was to investigate whether DAS data could capture subtle differences between the movements of individual road users. The jump data from Part 2 of the experiments was used, analyzed with two machine learning algorithms: the Random Forest (RF) and
K-Nearest Neighbors (KNN) algorithms.
The primary motivation for selecting these relatively standard algorithms was to assess whether straightforward, easy-to-implement machine learning techniques could achieve reliable classification performance on the DAS data. This approach aligns with the broader goal of evaluating the potential for the relatively novel application of pedestrian monitoring, without prematurely introducing the complexity of advanced models. A positive result using simple algorithms would demonstrate that DAS could effectively distinguish pedestrian-specific signals, thereby justifying further exploration with more sophisticated techniques if needed.
The RF algorithm was chosen as the primary classification model because of its proven effectiveness with tabular data, robustness to noise, and resilience against overfitting ( 43 – 48 ). It constructs predictions by aggregating multiple decision trees as base learners ( 45 ). In addition, the RF’s nonparametric nature avoids the need for strict assumptions about the data ( 46 ). The model generates bootstrapped training data sets, builds decision trees for each set, and aggregates their outputs to make final predictions. Each tree is constructed using binary recursive partitioning, optimizing the splits and predictors by minimizing the residual sum of squares.
For comparison, the KNN algorithm was used as a baseline model. The KNN algorithm classifies instances by evaluating their proximity to labeled training data points, providing a straightforward method to benchmark the RF’s performance. Both models were implemented in Python using the scikit-learn library ( 49 ).
Complementary Site: Trench-Laid and Pipe-Attached Fiber
As part of a pipeline replacement project led by the East Bay Municipal Utility District (EBMUD), fiber optic cables were installed beneath an active residential road. These cables run alongside newly installed high-density polyethylene (HDPE) water transmission pipelines, which cross the seismically active Hayward Fault. Because of the region’s history of leakage and ground motion, the EBMUD integrated fiber optic sensing for long-term pipeline health monitoring ( 50 , 51 ).
This study examines two fiber configurations at this site: in one section, the fiber was laid within the trench alongside the pipeline; in another, it was directly attached to the pipe surface. Both configurations span an approximately 140-m stretch beneath a two-lane residential road (Figure 5). The fibers were installed along one side of the road, which influenced signal strength: activities in the lane closer to the fiber produced clearer, higher-amplitude signals, and those further away appeared weaker because of increased lateral distance.
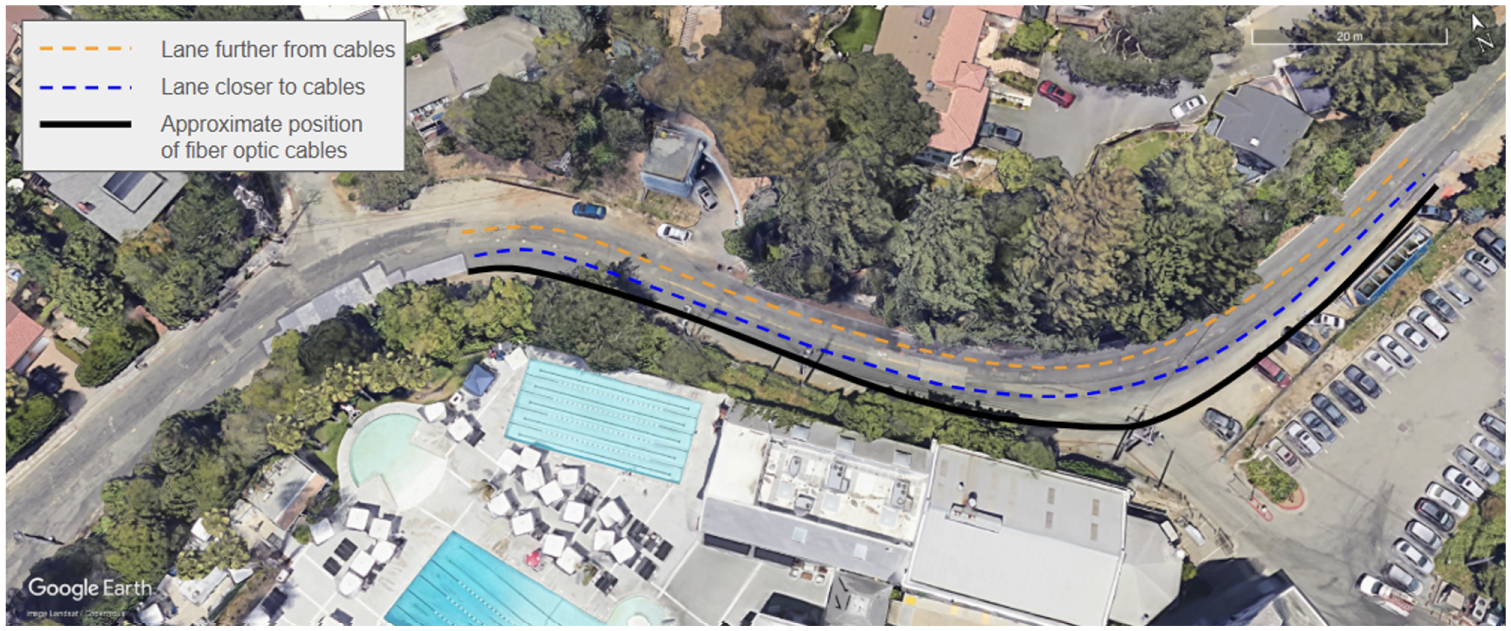
Map of the complementary site in Claremont, California, where the fibers (trench-laid and pipe-attached) were installed along one side of the road.
Unlike the controlled experiments at the embedded fiber roadway, the DAS data were collected continuously while road activities occurred naturally, allowing for the opportunistic recording of road users. This provided observations of pedestrian signals under more realistic, mixed-use conditions with reduced fiber–road coupling and intermittent traffic noise. The DAS system used was the OptaSense ODH4 interrogator, configured with a 2.04-m gauge length, 1-m channel spacing, and a 5 kHz effective sampling rate.
Results and Discussion
This section presents findings from the two sites, with a primary focus on the embedded fiber roadway. At this site, controlled experiments enabled detailed analysis of different pedestrian movements, speed estimation based on trajectory patterns, and classification of jump data. In contrast, the complementary site provided opportunistic recordings of pedestrian activity in a more realistic, uncontrolled environment.
Movement Type
Experiment Part 1: Individual Pedestrian—Walking, Jogging, Running
Pedestrians were instructed to travel individually along the length of the embedded fiber roadway, starting with walking, then jogging, and finally running, covering approximately one-third of the roadway length for each activity (Figure 6). The movements were sensed by all seven sections of the cable and were visualized in seven waterfall plots (Figure 7).
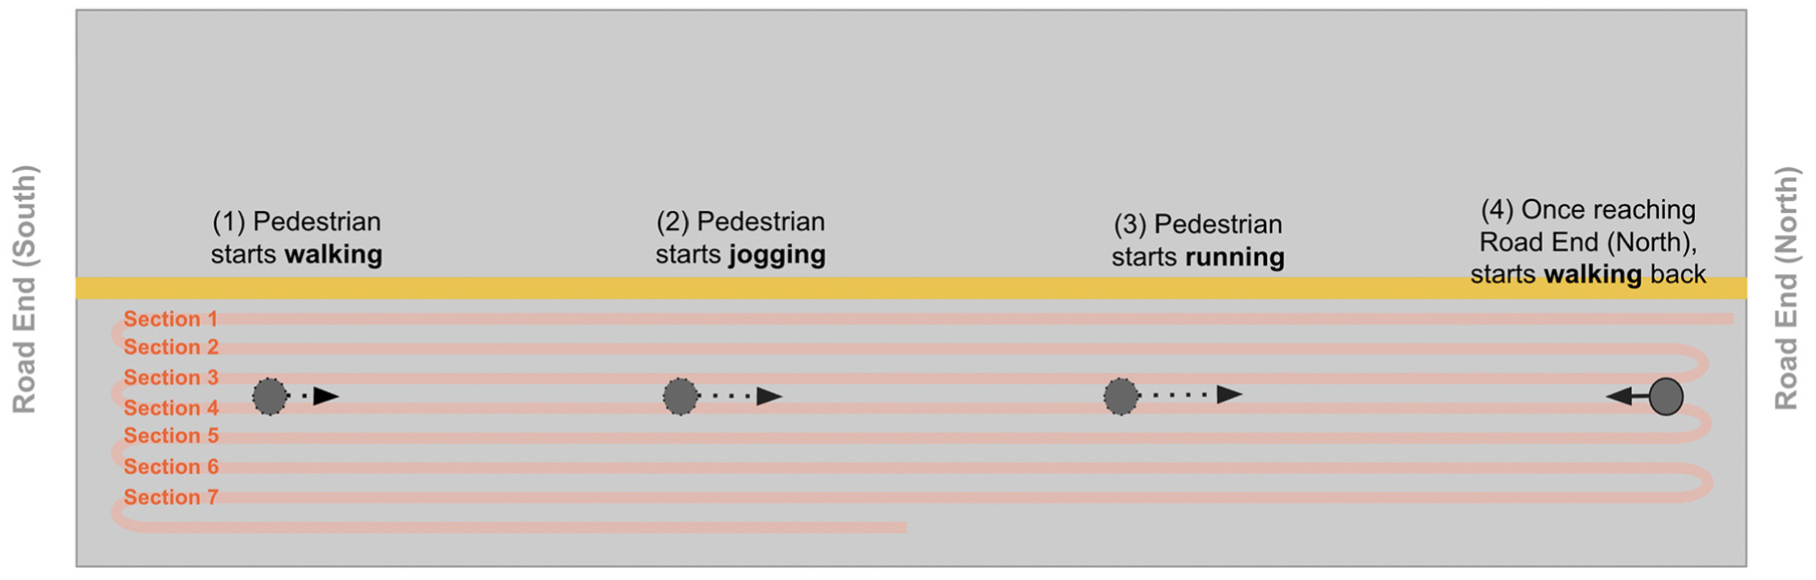
Showing pedestrian trajectory, consisting of walking, jogging, and running.
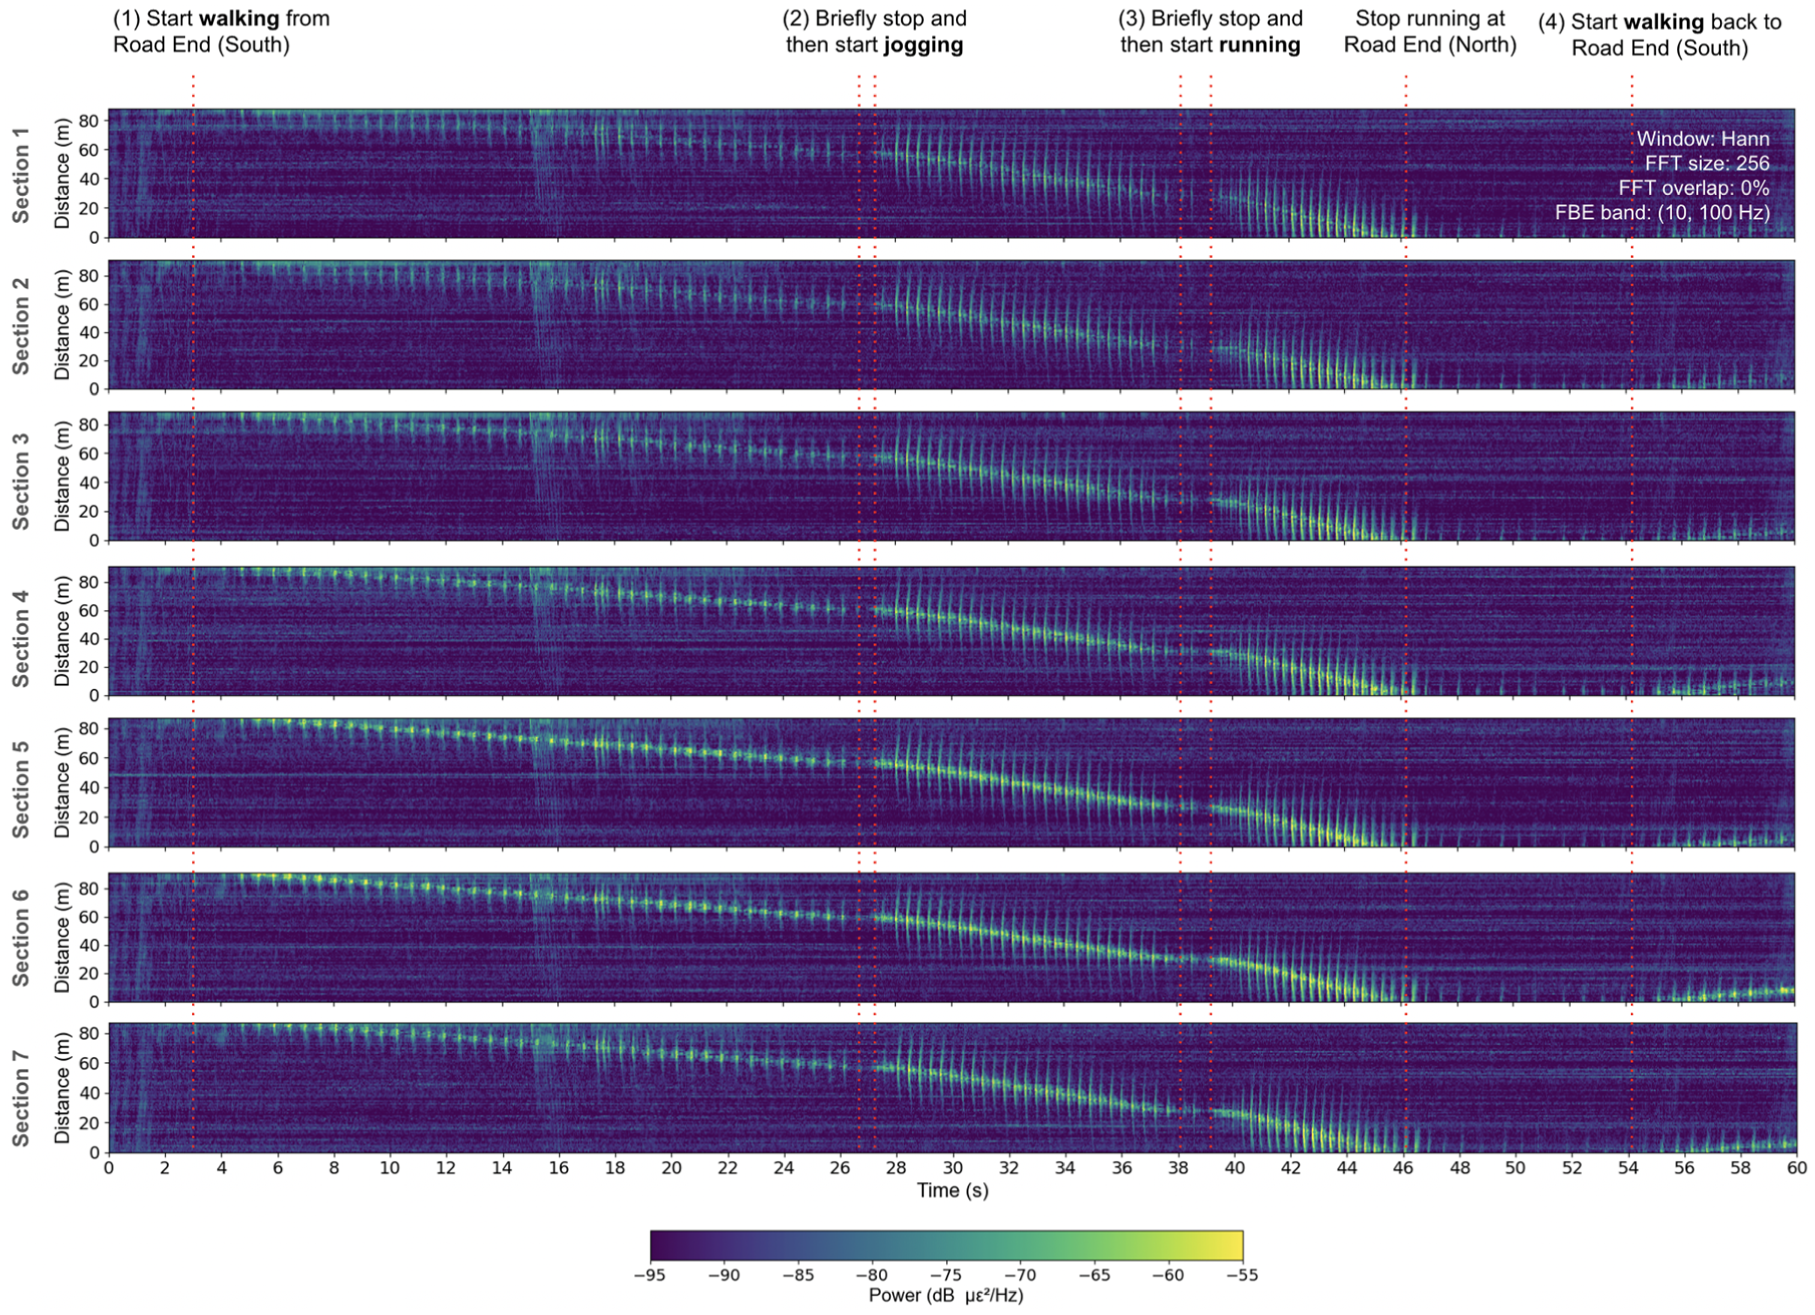
Waterfall plots for Sections 1–7, showing the pedestrian trajectory and movements.
The walking phase, occurring from approximately 3 to 27 s, was characterized by lower energy signals and more spaced-out steps. Jogging, seen from 28 to 38 s, produced higher energy signals with shorter intervals between impacts, indicating a faster pace and increased force. The running phase from 39 to 46 s generated the highest energy signals with the shortest intervals between impacts.
After reaching the northern end of the roadway but before beginning their return, pedestrians took several steps just beyond the instrumented area, often lightly treading or pausing momentarily as they turned around. This brief sequence, visible from approximately 47 to 54 s, produced weaker yet consistent signals. These subtle signal patterns indicate the sensitivity of the embedded fiber to low-energy movements such as pausing or adjusting footing.
Across all three participants, walking, jogging, and running produced distinct signal profiles and continuous trajectories across the channels, reflecting the direction and type of movement. The progression of signals along the fiber confirms its ability to consistently capture longitudinal motion, with each movement type identifiable in the plots.
Experiment Part 2: Individual Pedestrian—Regularly Spaced Jumping
Pedestrians were instructed to jump individually at nine specific locations along a lateral line across the roadway (Figure 8), as opposed to the longitudinal path taken during walking, jogging, and running. Each pedestrian performed jumps at these predefined points, with varying intervals of 1, 2, and 5 s between consecutive jumps. The jumps are observed as sharp impulses (with intervals of 1, 2, or 5 s) on the waterfall plots for all seven longitudinal sections of the pavement (Figure 9). This pattern was consistently observed across all three pedestrians who participated in the experiment, with individual jumps identifiable in the plots.
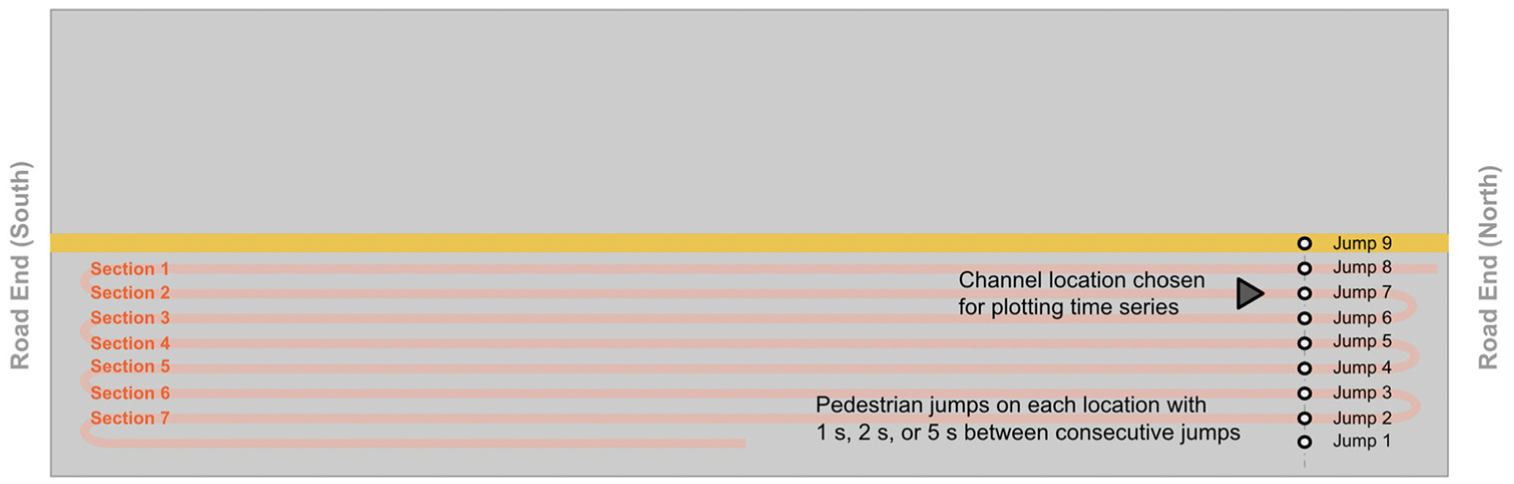
Regularly spaced pedestrian jumps, occurring at nine locations on a lateral line on the roadway.
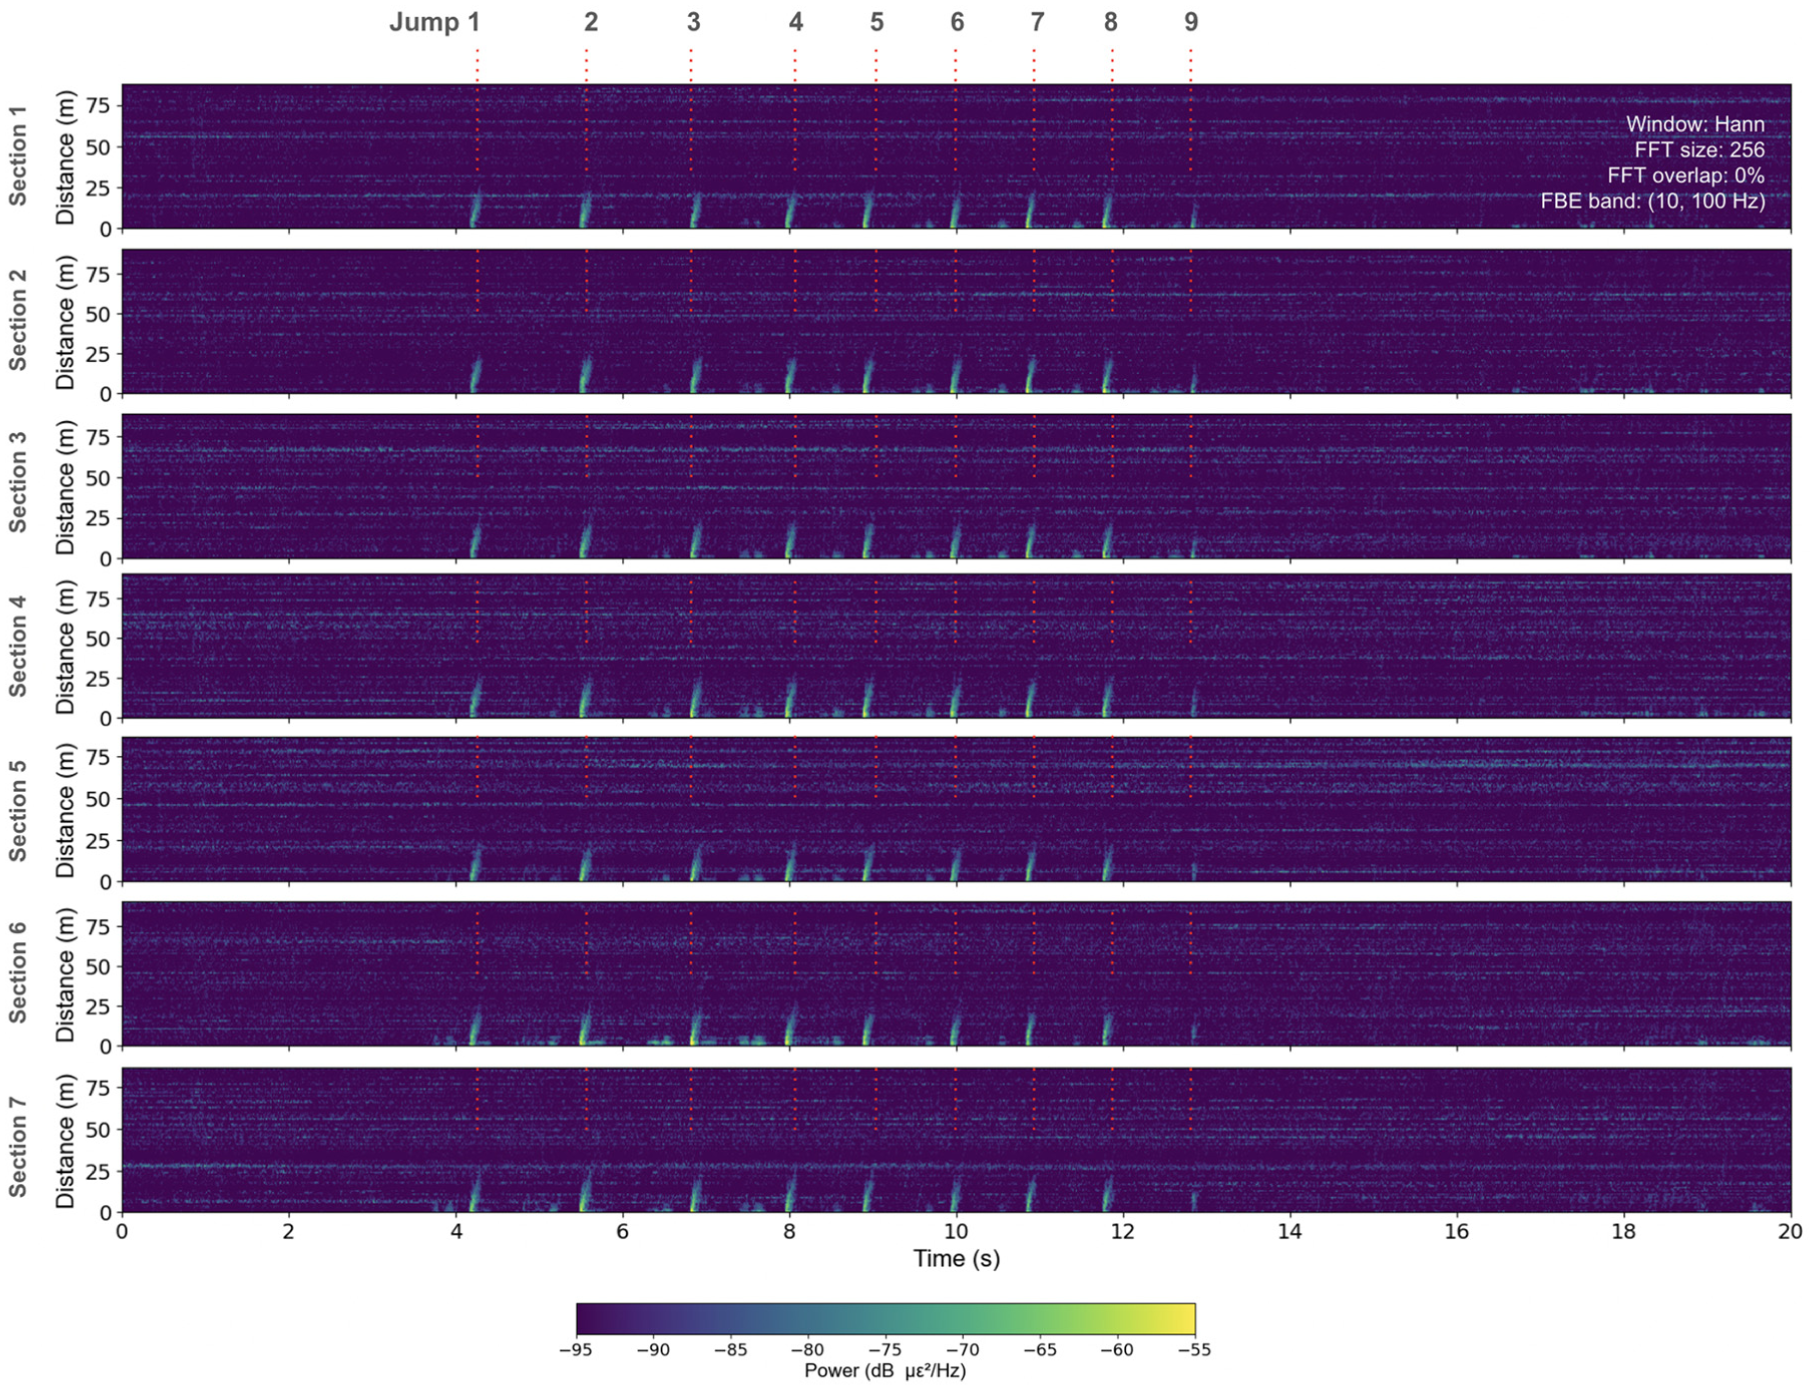
Waterfall plots for Sections 1–7, showing the pedestrian jumps.
Experiment Part 3: Multiple Pedestrians—Jogging Together.
Three pedestrians were instructed to jog along the roadway in three distinct configurations: side-by-side, single file (one behind the other), and staggered diagonally. The differences between the three configurations in the DAS measurements varied depending on several factors, including the spatial arrangements of the pedestrians, their alignment relative to the fiber, and the distribution of their steps across the DAS channels. In the side-by-side configuration (Figure 10a), the pedestrians jogged parallel to each other, resulting in their steps registering on channels with lateral offsets. This spatial separation reduced signal overlap, producing slightly clearer signals in the DAS measurements. In the single-file configuration (Figure 10b), the pedestrians jogged one behind the other, causing all their steps to register on closely adjacent DAS channels. This overlap led to blurring effects that reduced the clarity of individual impacts. The staggered diagonal configuration (Figure 10c) introduced the most complexity, as the pedestrians’ steps registered on DAS channels with both lateral and longitudinal offsets. The irregular spacing and timing of impacts created more overlapped and blurred signals. These differences highlight the sensitivity of the DAS measurements to the spatial and temporal characteristics of the pedestrian movements. Factors such as step synchronization, alignment relative to the fiber, and the distribution of impacts across channels impacted the clarity and separability of the recorded signals.
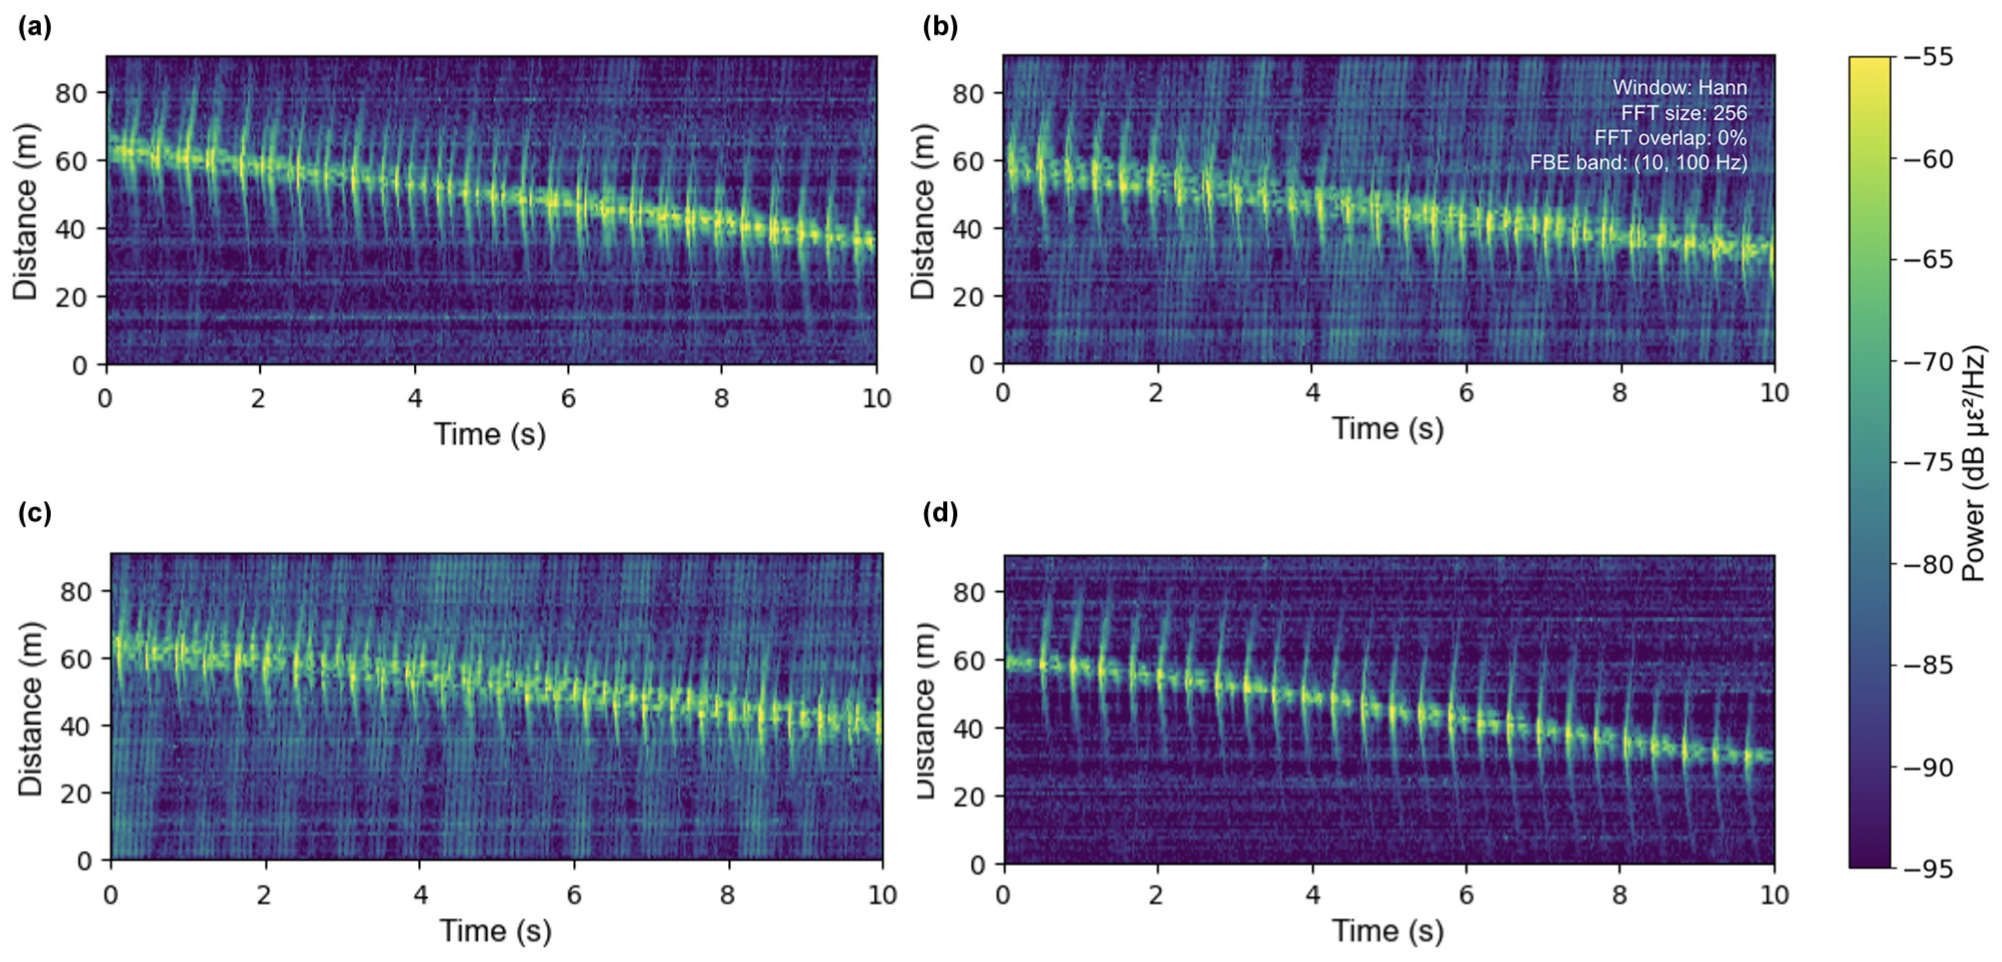
Three pedestrians jogging together in three different configurations: (a) side-by-side; (b) single file (one behind the other); (c) staggered diagonally; and (d) shows one pedestrian jogging as a reference.
Speed Estimation and the Effects of Gauge Length
The speed of walking, jogging, and running can be estimated from the waterfall plot by analyzing the trajectory of the signals (Figure 11). As the pedestrian travels along the roadway, the signals create a diagonal pattern on the plot, moving from one end of the channels to the other. By measuring the slope of this trajectory, the speed can be calculated, because the slope represents the time it takes for the pedestrian to move across the distance covered by the fiber optic cable.
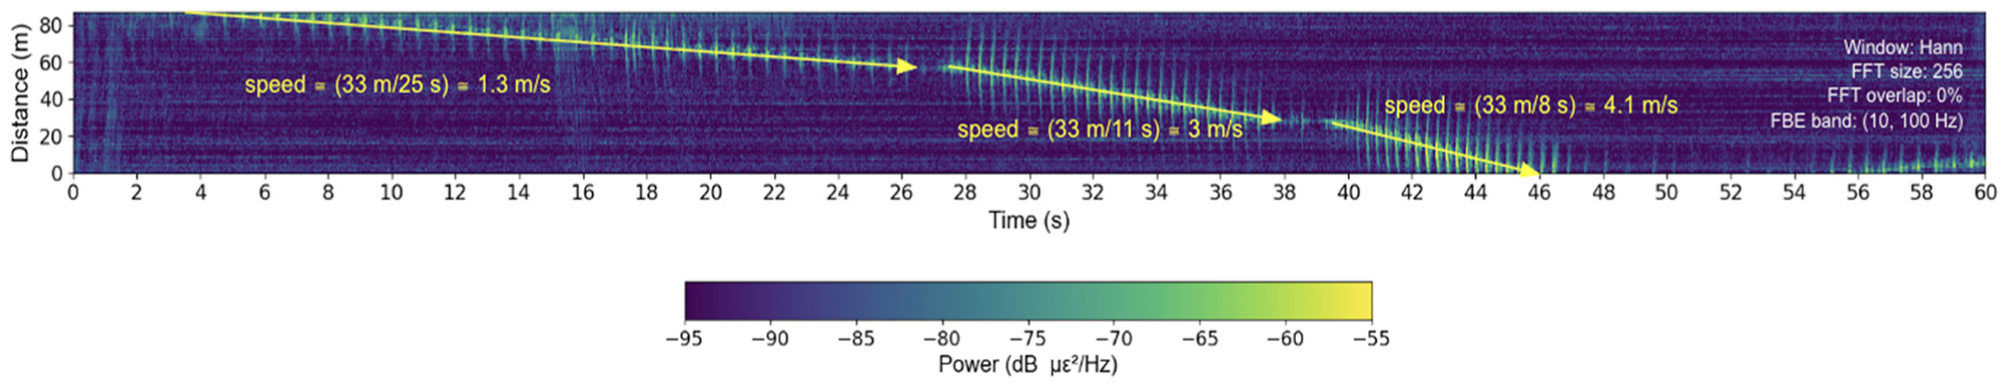
Estimated speeds of walking, jogging, and running using trajectories on waterfall plots, generated from data collected using a 2 m gauge length, are shown for a single section of the cable.
The gauge length in the DAS measurements was a critical factor in determining the spatial resolution and signal clarity (Figure 12). At 2 m, the higher resolution enabled more precise localization of strain events, identification of individual impacts, and more accurate delineation of the trajectory. Increasing the gauge length to 4 m reduced resolution, causing signals to blur, making the trajectory less distinct. At 8 m, the resolution was further reduced, resulting in more blurred signals and introducing uncertainty in estimating instantaneous speeds. Larger gauge lengths, however, were still suitable for approximate speed estimation over longer time frames, though with less detail and clarity. Future work incorporating synchronized ground-truth data is needed to quantitatively evaluate how gauge length impacts the accuracy of pedestrian speed.
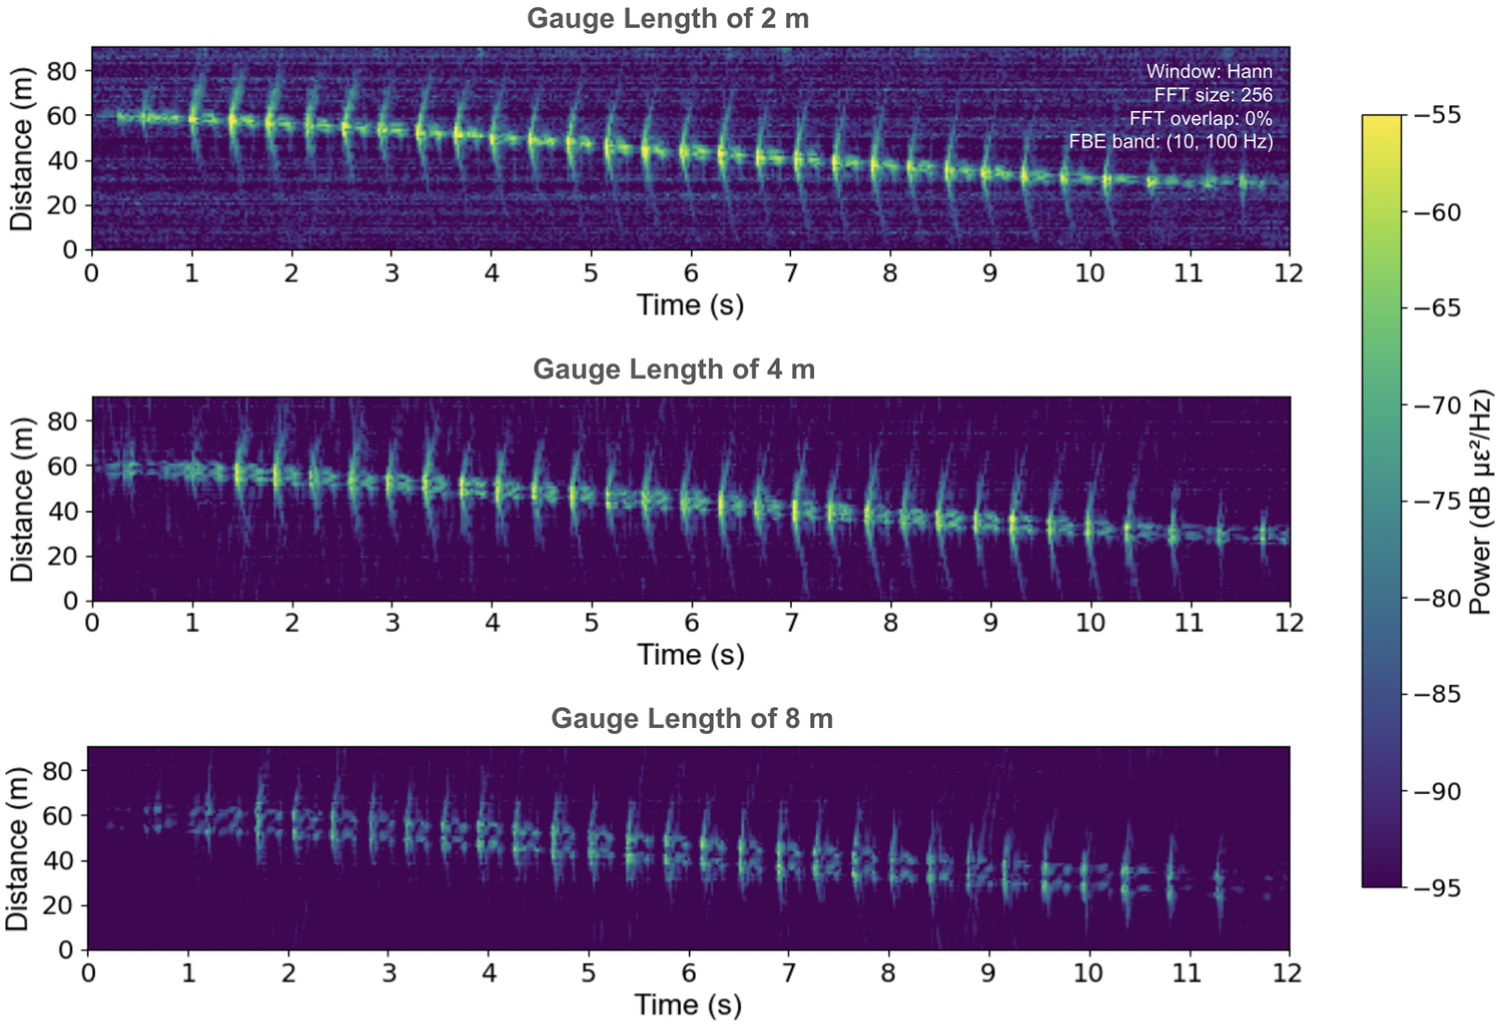
Comparisons between jogging captured in the distributed acoustic sensing data using different gauge lengths.
Pedestrian Identification Using Jump Data
The jump data collected from Part 2 of the experimental program (Figure 13) were used for pedestrian identification. The goal was to investigate whether DAS data could capture the subtle differences in the individual jumping styles of Pedestrians A, B, and C. The jump data were processed to extract four components: dynamic (5–20 Hz) and pseudo-static (0.1–2.0 Hz, 0.1–3.0 Hz, and 0.1–4.0 Hz).
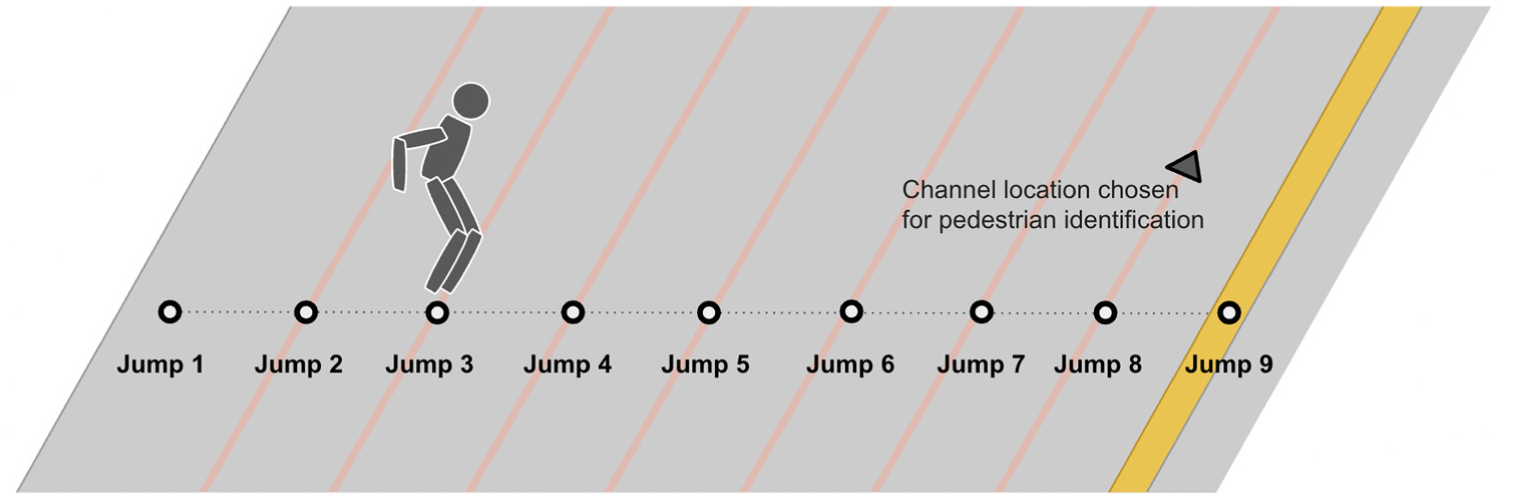
Pedestrian jumps at nine locations on the roadway. The channel selected for analysis was offset from the line along which the jumps occurred.
For the analysis, a single DAS channel slightly offset from the line along which the jumps occurred was selected. This approach aimed to evaluate whether localized strain measurements from even a single channel could capture sufficient information to distinguish individual jumping patterns. By focusing on a single channel, this study tested the feasibility of using sparse spatial data for pedestrian identification, particularly in scenarios where only limited sensing points are available. This also provided an opportunity to assess the robustness of DAS data in reflecting individual differences in pedestrian movements.
The following preprocessing steps were analyzed to evaluate their effect on classification accuracy.
Dynamic and Pseudo-Static Time-Domain Signals
The time series data for the different types of jumps reveal distinct patterns (Figure 14). For 1-s jumps, the time series was relatively smooth, with a relatively short wait time of 1 s between consecutive jumps. The pedestrian movements were fluid, with less noticeable trembling at the landing locations for the jumps. However, for jumps with 2 and 5 s intervals, the time series contained more fluctuations. This increased variability is attributed to the pedestrian’s effort to stabilize and maintain their position on the prespecified landing spot before executing the next jump. The longer wait times allowed for more noticeable trembles as the pedestrian adjusted their balance and prepared for the subsequent jump, causing more pronounced fluctuations in the recorded signals.
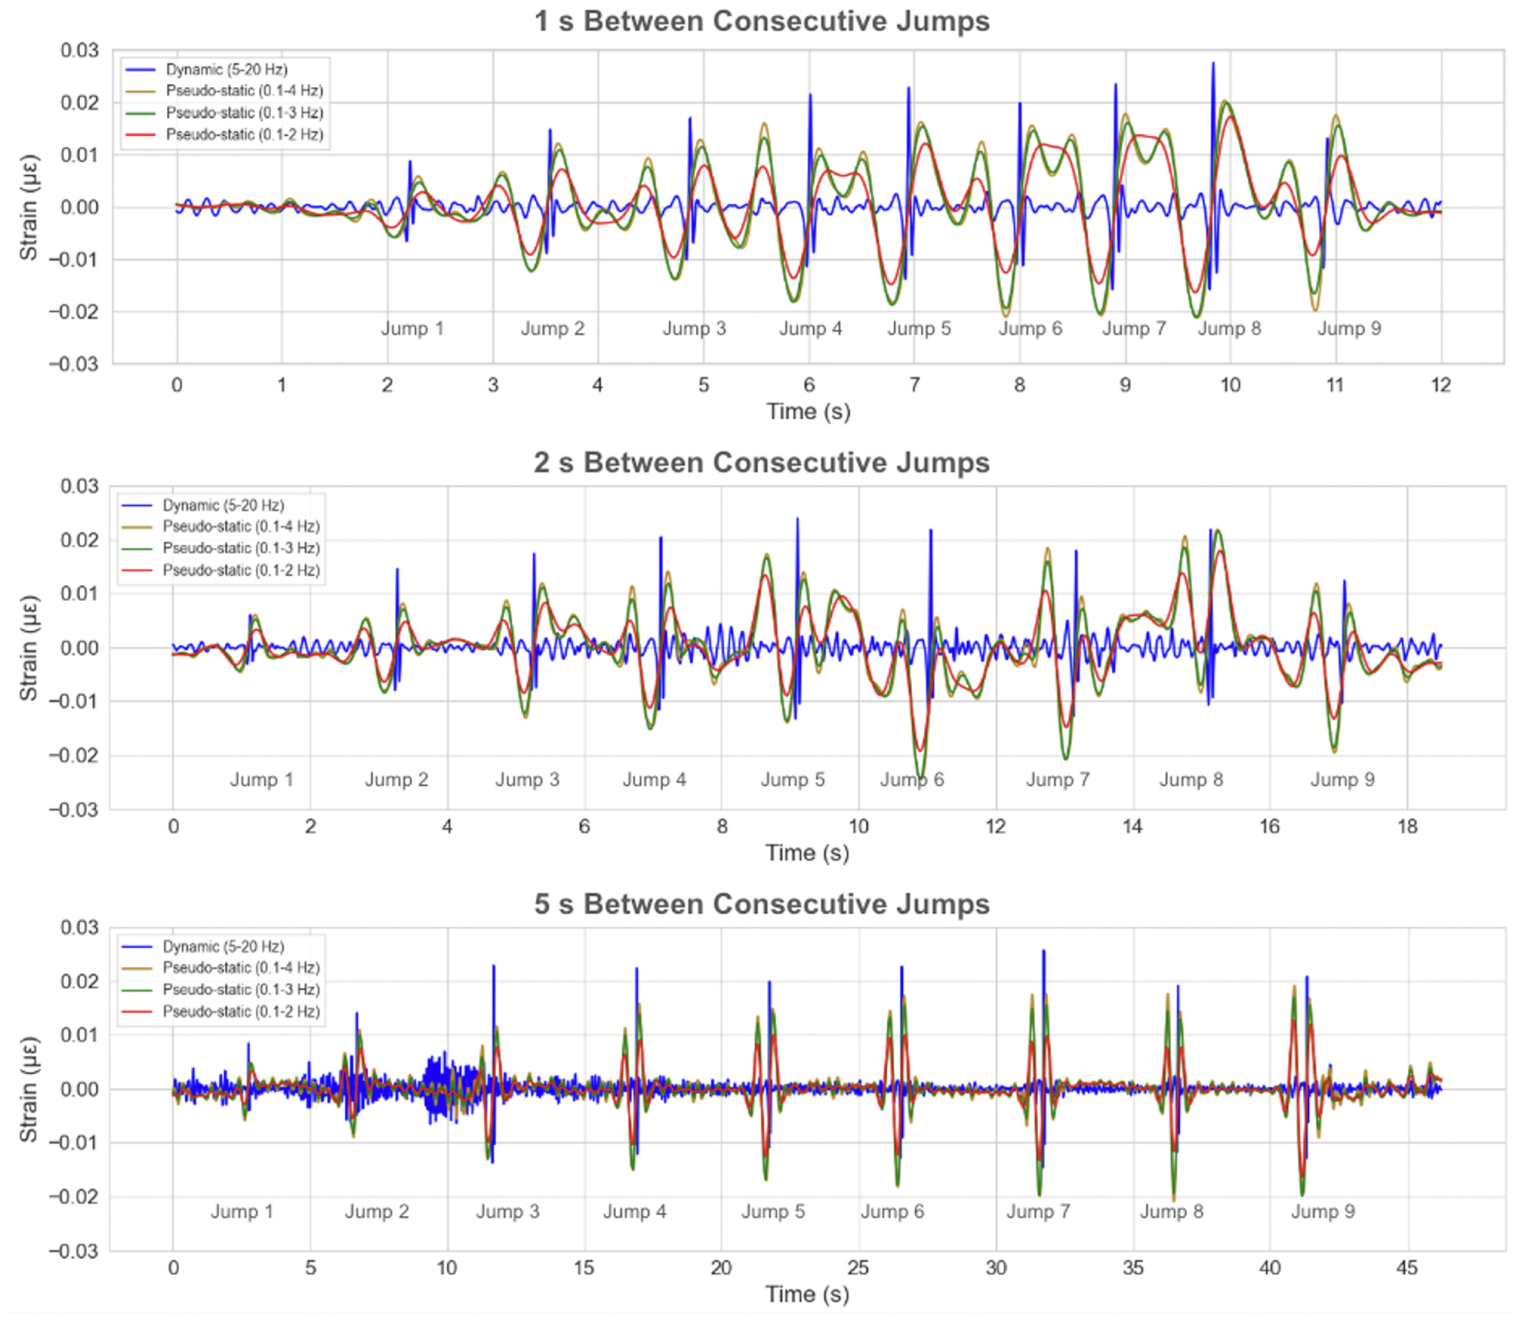
Comparison of differently spaced jumps, shown for Pedestrian A.
On closer examination of individual jumps (Figure 15), a consistent pattern emerged in the dynamic and pseudo-static signals. These components captured various phases of the jump: preparing to take off, jumping off the surface, and landing.
This pattern was consistent across all jumps, observed for all three types of jumps (1, 2, and
5 s). It was also consistent for all three pedestrians.
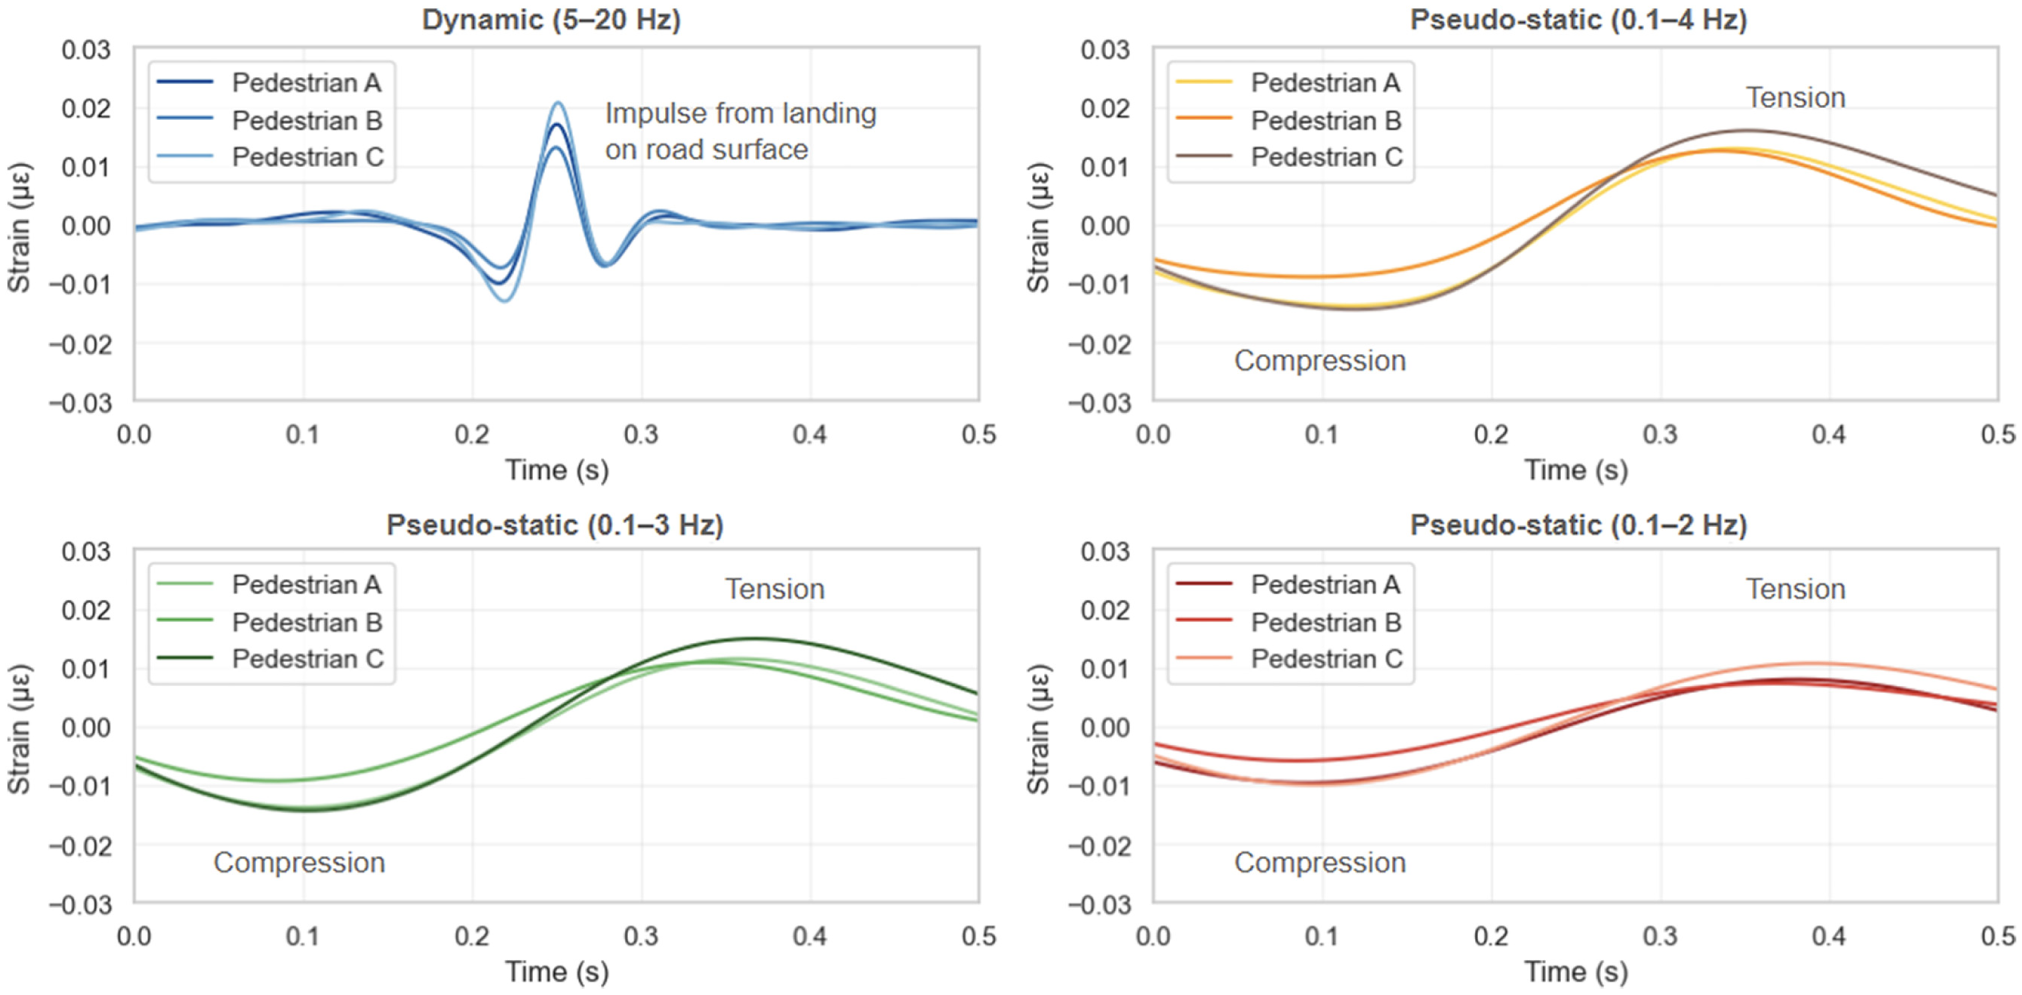
A single jump from the 1-s spaced jumping experiment, shown for all three pedestrians. The dynamic and pseudo-static components.
Machine Learning Classification
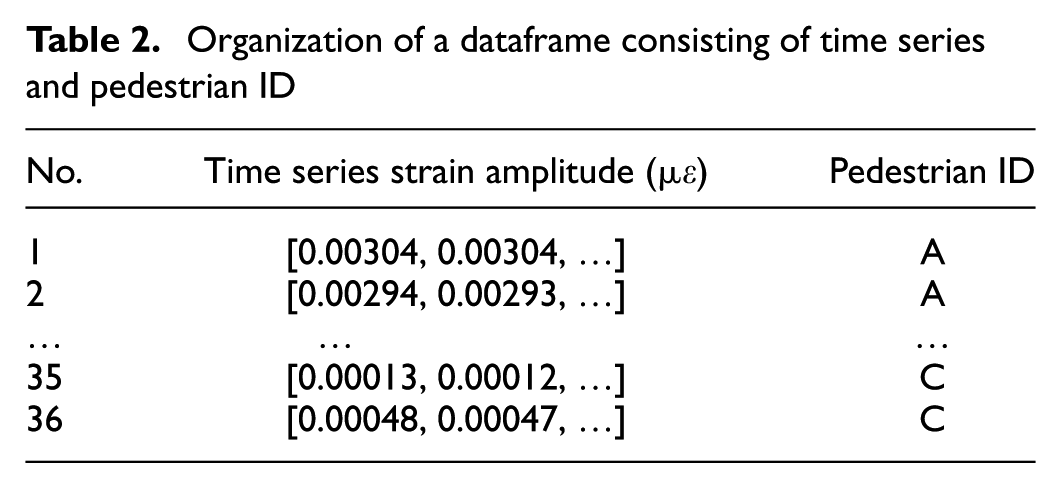
A data set was prepared to classify individual pedestrians from the jump data. This involved creating a dataframe populated with the dynamic and pseudo-static time series. The dataset consisted of 36 time series, derived from three pedestrians (Pedestrians A, B, and C), three jump types (1, 2, and, 5 s), and four differently processed time series (dynamic 5–20 Hz, pseudo-static 0.1–2 Hz, 0.1–3 Hz, and 0.1–4 Hz). Each time series was padded to ensure uniform length across the dataset. This padding process accounted for variability in time series lengths.
The dataset was structured into a pandas dataframe containing columns for the time series data and the corresponding individual pedestrian ID (Table 2). The time series were extracted as NumPy arrays and stored in the Time Series column, and the corresponding pedestrian IDs were included as categorical features. This dataframe was then used to define feature matrixes (X) and target labels (y), with X containing the time series data and y representing the pedestrian identifiers.
Organization of a dataframe consisting of time series and pedestrian ID
To evaluate the performance of different classification models, the data set was split into training and test sets with a 70–30 ratio, a widely used split proportion in machine learning modeling, to ensure a sufficient amount of data for training while reserving enough for testing to assess generalization ( 52 ). This data splitting was conducted using the ‘train_test_split’ function from the sklearn library. The RF and KNN classifiers—implemented with ‘RandomForestClassifier’ and ‘KNeighborClassifier’—were then used to predict the pedestrian ID from the jump time series. The KNN classifier was implemented with three neighbors to account for three pedestrians.
The classification accuracy for the RF and KNN models was evaluated under various preprocessing conditions (Figure 16). Accuracy exceeded 70% for small decimation factors, up to a decimation factor of five, for all cases. As the decimation factor increased, a general downward trend in accuracy was observed, attributed to the filtering effect of decimation, which removes high-frequency components from the data. This leads to a loss of pedestrian-specific features critical for distinguishing individual movements.
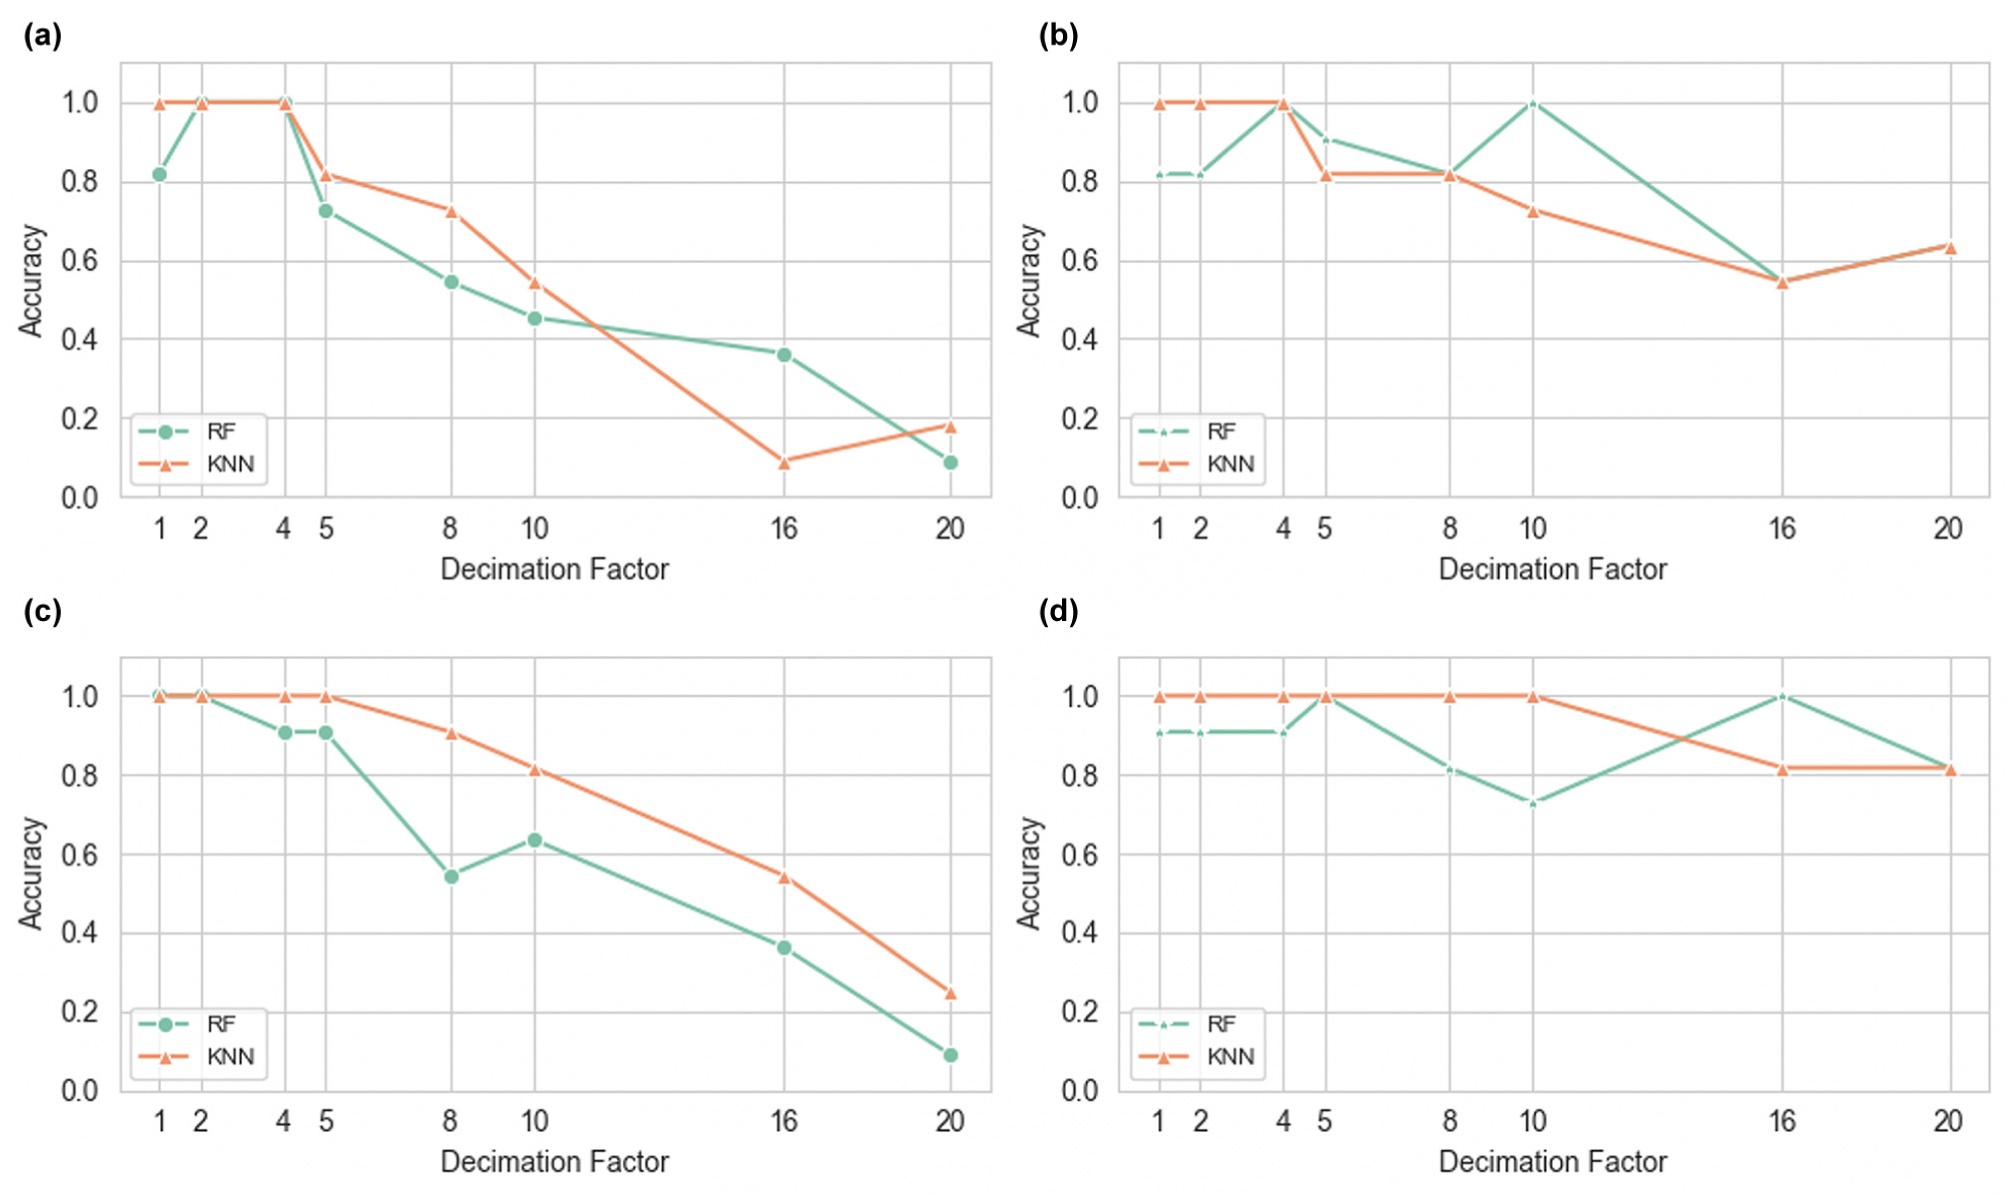
Performance of RF and KNN classifiers under different preprocessing conditions: (a) initial strain removed; (b) initial strain not removed; (c) min-max scaling with initial strain removed; and (d) min-max scaling with initial strain not removed.
The impact of decimation was more pronounced when the initial strain was not removed. In this case, the baseline strain distorted the overall shape of the time series data, masking the dynamic strain caused by pedestrian activities and interfering with feature extraction. Removing the initial strain mitigated this distortion, resulting in more stable and robust performance across decimation factors.
The effect of min-max scaling was modest. Min–max scaling appeared to stabilize the KNN model’s performance, particularly when the initial strain was removed. For example, KNN maintained an accuracy of 1.0 up to a decimation factor of five when the initial strain was not removed, and up to a decimation factor of 10 when it was removed. In addition, the KNN’s accuracy exhibited a smoother, monotonic decrease with increasing decimation, and the RF accuracy was more irregular and jagged. It is worth noting that both the KNN and RF models occasionally achieved perfect accuracy (1.0) under certain preprocessing conditions, likely reflecting the controlled and limited size of the dataset rather than complete generalization.
These preprocessing steps—zeroing out initial strain, applying min-max scaling, and selecting appropriate decimation factors—were found to influence key signal characteristics and the accuracy of pedestrian identification based on subtle variations in jumping styles. The observed differences between the RF and KNN could be attributed to the nature of the algorithms. The KNN might rely more on localized feature distributions, making it more sensitive to consistent preprocessing (such as scaling) and less prone to abrupt accuracy fluctuations. However, the RF involves splitting data into multiple decision trees, which can lead to variability depending on how features are sampled or split at higher decimation factors.
Complementary Site: Pedestrian Observations with Non-Embedded Fiber
To supplement the controlled experiments at the embedded fiber site, data were collected from the Claremont deployment, where fiber optic cables were installed beneath an active residential road, either laid in a trench alongside a water pipeline or directly attached to the pipe. While no controlled experiments were conducted at this site, several opportunistic pedestrian and vehicle events were recorded.
One sequence involved a pedestrian walking in the opposite direction to two vehicles, all on the lane closer to the fiber. Figure 17 shows the resulting waterfall plots from the two fiber configurations. The pedestrian trajectory appeared as a diagonal band with visible individual footstep impacts. However, the two vehicles each appeared as pairs of bright parallel diagonal bands offset in time, corresponding to the front and rear axles. The vehicle trajectories were brighter than the pedestrian signal, consistent with their greater dynamic loading. No major differences in signal intensity or clarity were observed between trench-laid and pipe-attached fibers. Further testing under controlled conditions would be needed to isolate the specific contributions of fiber positioning, trench fill materials, and background noise to signal quality.
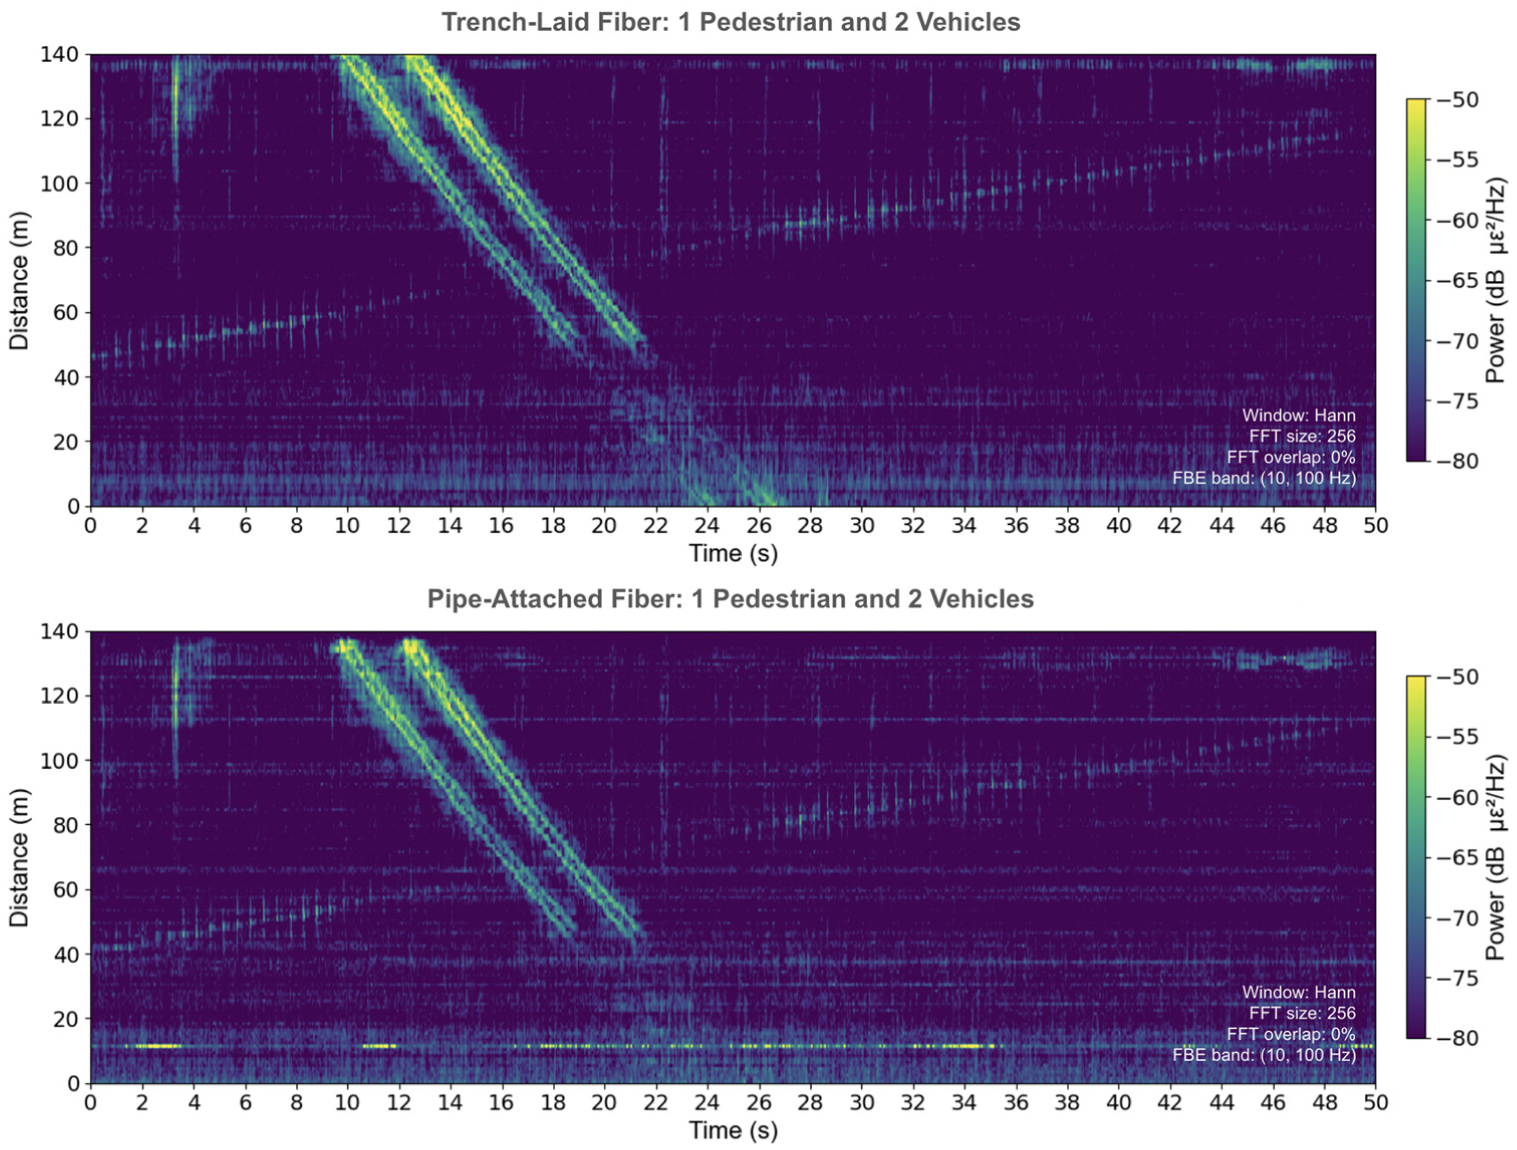
A single pedestrian and two vehicles captured by trench-laid fiber (top) and pipe-attached fiber (bottom).
An approximately 30-m-long segment—between 20 and 50 m—exhibited weakened signal strength in both fiber configurations, partially obscuring the vehicle trajectories. The precise cause of this degradation is unclear, but it may relate to localized soil conditions, changes in compaction, slack in the fiber, or inconsistencies during installation.
In a separate observation, four pedestrians and a vehicle moved in opposite directions on the near lane, followed by a second vehicle on the far lane traveling in the same direction as the pedestrians (Figure 18). The pedestrian signals appeared as a blended pattern without discernible individual trajectories of the four pedestrians. The first vehicle, on the lane closer to the fiber, produced stronger signals than the second vehicle on the farther lane, illustrating how lateral distance weakens signal strength. Of note, the signal from the four pedestrians was not stronger than that from the single pedestrian in the earlier event. While no precise gait or weight measurements were taken, visual observation suggested the lone pedestrian had a more energetic gait. In addition, the group of four walked at a slower and more relaxed pace. This highlights a key challenge in pedestrian monitoring using DAS: signal strength is influenced by the number of pedestrians or their weight and by their movement style and intensity. The variability underscores the complexity of inferring pedestrian characteristics from passive DAS recordings in uncontrolled settings.
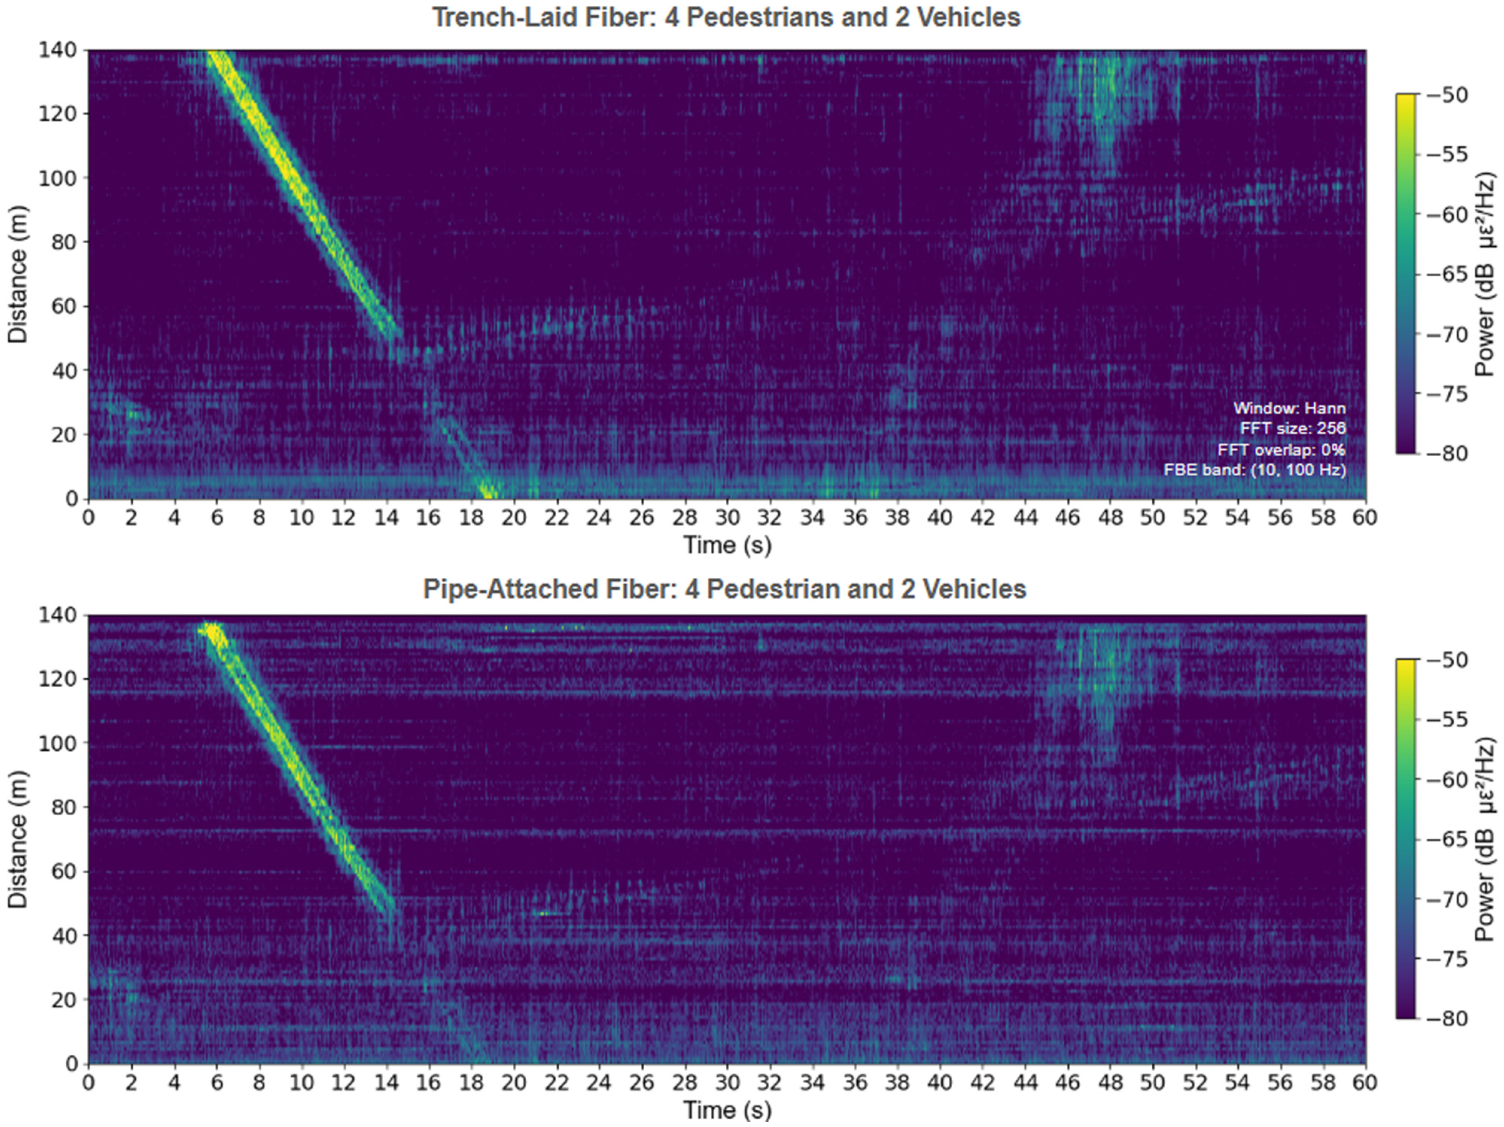
Four pedestrians and two vehicles captured by trench-laid fiber (top) and pipe-attached fiber (bottom).
These opportunistic observations provide evidence that non-embedded fibers can still detect pedestrian activity under favorable conditions—particularly when movement is energetic and occurs near the fiber path. However, detection of lightweight and lower-energy movement is less consistent compared with embedded configurations. This reinforces the importance of carefully considering fiber placement, coupling, and movement intensity when evaluating the feasibility of DAS for pedestrian monitoring with typical telecommunication fibers.
Conclusions
This study examined the capabilities and limitations of DAS for pedestrian monitoring in two settings: an experimental roadway with embedded fiber and a residential road where fiber was laid alongside or attached to a buried water pipeline. At the first site, the embedded fiber enabled high-resolution detection and differentiation of various pedestrian movement types, including walking, jogging, running, and jumping. Pseudo-static and dynamic strain patterns were examined and linked to specific activities. The measurements provided clear spatiotemporal patterns and sufficient signal strength for subsequent classification. At the second site, pedestrian signals remained detectable, but weaker coupling and increased distance between the fiber and road users led to a reduction and greater variability in signal strength.
These findings demonstrate that movement energy, individual gait characteristics, and fiber deployment conditions all play important roles in signal detectability. Future studies are needed to quantify the detection limits under varying distances and movement types and assess how factors, such as soil conditions, fiber slack, trench fill, and coupling, impact signal quality. This study lays the groundwork for adapting DAS to diverse fiber installations and real-world conditions. Expanding future research to include more varied deployments, greater numbers of road users, and higher ambient noise levels will help refine pedestrian monitoring methods and identify effective use cases—ranging from simple user counting on shared-use paths to behavioral tracking in dense urban settings.
Footnotes
Acknowledgements
This research was conducted with the support of the Center for Smart Infrastructure at the University of California, Berkeley. The authors thank M. Jasiak and S. Chiu for collaboration on the Claremont project. The authors also thank V. Yao, R. Bhagra, and N. Mahanti for their involvement and assistance during the experiments.
Author Contributions
The authors confirm contribution to the paper as follows: study conception and design: Saw, Apoji, Wang, Soga; data collection: Saw, Apoji, Wang; analysis and interpretation of results: Saw, Apoji, Wang, Soga; draft manuscript preparation: Saw. All authors reviewed the results and approved the final version of the manuscript.
Declaration of Conflicting Interests
The authors declared no potential conflicts of interest with respect to the research, authorship, and/or publication of this article.
Funding
The authors disclosed receipt of the following financial support for the research, authorship, and/or publication of this article: This research was supported by the Center for Information Technology Research in the Interest of Society Seed Funding at UC Berkeley.