
Abstract
Walking and bicycling are lauded for their negative net carbon impact and for their health benefits. However, national crash statistics suggest that pedestrians are disproportionately harmed in any vehicle–pedestrian conflict situation. Although automated transportation in the future is anticipated to increase overall safety, multiple incidents involving automated vehicles have been reported recently, indicating that the technology needs more training on real-world scenarios and conflicts. This research is motivated by the need for contextual data and related levels of harm in potential conflict scenarios in mixed traffic and we use a national police reported crash dataset, CRSS, to address this need. Our study uses a new gradient boosting algorithm, XGBoost, to identify important features among a host of seemingly significant variables. We compare the performance of XGBoost with the more frequently used random forest method and find that XGBoost is more reliable and robust for handling an unbalanced and sparse dataset like crash data, and the features extracted are more aligned to findings from previous research on the topic. We also compare feature importance between NASS-GES and CRSS—two national crash databases with different sampling strategies but the same objective—and find that sampling strategy influences selection of feature importance. We further use the features extracted using XGBoost in a multiclass logistic regression to quantify the effect of these features on different levels of pedestrian injury. Our findings indicate that speed limit, light conditions, pre-crash movements, and location of pedestrian are important contributors to crash severity, along with driver distraction and impairment.
According to the 2019 Pedestrian Traffic Crash Facts by NHTSA, ( 1 ), in the U.S.A. from 2017 to 2019, while the total number of motorists and non-motorists involved in fatal crashes decreased by 4.22%, the pedestrian fatality rate increased by ∼1%. Furthermore, while the overall fatality rates across all motorist and non-motorist types were between 43% and 44%, pedestrians had a much higher fatality rate of ∼94%. These statistics clearly show how pedestrians are disproportionately affected in crashes with motor vehicles and the increased risk people face in choosing to walk. This scenario is further complicated by the increasingly automated future of transportation which may or may not resemble the transportation system of current times. According to a report prepared for the U.S. National Highway Traffic Safety Administration (NHTSA) in 1999 ( 2 ), more than 90% of crashes were attributable to human error, which should be eliminated substantially as driving automation progresses. As such, most later-year model vehicles are instrumented with advanced driver assistance systems (ADAS) that can help with object and lane marking detection as well as avoid driver distraction. However, time and again reports of self-driving cars being involved in accidents, including fatalities, have cast a reasonable doubt on the preparedness of the technology to protect vulnerable road users like pedestrians and thus delayed the widespread launch of connected and autonomous vehicles (CAVs) in mixed traffic ( 3 ).
While detection technologies like Lidar are improving at a significantly fast pace, it is widely acknowledged that there are scenarios and visibility conditions where these technologies are still not useful (vision obstructed, for example) or perform worse than human vision (rain and darkness, for example). In designing a safe decision system for automated vehicles (AVs) therefore, a training dataset is needed which mimics the real-life scenarios as closely as possible, with as few inputs as possibly needed so that real-time decision making is less difficult. We believe that next to naturalistic driving data, real-life crash data provide the best learning dataset for critical and dangerous scenarios that should be handled with extra caution in AVs in mixed traffic environments. Particularly, in optimizing efficiency and safety, it is important to know the degree of harm that can be caused in a given scenario. Thus, understanding what factors and scenarios mostly lead to different pedestrian injury levels in motor vehicle crashes becomes our primary concern.
Although the national crash databases currently consist of crashes by human driven vehicles, analyzing those records can help us to identify co-occurring external conditions beyond the control of the driver (e.g., roadway characteristics, weather conditions) during a crash. While the crash causation effect of these variables cannot be established in the absence of no-crash vehicles and scenarios in the database, a measure of importance for these variables can be understood from their role in crash injury severity levels. This information can help in better design of ADAS systems as well as in decision algorithms for CAVs to minimize pedestrian harm in conflict situations.
Analyzing pedestrian injury is not new in itself, although it is of constant interest because of the possibility of detecting changes in crash patterns early on. The changing nature of the demographics across space, people’s perceptions and attitudes, along with rapid changes in safety technologies contribute to a variability in findings ( 4 , 5 ). Literature on methodology has also evolved over time to take advantage of greater computing power and growing popularity of machine learning (ML) algorithms. In general, studies have shown that ML models provide better predictive results while statistical causal models provide insight into factors associated with injury severity ( 6 , 7 ). This paper adds to the growing body of literature investigating the non-transferability of results from crash data analysis by comparing results from two different ML algorithms and two datasets with different sampling strategies but the same objective. While differences in results from different ML algorithms are not uncommon, analysis of datasets with the same objective but different sampling strategies has rarely been a focus. This is particularly important in the case of pedestrians or similar other marginally represented populations and shows how different sampling strategies can change the outcome and consequently any planning decision or action taken based on one such instance of the dataset. Further, we also provide a discussion of some inherent features of the two algorithms in question based on the unique characteristics of the crash dataset, sparsity and bias, which should be considered when using an algorithm but is not always the case to the best of our knowledge.
Thus, the objective of this paper is to explore two ideas. First, we want to compare the crash pattern in the National Automotive Sampling System-General Estimates System (NASS-GES) (https://www.nhtsa.gov/national-automotive-sampling-system/nass-general-estimates-system) with the crash pattern in the Crash Report Sampling System (CRSS) (https://www.nhtsa.gov/crash-data-systems/crash-report-sampling-system). NHTSA changed the crash sampling system in 2016 and CRSS was introduced in place of GESS. We compare the most salient features of the pedestrian crashes in the two systems to see if a change in the sampling system changed the distribution of salient features for pedestrian crash scenarios. Second, this paper explores the use of a new popular algorithm called XGBoost ( 8 ) in identifying feature importance and how that compares with more established and widely used methods like random forest. One of the key but often overlooked differences between these two algorithms is the data imputation model and bias handling rules inherent to the algorithm. We provide a discussion of the differences and our motivating factor for choosing one algorithm over another. Finally, the features extracted from XGBoost are used in a multiclass regression model to quantify the effects of these features on different injury severity levels, given a crash has happened.
Literature Review
Pedestrian injury severity is influenced by several factors, including socioeconomic and demographic characteristics, driver and pedestrian physical appearance, weather and climate conditions, roadway conditions, vehicle type, and so forth (4–6, 9–15). Different methodologies were used to study pedestrian injury severity. From an anonymous questionnaire conducted in a sample of 239 suspended drivers in China, the results show that pedestrians and drivers face difficulties in following traffic rules when they are distracted and they become more susceptible to crashes ( 16 ). Another study explored how traffic, environmental, and vehicle factors contributed to pedestrian injury severity at signalized and unsignalized intersections in Florida by using the mixed logit model ( 10 ). The random forest algorithm was used to select important independent random parameters. The result shows high speed, the variable reflecting pedestrians at fault, and dark lighting conditions increase the possibility of more severe injuries and fatalities. Zafri et al. ( 17 ) used a binary logistic regression model and identified large, heavy vehicles and poor light conditions as leading to severe injury and fatalities in a pedestrian-involved crash. The latent class cluster analysis model used in a study also shows that roadways with higher speed limits and heavy vehicles result in more fatalities and severe injuries in pedestrian–vehicle crashes ( 18 ). A study using spatially and temporally weighted ordinal logistic regression revealed that pedestrian–vehicle crashes that occur at intersections are more likely to result in less serious injuries ( 19 ).
Traditionally crash data analysis has been done using causal models, especially using different families of regression. The most commonly used causal models in this field are logistic regressions, often with an ordinal component because of the injury severity scale. However, one of the biggest challenges with crash data is that they are collected after the fact and often involve a subjective view of the police reporting the incident. To accommodate the possible correlation among unobserved factors and within crash population, more complicated causal models have been used in recent years ranging from probit to random parameter logit and probit as well as mixed logit and probit. Alongside this, researchers have also explored the use of ML algorithms like support vector machine (SVM) and random forest for classifying injury severity. It is generally accepted that ML algorithms perform better at prediction but since the model underlying the prediction is not always explicit, they are difficult to use when the end goal is to understand the effect of different variables on injury severity for designing countermeasures or policy recommendations. A more detailed list of methodologies and significant factors in pedestrian–vehicle crashes can be found in Zamani et al. ( 20 ).
While there have been studies comparing the performances of different methods, there has been less effort in understanding the appropriateness of the ML algorithms for the unique characteristics of the crash datasets. We compare the built-in rules of the two algorithms, random forest and XGBoost, to show that XGBoost is more robustly structured to handle an unbalanced dataset with missing information, whatever the final outcome. We also analyze the difference in context variables selected between NASS-GES and CRSS; although both datasets are obtained using probabilistic sampling of national police reported crash data, CRSS intentionally oversamples pedestrian crashes to address pedestrian safety analysis. Our purpose is to illustrate that a fixed sampling strategy may not be in the best interests of representative coverage given the difference in variables deemed important for injury severity classification from the two different datasets. To our knowledge, there have not been any studies documenting this difference in crash injury severity classification.
Methodology
Data Preprocessing
We primarily used the CRSS data from 2017 to 2019, which is public domain data made available by NHTSA, for the study. CRSS consists of different data files obtained through police crash reports containing vehicle information, information on drivers and others involved in the crash, external conditions such as weather, light conditions, road type, and so forth. Each record in CRSS is selected based on a multistage selection process to build a nationally representative probability sample. Also, every crash in CRSS must have one motor vehicle involved and must have caused property damage, injury, or death. NASS-GES, the predecessor of CRSS, shares the same characteristics as CRSS but with a different weighting scheme for the probability sampling part. We used NASS-GES to compare feature importance between NASS-GES and CRSS.
For both NASS-GES and CRSS, to construct our desired dataset, we first selected data variables that we deemed interesting to investigate. Both these datasets may have multiple records for one crash, depending on the number of persons and vehicles involved. This posed the problem of over-representing some features that are common if all records are kept. Therefore, after combining different files, we made a subset of pedestrian records and only left the first pedestrian record for each case to avoid replicating information. Similarly, we only used the first vehicle record for each case. Lastly, we eliminated variables containing high percentages of missing values and correlated variables based on the Goodman Kruskal test of association ( 18 ). The final set of variables that we used in model fitting is presented in Table 1.
Description of Variables
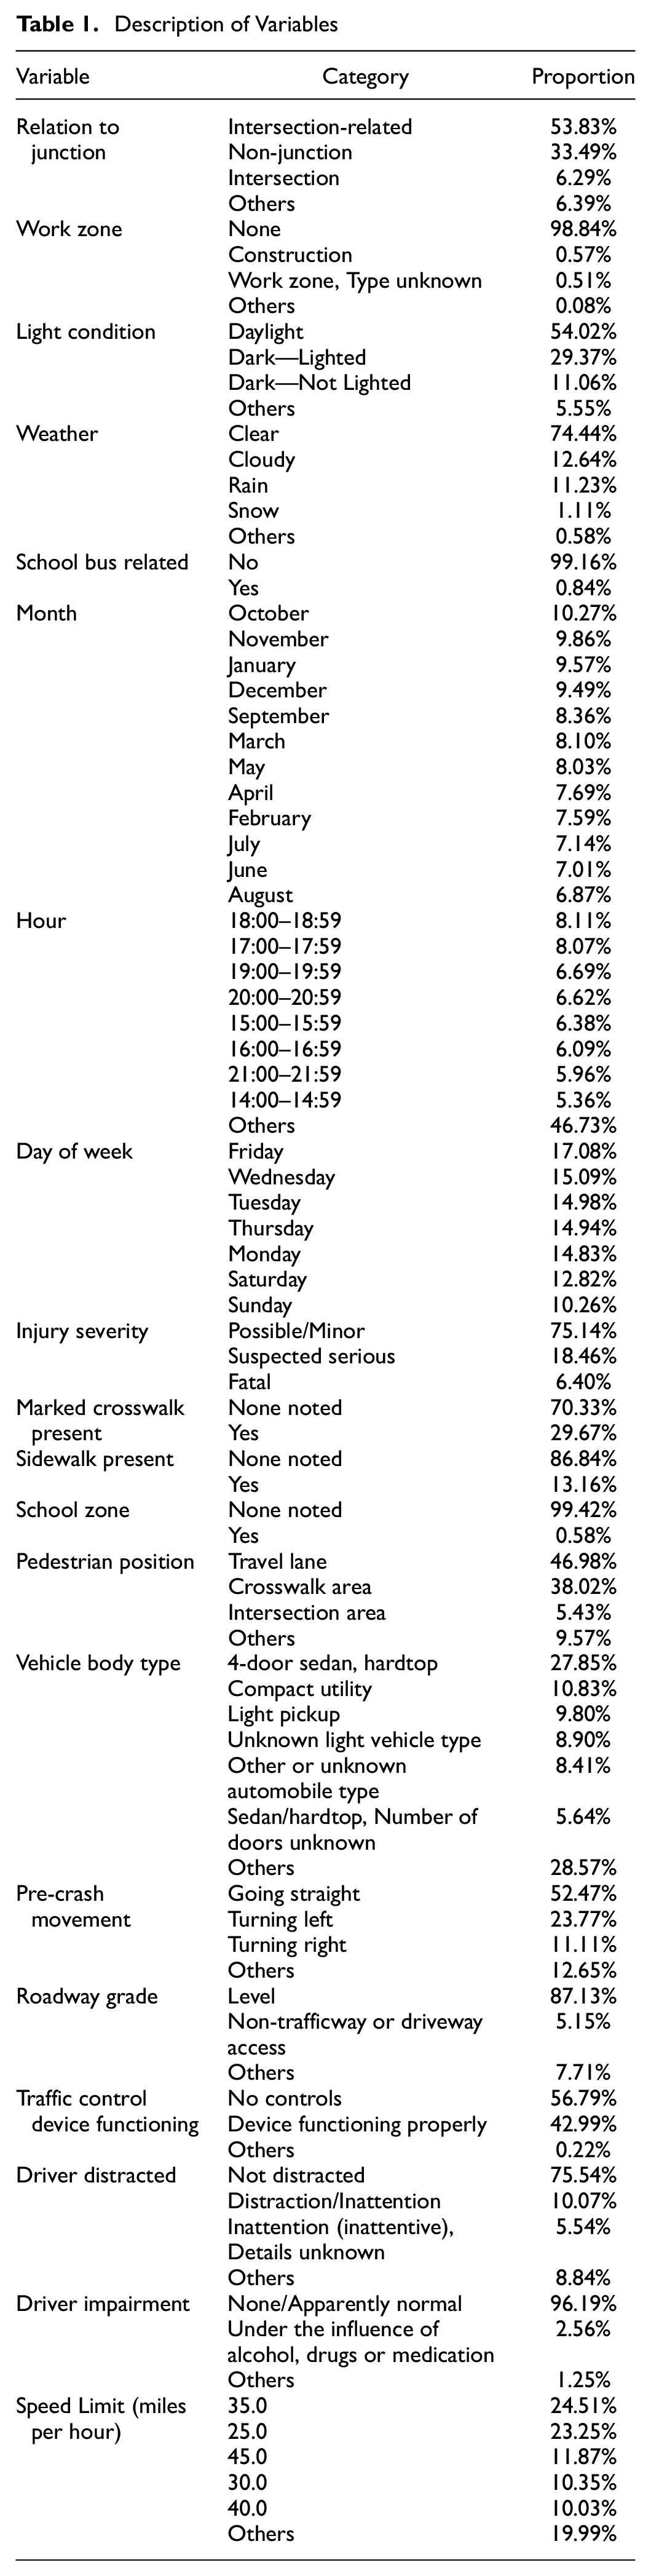
One thing worth mentioning is that we kept the “Driver Distracted” variable in our dataset even though its missing value percentage is 40.94%. It is reasonable that it should contain a high percentage of missing values. Typically, drivers should report to the police if they were distracted while driving before the crash, and there are various reasons, such as legal or reputation concerns, for them not to provide this information. However, we still included this variable. A distracted driver is a critical factor in the cause of a crash. Furthermore, we also kept the “Driver Impairment” and “Speed Limit” variables, which have missing value percentages of 33.5% and 30.2%, respectively. However, both variables are of great importance to our understanding of crash reasons, and they are deemed common reasons for vehicle crashes.
The statistical learning models we used later, XGBoost and logistics regression, do not directly deal with nominal categorical variables. Therefore, we used One-Hot encoding methods to encode categorical nominal variables ( 21 ). XGBoost can deal with missing entries by default. According to the XGBoost documentation, the algorithm will learn and assign missing values’ branch directions for the classification problem. However, because logistics regression cannot use a dataset containing missing values, we imputed datasets before causal modeling. Specifically, for the “Driver Distracted” variable, we made “missing entry” another category. For the rest of the independent variables, we imputed them with mode. Since imputation methods are built into XGBoost and random forest, it is beyond the scope of this paper to uncouple them and test the effects of different imputation methods on the result of any one algorithm. However, we present a discussion of the different in-built imputation strategies and how that can affect the feature selection in addition to the algorithmic differences. We also did sensitivity analysis for results of multiclass logistic regression with different imputations: mean, mode, and regression to mean, as well as with the dataset without any imputation. The results of all the different imputations are very similar and at the same time also significantly different from a dataset without imputation, which led us to conclude on the current analysis strategy: (i) choosing the algorithm with the most logical method of imputation and most robust method for handling biases in the dataset, and (ii) manual imputation of dataset before running multiclass logistic regression.
Lastly, the original dataset separated injury severity levels into eight categories: No Apparent Injury, Possible Injury, Suspected Minor Injury, Suspected Serious Injury, Fatal Injury, Injured, Severity Unknown, Died Prior Crash, Unknown/Not Reported. Among these categories, we eliminated entries classified as Injured, Severity Unknown, No Apparent Injury, Died Prior Crash, and Unknown/Not Reported. These categories contain few entries or even no data points, so they are not informative and can easily be seen as noise by the models. Meanwhile, they cannot combine with any other class of injury severity level. For the rest of the categories, we combined Possible Injury and Suspected Minor Injury into one as “Possible/Minor Injury” because they indicate a similar level of injury severity. To conclude, we have as our severity classes: Possible/Minor Injury, Suspected Serious Injury, and Fatal Injury. They contain 5,785, 1,421, and 493 records, respectively.
Feature Selection: XGBoost Versus Random Forest
ML algorithms have shown great potential in predictive analysis and understanding the relationships between the dependent and independent variables. For crash data analysis, supervised learning algorithms are a popular choice because of their high accuracy in correctly classifying the injury severity level related to a crash ( 7 ). Supervised learning in this field uses historical crash injury data to train the classification algorithms in finding patterns and associations between injury severity levels and contextual variables for predicting the injury severity of future crashes. SVM, K nearest neighbor and decision tree-based methods like random forest have been applied to crash injury analysis and their performance have been compared against traditional statistical models. ML models tend to perform at par or better than the statistical models in prediction. We introduce a new ML model, XGBoost, in this paper and compare its performance with another method, random forest, in selecting contextual variables.
Random Forest
Random forest is a bagging method of decision trees ( 22 ). It randomly samples observations and features within the training dataset to build multiple uncorrelated decision trees. Thus, each tree is built on a bootstrap sample of the data and a subset of features. Predictions are made based on majority votes or mode for categorical or classification problems and as an average of the results from all trees for continuous or regression problems. Random forest has two major drawbacks that make it unsuitable for crash injury data. First, it performs poorly when faced with sparse datasets—internal imputation technique within the random forest algorithm leads to significant loss of prediction accuracy when there are many missing values in the dataset. Second, if the dataset is unbalanced or if participation in one of the classes dominates the dataset, random forest will favor that class and will tend to predict classification in that category significantly better than the other less populated classes.
XGBoost Algorithm
The XGBoost algorithm, short for extreme gradient boosting algorithm, is a tree-based model that also takes advantage of gradient boosting to improve prediction and computational efficiency. Compared with other similar tree algorithms, it has algorithm enhancement including in-built regularization to avoid overfitting and system-level optimization such as parallelization and distributed computing. Overall, it has been highly praised by the data science community and it is the winning model for several competitions within the Kaggle datascience community (https://www.kaggle.com/competitions). Like the other tree-based models, XGBoost fits trees to different subsample and feature subset combinations but then goes back to the residuals to learn from the errors. It then iteratively makes new predictions by starting with the initial prediction and adding the output of the tree scaled by a learning rate. To minimize the chance of overfitting, XGBoost adds a regularization parameter that is intended to reduce the prediction’s sensitivity to individual observations, and it uses a unique regression tree instead of regular, off-the-shelf regression trees. In addition to algorithm improvement, XGBoost is optimized for computation time, which makes it perfect for large datasets and real-time predictions.
We fitted the same data to the random forest algorithms. A comparison of the top 20 relevant features selected by random forest and XGBoost is shown in Table 2. Only six features are selected in both algorithms: Speed Limit, Pre-Crash Movement: Going Straight, Daylight, Dark-Not-Lighted, Dark-Lighted and Pedestrian Position: Travel Lanes. As we can see, XGBoost gives a more reasonable result. Some important features, such as alcohol involvement and pre-crash movement of the vehicle, rank lower than certain days of the week (Wednesday and Tuesday). Therefore, for the rest of the analysis, we used features selected by XGBoost to compare NASS-GES and CRSS as well as for multiclass regression.
Feature Importance in Random Forest and XGBoost
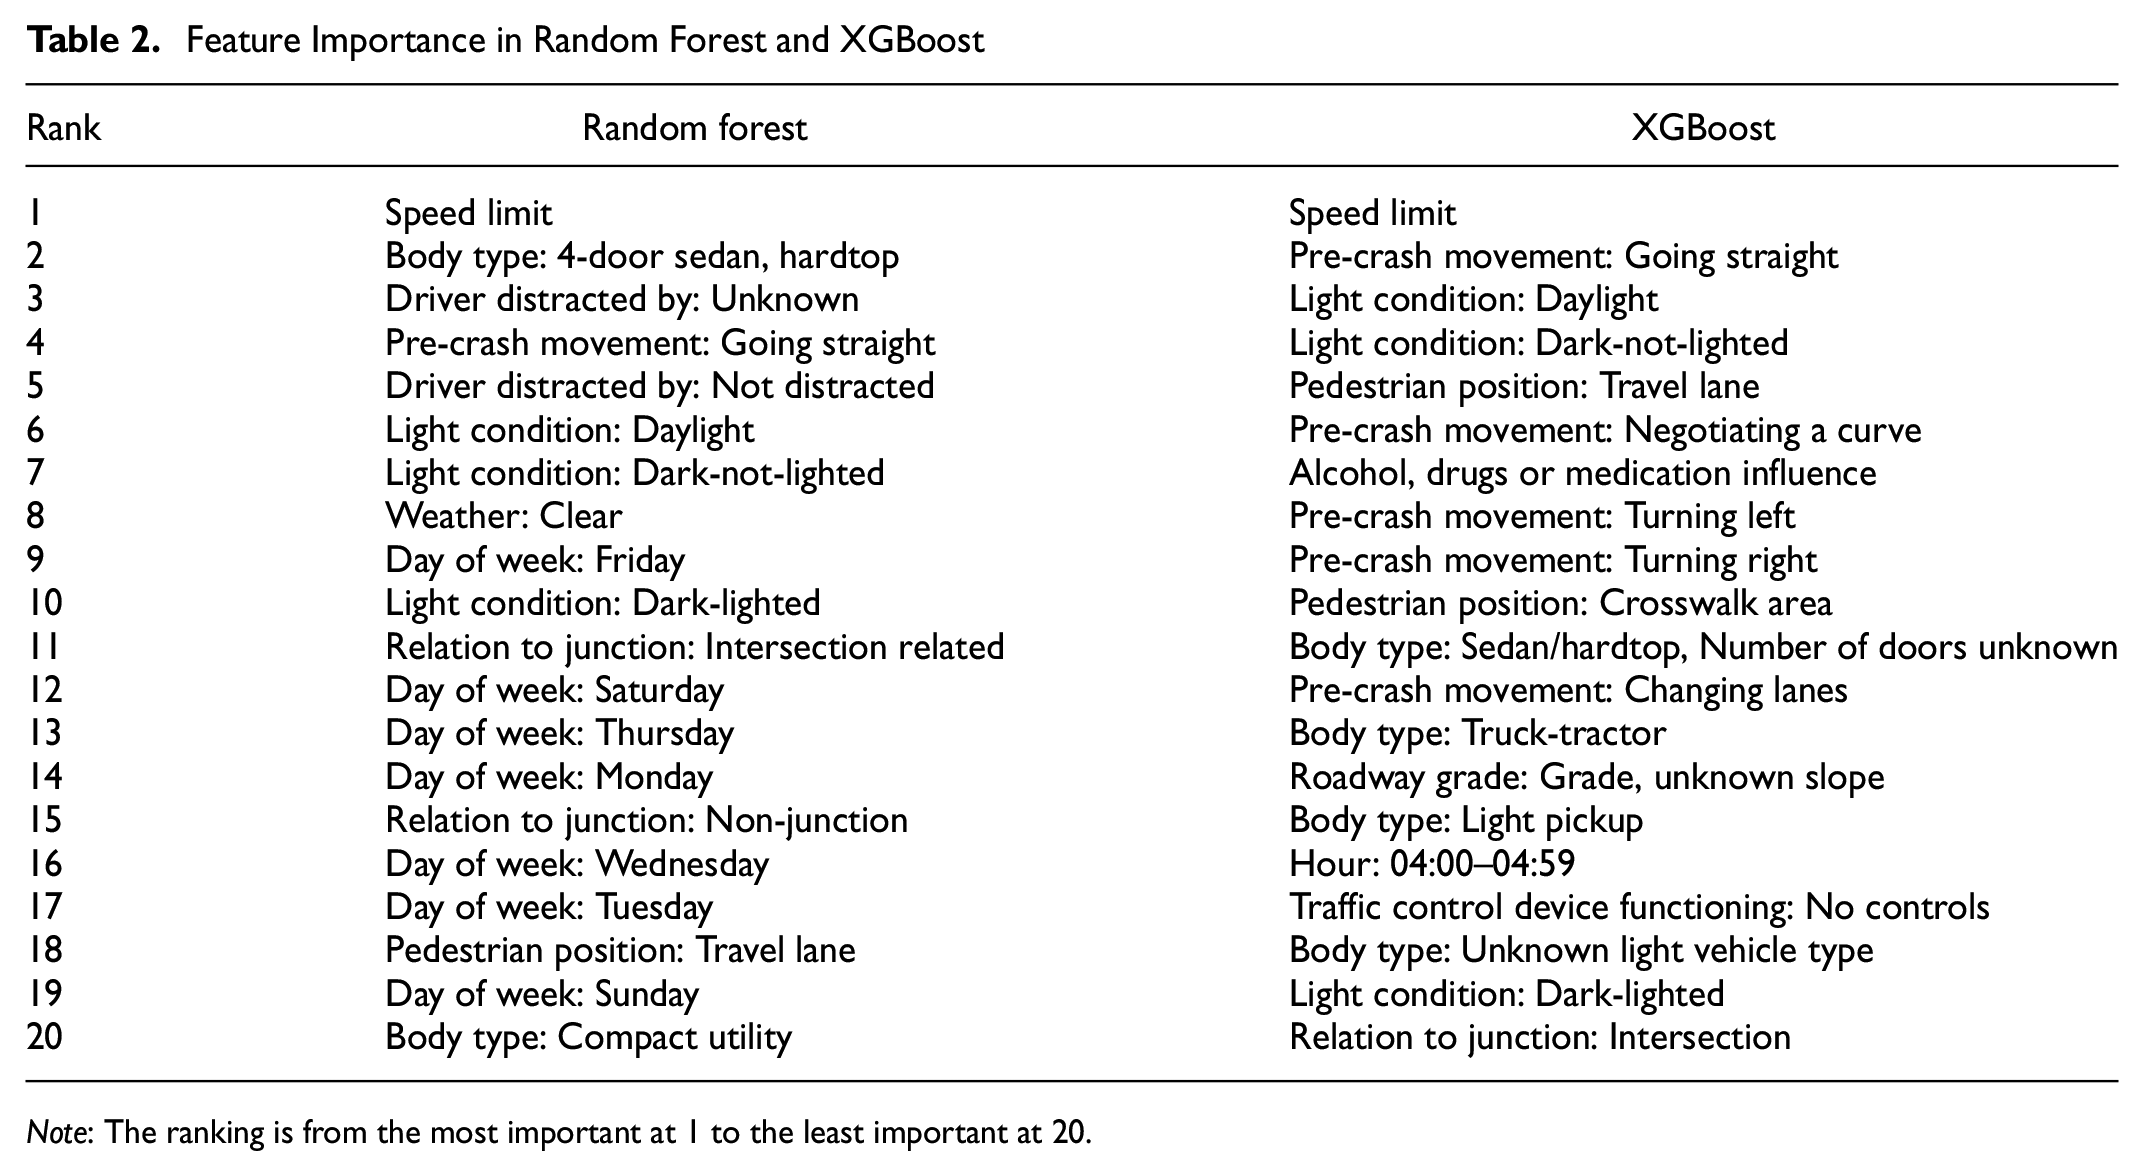
Note: The ranking is from the most important at 1 to the least important at 20.
Comparison Between NASS-GES and CRSS: Selected Features
Table 3 shows the different features selected by XGBoost for NASS-GES and CRSS. It is interesting to note that speed limit, pre-crash movements of going straight and turning left, light conditions, and some other variables are selected in both the datasets while some variables like time of crash and vehicle body type show differences. Given the consistencies in the features selected, speed limit, light conditions, certain pre-crash movements, and pedestrian locations appear to be particularly strongly associated with pedestrian crashes.
Features Selected by XGBoost in NASS-GES and CRSS Datasets
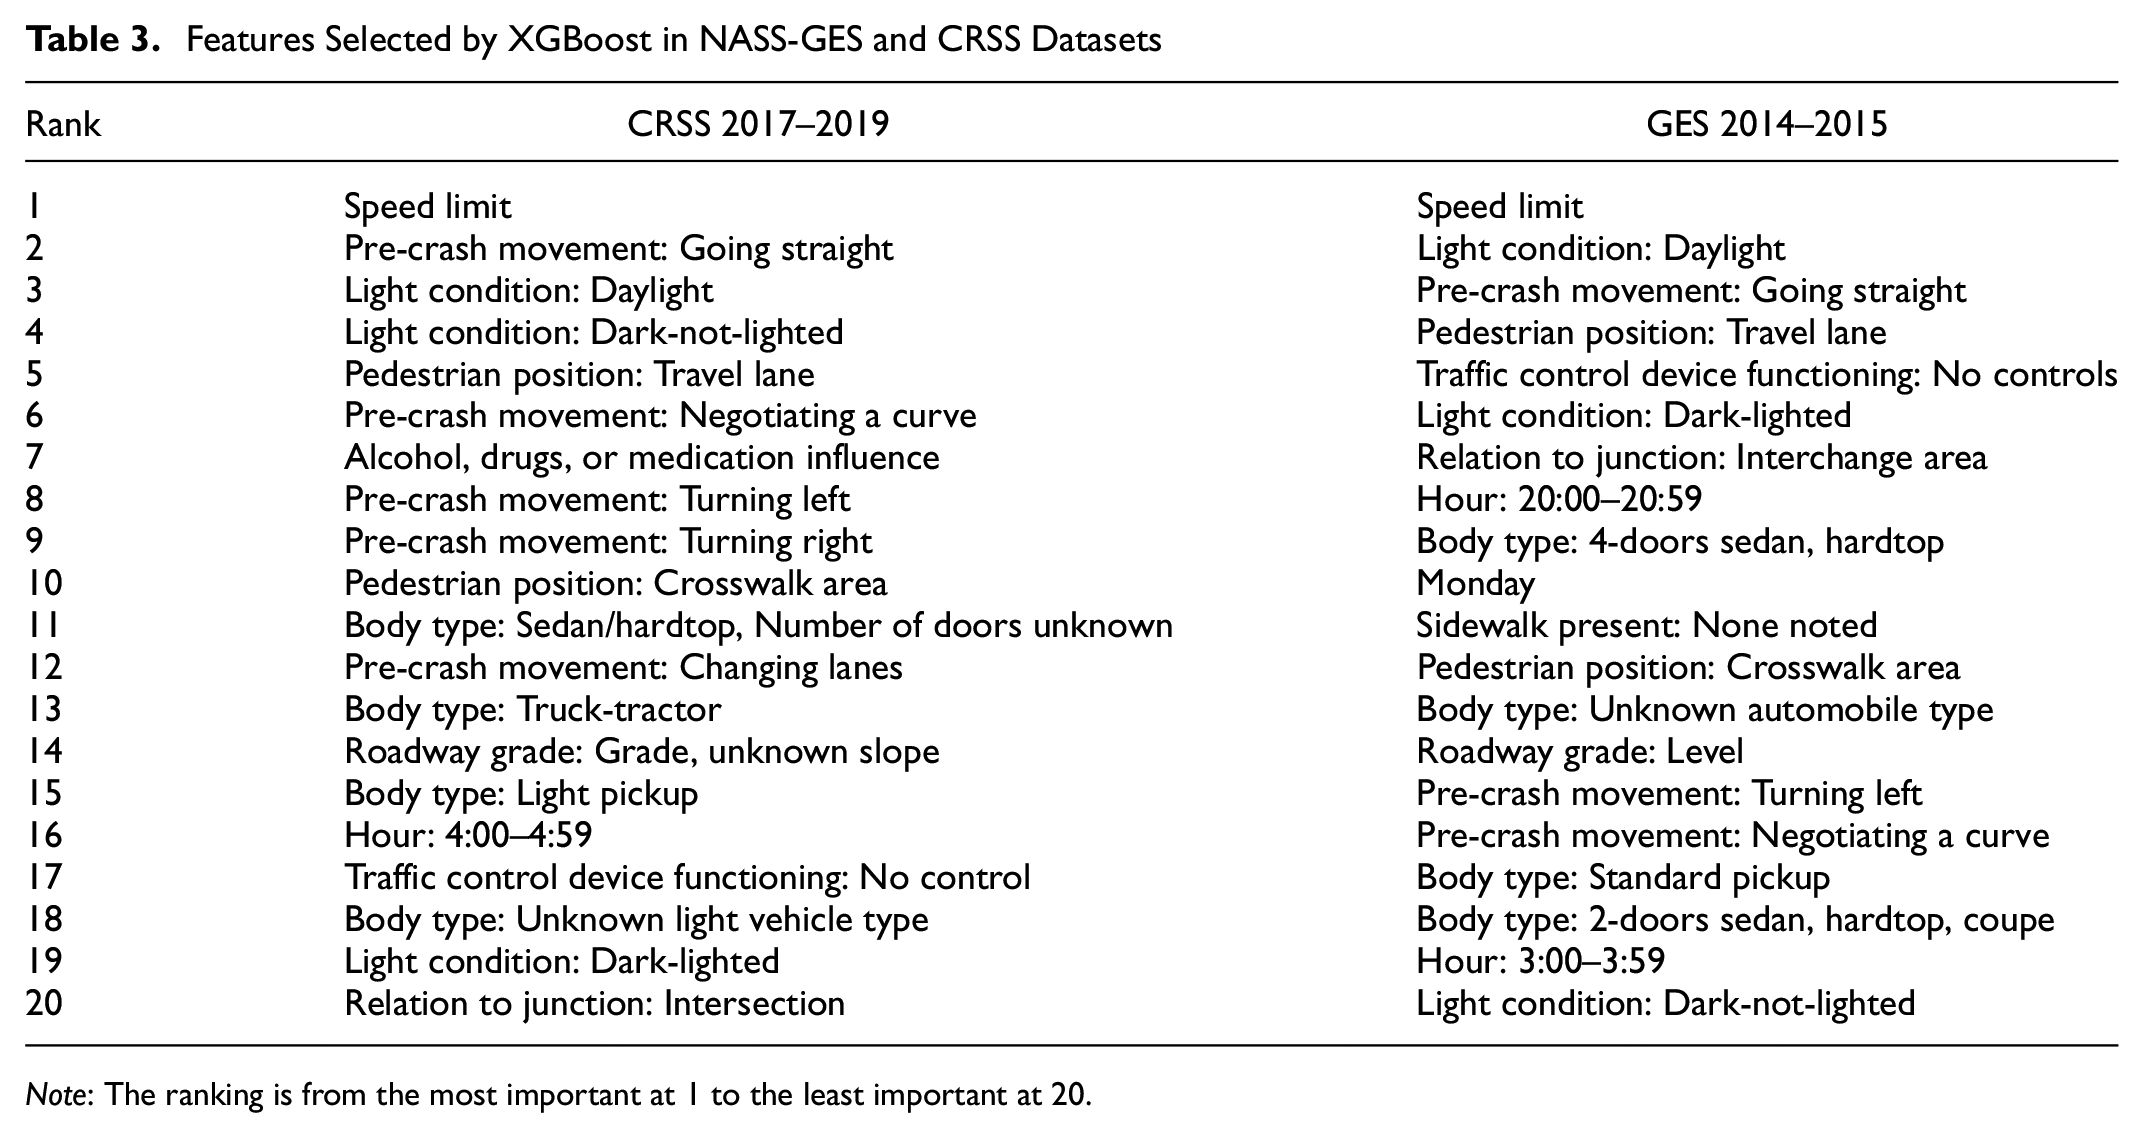
Note: The ranking is from the most important at 1 to the least important at 20.
Multiclass Logistics Regression
For this specific study and dataset, we exploited two major advantages of XGBoost when faced with CRSS datasets: regularization and interactive feature analysis. After fitting the model, we used an in-built feature importance function with metric “total gain” to understand important factors that caused different injury levels. It sums up the contribution of the corresponding features across all the trees during classification. However, one disadvantage of the XGBoost algorithm is that it is difficult to interpret directly how each variable contributes to the final results. Therefore, we subset the top 20 important features to form a new dataset and use that dataset to fit in a multiclass logistics regression.
To understand how each variable contributes to the final result, we selected the top 20 important features from the XGBoost model. What is more, we added interaction terms to understand interaction effects between speed limit and drivers’ actions before crashes and between speed limit and light condition. Since we faced a multi-classification problem, we applied the one-versus-rest strategy to split a multiclass classification into one binary classification problem per class.
During binary classification, the response variable

By algebra, we can find the above equation becomes Equation 2:
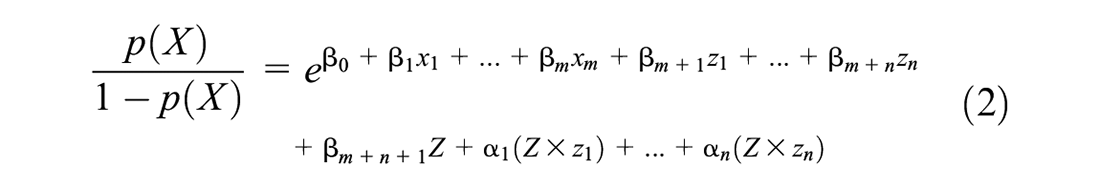
Equation 2 describes the odds; when predictor
Results
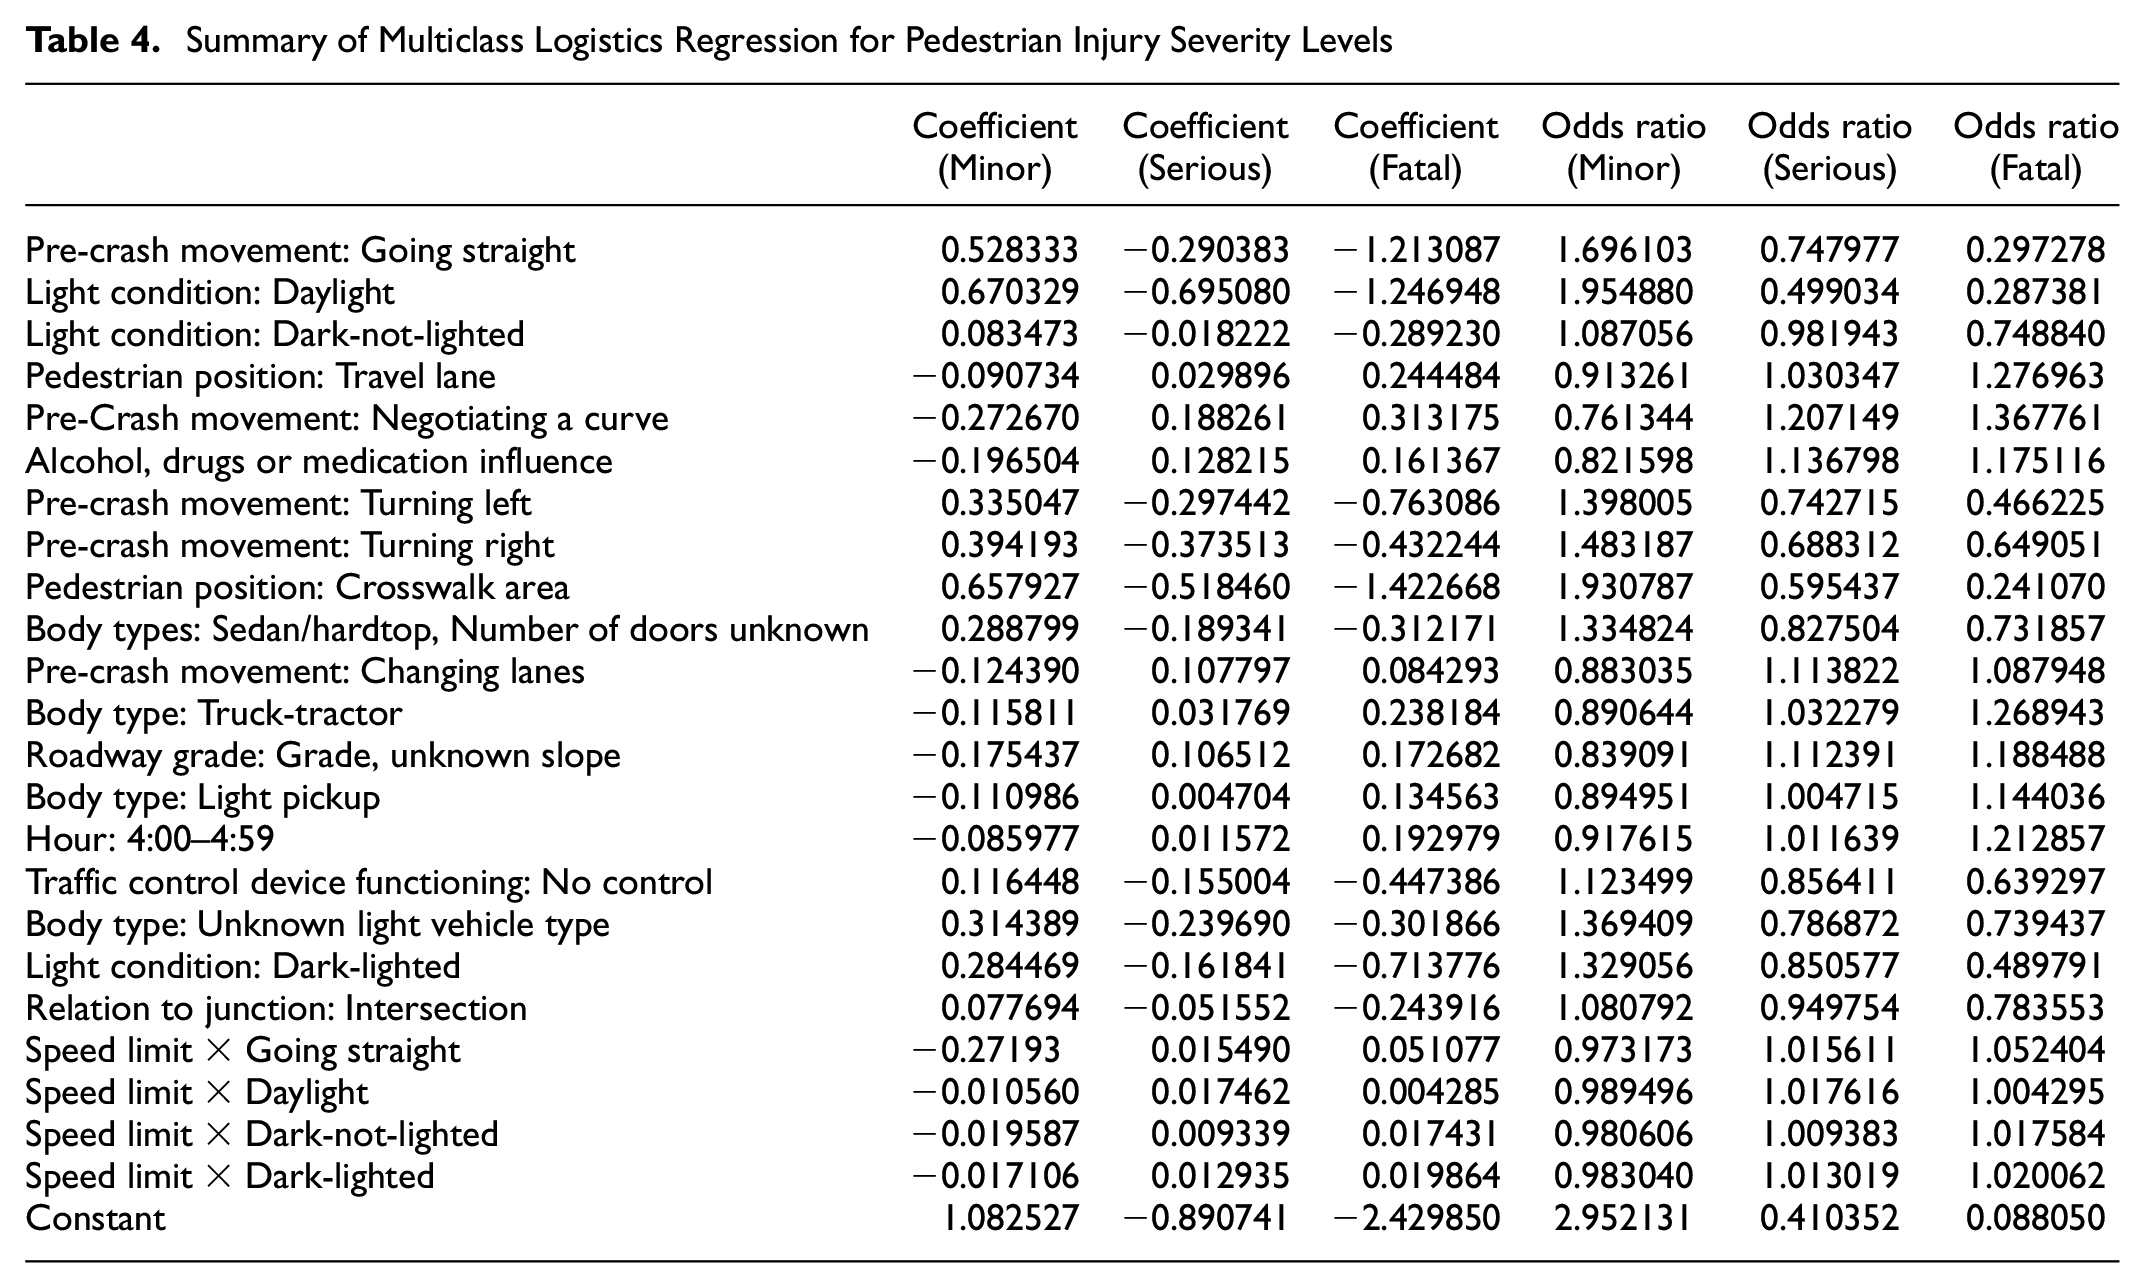
After we fitted XGBoost, the top 20 important variables ranked by total gain are presented in Figure 1. A summary of the models and the odds ratios of each variable in the logistics regression are presented in Table 4.
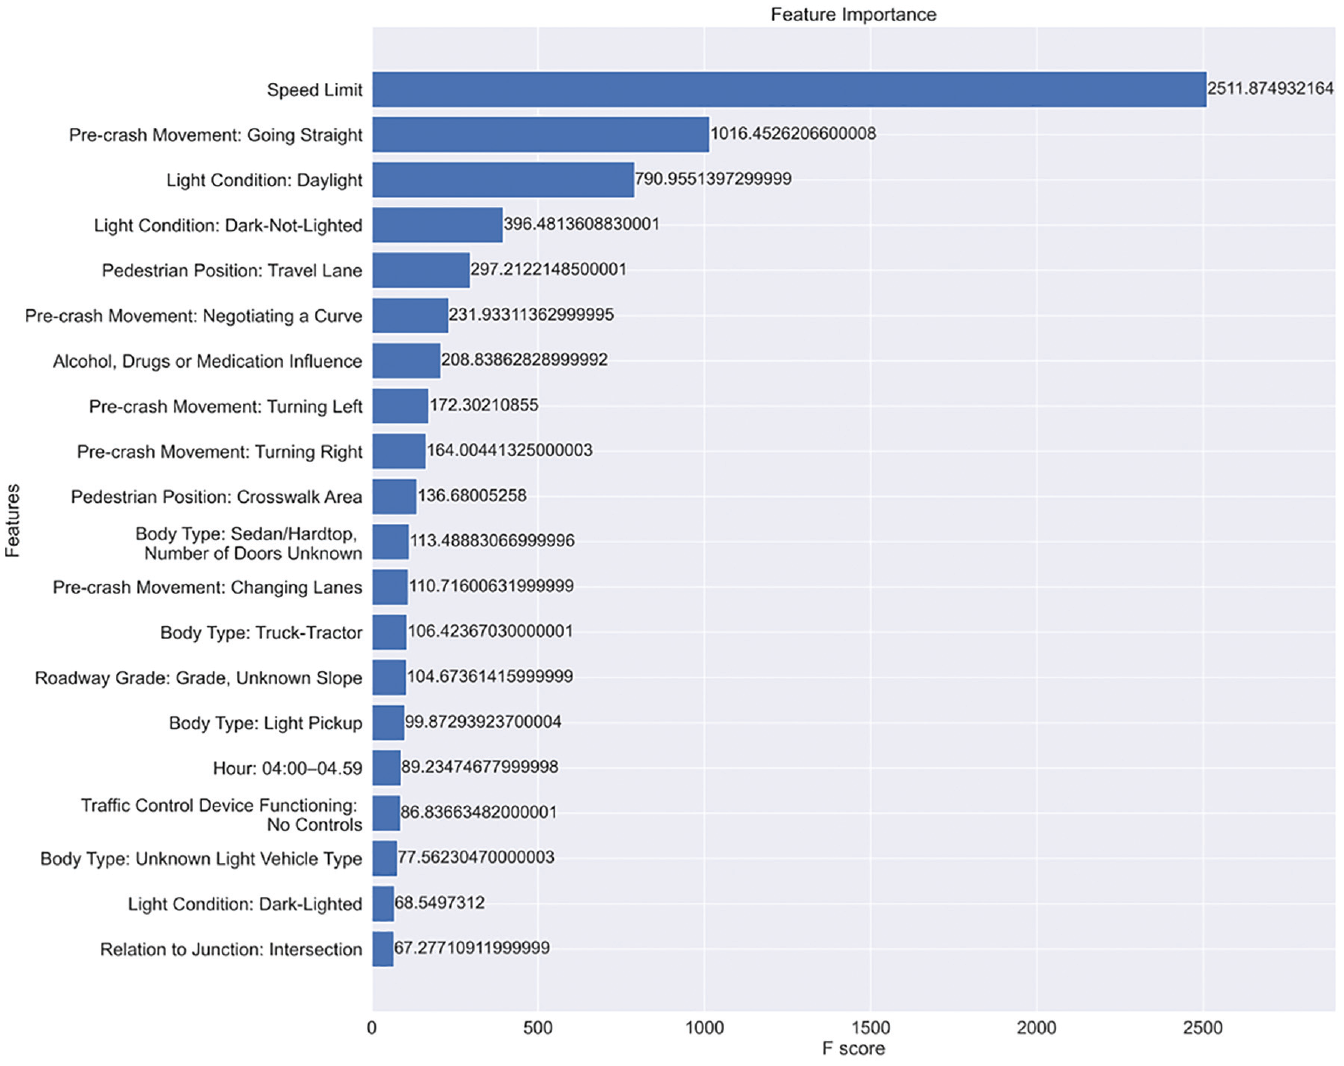
Feature importance of variables in XGBoost based on total gain.
Summary of Multiclass Logistics Regression for Pedestrian Injury Severity Levels
Overall, the XGBoost model accuracy achieved 76% with a standard deviation of 0.004 in five-fold cross-validation. We can see that the ranking of variable importance and each variable’s odds fit our expectations.
Speed Limit is the most critical variable in our XGBoost classification model. There is another variable in the dataset describing traveling speed at the time of the crash. We did not choose that variable because traveling speed is generally reported by the drivers and therefore is unreliable. As a result, we use the Speed Limit variable as an indicator of vehicle speed.
To understand the interaction between the phenomena of speed limit and light condition and pre-crash movement of going straight ahead, we first refer Table 5 for how the coefficient of speed limit changes when the binary variable is equal to 1 while controlling for other variables.
Coefficient of Speed Limit When the Binary Interaction Variable (Daylight, Dark-Lighted, Dark-Not-Lighted, Going Straight) Is Equal to One and Controlling for Other Variables and Intercept Being Zero
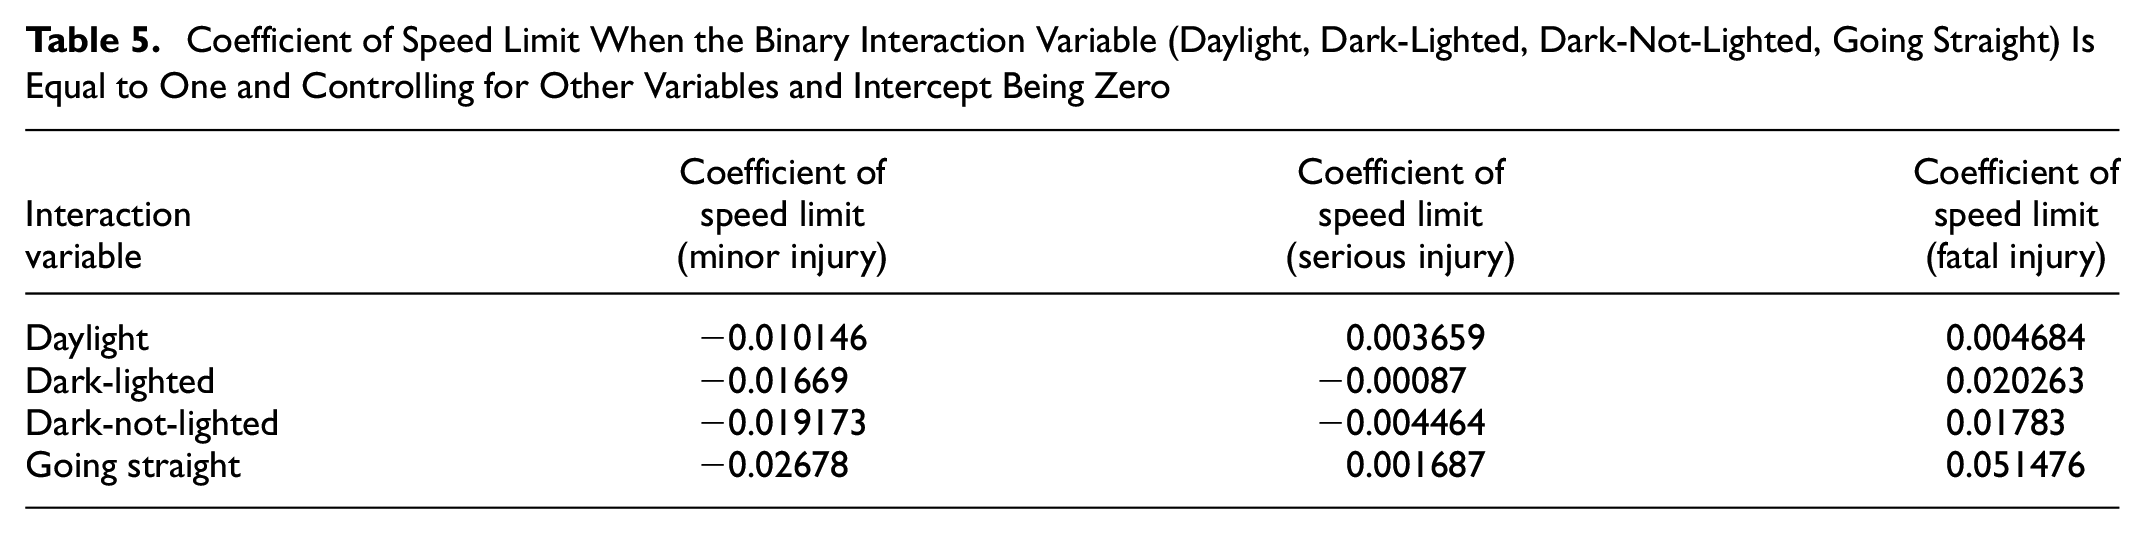
As we can see, when the speed limit increases, the possibility of suffering only a minor injury decreases in all situations. If the vehicle is going straight right before the crash, a higher speed limit will increase the possibility of a serious or fatal injury. It is the same for daylight variables. On the contrary, when the light condition is dark, an increase in speed limit will lead to less possibility of suffering minor or serious injuries but a much higher chance of fatal injury. This result shows a high risk for pedestrians in the evening hours, when both drivers and pedestrians have poor vision and there are more drunk and fatigued drivers on the road.
The second variable that stands out is the Pre-Event Movement (Prior to Recognition of Critical Events). In addition to going straight, based on Table 4, these pre-crash vehicle activities are essential: turning left, turning right, negotiating a curve, and changing lanes. From Table 4, we can see that when drivers are turning right/left or changing lanes, a pedestrian’s injury level is more likely to be minor in the event of a crash. Meanwhile, when drivers are negotiating a curve, a pedestrian’s injury level is more likely to be severe or even fatal in the crash. This is a reasonable result as, when they perform the former activities, drivers tend to slow down. However, when they negotiate a curve, drivers tend to remain at high speed. It is harder to control the vehicle when the driver recognizes upcoming critical events, and therefore these pre-event movements are more likely to cause serious pedestrian injury.
Then, we have variables describing the crash location’s relation to a junction, pedestrian positions, and presence of traffic control devices at the time of the crash. We can see that when pedestrians are in the crosswalk areas or intersection areas, they are less likely to suffer a severe or fatal injury in a crash even when there is no traffic control device. This is reasonable because drivers are typically required to slow down at intersections or near pedestrian crosswalks, and they tend to pay more attention in these areas. On the other hand, it is more likely that severe or even fatal injury will occur when the pedestrians are on the travel lanes, where the speeds are normally high, and drivers do not expect to see pedestrians on the road. The vehicle body type also appears in the importance ranking in Table 4. There are clear differences in odds ratios between light vehicles and heavy vehicles. Both truck-tractors and light pickups are kinds of vehicle that are harder to control, whose body size and high ground clearance can make it harder for drivers to see nearby pedestrians. Therefore, when a crash involves these types of vehicles, pedestrians are more likely to suffer severe or fatal injury. On the contrary, light vehicles and sedans are more likely to cause only minor injury.
Lastly, serious pedestrian crashes tend to happen on roadways with a grade. Drivers with impairments will cause more severe pedestrian injury. Late at night, when the drivers lack focus, crashes are more likely to lead to severe and fatal injury. Overall, we can summarize the factors that will bring pedestrians greater risk: late night with a poor light condition, roads with a high speed limit but accessible to pedestrians, straight roads with no crosswalk area or stop signs, roads with a grade, oversized and heavy vehicles, and drivers under impairment.
Conclusion
This research looks at the implications of using different learning and imputation methods on feature selection and classification of pedestrian crash injury severity. We used new ML algorithms to prevent overfitting the data which translated into different sets of contextual variables than those selected by traditional ML models. We also tested different imputation methods in classifying injury severity and found that for some variables there is significant difference between models with imputed data and models estimated on the subset of original data by removing observations with missing values on any context variables. This finding implies that using any artificial neural network or ML algorithm should be applied to crash data with caution—all of these methods internally impute missing values using some learning algorithm which will tend to favor dominant levels within context variables. We also noted that some tree-based methods may favor dominant class in prediction in unbalanced datasets like crash data. We also found that sampling strategy can make a difference in what features are selected as important by algorithms, which is an important lesson for research on small sample groups like pedestrians and indicates that analysis using data from one sampling may give significantly different results compared with data from another sampling strategy.
On the causal model, our research largely corroborates findings from previous research in that light conditions and speed limits are important contributing factors in pedestrian injury. Therefore, reduced speed or changed road layouts may be useful interventions in making roads safer for pedestrians. One policy question that might need further attention would be providing separate infrastructure for vulnerable road users. Our research found that pedestrians sharing the travel lane with vehicles are more likely to face severe injuries, so complementary approaches of separating pedestrians as well as educating pedestrians on safe crossing behaviors may help in reducing pedestrian fatalities. This research also found that visibility remained a critical safety issue that might also need to be addressed via connectivity and shared information. However, in providing technology-based solutions for connectivity, it is important to be aware of equity issues as not everyone will be able to afford cutting-edge technology and neither would all roadways be equipped with information broadcasting and sensing equipment in a short period of time. Future research should focus on understanding the benefits of multi-way connectivity and communication on the overall safety of vulnerable road users.
Footnotes
Author Contributions
The authors confirm contribution to the paper as follows: study conception and design: A. Misra, Z. Wu, S. Bao; data collection: Z. Wu; analysis and interpretation of results: Z. Wu, A. Misra; draft manuscript preparation: Z. Wu, A. Misra, S. Bao. All authors reviewed the results and approved the final version of the manuscript.
Declaration of Conflicting Interests
The author(s) declared no potential conflicts of interest with respect to the research, authorship, and/or publication of this article.
Funding
The author(s) received no financial support for the research, authorship, and/or publication of this article.
Data Accessibility Statement
The data used in this research is publicly available through NHTSA websites as cited in the paper.