
Abstract
Shared micromobility services, such as electric scooters and electric bikes, have the potential to address first- and last-mile challenges of transit networks, and planners need to understand the factors driving the demand for these services. This study addresses that need through exploratory and regression analysis. First, we examined various catchment area sizes around transit stations to identify integrated trips. Subsequently, we conducted descriptive analysis and k-means clustering to investigate the spatiotemporal pattern of first- and last-mile trips. In the final phase, we developed regression models to identify factors influencing demand for these trips, using datasets collected from Calgary, Canada. The analysis revealed that during weekday morning hours, first-mile trips outnumbered last-mile trips, while this trend reversed during the afternoon hours. On average, the integration ratio was about 20.6% for first-mile trips and 21.9% for last-mile trips. The cluster analysis uncovered temporal and spatial variations: central urban areas experience peak last-mile trips during morning hours, while residential zones show higher rates of first-mile trips. The regression results highlighted the factors influencing first- and last-mile demand, unveiling temporal patterns. For instance, private dwelling density was associated with higher first-mile demand in the morning and last-mile demand in the afternoon. Additionally, points of interest (POI) positively correlated with first-mile demand in the evening and last-mile demand in the morning. Bike infrastructures and path connectors were also strong positive predictors across time periods. The results offer insights into multimodal transport planning, emphasizing the importance of considering demand variation and optimizing operations to support vehicle rebalancing.
Keywords
Recently, there has been a global revolution of shared micromobility, such as electric scooters (e-scooters) and electric bikes (e-bikes), which has substantially affected how people travel in cities. For example, shared micromobility has surged in North America (USA and Canada), with 130 million trips taken in 2022—a 40% increase since 2018 and a 35-fold rise since 2010 ( 1 ). By 2023, shared micromobility services have extended to 452 cities worldwide, enabling over 87,000 trips daily, demonstrating their widespread adoption ( 2 ). In many cities, these services have also emerged as green alternatives to auto trips ( 3 ) and as solutions for first- and last-mile transportation challenges ( 4 ). This rapid growth has emphasized the need for policymakers to understand the coopetition between micromobility and transit, as also noted in a recent review study ( 5 ).
The coopetition between the two modes has become a focal point in recent research, examining both supplementary and competitive relationships between the two modes. For instance, scooters often serve as a last-mile ( 6 ), or as both first- and last-mile solutions ( 4 , 7 – 10 ). Some studies highlight the roles of scooters as both feeder modes and their competitive interactions with public transit ( 11 , 12 ), while others note their complementary and competitive aspects ( 13 ). Similarly, research on bike-sharing systems primarily emphasizes their supplementary role in transit networks ( 9 , 14 – 20 ), though some studies also explore their competitive relationship ( 21 , 22 ), as well as the dynamics of both supplementary and competitive interactions ( 12 , 23 ). Besides, both scooters and bikes often compete with transit for short-distance trips in city centers ( 5 , 11 , 24 ). There is also a growing interest in designing cities dominated by micromobility, where e-bikes are used as the primary mode of commuting ( 25 ) and integrating into the mobility-as-a-service ecosystem ( 5 , 26 ). Moreover, a recent finding indicated that if 50% of transit users accessed stations via micromobility options instead of walking, the required density of transit stations could decrease by up to 11.5%, highlighting the impact of these services on transit network planning in future cities dominated by micromobility ( 4 ). With these multifaceted interactions of the two transportation systems and the paradigm shift toward the urban mobility revolution, there is a need to understand the complex relationship between micromobility and existing transit in diverse urban settings, which this study aims to fill. Regardless of the different coopetition relationships of the two modes, the current research focuses on the role of micromobilities as first- and last-mile transit connections.
The integration of micromobility with public transit has several benefits, such as enhancing accessibility ( 6 , 27 , 28 ), reducing private car dependency ( 29 ), lowering the generalized travel cost ( 7 ), and providing personalized and flexible travel options ( 18 ). Despite there being a general consensus on the benefits of integrating the two modes, challenges and uncertainties still exist, such as higher operational and user costs of micromobility, especially in station-based systems ( 4 ). Besides, micromobility services can create a spatial disparity as the services are usually limited in city centers ( 30 ), and their usage is highly associated with recreational activities compared with using them as a commuting mode ( 12 , 31 ). The demand for these services can also fluctuate substantially throughout the day, which can lead to uneven vehicle distribution ( 32 ). What is more, the interaction dynamics between the two services vary across different urban environments. For instance, a study conducted in 124 cities revealed significant variations in the integration ratios of e-scooter services and public transit, ranging from 5.59–51.40% ( 8 ).
In light of the uncertainties mentioned above concerning the relationship between shared micromobility and public transit, to the best of the authors’ knowledge, no study has conducted a comparative analysis to reveal differences and similarities between first- and last-mile trips, as well as the influencing factors of each category. Our current study addresses these gaps by analyzing the spatiotemporal patterns of first- and last-mile shared micromobility trips through a data-driven approach. Firstly, we identify patterns of integrated trips using multidimensional clustering of first-and last-mile trips. Secondly, we develop regression models that identify the factors influencing first-and last-mile demand and provide insights into the type of integrated trips and the differences in factors affecting each trip type.
The remaining sections of this paper are organized as follows: First, we review related works in the literature, followed by a detailed description of the methodology and the datasets used. In the last two sections, we discuss the results and insights from the findings, and finally, the paper concludes by summarizing the key findings and outlining future research directions.
Literature Review
This section thoroughly reviews the literature on the characteristics of integrated trips, the benefits and uncertainties of integration, and the factors that affect demand. Additionally, it identifies gaps in the literature and highlights the contribution of the current study.
Integrated Trip Characteristics
The findings from previous studies on the characteristics of integrated trips show that there is no consensus on integrated uses of shared micromobility and public transit. Recently, Li et al. ( 33 ) showed that in Seoul, South Korea, integrated trips account for 5% of the total bike trips. Furthermore, the integration rates in Chinese cities include 18% in Nanjing ( 34 ), 8.22% in Shenzhen ( 35 ), 8% for subway-connected trips and 40–45% for bus-connected trips in Ningbo, Zhejiang Province ( 36 ), and 14% in Shanghai ( 37 ). Moreover, in Shenzhen, during the morning peak, integrated trips show 28.9% more first-mile and 7.6% less last-mile use compared with the afternoon peak ( 38 ), and weekday morning trips have shorter duration than evening and weekend trips ( 35 ). Considering the trip characteristics in European cities, Li et al. ( 8 ) found that the ratios for first- and last-mile integration vary inversely, ranging from 5.59–51.40% across 124 cities. Their findings also highlighted that in over 76 of those cities, the integration rate exceeds 30%. Furthermore, recent research by Gödde and Scheiner ( 39 ) in Hanover, Germany, found that 25% of scooter trips served as first- or last-mile connections to transit. On the other hand, in their recent studies in the USA, Ju et al. ( 11 ) showed that 5–20% of micromobility trips are integrated with rail transit, while Cui et al. ( 22 ) found that the integration rate is 9.5%.
Existing research suggests that public transit-integrated micromobility trips typically fall within a moderate range in regard to duration and distance. For instance, Jin et al. ( 40 ) observed a rise in transfer trips for journeys shorter than 2 km. Similarly, Wu et al. ( 41 ) demonstrated that transfer trip frequency grows for distances spanning 100–500 m from transit stations, but declines sharply beyond the 500 m threshold. Further supporting this pattern, Guo et al. ( 42 ) revealed that about 70% of integrated trips last from 2.5–10 min.
Benefits and Uncertainties
The integration of micromobility with existing transit creates a more accessible transportation network, as bikes and scooters can reach places transit cannot, while transit covers longer distances faster ( 5 ). Given that, the integration could lead to lower travel costs and better accessibility when supported by a well-connected multimodal transportation network ( 4 , 9 ). The integration of the two systems also increases transit coverage. Gödde and Scheiner ( 39 ) stated that 10% of scooter trips occur in zones with limited public transit service in Hanover, Germany, while Zuo et al. ( 9 ) found that bike usage as first- and last-mile feeders in Hamilton County, USA, raises bus accessibility by up to 28.7%. Furthermore, a study in South Korea ( 43 ) showed that bike-based transit-oriented development resulted in a threefold increase in transit coverage. Besides, Lin et al. ( 44 ) pointed out that, in Shanghai, China, bike sharing can enhance coverage by 104%. On the other hand, micromobility competes with transit in city centers by replacing short-distance trips ( 12 ).
In their recent studies, McQueen and Clifton ( 45 ) assessed the perception of e-scooter users as a viable first- and last-mile solution in Portland, Oregon. Their findings challenge the assumption that e-scooters enhance transportation equity, showing less interest among women and Black participants compared with their male and White counterparts. Similarly, Liu and Miller ( 7 ) highlighted that while dockless micromobility can reduce transit travel times in Columbus, Ohio, improvements were concentrated primarily in city centers, indicating a geographic disparity in the benefits of the integration of the two systems. In a different approach, Caggiani et al. ( 46 ) explored strategies to reduce inequalities in bicycle-public transportation access through a network design approach, and demonstrated that equity can be enhanced through system design perspectives of integrated mobility systems.
Influencing Factors
The works in the literature show that the influencing factors change across different urban settings and cultural backgrounds. Li et al. ( 8 ) investigated scooter and transit integration in 124 cities and found that first- and last-mile demand is associated with the number of young people. Tushar and Buehler ( 28 ) also revealed that areas with younger populations, lower poverty rates, and higher population density generate significantly more connected trips in Washington, D.C.. On the other hand, studies have shown that middle-aged individuals are more interested than younger ones in integrating bikes with metro systems ( 17 ). However, another study indicated that older rail commuters are less likely to use bikes for transit access ( 47 ). Furthermore, Liu et al. ( 48 ) showed that older adults take longer integrated trips, while Chan and Farber ( 49 ) noted that as the population in the 25–54 age group increases, the demand for bikes also rises. Considering the gender differences, Guo and He ( 17 ) found that males are more likely than females to choose bikes for public transit connections. Similarly, Ji et al. ( 47 ) found that female commuters are less likely to use bikes to access transit, and Javadiansr et al. ( 10 ) noted that women and high-income groups are less likely to use e-scooters for transit connections. Recently, Hu et al. ( 50 ) pointed out that high-income and native-born communities obtain an average of 80% accessibility gain, which is over 10% higher than other demographic groups. Nevertheless, Liu et al. ( 48 ) outlined that approximately an equal proportion of male and female users choose bikes for metro access.
Considering the influencing factors related to the built environment and other urban features, the number of integrated trips is positively associated with bike lanes for access and egress to transit stations, while detours are negatively associated ( 51 ). Additionally, areas with a denser transit network tend to experience a decrease in complementary trips ( 33 ). In Nanjing, China, continuous biking infrastructure leads to an increase in integrated trips ( 34 ). Conversely, Li et al. ( 35 ) highlighted that bike lane length does not significantly reduce access time. Moreover, Cheng et al. ( 52 ) indicated that higher population densities and well-developed bicycle infrastructures positively correlated with an increase in integrated trips, while an extensive network of minor roads with mixed traffic was found to discourage bicycle use. Li et al. ( 8 ) found that e-scooter integration with public transit is positively associated with commercial and retail activity but negatively related to industrial presence. Above and beyond, Geurs et al. ( 53 ) underlined a significant increase in job accessibility attributed to enhanced micromobility supporting infrastructure, while Javadiansr et al. ( 10 ) found that urban design features such as intersection density and multimodal hubs have a significant impact on the integration of e-scooters and transit. Furthermore, a recent study by Kong et al. ( 36 ) outlined the need to enhance infrastructure connectivity to integrate micromobility and public transit systems. Tushar and Buehler ( 28 ) also showed that expanding bike-supporting infrastructures, such as bike lanes and trails, and increasing the density and proximity of docking stations near metro stops boost integrated trips.
Literature Gap and Contributions of the Current Study
The review of recent studies on integrating micromobility with public transit systems highlights the significant potential in enhancing accessibility, reducing travel times, and improving transit coverage. However, research gaps remain, particularly in understanding micromobility and transit-integrated trips across diverse spatial and temporal dimensions. This research aims to address these gaps by analyzing the patterns of micromobility and transit integration through a data-driven approach for the case study of Calgary, Canada. From a methodology perspective, different approaches have been considered to investigate the interactions and influencing factors of micromobility and transit integration. These include the spatiotemporal analysis of trip distances and duration ( 11 , 12 ) and the generalized travel cost ( 7 , 20 ) and regression models (e.g., ( 6 , 15 , 17 – 19 , 23 , 52 )). The methodological contribution of the current study is twofold. First, we provide an approach to identifying integrated trips and uncovering trip patterns through multidimensional k-means clustering, which is an unsupervised machine learning algorithm. Second, we estimated the influencing factors of these different clusters of trips, including employment density, private dwellings, micromobility-supporting infrastructure, mode of commuting for the employed labor force, income, and points of interest as potential destinations for shared micromobility trips. Furthermore, to the best of the authors’ knowledge, the comparisons of influencing factors of first-mile with last-mile trips have not been considered in previous works of literature on the analysis of integrated trips, which makes our research novel in uncovering the characteristics of access and egress trips. Above and beyond, while most studies are in China, Europe, and the USA, investigating the integration of shared micromobility with transit services is rare from a Canadian city perspective, making our study pioneering.
Methods
General Approach
As illustrated in Figure 1, our approach comprises three main steps. The first step is to consider multiple datasets, such as the micromobility origin–destination trips and transit stops from the general transit feed specification (GTFS) data, the number of employments from the regional transport demand model, and private dwelling and different population group data distribution from the census data as well as the point of interest (POI). Micromobility service supporting infrastructures like cycle tracks, bike lanes, and path connectors data have also been considered. Moreover, rigorous data cleaning techniques are considered to identify important information from the respective datasets and identify micromobility trips integrated with transit as potential first-mile or last-mile travel options. In the second stage, descriptive and K-means cluster analyses are used to reveal the temporal and spatial variations in the interactions between the public transit system and the first- and last-mile shared micromobility services. Furthermore, the third step of our approach is to develop a stratified regression model to investigate the factors that influence the demand for first- and last-mile trip categories.
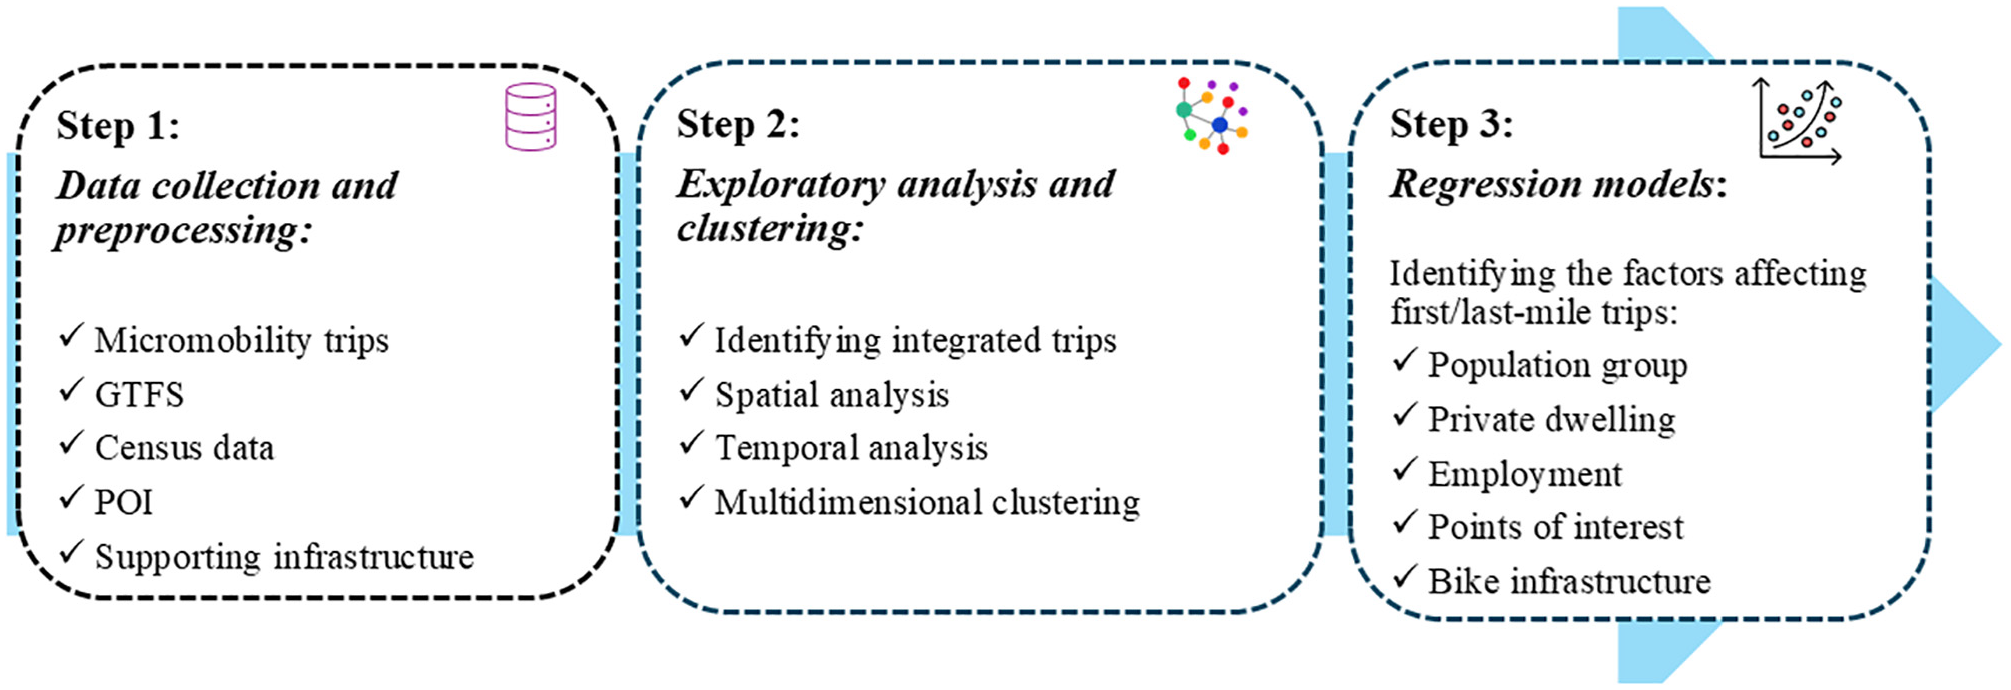
The research steps.
Identifying Integrated Trips
Identifying the physical interaction of micromobility services with the conventional public transportation system with a fixed line and fixed schedule is challenging because transfer trips and travel chains of the passengers of the two services are often unknown ( 5 ). Nonetheless, there have been attempts to identify user travel chains using surveying at metro stations ( 54 ) and smart card systems to determine the card pairs associated with the same ID as metro-bike transfer trips ( 48 ), which are expensive and impossible as there is no digital integration of the two systems in the city of Calgary context. Provided that, the potential connection between micromobility and public transit trips can be inferred based on the location of the transit stations and the pickup and drop-off area of the micromobility service. Previous studies have indicated that transit-integrated shared micromobility trips are typically within proximity to transit station catchment areas. In European cities, Weschke ( 55 ) used a 50 m buffer in Berlin, and Li et al. ( 8 ) applied the same distance in their study of 124 cities in 15 countries. Similarly, studies in Chinese cities also considered a 50 m catchment area ( 18 , 44 , 56 ). Conversely, other studies in Asian cities used a 100 m buffer ( 33 , 41 ). In North American cities, however, larger catchment areas are often used owing to different urban environments: 400 m in Tucson ( 57 ), 50–500 m in Columbus ( 7 ), and 100–400 m in Boston, Chicago, Washington DC, and New York City ( 58 ). Additionally, Tushar and Buehler ( 28 ) considered a quarter-mile buffer distance in Washington, DC, to study the integration of bike and metro services. Given these variations, a buffer distance of 100 m is assumed for our case study in Calgary, Canada, to infer the potential connection between shared micromobility and public transit trips.
As illustrated in Figure 2, which shows the physical interaction between micromobility and transit transfer trips, we used a catchment area-based strategy to identify first- and last-mile trips. We assumed that if the pickup location of the micromobility services is within close proximity to the transit stations (100 m buffer distance), there is a probability that a micromobility trip will be a last-mile trip for transit. On the other hand, when the drop-off location of the micromobility services is within a close distance from the transit stations, we assume that the micromobility services are used potentially as first-mile services with transit. Besides, the micromobility trips in which both their pick-up and drop-off locations are within a buffer zone of a transit station are excluded because those trips cannot be considered as first- and last-mile connections as explained in the studies ( 5 , 59 ). This method is suitable for identifying potential connections for dockless micromobility services and transit, as the pickup and drop-off locations are user-driven and spontaneous within the transit station buffer zone instead of relying on intentional docking station placement.
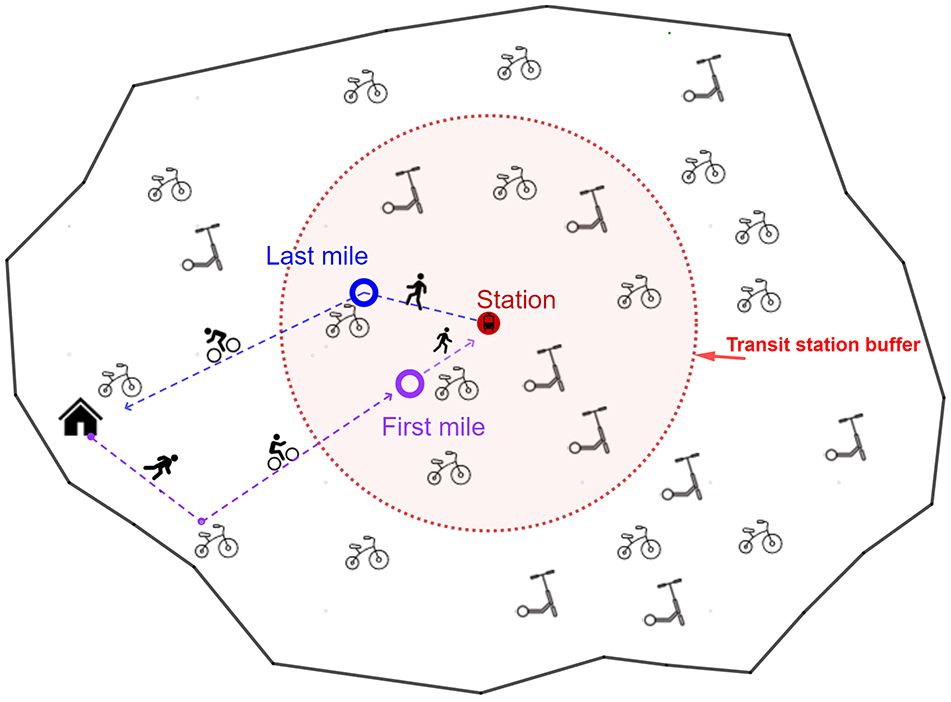
Layout of first- and last-mile micromobility trips within transit station buffer.
Data Description and Study Area
The city of Calgary is chosen as a case study city. As indicated in Table 1, the datasets used include the GTFS data, which provides information on public transportation stops, schedules, and routes. The other important dataset is the dockless micromobility trip data from July 1, 2019, to September 30, 2019, which provides information on the type of vehicle used (scooter or bike), the start date, hour, and day of the week for each trip, and the distance and duration of the trips. It also includes unique identifiers for the starting and ending locations; aggregate trip counts to hexagonal bins measuring 30,000 m2 each, and the longitude and latitude of the center points of the start and end locations. The total number of shared micromobility trips is about 482,021, of which 96.4% are scooters, and the remaining 3.6% are bike trips. It is important to note that, because the shared micromobility market was still in its early stages during this period, residents may not have been fully familiar with these services. As a result, the observed travel behaviors might not accurately represent established patterns in a mature market; nevertheless, these emerging behaviors provide instrumental insights into the dynamics of shared micromobility.
Categories of the Data Used and Descriptions
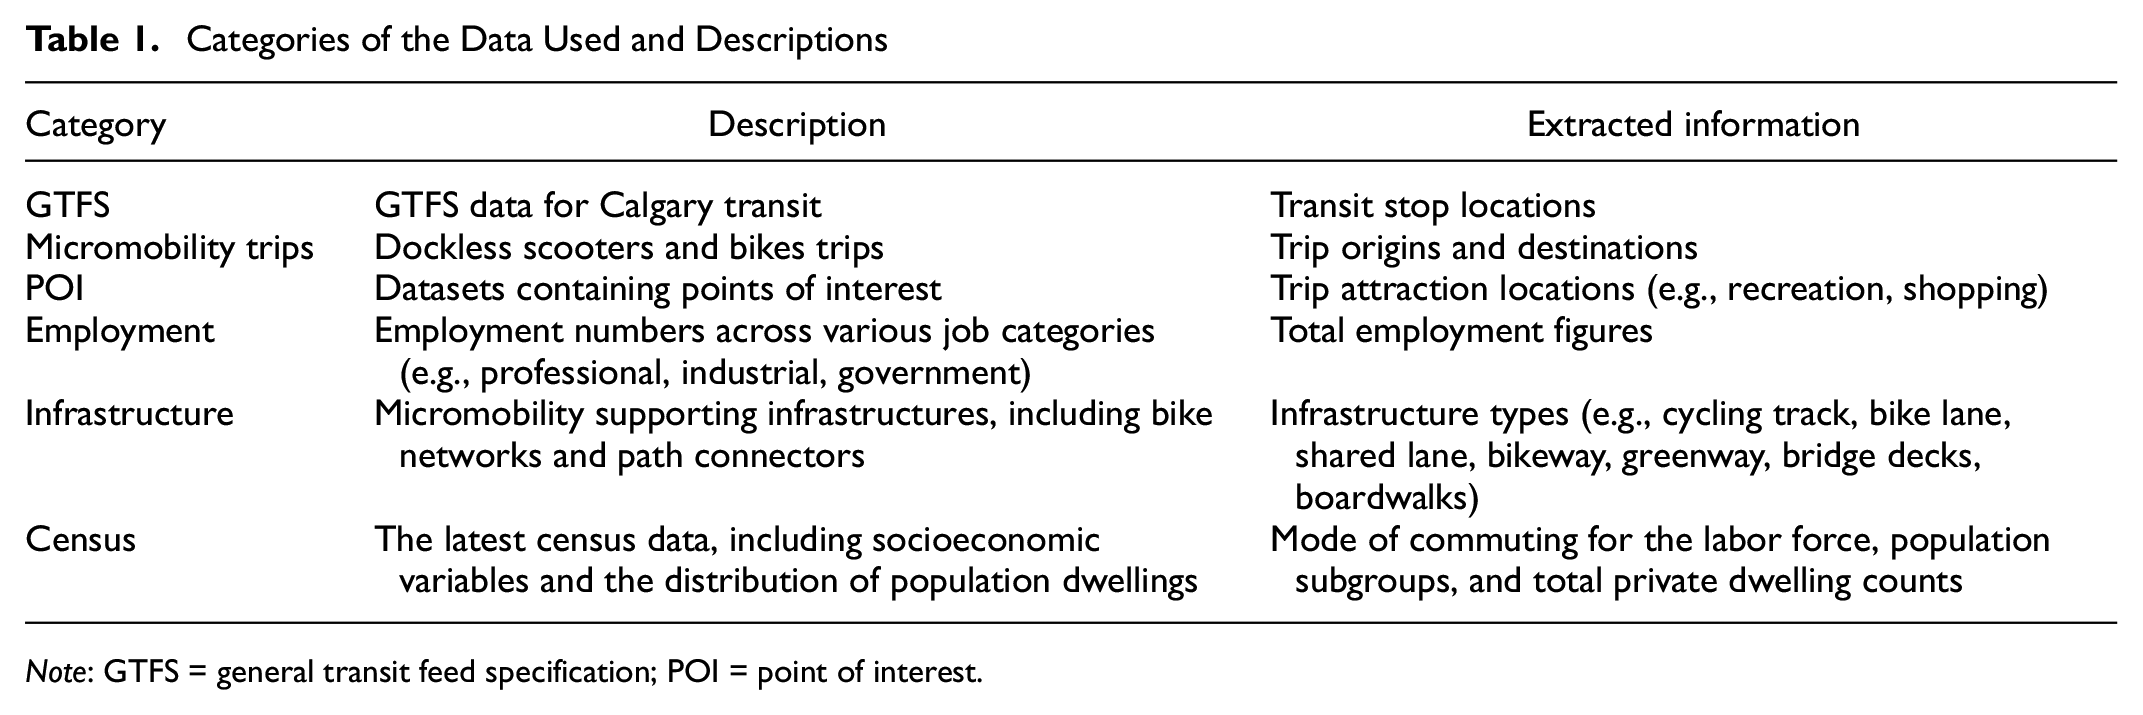
Note: GTFS = general transit feed specification; POI = point of interest.
We used a comprehensive set of POI datasets from 2019 to explore the influence of potential trip destinations on first- and last-mile shared micromobility trips. The POIs included diverse categories such as educational institutions (e.g., schools, colleges), financial institutions, office buildings, restaurants, shops, recreational facilities (e.g., gyms, parks), and places of worship. This categorization of POIs allowed us to capture a wide range of potential destinations relevant to micromobility users. Employment data were included to provide insights into the total number of jobs across various categories, including professional, industrial, and governmental sectors, which are vital for analyzing the relationship between employment hubs and micromobility usage. The other dataset category is related to micromobility-supporting infrastructures such as bike networks and path connectors. The bike infrastructure data, including the cycle track and bike lane length, is an influencing factor for integrating the two transportation systems. In addition, the datasets include path connectors, which are urban road infrastructures such as boardwalks and road crossings. These are essential for creating a comprehensive network model that accurately represents all possible micromobility routes. Besides, the 2021 census dataset is used to extract information about population groups, including income, main mode of commuting for the employed labor force aged 15 years and over, and private dwellings at the dissemination area (DA) level. We aggregated and analyzed these multiple datasets to understand the trends of shared micromobility first- and last-mile trips.
It is also worth mentioning that the city of Calgary, as shown in Figure 3, is divided into eight community sectors: North, South, West, East, Northwest, Southwest, Southeast, and Center. The city has a well-developed public transit system, including light rail transit (LRT) and buses. However, the LRT network consists of only two lines, while the bus network is extensive. As a result, our study treats the bus and LRT networks in the same way. In July 2019, shared micromobility services were introduced, enhancing the urban transport network. However, most shared micromobility trips primarily occur in the central sector, which we have chosen as our case study area. Figure 3 illustrates the study area defined as the central sector of Calgary. In this central sector, there are about 1,165 transit stops, providing extensive public transit coverage throughout the downtown core and its surrounding neighborhoods. Additionally, the introduced micromobility services are dockless shared e-scooter and e-bike programs, allowing users to rent and return vehicles using a mobile app without the need for fixed parking stations. Regardless of the free-floating nature of the introduced shared micromobility, downtown Calgary has notably experienced the highest usage of e-scooters, likely owing to the increased availability and well-developed bicycle infrastructure. In this study, we use the DA from the census data as a traffic analysis zone. DA is a small area comprising one or more neighboring dissemination blocks and represents the smallest standard geographic area for which all census data is provided. We include only those DAs where at least 25% of their area falls within the central sector of Calgary.
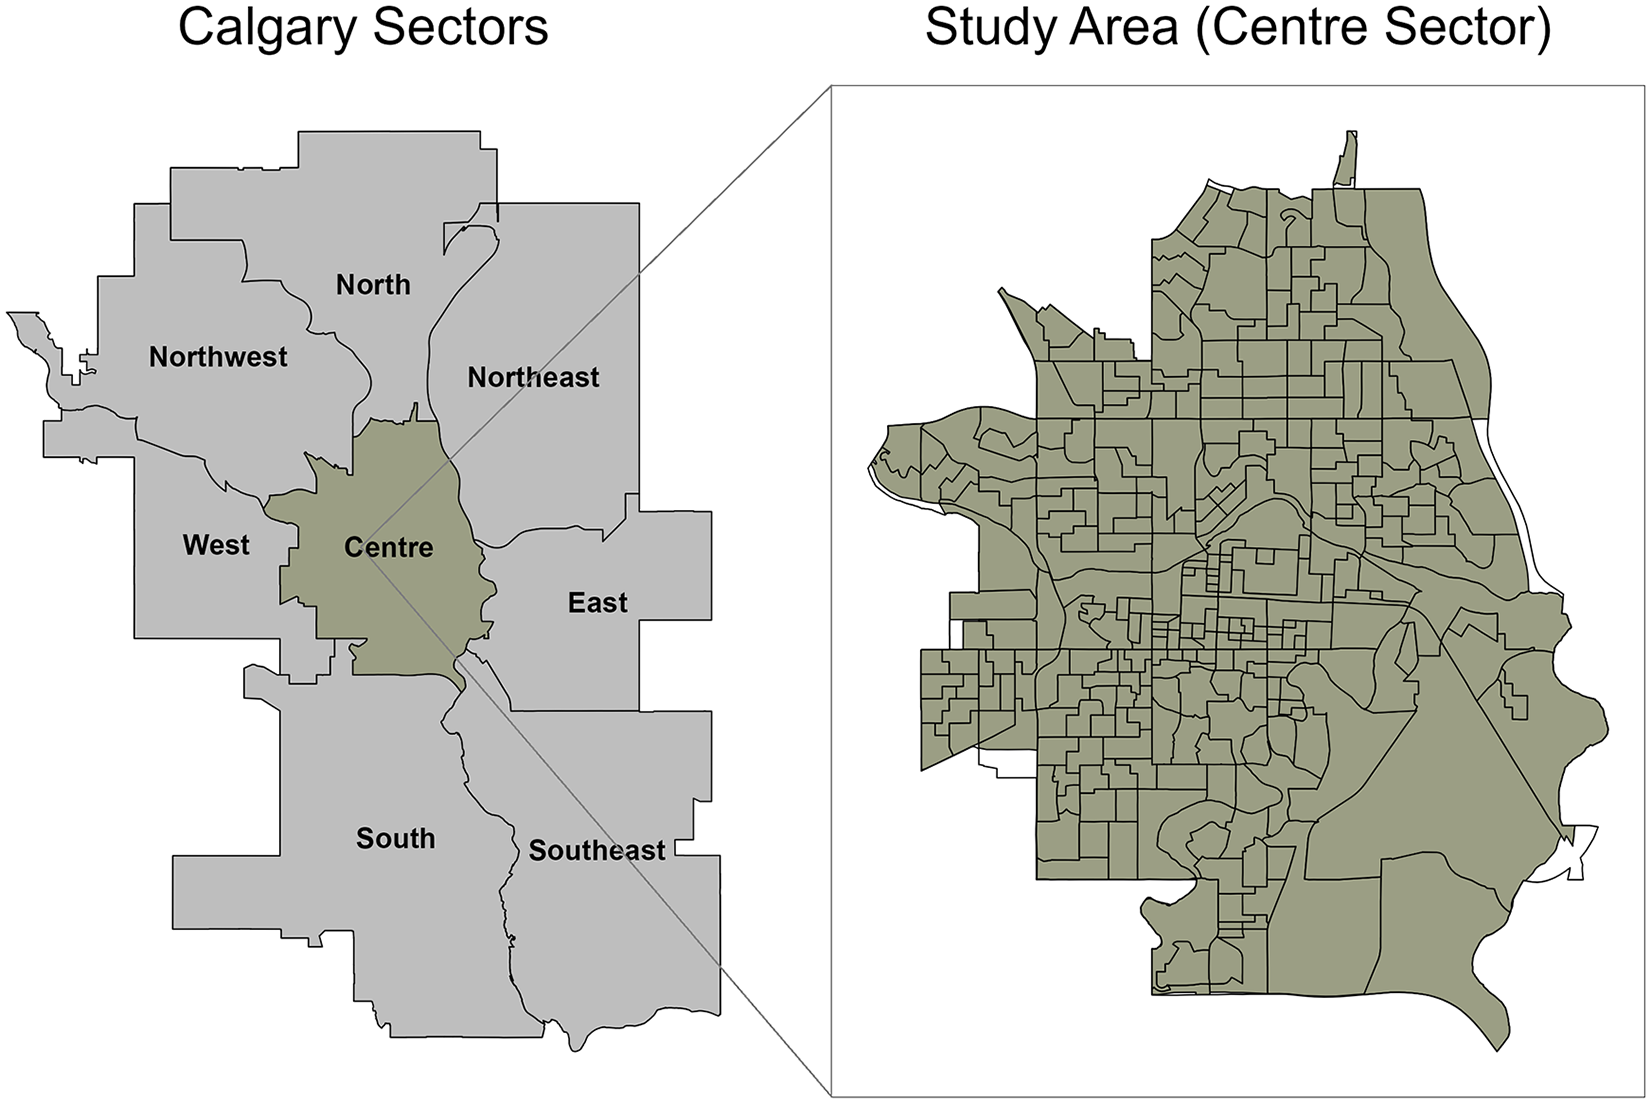
Study area: The central sector of Calgary.
Data Preprocessing
After collecting all the relevant data from the respective sources, as explained in the previous section, the next step is to extract the important information from each source. Considering the micromobility data, the trips that start or end outside the central sector were excluded. It is important to note that, before sharing the dataset, the City of Calgary removed trips that lasted under 30 s or covered less than 100 m. Additionally, during our data cleaning process, we removed micromobility trips with durations exceeding 20 min, as these longer trips were deemed unreasonable in connection with public transit. Furthermore, we applied a 5 km distance threshold to identify more meaningful trends in micromobility services. Previous works in the literature also pointed out that integrated trips are generally of moderate length (40), and Wu et al. (41) showed that the rate of integration starts to decrease beyond 500 m and considered a maximum of 5 km trip distance to study the connections between bikes and metro. Moreover, we processed the other datasets, including the GTFS data, private dwellings, employment, POI, population subgroups, and supporting infrastructure, and aggregated them at a DA level.
Clustering Method
Clustering is a widely used technique in both scientific research and industrial applications, attributed to its simplicity and efficiency in uncovering patterns in data ( 18 , 60 ). The method involves dividing a dataset into k groups, such that the sum of the distance variance of observations to their assigned cluster centers is minimized ( 18 ).
In our analysis, various clustering techniques can be considered to uncover the spatiotemporal patterns of first- and last-mile trips. We opted for k-means, a straightforward, unsupervised machine learning algorithm, for its ease of implementation. K-means clustering is used to assign DAs to k clusters based on the temporal patterns of micromobility use of the first -and last-mile trip categories. This is a hard cluster, and each DA has to be allocated to one cluster. We observed that demand for micromobility varies between weekdays and weekends. Thus, to analyze first-mile trips, we aggregated the number of these trips for each DA into 24 h bins for both weekdays and weekends, resulting in two 24 h profiles per DA, creating a total of 48 attributes. We repeated this process for last-mile trips as well. By using these 48 attributes for each trip category, we clustered different areas of the city based on their first- and last-mile trip patterns during both weekdays and weekends, highlighting each area’s unique trip production and attraction roles. Using this approach, we identified distinct clusters of DAs in the central sector of Calgary that exhibit similar trip patterns. Separating the analysis into first- and last-mile groups also clarifies the distinct spatiotemporal patterns observed in each category.
Before applying the clustering algorithms, we normalized the data to ensure that each variable contributes appropriately to the analysis; we employed Min-Max normalization, which scales the hourly trip counts to a range between 0 and 1. Furthermore, determining the optimal number of clusters k in k-means clustering is a critical challenge to uncover the hidden patterns of each trip category. We applied the elbow method ( 61 ) to our dataset, which suggested an optimal k value between 3 and 5 for both first- and last-mile trips, as illustrated in Figure 4. Consequently, we opted for four clusters, which provided a better balance between model simplicity and the need to represent the spatial heterogeneity of trip behaviors, allowing us to identify distinct clusters and interpret the underlying patterns effectively.
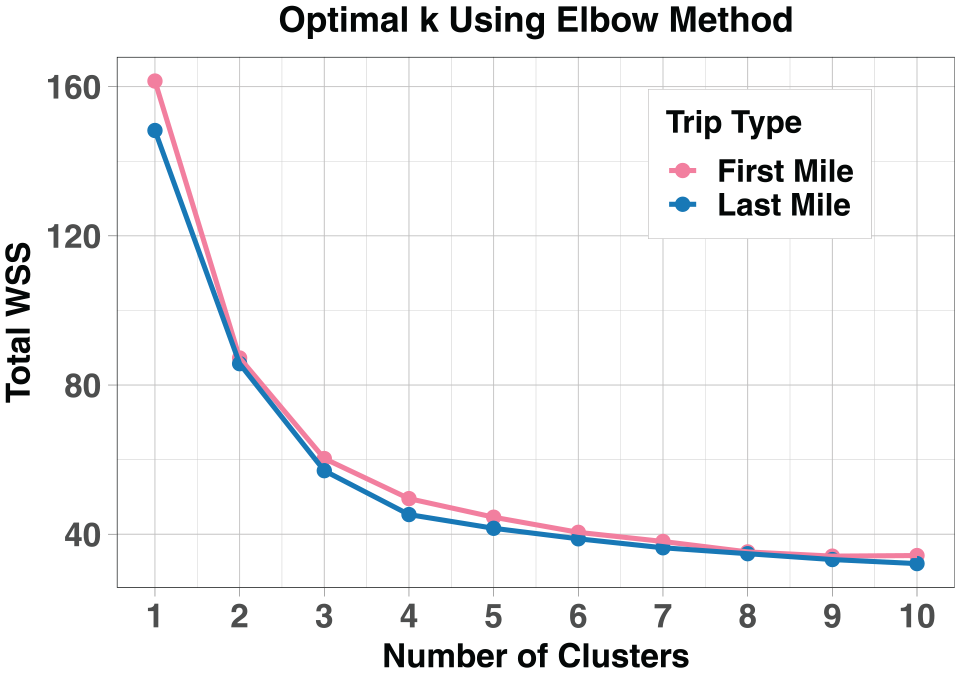
Estimating the number of clusters (k) using the elbow method.
Regression Method
This study employed a stratified linear regression model to investigate the determinants of first- and last-mile transit-integrated micromobility trips. We considered various determinants of demand for the first and last mile, including micromobility infrastructure, proximity to private residences, population subgroups, points of interest, and the number of employment opportunities. The unit of analysis for the regression model is the DA census unit, and the geographic scope is the central sector of the city (see Figure 3 above). The number of first- and last-mile trips was the dependent variable, and we analyzed the factors that influence the usage of each trip category. The following section outlines the dependent and independent variables and the rationale behind developing a stratified model and selecting the influencing factors.
Dependent Variables
Micromobility demand varies by time of day, day of the week, or season. Stratification of demand models by time periods (e.g., weekdays vs. weekends, peak vs. off-peak hours) ensures that trip patterns are captured more accurately across different temporal conditions. Accordingly, we stratified the regression analysis into six models: three for first-mile trips and three for last-mile trips, defined by time periods—weekday morning peak, weekday evening peak, and off-peak hours.
Commuting trips usually occur during peak hours: the a.m. peak runs from 6:00–9:59 a.m., while the p.m. peak spans from 3:00–6:59 p.m.. First-mile trips during the a.m. peak typically involve connections from residential areas to public transit (PT) stations. In contrast, first-mile trips during the p.m. peak begin at workplaces or POIs and head toward PT stations. Last-mile trips follow a similar pattern. In the a.m. peak, these trips start at PT stations and end at employment centers or other POIs, while in the p.m. peak, they begin at PT stations and lead to residential areas. Off-peak weekday and weekend trips are generally assumed to be non-commuting journeys that encompass leisure activities and errands occurring outside regular work hours. These trips are classified as first- and last-mile trips during off-peak periods, defined as hours outside the weekday peak times and all weekend hours. By categorizing the dependent variables in this way, we can better capture the temporal variations in micromobility trips and understand how different factors influence first- and last-mile trip patterns throughout various times of the day.
The dependent variables are defined as the density of micromobility trips, which is calculated by aggregating the first- and last-mile trip counts for specific time periods (e.g., morning peak, evening peak, off-peak) and normalizing these counts by the area of each DA. This approach standardizes the trip measures across DAs of varying sizes, thereby reflecting the intensity of trips per unit area rather than absolute numbers. Subsequent data filtering includes only DAs where first- and last-mile usage are observed, discarding areas with zero occurrences, thereby applying a global masking technique ( 30 ). Implementing this approach is crucial for maintaining model accuracy and minimizing bias, which affects the relationship between micromobility usage and the actual factors that influence trip frequencies.
Explanatory Variables
While infrastructure-related attributes are important to all types of trips, the factors influencing the number of integrated trips depend on the purpose and timing of the journey. For morning peak hour first-mile trips and evening peak hour last-mile trips, home-side attributes, such as the density of private dwellings and socioeconomic factors, are considered. Moreover, last-mile trips during the morning peak and first-mile trips in the afternoon peak are influenced by workplace attributes, including the density of employment and POIs. On the other hand, non-commuting trips, which occur during weekends and off-peak weekday hours, are primarily driven by the presence of private dwellings and POIs without considering the number of employment, as employment-related trips are assumed to take place during peak hours on weekdays. Furthermore, supporting infrastructure, such as bike infrastructure and path connectors within the road network, affects all trip categories by facilitating micromobility usage, regardless of the time of day and the purpose of the trip.
We also examined the influence of socioeconomic factors on transit-integrated micromobility trips and ultimately incorporated only those significant predictors of the demand. Existing literature suggests that early adopters of newly introduced micromobility services in other cities tend to share common characteristics: they are predominantly male, between the ages of 25 and 45, possess higher education degrees, and have above-average incomes ( 29 , 62 – 64 ). Intuitively, micromobility users are also more likely to be environmentally conscious, travel less by personal vehicle, and prefer public transit or active transportation modes. We focused on middle-income individuals from the Canadian Census data, defined as those in the fourth to seventh after-tax income deciles, and calculated their percentage within each DA to reflect economic status. Consistent with prior research ( 63 ), medium-income groups often exhibit a balanced sensitivity to cost and convenience, making them more inclined to use shared micromobility as part of a multimodal transportation system. We also included indicators for the main mode of commuting for the employed labor force aged 15 years and over, such as commuting by personal vehicle and on foot, measuring the percentage of residents using personal vehicles and those walking to work or other daily activities. These indicators help explore how existing commuting modes affect the use of shared micromobility integrated with transit.
We have standardized the independent variables by applying z-score scaling, ensuring that each of them is comparable and mitigating biases arising from differing magnitudes. Furthermore, we removed outliers by excluding observations where the absolute value of the z-score exceeded 3 ( 65 ), as such extreme values could disproportionately influence the regression model.
Results
This section provides a descriptive analysis of the dependent and independent variables, as well as the clustering analysis and the regression model results.
Descriptive Statistics
Our analysis showed that out of 165,488 trips potentially linked to the transit system, approximately 51.5% are classified as last-mile connections, while the remaining 48.5% are identified as first-mile connections. Examining the trip durations for these categories showed that integrated trips have moderate durations, with mean values ranging from 7.5–8.5 min, as illustrated in Figure 5. Overall, last-mile trips tend to have longer durations compared with first-mile trips. Furthermore, when considering temporal differences, the distribution in Figure 5 indicates that off-peak hour trips also exhibit longer durations. This pattern suggests that these longer off-peak trips may be associated with recreational activities and non-commuting purposes. The trip distance followed a similar distribution with an average distance of 1.32 km and 1.36 km for first- and last-mile trips, respectively. These findings are consistent with previous research. For instance, in Shenzhen, China, 70% of integrated trips span 2.5–10 min and cover distances ranging from 0.5–2 km ( 42 ). In the context of North American cities, station-based micromobility trips in California average 2.21 km and 12 min, while free-floating trips average 1.58 km and 10 min ( 11 ). Although the urban environment of Calgary differs from those cities, the alignment of the findings with our results supports the validity of our approach in identifying transit-integrated shared micromobility trips.
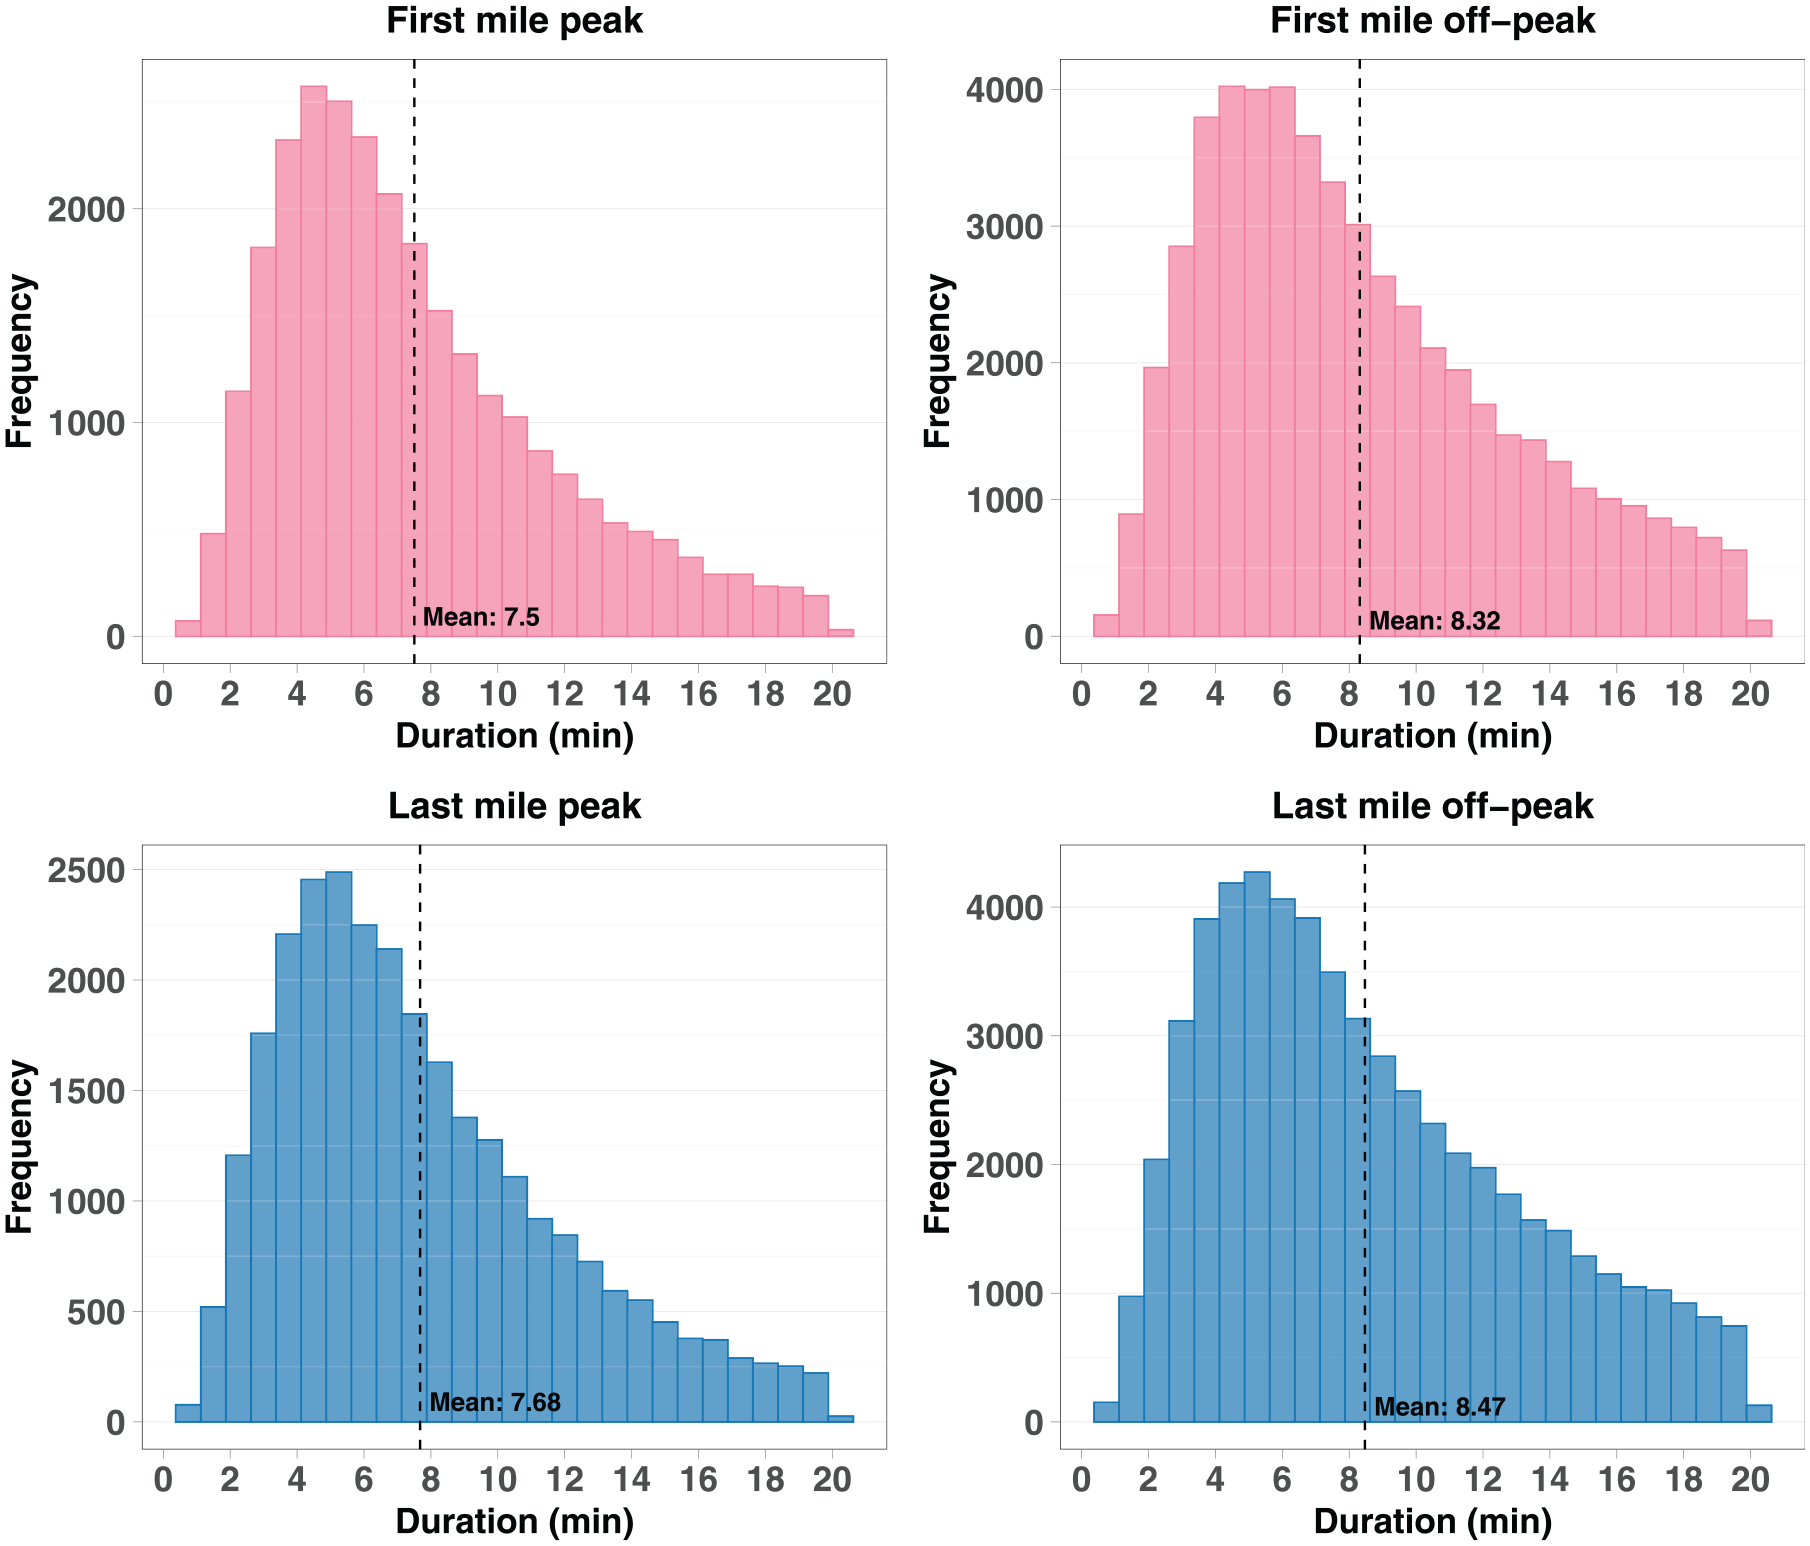
Trip duration distributions for first- and last-mile trip category.
Our descriptive analysis also indicated a temporal difference in the number of first- and last-mile trips based on the hours of the day. As presented in Figure 6, the results signposted that during weekdays, the number of first-mile trips surpasses the number of last-mile trips from 6:00–9:00 a.m.. This suggests that people use micromobility options to access transit stations for work-related trips during morning peak hours. However, for the rest of the day, there are more last-mile trips on weekdays and weekends. This implies that people are more inclined to use micromobility options to reach their final destinations after using a transit system.
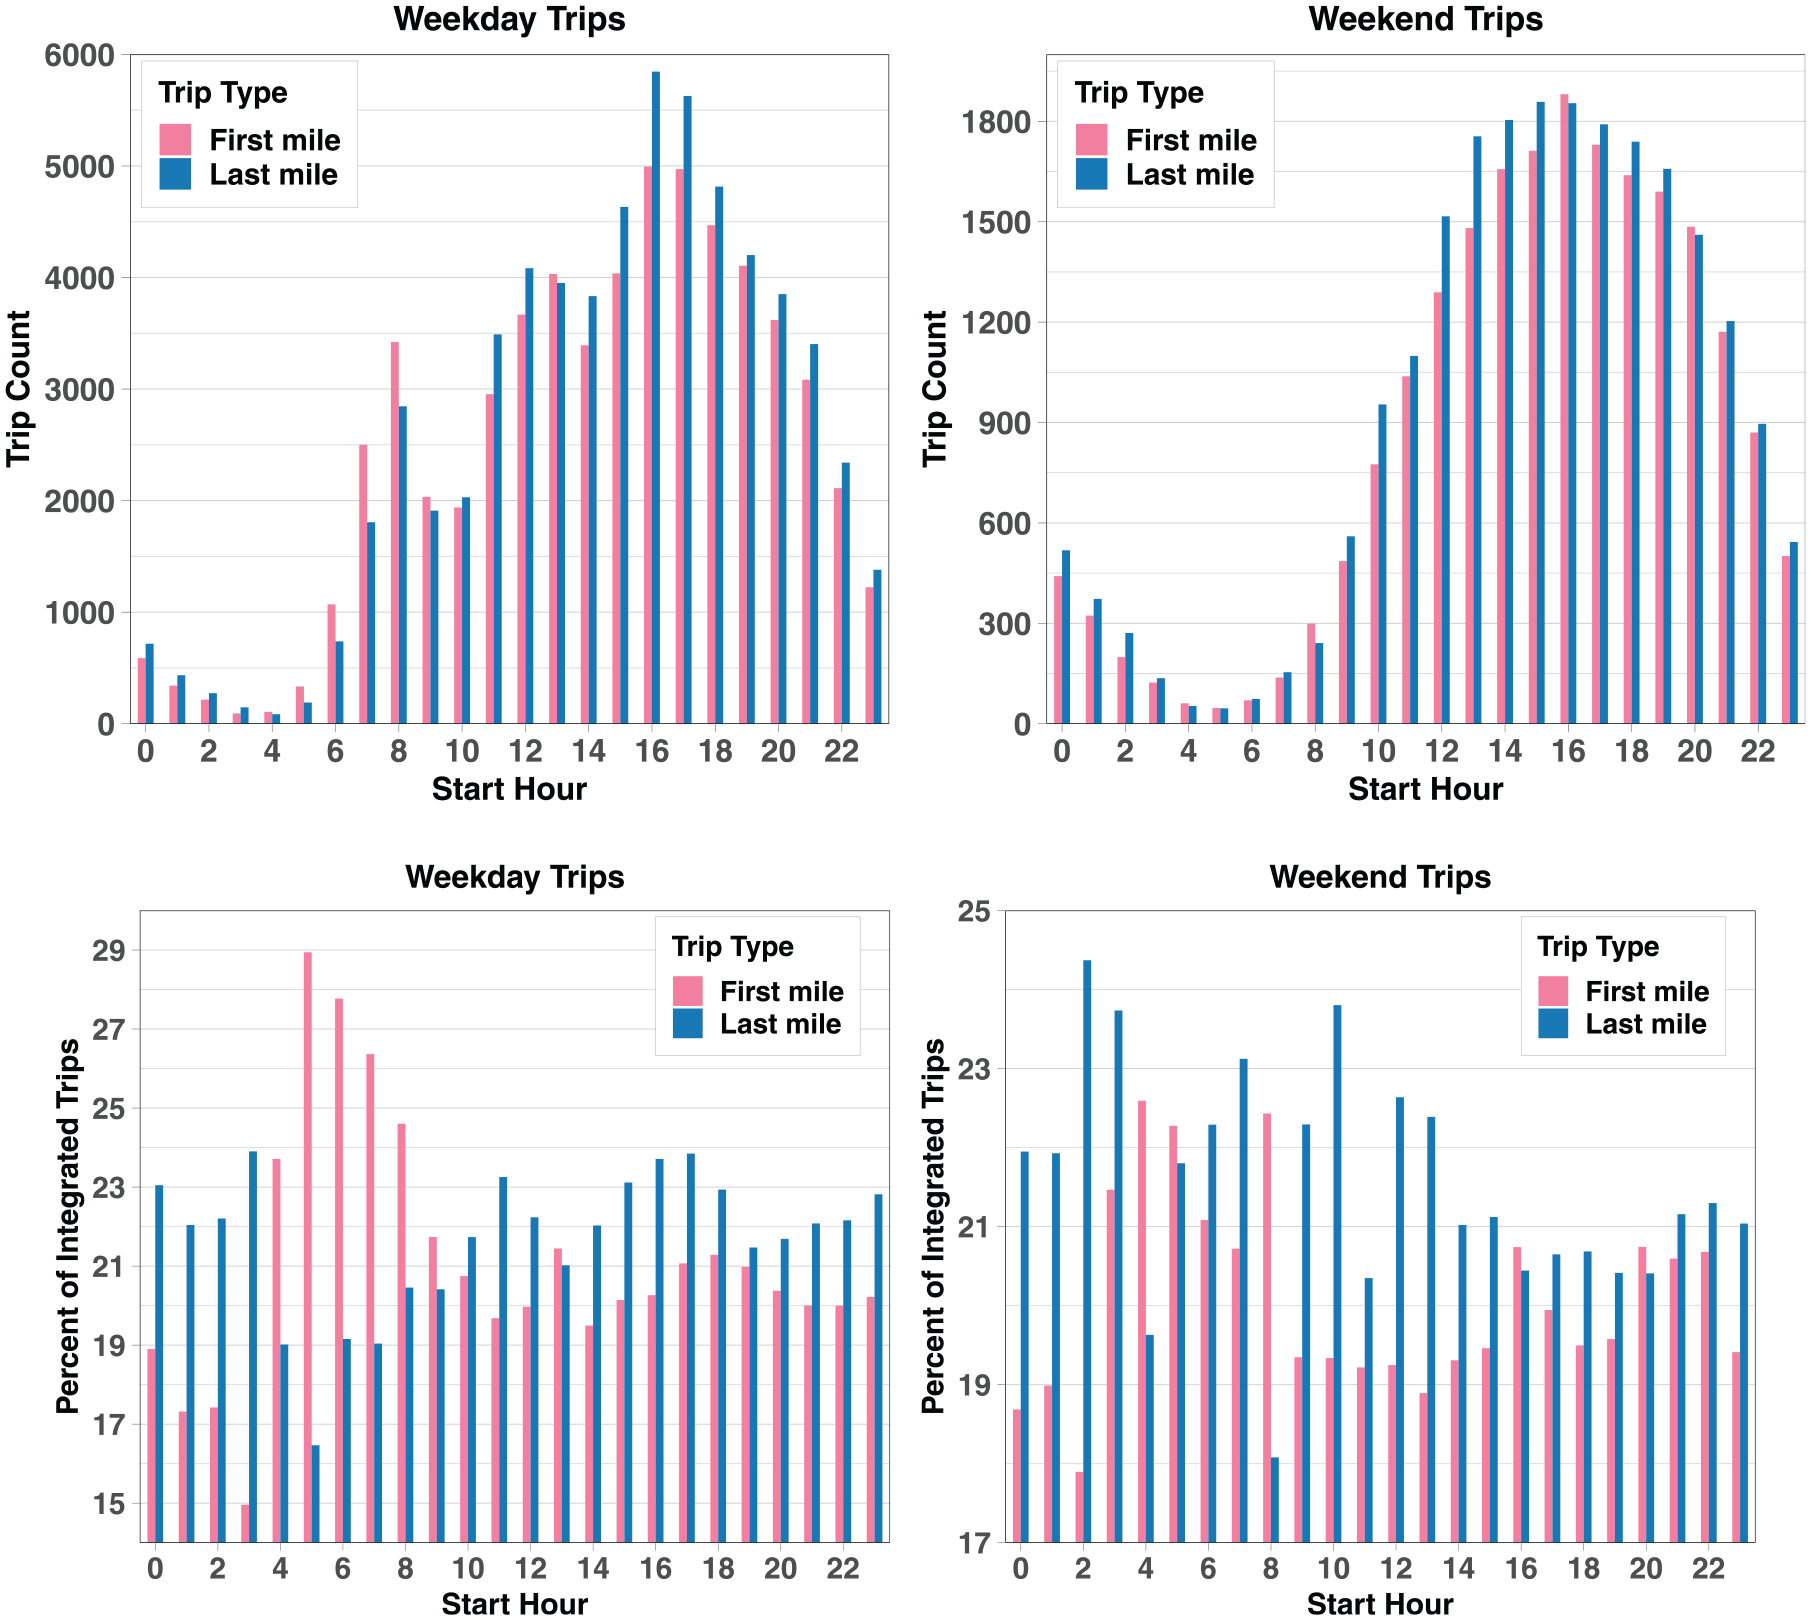
First- and last-mile trip counts (top) and the corresponding integration rate (bottom).
It is worth noting that scooters represent a larger share of the micromobility dataset, accounting for 96.3% of first-mile trips and 96.6% of last-mile trips. However, bike trips have relatively higher integration rates for specific trip categories during weekdays, with 23.48% for first-mile compared with the rate of integration of scooters at 20.5% and 24.4% versus 20.9% for last-mile trips. On weekends, bikes have a slightly higher first-mile integration at 22% compared with scooters at 20%, while scooters lead in last-mile integration at 22.6% versus 21.9%. However, the primary issue was the relatively small number of bike trips compared with scooter trips, which limited the statistical power and robustness of the models when analyzed separately. Thus, we opted to analyze aggregate micromobility data for clustering and regression analyses to address this limitation instead of segregating it by type of vehicle. Furthermore, bicycles and scooters have parallel operational features.
Considering the combined bike and scooter total trips, the average integration ratio is about 20.6% for first-mile trips and 21.9% for last-mile trips. However, this rate varies by the hours of the day on weekdays and weekends. As shown in Figure 6, on weekdays, first-mile integration rates range from 15–28.9%, with peak integration occurring during morning peak hours. In contrast, last-mile integration rates vary from 16.5–23.9%, with the highest integration observed during evening peak hours. Moreover, an inverse relationship emerges between first- and last-mile integration rates during peak periods: as first-mile integration rates increase in the morning, corresponding last-mile integration rates decline, and vice versa in the evening. This pattern underscores the integrated uses of micromobility and transit for daily commutes. During weekends, integration rates show less variability. First-mile integration percentages range from 17.9–22.6%, while last-mile rates span 18.1–24.4%. Compared with weekdays, our analysis revealed that weekend trips have a narrower range for first-mile integration and a slightly higher range for last-mile trips. However, the overall average integration rates for both trip categories are marginally lower on weekends. Our findings are somewhat consistent with previous studies, which show that the integrated trip ratio ranges from 5.59–51.40% across 124 European cities ( 8 ). In Los Angeles, USA, this ratio can reach up to 27% ( 11 ), while in Zhejiang Province, China, it ranges from 40–45% ( 36 ).
Figure 7 presents a detailed spatial distribution of the factors that may influence the demand for first- and last-mile micromobility trips. The distributions of employment and dwelling densities appear relatively uniform, indicating a balanced allocation of workplaces and residential zones throughout the region. In contrast, POIs are concentrated in the downtown area, highlighting the clustering of commercial, cultural, and recreational activities in the central business district. With regard to micromobility-supporting infrastructure, bicycle facilities are mainly concentrated in the city center, reflecting a prioritization of these amenities in this area. However, there are also significant extensions of bicycle infrastructure in the northern parts of the study area. The peripheral areas are characterized by sparse infrastructure and lower activity densities, which need to be taken into consideration in the interpretation of the regression models. Figure 7 also presents the spatial distribution of population groups that may serve as proxies for providing a descriptive context for investigations into factors associated with user behavior. The analysis indicates that downtown areas exhibit a higher proportion of residents who commute by walking, whereas peripheral regions show a greater reliance on personal vehicle commuting. In contrast, the spatial distribution of medium-income households, defined as those in the fourth through seventh income deciles after taxes, is relatively uniform across the study area.
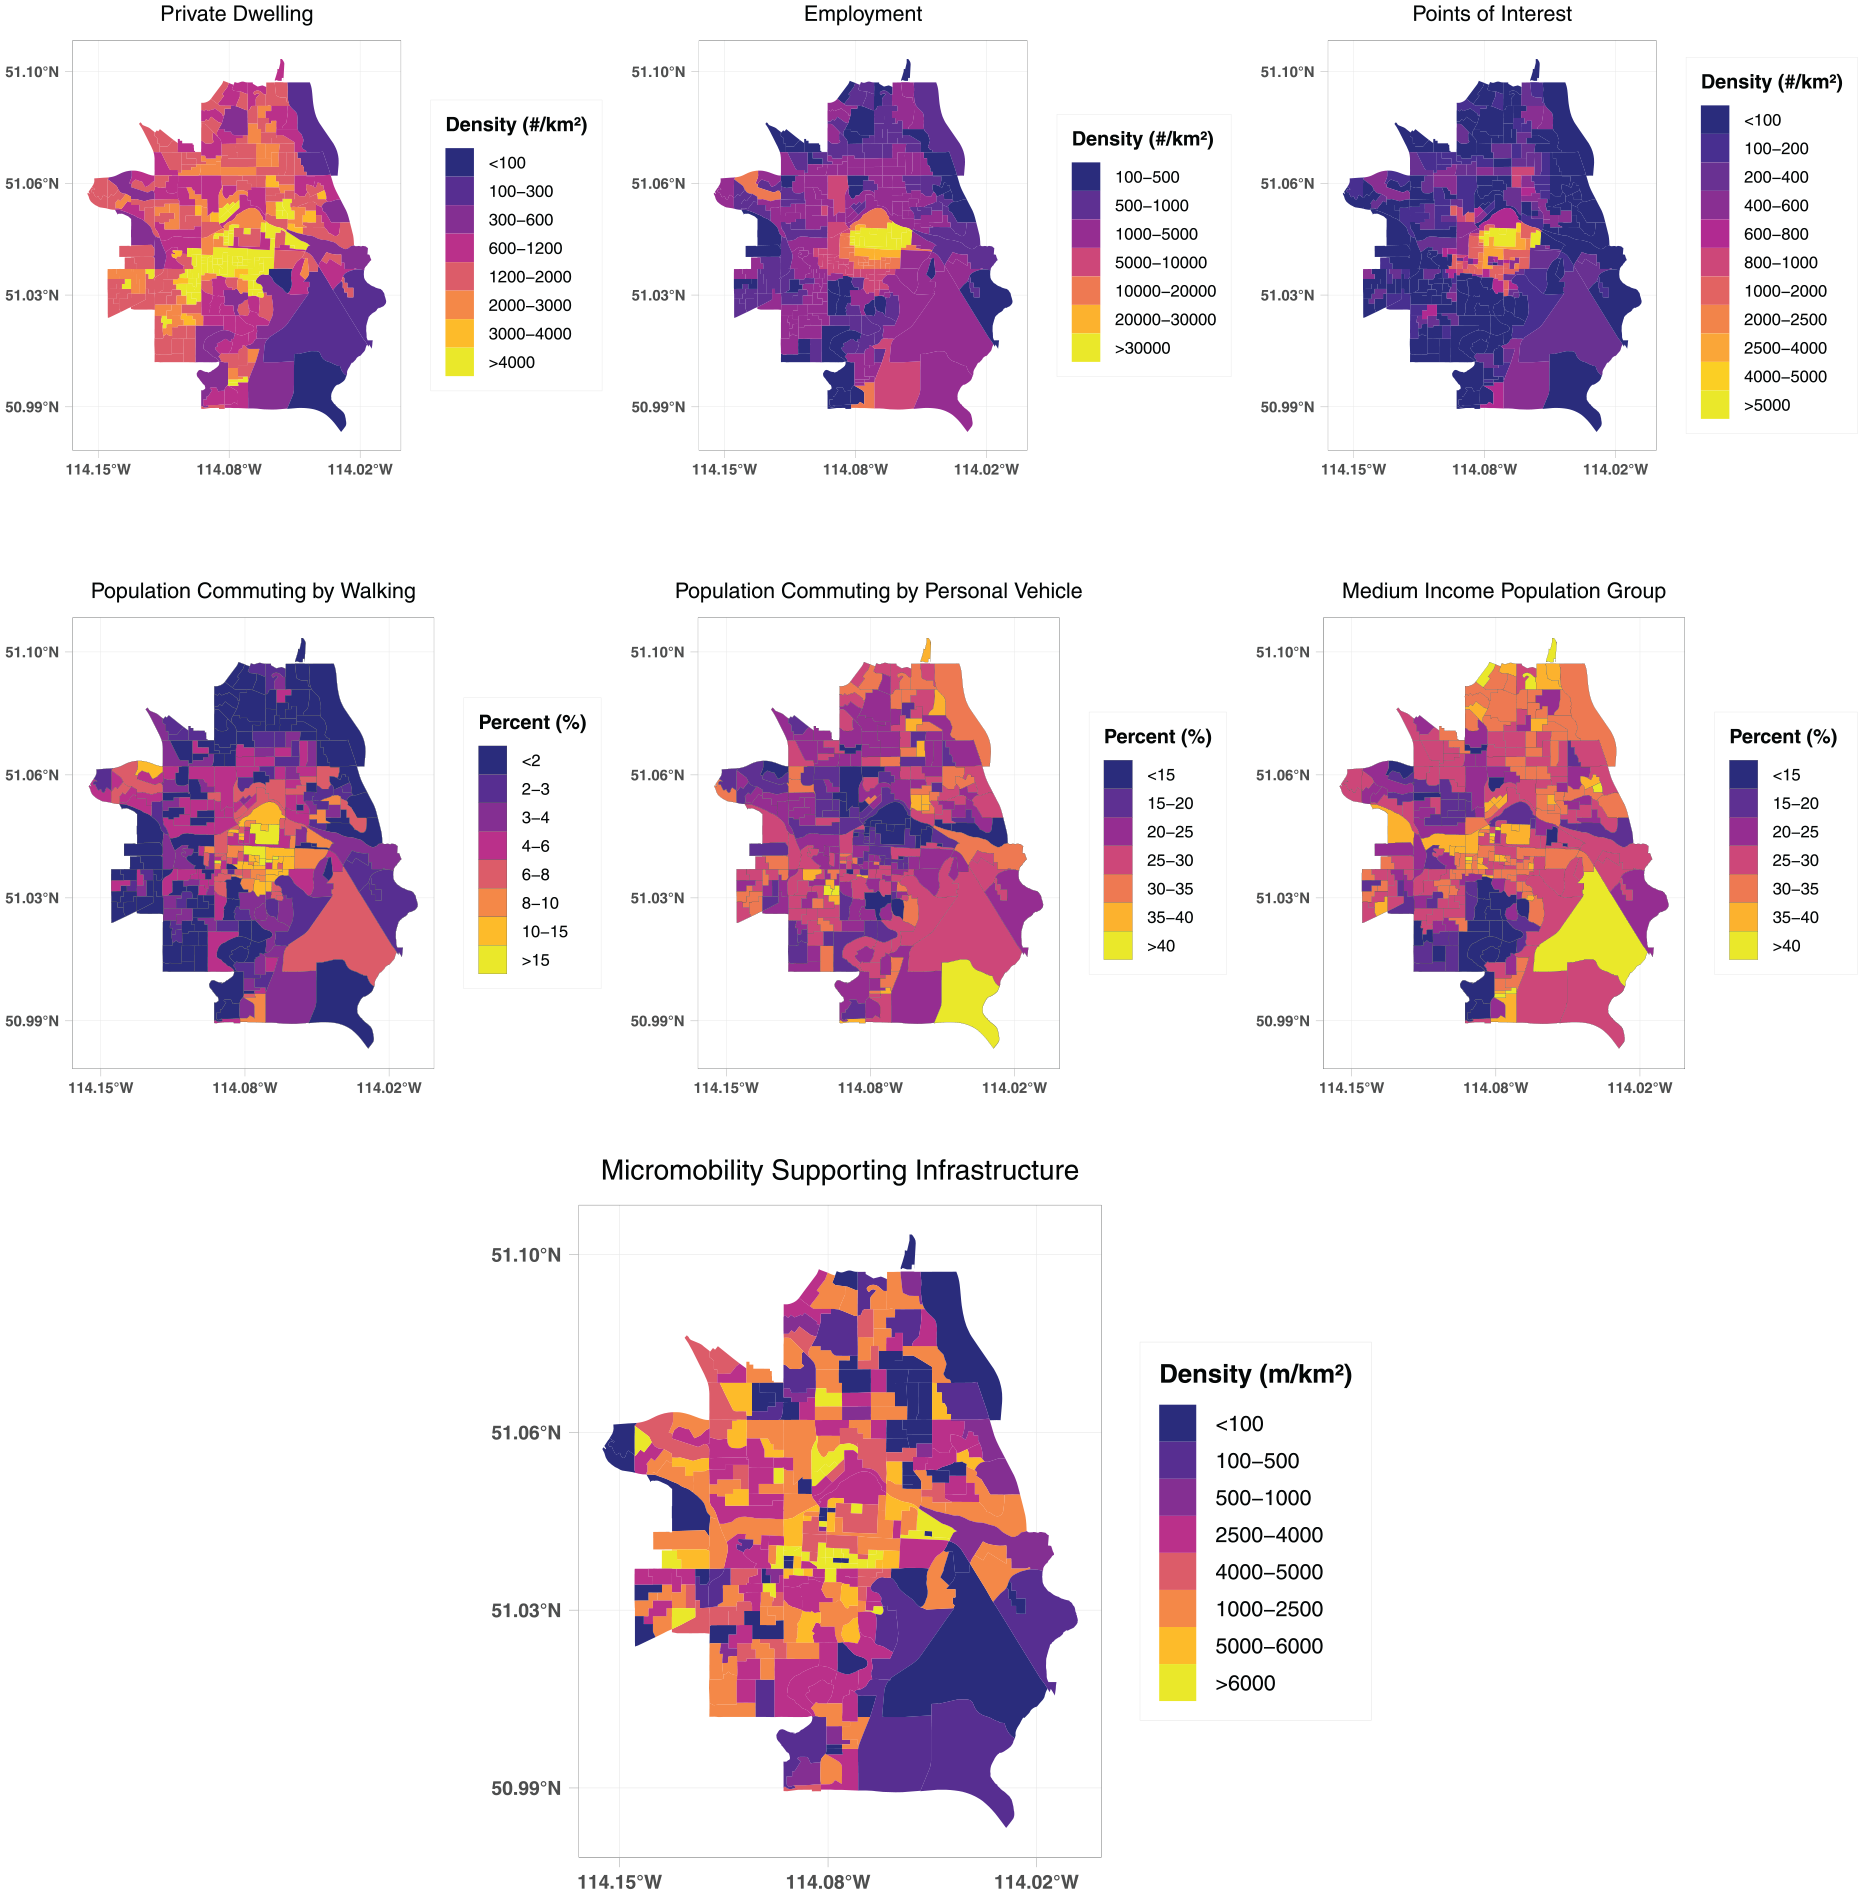
Spatial distribution of determinants of shared micromobility demand, including employment, dwelling, and point-of-interest (POI) densities; percentages of employed labor forces commuting on foot and by personal vehicle, and medium income population group; and micromobility infrastructure density.
Clustering Results
The cluster analysis highlights notable spatial and temporal variations in the first- and last-mile trip patterns within the study area. Specifically, three key weekday patterns emerge from the analysis: a morning peak around 8:00 a.m., a midday peak, and afternoon peaks from 4:00–6:00 p.m.. The morning and afternoon peaks correspond to typical commuting periods. To ensure comparability, the hourly trip counts for each cluster were normalized by their respective maximum hourly trips and subsequently averaged across DA within the corresponding clusters.
As illustrated in Figure 8, the analysis of first-mile trips reveals significant spatial and temporal variations across Clusters 1, 2, and 4 in comparison with Cluster 3, highlighting distinct patterns of micromobility usage. On weekdays, at 1:00 p.m., when Cluster 3 reaches its peak trip volume, Cluster 1, which includes parts of Downtown East Village and the Beltline, exhibits a 31.7% lower hourly trip rate compared with its peak. Peripheral areas represented by Cluster 2 show an even sharper decline of 59.0%, reflecting minimal midday activity in these zones. Cluster 4 records a 24.4% lower trip volume compared with Cluster 3, indicating moderate midday engagement in entertainment and commercial districts. In the afternoon, the spatial dynamics of first-mile trips shift. During the afternoon hours, micromobility usage in Clusters 1, 2, and 4 surpasses that of Cluster 3, which represents the downtown commercial core. Specifically, Cluster 4 exhibits a peak trip volume at 4:00 p.m., Cluster 1 at 5:00 a.m., and Cluster 2 at 6:00 p.m.. These findings underscore significant spatial redistribution of trips, with greater usage in areas outside the city core during evening hours. Figure 8 also indicates that, on weekends, a different pattern emerges. Peak-hour trips occur almost uniformly across all clusters around 4:00 p.m., and the number of hourly trips increases comparatively uniformly regardless of the cluster categories. The distinct afternoon peak around 4:00 p.m. also indicates a shift from weekday commuting behaviors to non-commuting purposes, reflecting the varied nature of micromobility usage based on the day of the week and the purpose of travel. These distinct temporal patterns of first-mile trips underscore the importance of considering localized demand fluctuations in the trip generation model of transportation planning to optimize micromobility services and their connections with the existing transit network.
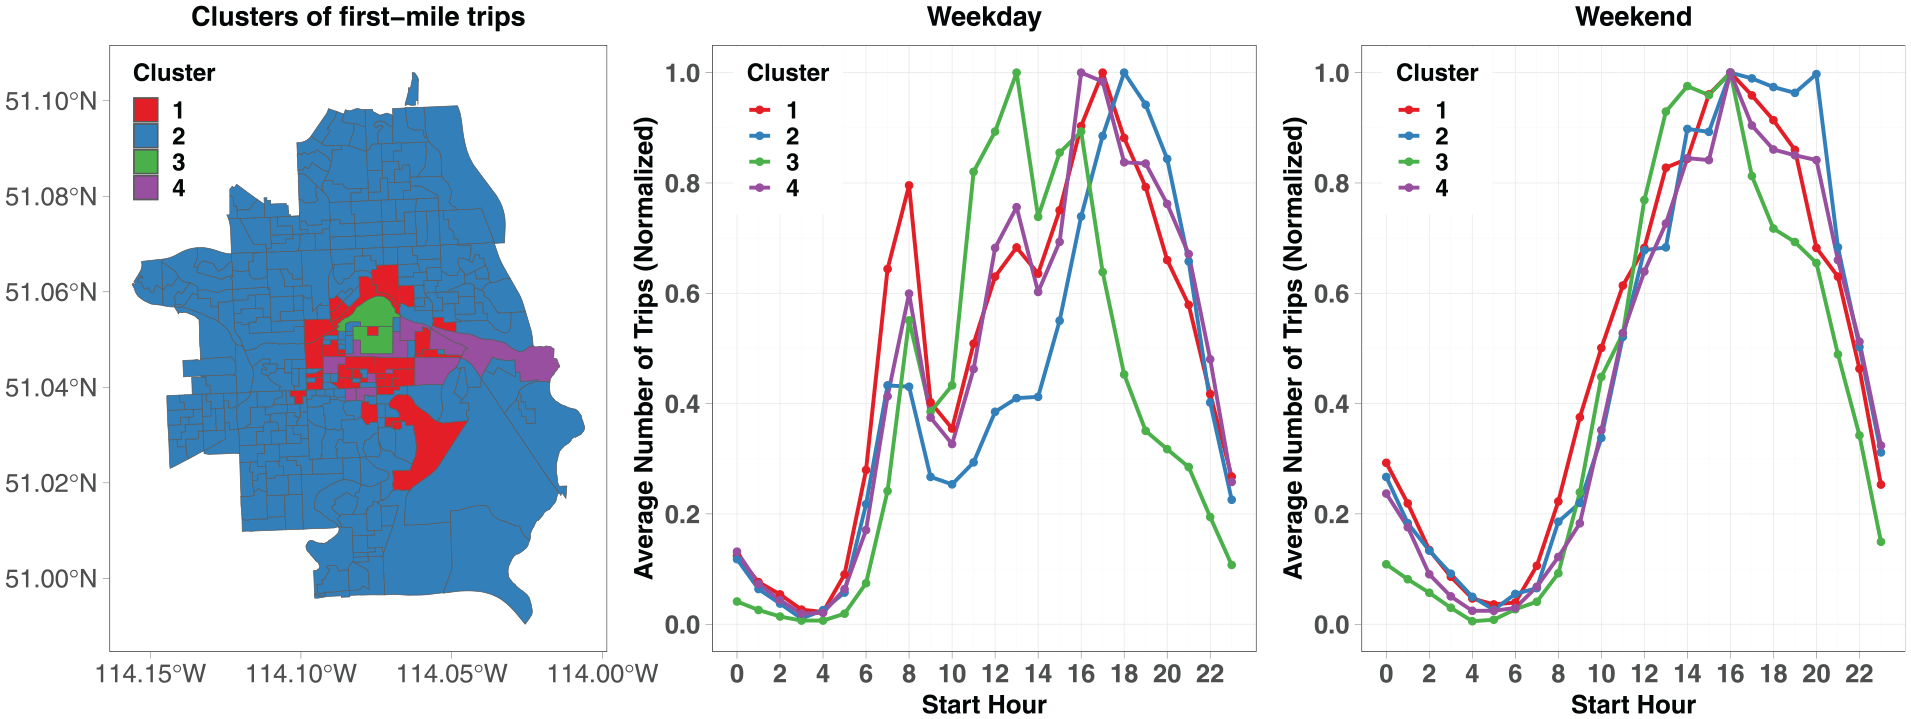
Spatiotemporal clusters of first-mile trips with the corresponding hourly normalized trip averages for weekdays and weekends.
Figure 9 depicts the analysis of last-mile trip clusters and reveals significant temporal divergences characterized by notable variations in trip start hours across Clusters 1, 2, 3, and 4. For the case of last-mile weekday, Cluster 2, representing DAs far from the city center, reaches its peak in the afternoon around 5:00 p.m.. However, as proximity to the city center increases, the peak hour shifts earlier, with Clusters 1 and 4, both peaking at 4:00 p.m. Cluster 3, in contrast, demonstrates a distinct pattern, with its maximum hourly trip volume occurring at 8:00 a.m.. This pattern indicates that shared micromobility is utilized primarily for the last leg of daily commutes to work in this cluster, which corresponds to the downtown area. The trip rate in Cluster 3 declines sharply after 3:00 p.m., indicating a significant decrease in evening micromobility usage for last-mile travel in commuter-heavy commercial zones. In contrast, Cluster 4 experiences increased trip volumes during the evening hours, particularly near recreational areas along the Bow River, likely owing to entertainment activities. For weekend last-mile trips, the analysis reveals relatively uniform trip rates across the study area compared with weekday trips, with a general trend of higher trip volumes in the afternoon. Specifically, as illustrated in Figure 9, Cluster 3 experiences its peak at 1:00 p.m., while Cluster 2 peaks at 5:00 p.m.. Clusters 1 and 4 show their highest activity from 5:00–6:00 p.m. and at 3:00 p.m., respectively. These temporal patterns underscore the varied purposes of micromobility usage, highlighting its adaptability to different land uses across weekdays and weekends.
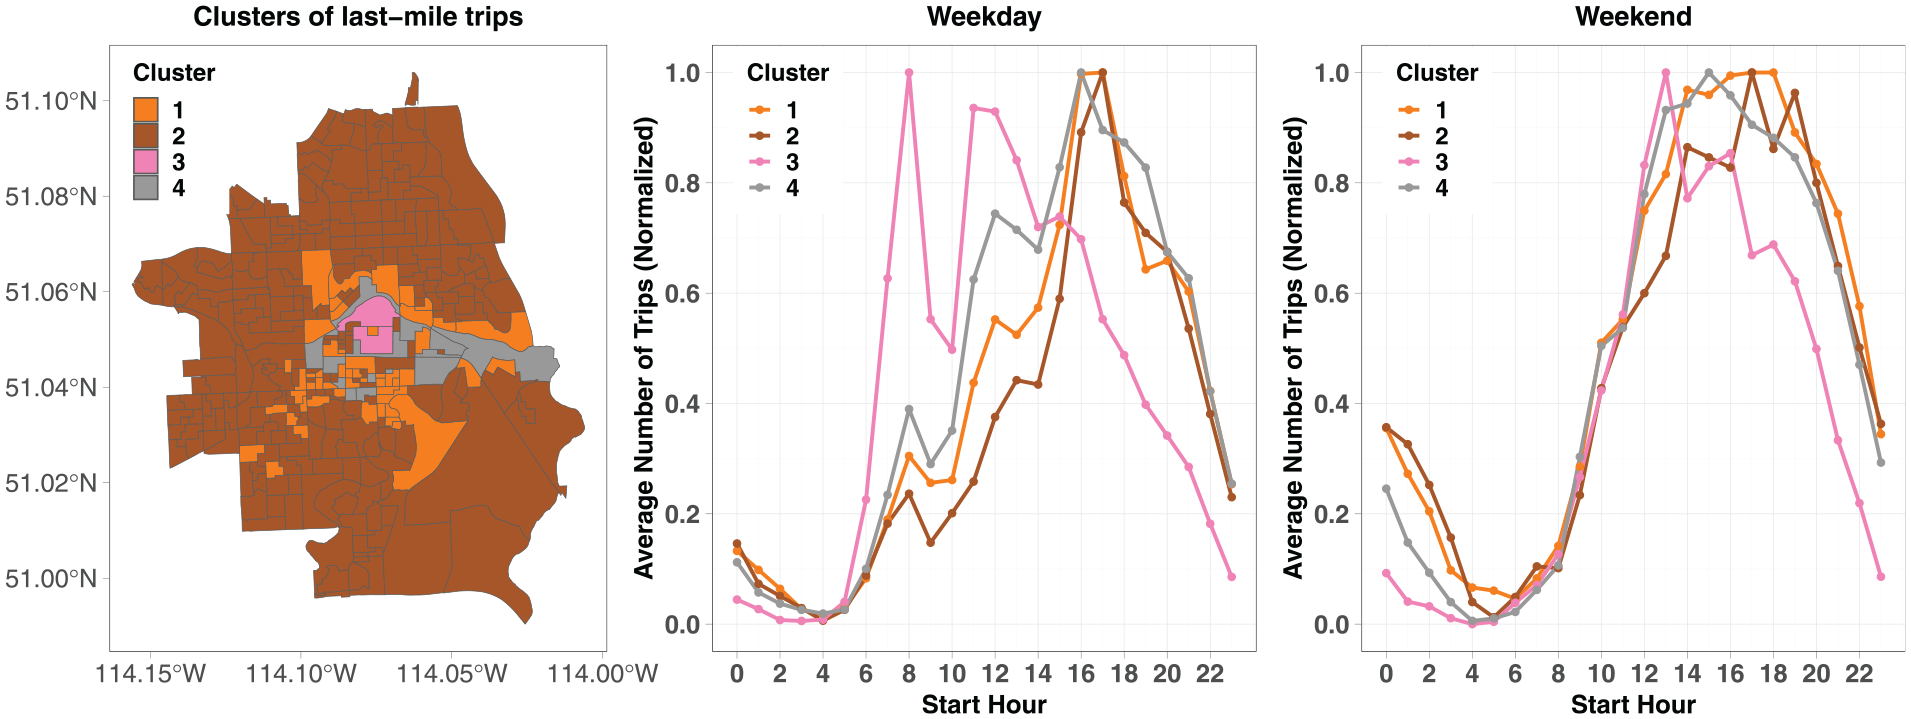
Spatiotemporal clusters of last-mile trips with the corresponding hourly normalized trip averages for weekdays and weekends.
These patterns highlight the need for a tailored shared micromobility deployment strategy that aligns with the distinct trip generation and attraction characteristics of each cluster, emphasizing morning first-mile enhancements in peripheral areas to support commuter access to transit and evening-focused last-mile support in recreational zones to supply leisure-oriented trips. Such an approach can inform the development of a targeted and stratified trip generation and attraction model, enabling more precise forecasting of multimodal transport demand and optimizing micromobility distributions.
Regression Model Results
The regression analyses assessed the impact of various factors on the number of transit-integrated micromobility trips, focusing on first- and last-mile connections during peak and off-peak periods. The independent variables were standardized using z-scores. Thus, each coefficient represents the expected change in shared micromobility trip density associated with a one standard deviation increase in the corresponding predictor, holding other variables constant. In total, six linear regression models were constructed to capture variation in micromobility demand across different time periods: four models for peak hours (first-mile a.m. peak, first-mile p.m. peak, last-mile a.m. peak, and last-mile p.m. peak) and two for off-peak hours (first- and last-mile). As depicted in Tables 2 and 3, the R-squared values across all models ranged from approximately 44–64%, indicating that the models explain a moderate to substantial proportion of the variance.
Parameter Estimates of Regression Models for Peak Hour Trips
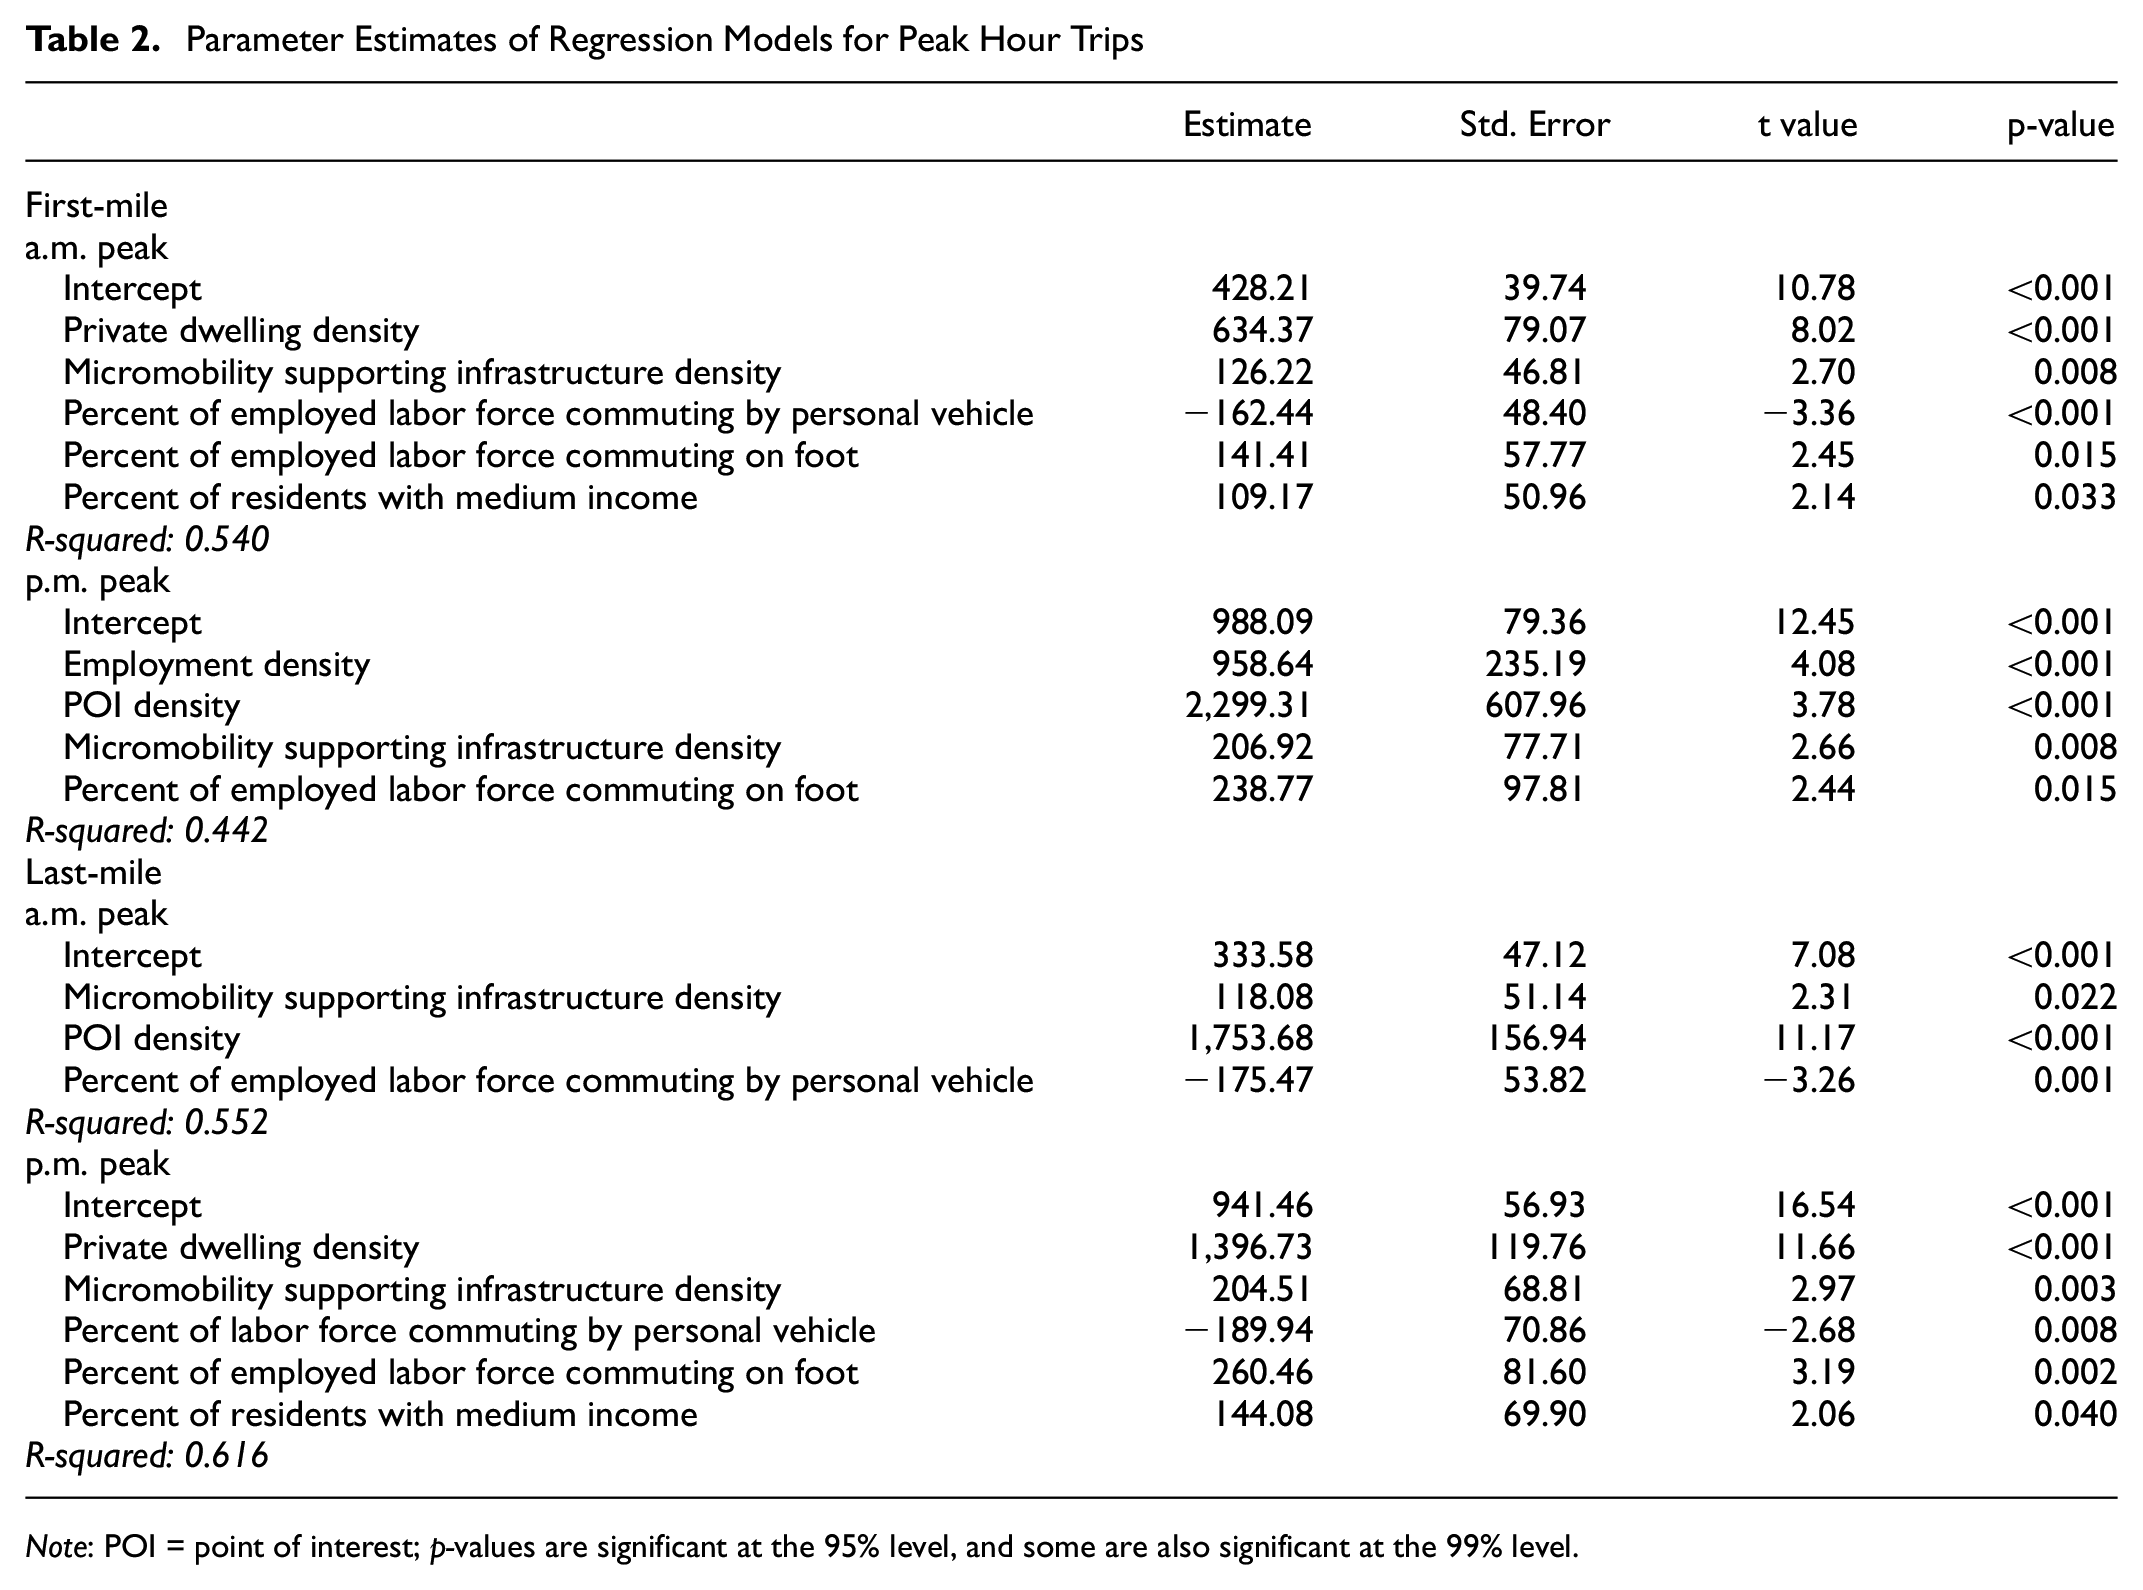
Note: POI = point of interest; p-values are significant at the 95% level, and some are also significant at the 99% level.
Parameter Estimates of Regression Models for Off-Peak Hour Trips
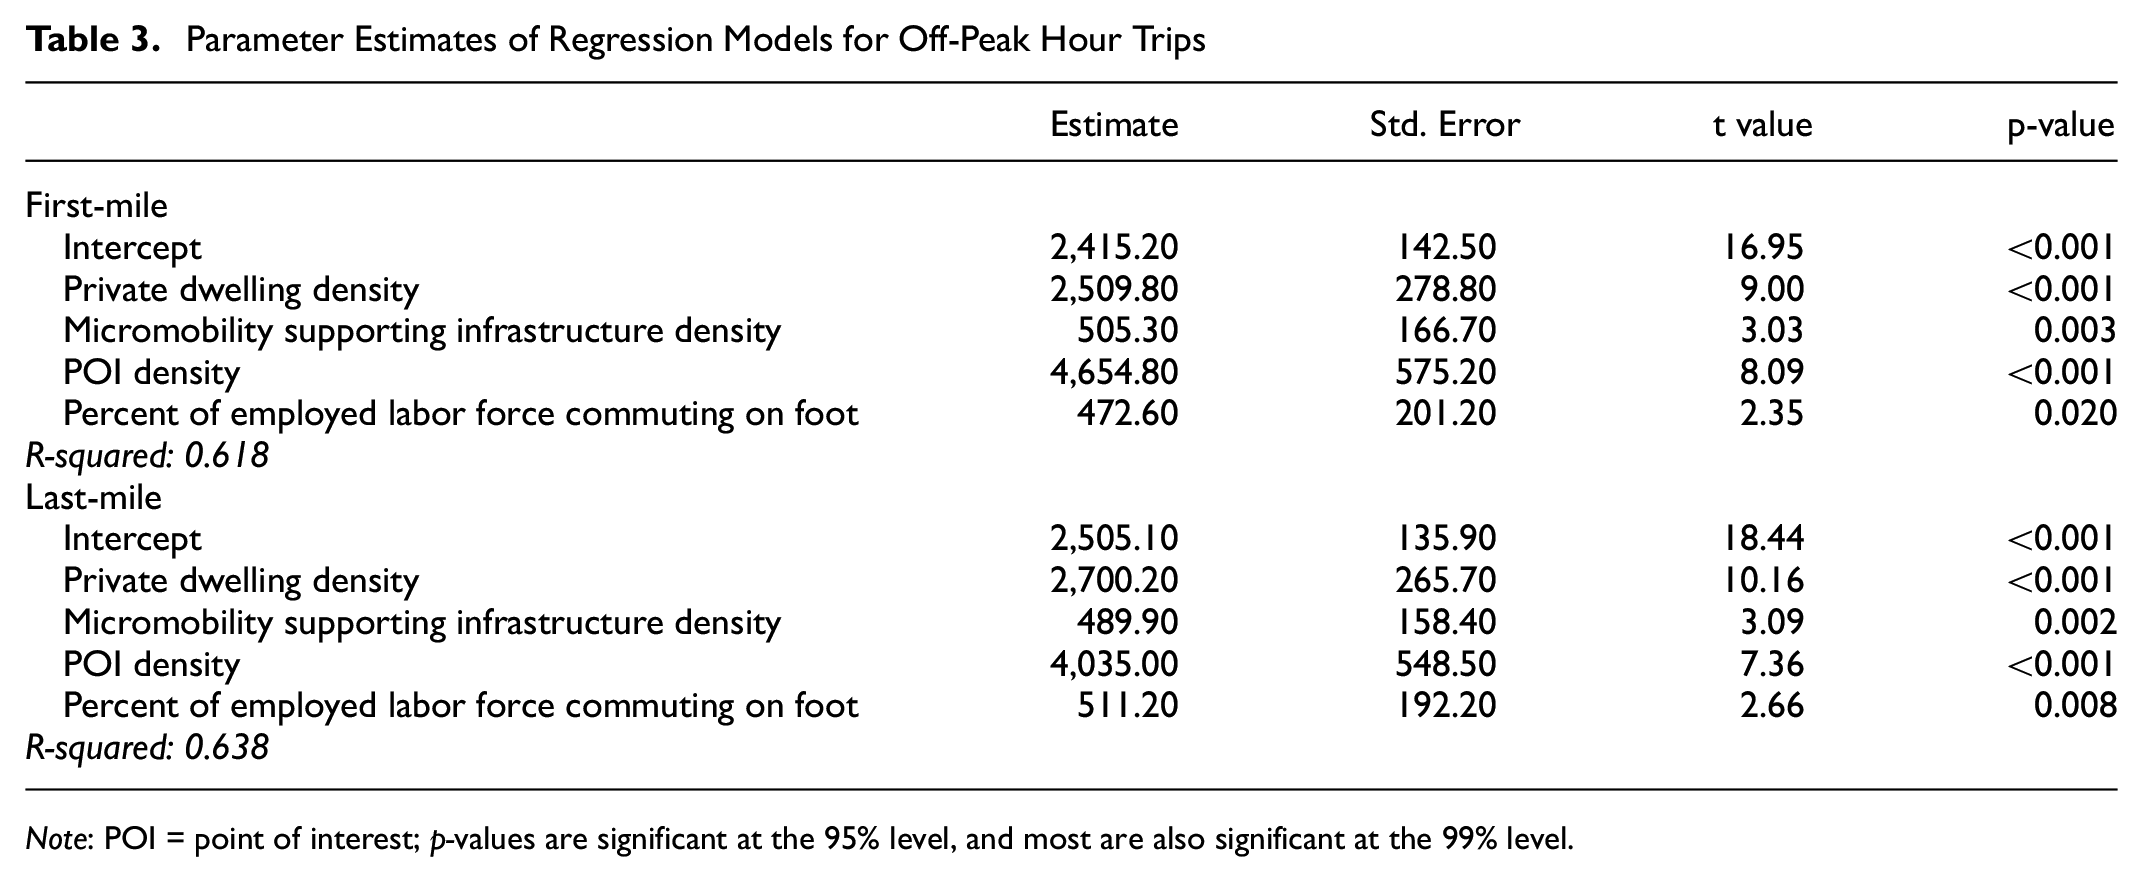
Note: POI = point of interest; p-values are significant at the 95% level, and most are also significant at the 99% level.
In the first-mile a.m. peak model as shown in Table 2, the demand is strongly influenced by dwelling density and socioeconomic characteristics at the trip origin. Notably, private dwelling density is the most influential predictor, indicating that a higher concentration of residences boosts first-mile trips in the morning. Furthermore, micromobility-supporting infrastructure, such as cycle tracks and path connectors, has a significant positive impact, while the percentage of the employed labor force commuting by personal vehicle has a negative effect. This aligns with findings in previous studies ( 64 ) that suggest that greater reliance on personal vehicles diminishes micromobility demand. Conversely, a higher percentage of the employed labor force commuting by walking, along with a medium income, shows a modest positive effect. In the context of the first-mile p.m. peak model, employment and POI density are both strong positive predictors, underscoring the significance of job centers and local amenities in driving micromobility demand at work-related trip origins. Additionally, micromobility-supporting infrastructure and the percentage of the employed labor force commuting by walking also contribute positively, reinforcing the idea that well-connected infrastructure and active commuting behavior increase micromobility demand from work or other origins to transit stations.
Considering the last-mile trip demand, the model as depicted in Table 2 indicates that factors at the trip destination are critical for last-mile a.m. peak trips. Both micromobility-supporting infrastructure and POI density exhibit strong positive effects. In contrast, the percentage of residents commuting by personal vehicle has a significant negative impact, suggesting that areas with higher personal car usage tend to see lower micromobility demand for the last leg of the journey. Moreover, in the last-mile p.m. peak model, similar to the first-mile a.m. peak model, private dwelling density proves to be the strongest predictor, emphasizing that residential areas are critical at the destination end during the evening hours. Likewise, both micromobility supporting infrastructure and the percentage of the population with medium income have significant positive effects. What is more, the negative effect of personal vehicle commuting, along with the positive effect of walking commuters, underscores how commuting behaviors similarly shape both the first-mile a.m. and last-mile p.m. use of micromobility in connection with public transit.
The regression models presented in Table 3 estimate the demand for off-peak first- and last-mile trips, potentially reflecting non-commuting travel. In both models, the densities of POI and private dwellings are the most influential predictors. This indicates that attractions such as shops and recreational destinations drive demand for first- and last-mile travel outside peak hours to or from home. Micromobility-supporting infrastructure density also has statistically significant positive effects in both cases, reinforcing the role of built environment characteristics in facilitating micromobility access to and from public transit stations. Additionally, the percentage of residents commuting by walking is a significant positive predictor in both models, suggesting that areas with more active mobility users are also more likely to boost micromobility-transit adoption during off-peak periods.
Given that shared micromobility services are dockless and spontaneous, users can pick up or drop off vehicles without designated docking stations. Thus, our stratified regression analyses provide valuable policy insights into first- and last-mile micromobility demand. These insights include the importance of investing in micromobility infrastructure, which can significantly improve transport network connectivity. Moreover, the findings inform micromobility services providers and transit operators about demand variations. For instance, in the context of peak-hour trips, a high number of households drive first-mile morning trips and last-mile evening trips, while the employment density boosts first-mile evening trips. This emphasizes the need to integrate micromobility options within residential neighborhoods and employment centers. Additionally, the presence of POIs shows that amenities attract micromobility users, especially during off-peak hours. Furthermore, analysis of commuting modes among employed individuals, particularly during peak hours, indicates that walking is more positively associated with first- and last-mile demand, whereas reliance on personal vehicles is negatively associated with its adoption. These findings offer guidance for planners designing multimodal transportation systems tailored to the unique needs of both commuting and non-commuting travel.
Conclusions
Recently, there has been a worldwide revolution of shared micromobility services, such as dockless e-scooters and e-bikes, and their coopetition relation with conventional public transit has become a focal point of recent research. These emerging mobility services have a higher potential to fill first- and last-mile problems and improve transit coverage. However, the differences and similarities between first- and last-mile trips, as well as factors influencing demand for each type of trip, are areas of ongoing investigation. The current study addresses these gaps by analyzing the spatiotemporal patterns of first- and last-mile trips through a data-driven approach, considering a two-phase methodological approach. Firstly, we identified patterns of integrated trips and conducted an exploratory analysis and k-means clustering of first- and last-mile trips. Secondly, we develop linear regression models to identify the factors influencing first- and last-mile demand and provide valuable insights into the type of integrated trips and the differences in factors affecting each category.
The results pointed out that, from micromobility trips that have been identified to have a connection with public transit, 51.5% of trips are last-mile, with the remaining 48.5% involving first-mile connections. The temporal analysis also revealed that there are variations in first- and last-mile trips by time of day. Specifically, on weekdays, first-mile trips outnumber last-mile trips in the morning peak, indicating micromobility use for commuting access to transit stations. However, throughout the rest of the day, including weekends, last-mile trips are higher. Additionally, the findings indicate that last-mile trips tend to have longer durations and cover greater distances. Notably, the trend also shows that weekend trips are longer. Considering the spatial distribution of integrated trips, both first- and last-mile trips are concentrated downtown, which could be because there are more tourist destinations and other leisure activities.
The clustering analysis highlights distinct spatial and temporal variations in micromobility usage, driven by varying trip generation and attraction dynamics across urban areas. Considering DAs within the same cluster, the results underscore that peripheral areas show high evening demand, emphasizing last-mile connectivity for commuters, while central zones have peak morning usage, reflecting their role in first- and last-mile commutes. Recreational and commercial areas exhibit increased evening and weekend first- and last-mile trips, driven by leisure trips. Moreover, the developed stratified regression model indicates that the built environment and socioeconomic factors consistently influence demand over different times of the day. Private dwelling density is a strong positive predictor in both first- and last-mile models, increasing trips during the first-mile a.m., last-mile p.m., and off-peak periods. A higher density of POI also boosts demand, particularly during the first-mile p.m. peak, first-mile off-peak, last-mile a.m. peak, and last-mile off-peak. Furthermore, improved micromobility infrastructure has a positive impact on all models. In contrast, greater personal vehicle dependency reduces demand during first- and last-mile a.m. peaks, whereas commuting by walking enhances demand. Additionally, higher employment levels stimulate first-mile p.m. peak travel, and areas with a larger proportion of medium-income residents experience increased demand during the first-mile a.m. and last-mile p.m. peaks.
These findings underscore the need for transportation planning to align micromobility infrastructure and services with land-use patterns and temporal demand variations. This enables multimodal transportation planning and optimizes its role in both commuting and leisure travel contexts. However, the current study has some limitations that can be addressed in future studies. Firstly, our study focuses on identifying integrated micromobility trips based on their spatial connections with the transit network and by considering the Euclidean buffer distances. Thus, future studies would conduct a more in-depth analysis that considers the actual network distances and the difference in transit schedules with the pickup and drop-off times of micromobility to check the transfer times. Secondly, our current methodology focuses on exploring the potential connections of micromobility trips to transit based on their proximity to stations. However, this approach has limitations, as some trips identified as connected may actually be regular trips to POIs near transit stations rather than true connections to the transit system. Therefore, future research could combine our approach with user survey data for more comprehensive insights. The third limitation of the current analysis is the combined analysis of shared micromobility data for both bikes and scooters. Although these two modes share similar operational characteristics, scooters accounted for over 96% of the recorded trips in our datasets; as a result, the combined analysis may have masked unique trip patterns specific to bikes. Furthermore, owing to the limited number of LRT lines in Calgary, the integration of micromobility with bus and LRT systems is analyzed together; future studies could, however, examine the distinct roles of these transit modes in first- and last-mile trips in cities with more extensive rail networks. Lastly, our dataset is a three-month dataset from July to September 2019, which predates the pandemic and may not fully capture the changes in travel behavior that have emerged in the post-pandemic era. Future studies could explore how first- and last-mile trip patterns have evolved with increased remote work, and seasonal and weather variations, offering valuable insights into micromobility demand in an evolving urban landscape. Besides, our findings reflect data from the early stages of shared mobility in Calgary, which may influence user behavior differently than in a more developed market. Future studies should compare current user profiles and trip patterns to track changes over time.
Footnotes
Author Contributions
The authors confirm their contribution to the paper as follows: study conception and design: Abebe Dress Beza, Merkebe Getachew Demissie, and Lina Kattan; data collection: Abebe Dress Beza, Merkebe Getachew Demissie, and Lina Kattan; analysis and interpretation of results: Abebe Dress Beza, Merkebe Getachew Demissie, and Lina Kattan; draft manuscript preparation: Abebe Dress Beza; Funding: Merkebe Getachew Demissie and Lina Kattan. All authors reviewed the results and approved the final version of the manuscript.
Declaration of Conflicting Interests
The authors declared no potential conflicts of interest with respect to the research, authorship, and/or publication of this article.
Funding
The authors disclosed receipt of the following financial support for the research, authorship, and/or publication of this article: This work is partially funded by the NSERC Discovery grant RGPIN/03037-2022; the NSERC CREATE on Integrated Infrastructure for Sustainable Cities (IISC) (CREATE/511060-2018); the Schulich School of Engineering Startup Grant (Project # 11-20100-10032261); and by Mitacs through the Mitacs Accelerate program with application ref.: IT36601.