
Abstract
The economic and environmental benefits of incorporating recycled asphalt materials (RAMs) into new asphalt mixtures are achieved only if the durability of the asphalt mixtures is maintained. This study, conducted under National Cooperative Highway Research Program project 09-65, aims to evaluate the durability of asphalt mixtures with high RAM contents, considering component materials, mitigation strategies, and balanced performance. The evaluation included existing mix designs with variable RAM contents typically produced in each U.S. climatic zone (north/freeze and south/no freeze). In addition, this study considered alternative binders, partial RAM binder availability, a bio-based recycling agent, a liquid anti-stripping agent, and lime as potential strategies to improve the durability of high RAM asphalt mixtures. Four sets of experiments were selected to address the primary durability issues (surface cracking, moisture susceptibility, and raveling), while verifying rutting resistance for balanced performance. The results indicate that the high RAM strategies required to improve cracking performance can still result in durable asphalt mixtures within the context of a balanced mix design. In addition, the results show that liquid anti-stripping agents and lime are effective in improving the moisture resistance of the recycled mixtures. Finally, two screening tools based on component materials and mix design parameters are proposed to preliminarily evaluate the moisture resistance of high recycled binder ratio asphalt mixtures. Overall, this study provides valuable tools and guidelines for the evaluation and design of durable asphalt mixtures, focusing on those with high RAM contents and balanced performance.
Keywords
The use of recycled asphalt materials (RAMs) in asphalt mixtures has significant economic and environmental benefits because it limits the use of nonrenewable resources and reduces production costs. In 2021, savings of more than US$3.5 billion were obtained in the U.S.A. from using 94.6 million tons of reclaimed asphalt pavement (RAP) and 0.6 million tons of recycled asphalt shingles (RAS) in new asphalt mixtures. Similarly, during the same year, 26 million barrels of binder, 89 million tons of virgin aggregate, and nearly 62 million cubic yards of landfill space were preserved by substituting natural aggregate and virgin binder with RAP ( 1 ).
Despite the promising benefits of using RAM, the lack of knowledge and experience in the inclusion of high RAM contents (i.e., greater than 25%) in new asphalt mixtures restricts its use ( 2 ). This practice is often limited or even prohibited by state departments of transportation (DOTs) because of durability issues and failures at early service life ( 3 ). Asphalt mixture durability refers to the ability of the material to withstand traffic loading and environmental conditions while maintaining its structural integrity ( 4 ). Specifically, there is a concern that stiffening and embrittlement of the asphalt mixture from large RAM quantities can negatively affect durability, leading to issues such as surface cracking, moisture damage, and raveling ( 5 , 6 ). Thus, the maximum amount of RAM is usually restricted with respect to the recycled binder ratio (RBR), which corresponds to the proportion by weight of the recycled binder from RAP and/or RAS (PbRAP, PbRAS) and the total binder (PbTotal) in the asphalt mixture, as defined in Equation 1:
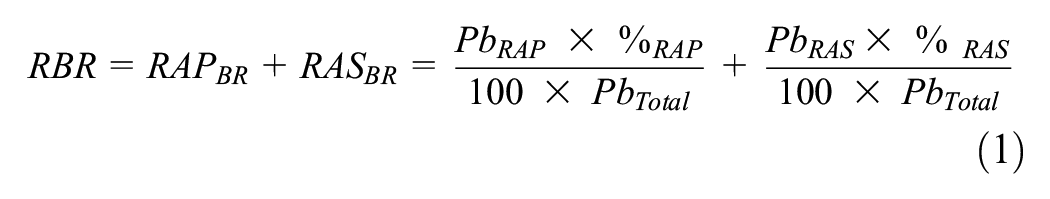
where
Different strategies are being studied to maximize the use of RAM, minimize the negative effects of high RAM contents in asphalt mixtures, and improve durability ( 7 , 8 ). These mitigation strategies, namely, high RAM or moisture strategies, are oriented toward improving cracking, moisture, and raveling resistance. These strategies include substituting the virgin binder with a binder from a different source, incorporating softer or polymer-modified asphalt (PMA) binders, and including additives to reduce asphalt mixture stiffness or improve moisture resistance. Other strategies include increasing the effective binder content by changing the aggregate gradation and mix design requirements, or reducing the amount of binder considered available from the incorporated RAM.
Past studies have assessed recycled asphalt mixtures and identified that the critical cracking temperature of the binders recovered from mixtures with RAP were around 7°C warmer than those recovered from control mixtures without RAP. The results suggest that the use of softer binders with respect to performance grade (PG) is favorable for asphalt mixtures containing more than 25% RAP, and a change in the binder grade may be necessary for either the high-temperature performance grade (PGH) or both the PGH and low-temperature performance grade (PGL) ( 9 , 10 ). In addition, a previous study evaluated recycled binder blends made with the same virgin binder with respect to PG but with different sources ( 11 ). The results showed that recycled binder blends made with binder from a source with improved ΔTc, defined as a less negative or positive difference between the continuous critical PGL based on stiffness (S) and relaxation (m), showed better rheological properties and aging resistance. Both approaches demonstrate that binder grade and binder source play a role in the performance of binders and mixtures and support the idea that substituting binders may improve the durability of asphalt mixtures with high RAM contents.
The incorporation of a PMA binder has been shown to improve the rutting and cracking resistance of asphalt mixtures with RAM when compared to mixtures with unmodified binders. Bonicelli et al. ( 12 ) evaluated the durability of mixtures with 40% RAP and PMA binder and demonstrated a significant reduction of rutting potential in mixtures with PMA when compared to the control mixture with unmodified binder. Similarly, previous studies have found that mixtures with up to 30% RAP and PMA binders show increased cracking resistance compared to mixtures with unmodified binders. Thus, these studies support the possibility of using polymer modification to mitigate the negative effects of RAM on the cracking resistance of asphalt mixtures ( 13 , 14 ).
Additional studies have evaluated the incorporation of additives, such as warm-mix asphalt (WMA) or recycling agents (RAs), in asphalt mixtures with RAM. These studies have demonstrated a substantial reduction in the stiffness of high RAM mixtures with additives. Tran et al. ( 15 ) evaluated mixtures with up to 40% RAP and RAs. The results showed that RAs yielded a statistically equivalent cracking resistance to the mixtures with 30% RAP without affecting rutting and moisture resistance. Similarly, Kaseer et al. ( 16 ) evaluated rejuvenated 0.30 RBR asphalt mixtures and found an equivalent stiffness as the virgin mixture. Other studies evaluated mixtures with 30% RAP and found that RAs reduced rutting resistance but did not produce less resistance than the virgin mixture without recycled materials, while also meeting the minimum rutting requirements ( 17 , 18 ). With respect to moisture susceptibility, different studies have reported varying results with respect to the effect of additives on moisture resistance, ranging from equivalent to improved or reduced. Previous studies found similar and better moisture resistance for mixtures with RAP incorporating WMA or RAs, with improved performance when using anti-stripping agents (ASAs) such as hydrated lime or liquid anti-stripping (LAS) agents ( 19 , 20 ). In contrast, Shu et al. ( 20 ) found that mixtures with 30% RAP and WMA showed similar or reduced moisture resistance compared to mixtures with no additives and the same RAP content. The results varied according to the moisture conditioning procedure, the RAP content, and the evaluation parameters.
An alternative strategy to improve the durability of mixtures with high RAM contents includes increasing the effective binder content. This can be achieved by decreasing the amount of recycled binder availability (RBA) obtained from RAP or RAS, which contributes to the overall binder content in the mixture and is often assumed to be 100%. By decreasing the RBA, additional virgin binder is added into the mixture to achieve a corrected optimum asphalt content (COAC), a strategy implemented by Georgia and South Carolina DOTs to improve cracking resistance ( 21 ). In addition, this approach supports past studies indicating that recycled binders are partially available, and partial blending occurs in mixtures incorporating RAM ( 22 ). The selection of a suitable decreased RBA value is critical for preventing insufficient coating, which often causes durability issues. Previous studies have shown that 60% and 75% decreases in RBA resulted in better cracking resistance while maintaining satisfactory rutting resistance ( 21 ). Other studies have proposed parameters to determine RBA, such as the degree of activity (DoA) or RAP binder availability factor (BAF) ( 11 , 23 , 24 ). Both approaches showed similar results and reasonable agreement, but the DoA approach may be more practical ( 25 ).
Mixture durability is typically assessed in the laboratory via conditioning protocols and performance tests designed to capture the effects of air, water, and traffic on cracking, moisture, and raveling resistance. The interaction of the binder with the air in the environment results in oxidative aging. This chemical reaction increases the brittleness, which, in combination with the intrinsic brittleness of aged binders from RAM, results in mixtures that are more prone to cracking. Different short- and long-term aging protocols are conducted in the laboratory to simulate aging. The most recent version of American Association of State Highway and Transportation Officials (AASHTO) R 30 ( 26 ) recommends a short-term oven aging (STOA) protocol of 2 h at 135°C, and multiple long-term oven aging (LTOA) protocols are now defined in AASHTO R 121 ( 27 ). However, previous studies found that longer LTOA protocols are not practical and shorter oven aging procedures using loose mixture are now options ( 28 – 30 ). For instance, Chen et al. ( 30 ) found that a mid-term critical aging protocol of 5 d at 95°C or 8 h at 135°C represents approximately 4 years of field aging in warm climate regions. Other state projects conducted in colder climates recommended 6 h at 135°C or 3 d at 95°C as a shorter mid-term critical aging procedure based on oxidative aging modeling ( 31 , 32 ). Finally, the indirect tensile asphalt cracking test (IDEAL-CT) per ASTM D8225 has been rapidly adopted to evaluate the cracking resistance of mixtures and has been proven to capture the effect of important mix design and service variables such as binder content, binder type, RAM content, aging conditions, and air voids ( 14 , 33 ).
Water and traffic loading are two additional factors that affect durability. The interaction between water and mechanical loading degrades the mixture and reduces its stiffness with the extreme result of stripping, which is defined as the loss of adhesion between the aggregate and binder. In addition, moisture accelerates other types of distress, such as rutting, cracking, and raveling ( 34 ). The most common methods to evaluate moisture damage by DOTs are the modified Lottman per AASHTO T 283 and the Hamburg wheel-tracking test (HWTT) per AASHTO T 324, which simultaneously evaluates moisture and rutting resistance ( 35 – 37 ). Traffic loading, in combination with mix design- and materials-related issues and environmental conditions, can produce raveling, defined as the dislodgment of aggregate particles and loss of binder at the pavement surface. This durability-related distress is typically quantified through the Cantabro test per AASHTO T 401 ( 38 ). The Cantabro test is widely used to evaluate the durability of open-graded or porous friction courses, but recent studies have found that it is also useful for providing durability indices of dense-graded mixtures because it captures volumetric and component material differences ( 39 , 40 ). Similarly, other studies have found that the Cantabro test with combined aging and moisture protocols better represented field tendencies than individual conditioning protocols ( 41 , 42 ).
Despite previous research efforts, some aspects of the durability of asphalt mixtures with high RBRs have not been fully explored or addressed. In particular, the durability of mixtures with high RAM contents, with or without high RAM strategies, remains uncertain. Although previous studies have addressed the durability of mixtures by evaluating the primary durability issues individually (i.e., cracking, moisture damage, and raveling), there is a need for a comprehensive durability assessment of all three primary issues for the same high RBR mixtures within the context of balanced mix design (BMD). BMD is a promising method for the design and characterization of mixtures with RAM because it accounts for the quality of the blended binder and its interaction with additives if used ( 33 ). Previous and ongoing projects have advanced the implementation of BMD to increase the durability of asphalt mixtures while optimizing RAM utilization ( 43 – 46 ). This study, conducted under National Cooperative Highway Research Program (NCHRP) project 09-65, is a collaborative effort between the Texas A&M Transportation Institute (TTI) and the National Center for Asphalt Technology (NCAT), which aims to evaluate the durability of asphalt mixtures with high RBRs, addressing the three primary issues. Bairgi et al. ( 47 ) documented and published initial results aimed to evaluate the cracking performance of specific mixtures included in this study using the IDEAL-CT. This study complements and presents the subsequent laboratory testing and analysis utilizing the mixtures examined by Bairgi et al. ( 47 ) and some additional ones. This study addresses issues such as rutting, raveling, and moisture susceptibility, with particular emphasis on moisture susceptibility, aiming to produce a more comprehensive durability evaluation of high RBR mixtures by assessing the component materials and corresponding performance.
Objectives and Scope
The specific objectives of this study are as follows.
1) Assess the durability of asphalt mixtures with high RBRs by implementing practical test methods and protocols specific to particular climatic zones and preliminary thresholds within the context of BMD.
2) Evaluate the durability of high RBR asphalt mixtures by exploring relationships between durability parameters and the properties of component materials, their proportions, and strategies to improve performance.
Materials
For this study, the selection of component materials, including virgin aggregates, binders, and RAMs, was tied to each climatic zone of the U.S.A. (north/freeze and south/no freeze), separated at the 40th parallel north as suggested in NCHRP project 09-52A ( 28 ). Moisture-resistant and moisture-susceptible aggregates, RAP, and RAS materials were sampled to produce the 10 existing mix designs listed in Table 1. These mix designs denote actual asphalt mixtures produced in the field with typical and high RBRs, defined for this study as mixtures with RBRs of less than 0.3 and between 0.3 and 0.5, respectively. The selected mix designs represent four aggregate sources associated with four RAP sources and two RAS sources as follows:
north moisture-resistant (NR) aggregate with northeast (NE) RAP and RAS;
north moisture-susceptible (NS) aggregate with Midwest (MidW) RAP and MidW RAS;
south moisture-resistant (SR) aggregate with southeast1 (SE1) RAP; and
south moisture-susceptible (SS) aggregate with southeast2 (SE2) RAP.
Existing Mix Designs and Component Materials with Varying Recycled Binder Ratios (RBRs)
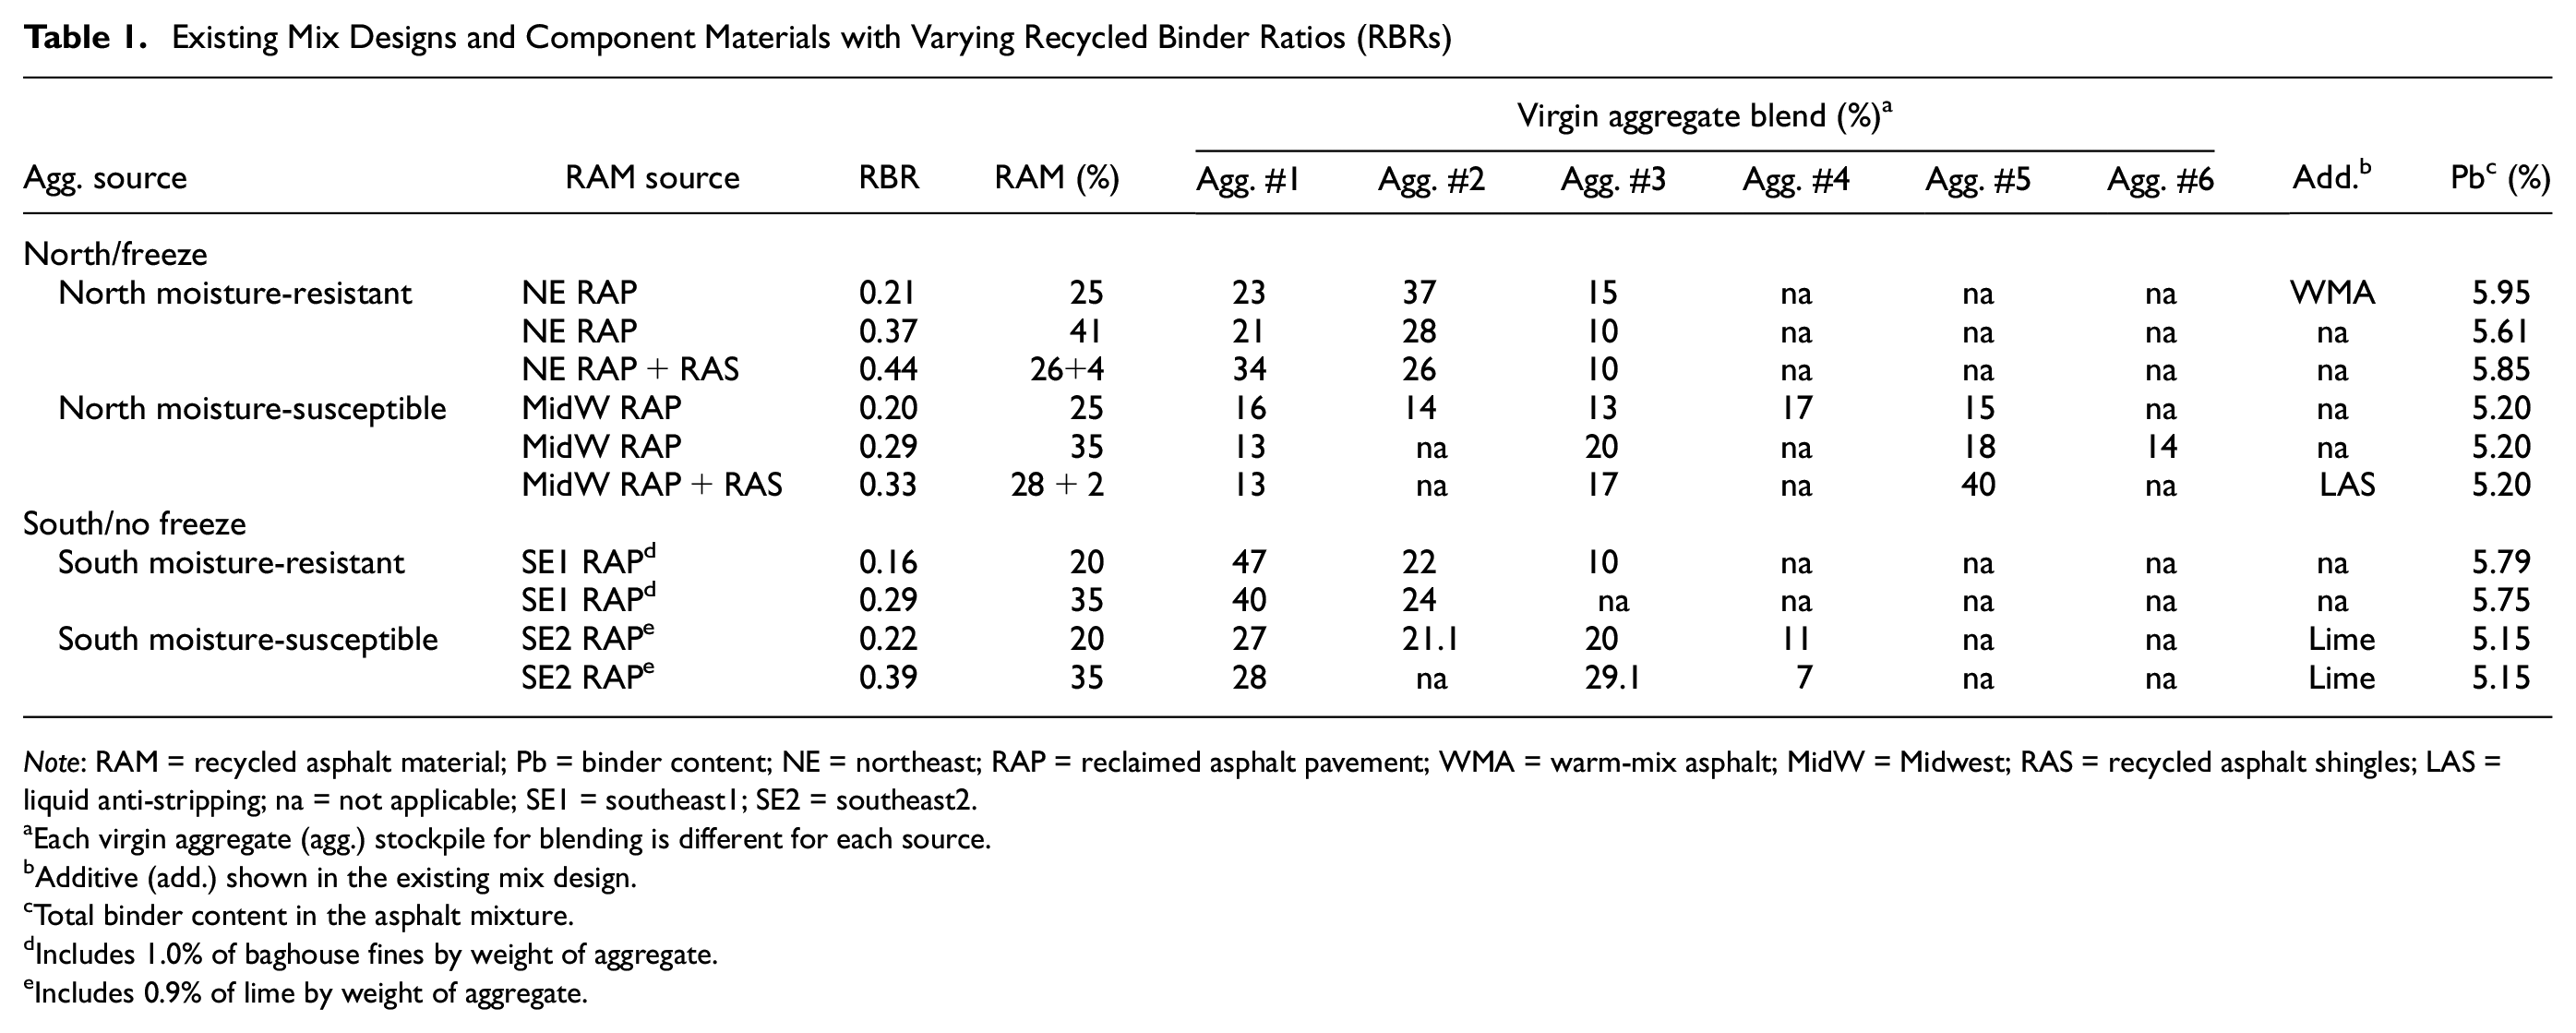
Note: RAM = recycled asphalt material; Pb = binder content; NE = northeast; RAP = reclaimed asphalt pavement; WMA = warm-mix asphalt; MidW = Midwest; RAS = recycled asphalt shingles; LAS = liquid anti-stripping; na = not applicable; SE1 = southeast1; SE2 = southeast2.
Each virgin aggregate (agg.) stockpile for blending is different for each source.
Additive (add.) shown in the existing mix design.
Total binder content in the asphalt mixture.
Includes 1.0% of baghouse fines by weight of aggregate.
Includes 0.9% of lime by weight of aggregate.
Aggregate blends incorporate stockpiles that are specific to each aggregate source. Thus, the mix designs are formulated using different proportions of the same stockpiles from each source to produce varying RBRs. Asphalt mixtures with moisture-susceptible aggregates correspond to those that require an ASA (i.e., LAS or lime) to improve moisture resistance, as shown in the existing mix design. Finally, all mix designs correspond to Superpave mixtures with 9.5 mm nominal maximum aggregate size (NMAS) for the mixtures with NR and SR aggregates and 12.5 mm NMAS for the mixtures with NS and SS aggregates.
Durability properties of the virgin aggregates associated with the four aggregate sources (with multiple stockpiles) were collected from online databases, provided by DOTs, or both (Table 2). These properties were gathered to identify the influence of the component materials on asphalt mixture durability. The properties collected include freeze–thaw (F/T) soundness, Los Angeles abrasion (LAA), sand equivalent (SE), sodium or magnesium sulfate (NaSO4, MgSO4) soundness, and water absorption capacity (AggAbs). In general, the south aggregates (SS, SR) exhibited a higher abrasion loss by LAA test than the north aggregates (NR, NS). Data also showed a wide range of granites with respect to sodium or magnesium sulfate soundness with values ranging from 0.1 to 1.6, while gravels were more consistent. In addition, one dolomite aggregate showed high F/T soundness. Lastly, the AggAbs values ranged from 0.5 and 1.0 for all sources, but none of them were as high as explored in previous NCHRP project 09-52 ( 48 ).
Available Durability Properties of Virgin Aggregates
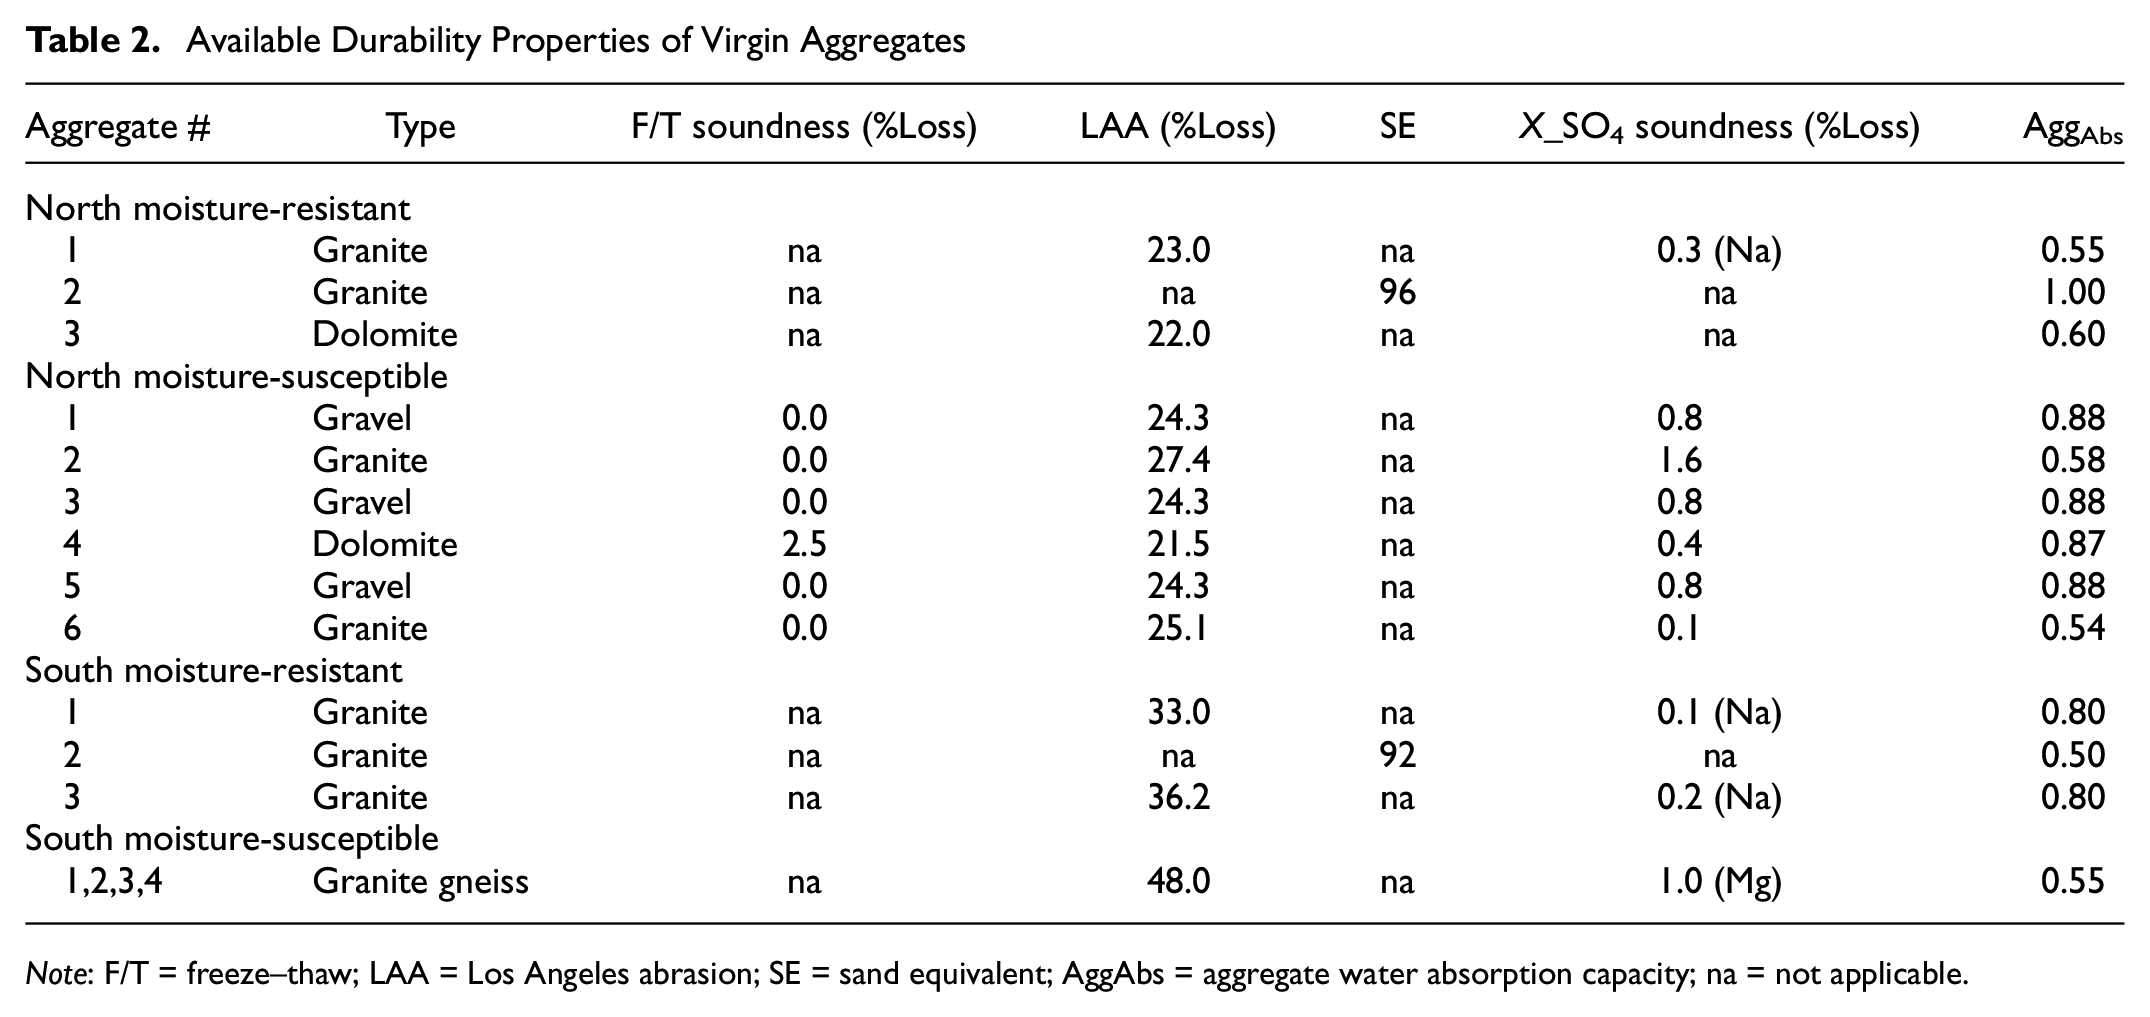
Note: F/T = freeze–thaw; LAA = Los Angeles abrasion; SE = sand equivalent; AggAbs = aggregate water absorption capacity; na = not applicable.
Different binders were utilized in each asphalt mixture as control binders to evaluate the effect of binder substitution as a high RAM strategy (Table 3). Conventional Superpave PG rheological parameters were determined using the dynamic shear rheometer (DSR) and bending beam rheometer (BBR) at the corresponding aging condition. Specifically, these parameters include binder PGH for unaged and rolling thin film oven (RTFO) aged binders per AASHTO T 240 ( 49 ) and PGL and ΔTc for pressure aging vessel (PAV) aged binders per AASHTO R 28 (PAV20) ( 50 ). The commonly used PG 58-28 and PG 64-22 virgin binders with low recycling capacity (low ΔTc) were used as control binders for the north/freeze and south/no freeze climatic zones, respectively. For this study, virgin binders with low ΔTc after PAV20 refer to values less than +0.5 or negative. In addition, according to the climatic zone, softer binders with ΔTc of +2.5 and +2.0 and PMA binders with ΔTc values equal to −0.6 and −1.0 were utilized in this study as high RAM strategies.
Control Binders Employed for Asphalt Mixture Evaluation
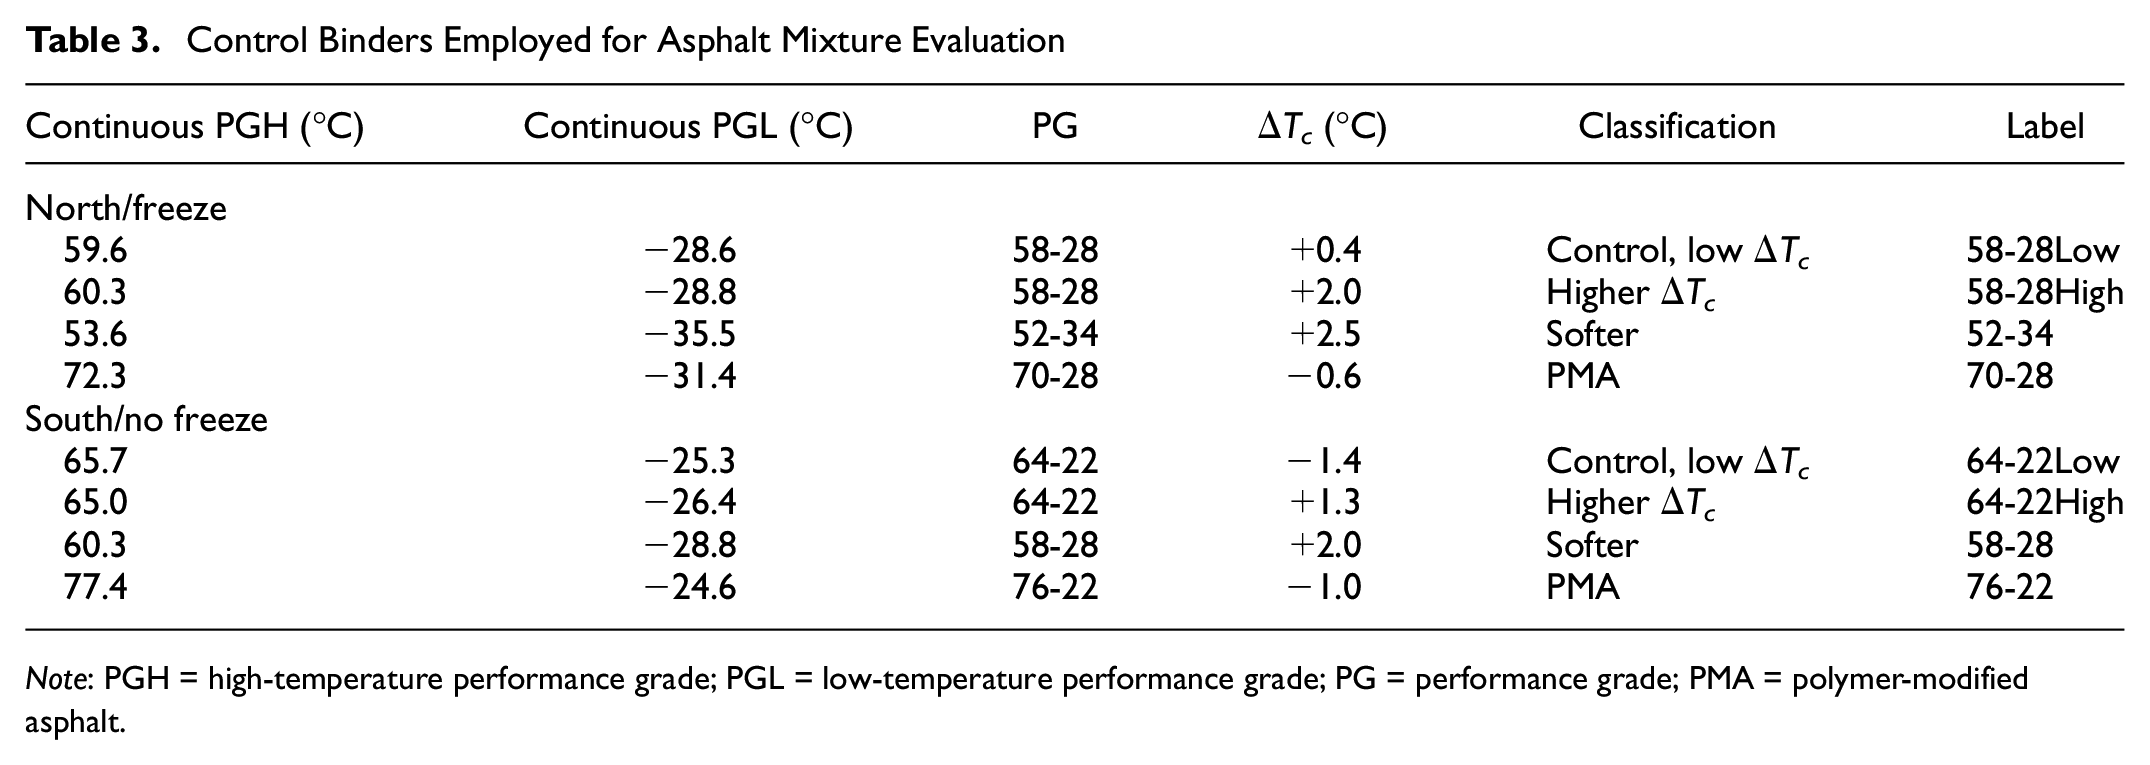
Note: PGH = high-temperature performance grade; PGL = low-temperature performance grade; PG = performance grade; PMA = polymer-modified asphalt.
Table 4 shows RAM characterization results including RAM binder content (Pb) by automatic extraction and continuous PGH, PGL, and PG values, obtained following the standard Superpave procedures. The SE1 RAP exhibited the highest or most positive PG values, almost as high as those of the two RAS binders, indicating increased stiffness compared to the other sources. The SE1 RAP material is originally from a source where RAS is also permitted in recycled asphalt mixtures, and the presence of this material is likely the reason for the high stiffness of the SE1 RAP. Conversely, the RAP extracted from the MidW RAP source showed the lowest stiffness with the lowest or most negative PG results, along with the lowest binder content. The NE RAP and SE2 RAP sources exhibited intermediate PG results and the highest binder contents. Figure 1 shows the RAP washed gradations after the ignition oven, along with the maximum density line. In general, all RAP sources showed similar fine gradations, with maximum differences in percentage passing values of 10%.
Recycled Asphalt Material (RAM) Characterization Results for All Sources
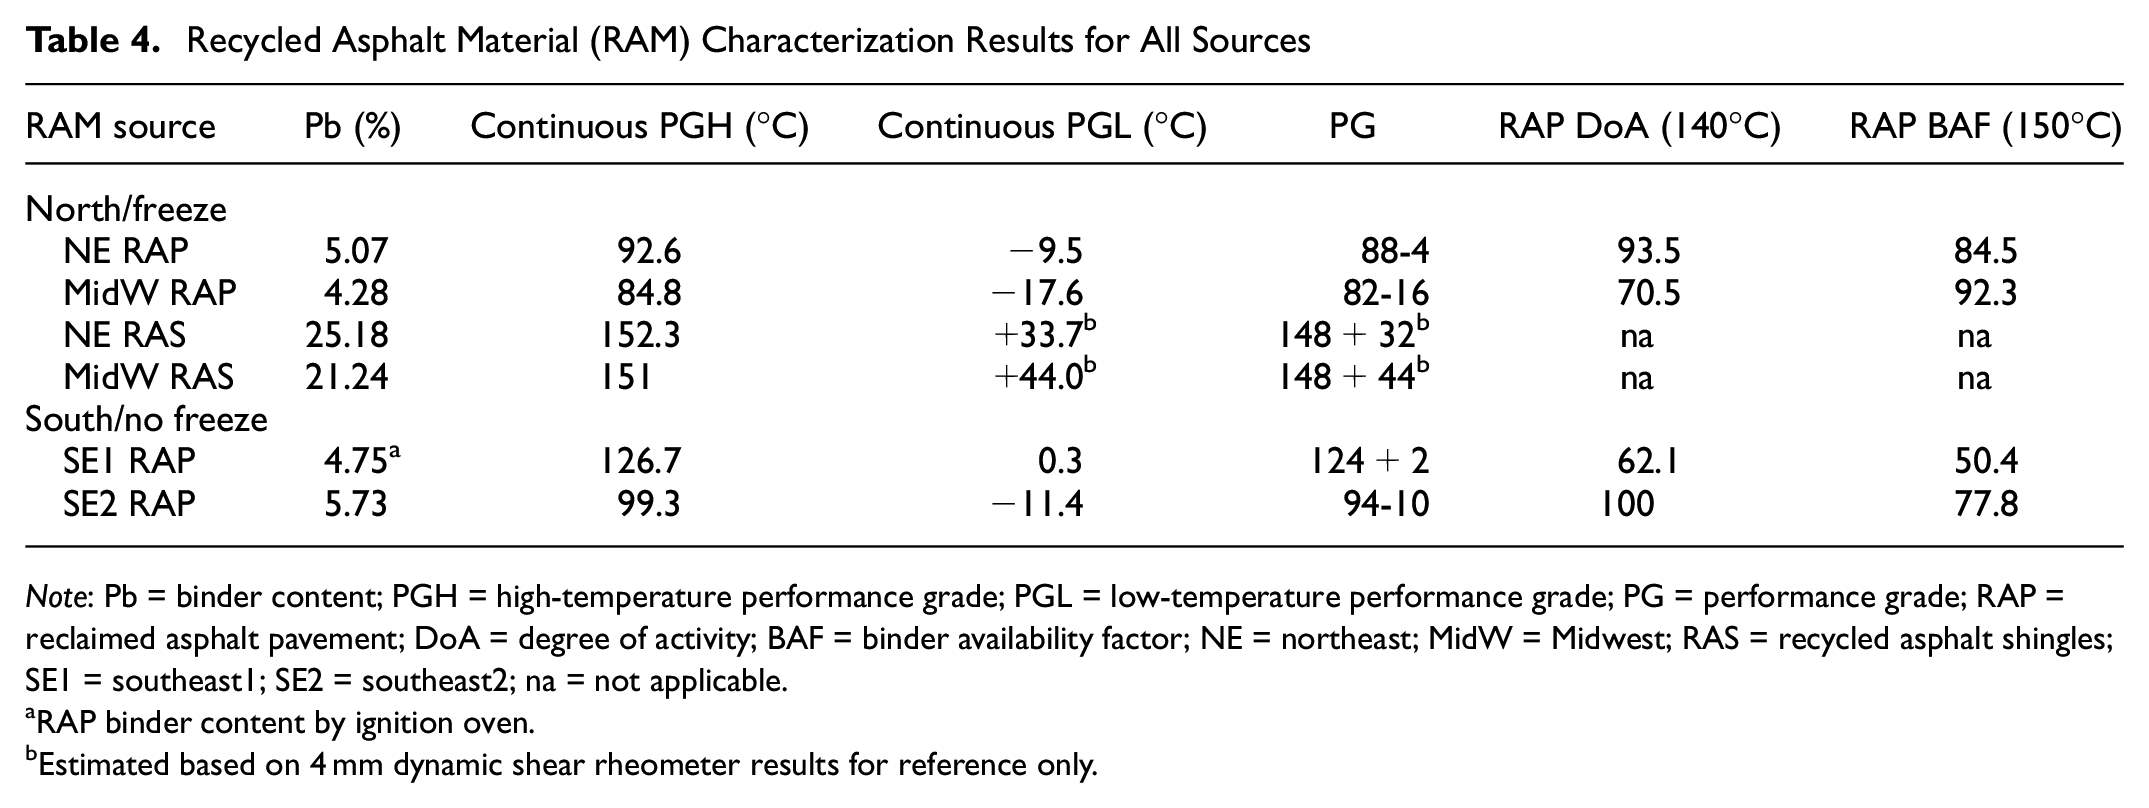
Note: Pb = binder content; PGH = high-temperature performance grade; PGL = low-temperature performance grade; PG = performance grade; RAP = reclaimed asphalt pavement; DoA = degree of activity; BAF = binder availability factor; NE = northeast; MidW = Midwest; RAS = recycled asphalt shingles; SE1 = southeast1; SE2 = southeast2; na = not applicable.
RAP binder content by ignition oven.
Estimated based on 4 mm dynamic shear rheometer results for reference only.
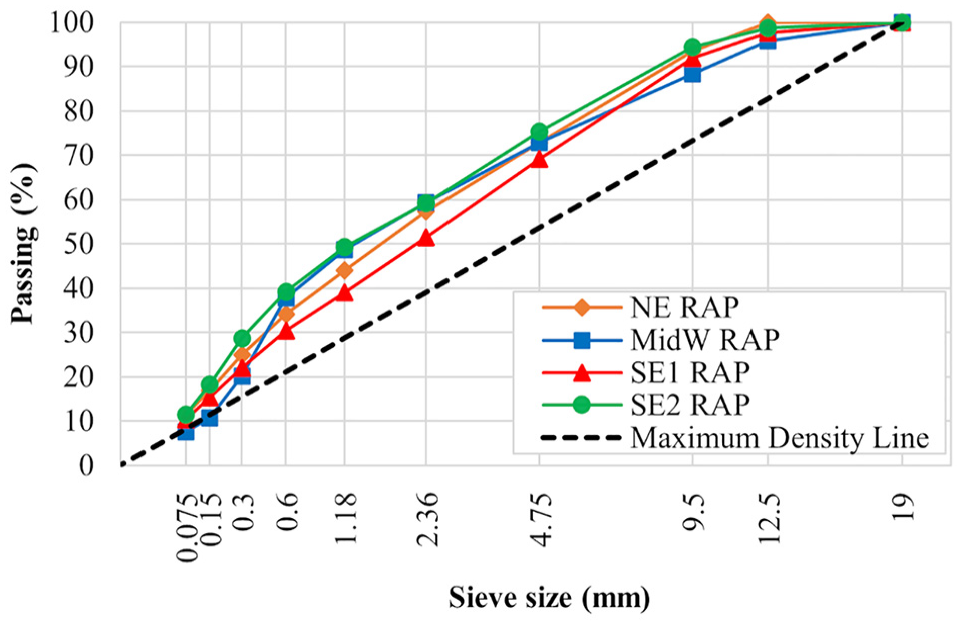
Reclaimed asphalt pavement (RAP) washed gradations after the ignition oven.
The RAP sources were also characterized with respect to the DoA, following the RILEM TC264 RAP TG5 method ( 24 ), to evaluate the RAP binder activity and its relationship with the measured RAP properties (i.e., RAP binder content and RAP PGH). Similarly, the RAP BAF, proposed as part of NCHRP project 09-58 ( 11 ), was determined using the PGH values of the recovered RAP binders.
Table 4 presents the DoA results at 140°C and the BAF values at 150°C for all RAP sources. The average DoA for all the RAP sources was 82%. The average RAP BAF, excluding the stiff SE1 RAP, was 85%. As expected, stiff SE1 RAP with the highest PGH showed the lowest RAP binder activation by both DoA and BAF. Although the PGH for SE2 RAP was also high, this RAP source showed the highest DoA, likely because of the influence of the high binder content (5.73%). Conversely, despite the lowest binder stiffness of the MidW RAP, it showed a low DoA result, likely because of the lowest binder content of this source (4.28%).
The DoA results suggest the influence of the RAP binder content (binder quantity) and RAP binder PGH (binder quality) on binder activity. To consider both effects simultaneously, Figure 2 presents the RAP DoA results at 140°C as a function of the ratio of RAP Pb to RAP PGH, multiplied by 100. The RAP Pb/RAP PGH ratio represents the relationship between the RAP binder content in a RAP source and its rheology at high temperature, with higher ratios representing either higher RAP binder content or softer, more ductile RAP binder. A high DoA indicates that more of the RAP binder is considered active or effective for coating aggregate in new asphalt mixtures with RAM. The coefficient of determination (R2) and Pearson correlation coefficient (r) results show a potential positive relationship between the RAP Pb/RAP PGH ratio and DoA at 140°C, which is a common production temperature for asphalt mixtures.
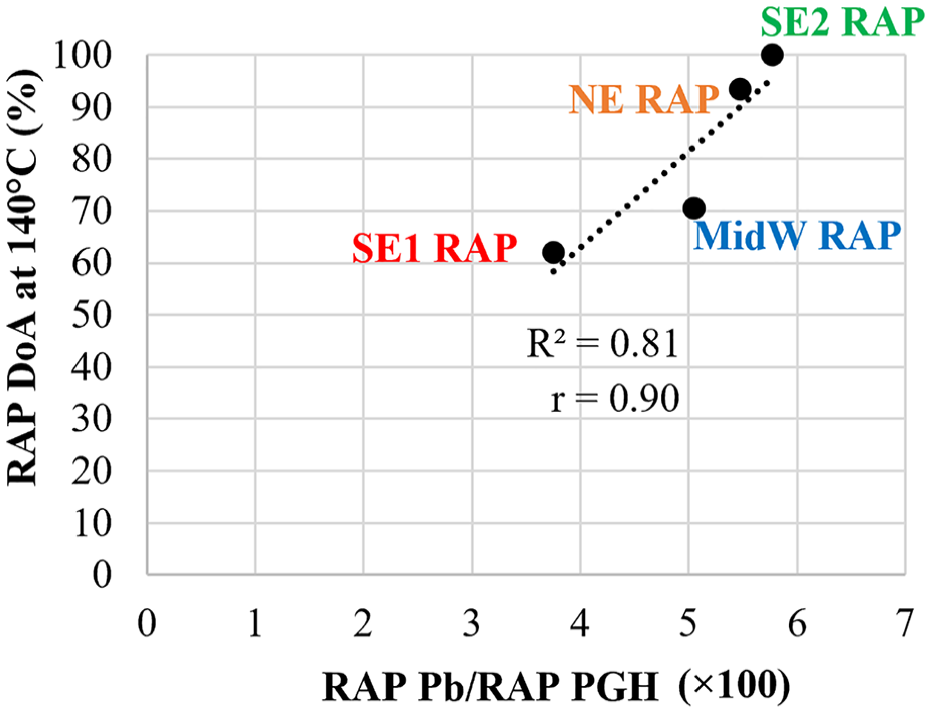
Relationship of reclaimed asphalt pavement (RAP) degree of activity (DoA) at 140°C and ratio of RAP binder content (Pb)/RAP high-temperature performance grade (PGH) (×100) for all RAP sources.
Based on the binder activity results and the median and mode results from seven state agencies surveyed as part of Texas Department of Transportation (TxDOT) project 0-7062 ( 22 ), the decreased RBA values utilized in this study corresponded to 85% and 75% for RAP and RAS, respectively. Table 5 presents the RA doses by weight of the total binder recommended by the supplier for relevant mixtures in this study evaluated to explore the effect of this high RAM strategy, as described subsequently. The doses were obtained based on the measured virgin and RAM binder properties, target binder blend PG according to the climatic zone, total binder content, and RAM content in the asphalt mixture. Finally, different additives were included to improve moisture resistance. A LAS agent and lime were used as moisture strategies. A LAS dose of 0.5% by weight of total binder was utilized, as recommended by the supplier, to improve moisture resistance. Similarly, 0.9% of lime by weight of aggregate was incorporated if specified in the existing mix design.
Recycling Agent (RA) Doses
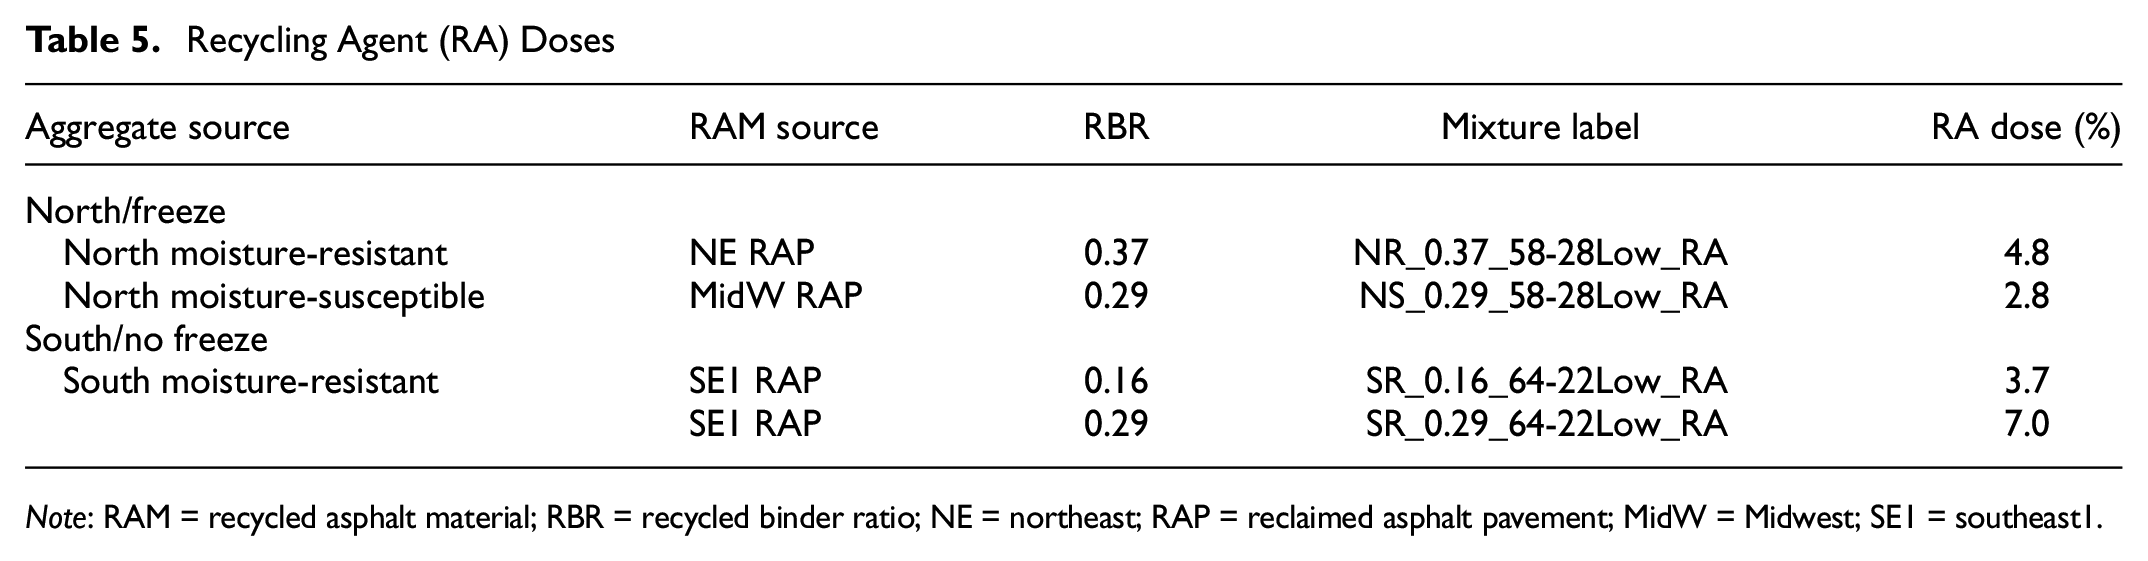
Note: RAM = recycled asphalt material; RBR = recycled binder ratio; NE = northeast; RAP = reclaimed asphalt pavement; MidW = Midwest; SE1 = southeast1.
Mixture Evaluation
To evaluate cracking, moisture resistance, and raveling, asphalt mixture characterization involved laboratory testing tied to different conditioning (aging and moisture) protocols selected to represent each climatic zone. Figure 3 outlines the U.S. climatic zones by color and shows the proposed mixture durability parameters from selected tests and conditioning protocols for each zone. In this study, mixture evaluation results were color-coded as orange and blue to represent the NR and NS mixtures and as red and green to represent the SR and SS mixtures, respectively.
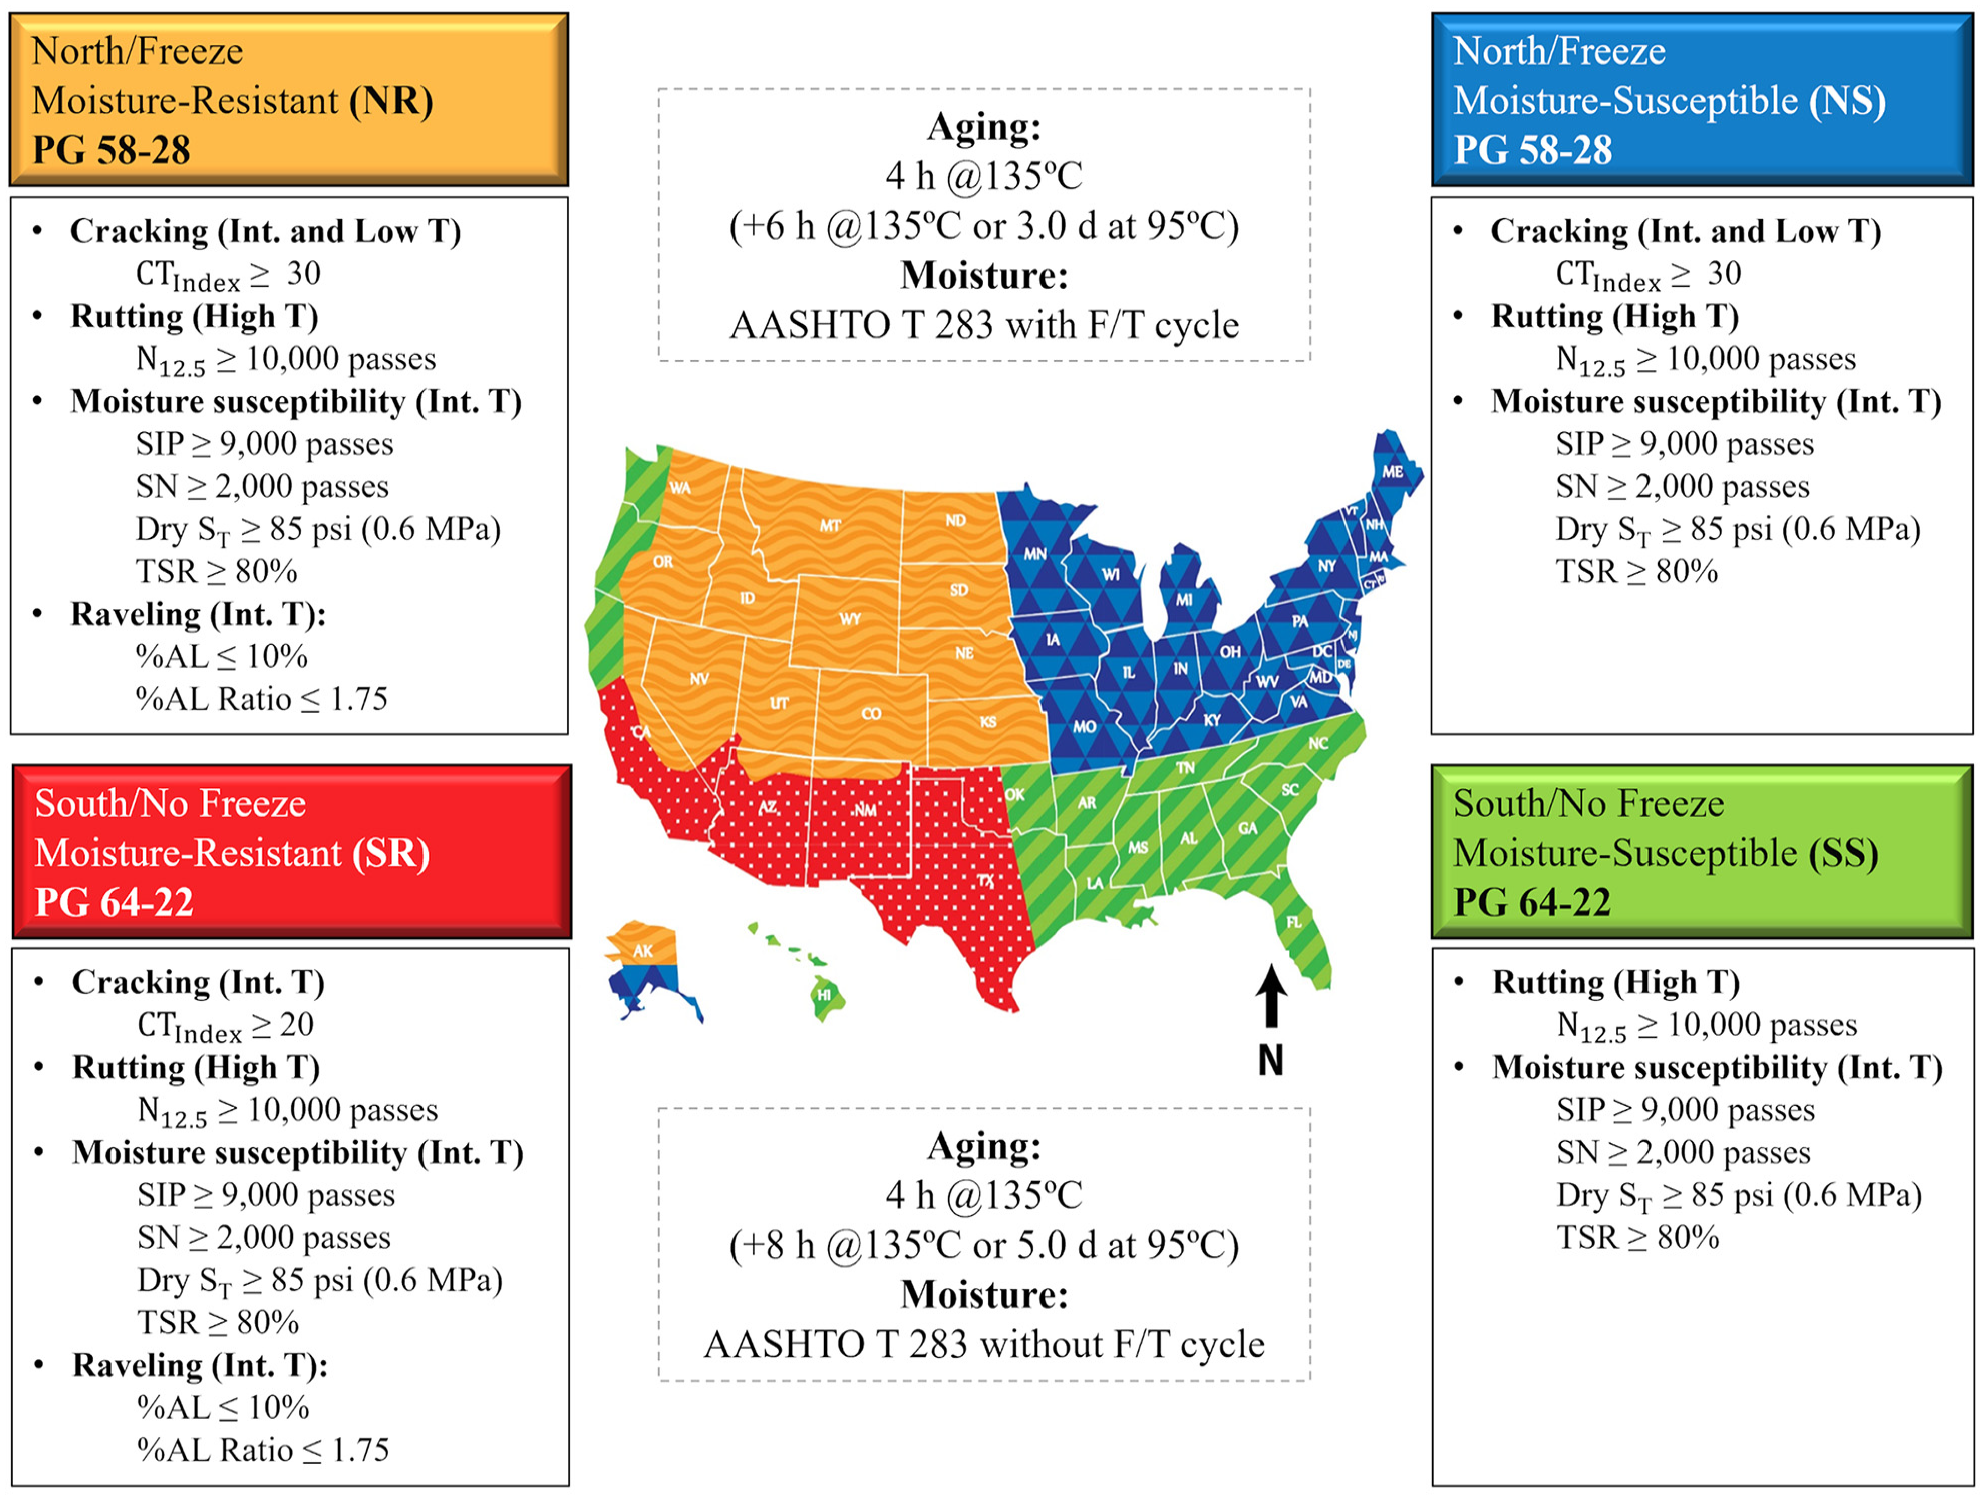
Climatic zones with parameters and conditioning protocols (aging, moisture) for durability evaluation.
Four sets of mixture experiments were used to evaluate asphalt mixture durability and confirm balanced performance. Cracking resistance was assessed by conducting the IDEAL-CT per ASTM D8225 ( 51 ) and evaluating the cracking tolerance index (CTIndex). Rutting resistance was assessed to confirm balanced performance by determining the number of passes to 12.5 mm rut depth (N12.5) using the HWTT according to AASHTO T 324 ( 37 ). Simultaneously, additional HWTT parameters, such as the stripping inflection point (SIP) and stripping number (SN), were determined to evaluate moisture resistance. In addition, dry and wet tensile strength (ST) was measured in unconditioned (dry) and moisture conditioned (wet) samples to further calculate the tensile strength ratio (TSR) per AASHTO T 283 ( 36 ) for evaluating moisture resistance. Finally, the Cantabro test per AASHTO T 401 ( 38 ) was utilized to assess raveling resistance by determining the percentage loss caused by abrasion (%AL) and the ratio of abrasion loss for conditioned specimens to unconditioned specimens (%AL Ratio).
For each test, asphalt mixtures were assessed using selected preliminary thresholds based on previous research, ongoing projects, current thresholds in standard methods, and existing specifications for the northern or southern U.S.A. Additional test details and descriptions of the conditioning protocols are described in the subsequent sections. Furthermore, asphalt mixtures were compared through pairwise statistical comparisons to identify the effect of component materials on mixture durability properties. Specifically, Tukey’s honestly significant difference (HSD) tests were conducted with a significance level of 0.05 to compare CTIndex, rut depth, and dry and wet ST results among the same group of mixtures (i.e., NR, NS, SR, SS) with the assumptions of independence, normality, and equal variances, considering that each test utilized at least the minimum number of replicates required by the standard test method and the results met the precision estimates proposed in previous studies ( 52 – 54 ). Tukey’s HSD results produced letters representing different statistical groups, and mixtures not connected by the same letter were considered statistically different.
Conditioning Protocols
A STOA protocol of 4 h at 135°C was utilized, as the new procedure of 2 h at 135°C per AASHTO R 30 had not been adopted during the development of this study. Varying longer and shorter mid-term critical aging protocols were also utilized based on the climatic zone: 8 h at 135°C for the south/no freeze zone (with an alternate of 5.0 d at 95 °C for mixtures incorporating PMA binder) and 6 h at 135°C for the north/freeze zone (with an alternate of 3.0 d at 95°C for PMA mixtures). Aging protocols at lower temperatures were selected for PMA binders to limit thermal breakdown of the polymer. In addition, the moisture conditioning protocols were also tied to climatic zones following moisture conditioning per AASHTO T 283 with a F/T cycle for the north/freeze zone and moisture conditioning without a F/T cycle for the south/no freeze zone.
Indirect Tensile Asphalt Cracking Test
The IDEAL-CT per ASTM D8225 ( 51 ) determines the cracking performance of asphalt mixtures at intermediate temperatures based on a fracture mechanics-based parameter (CTIndex). Four laboratory-compacted specimens with 150 mm diameter, 62 ± 1 mm thickness, and air void content of 7.0% ± 0.5% were fabricated for each asphalt mixture after mid-term critical aging of loose mixture based on the climatic zone. A monotonic load was applied to each specimen at a constant load of 50 mm/min, and the displacement was measured. The cracking resistance at 25°C was then determined with respect to the CTIndex. As shown in Equation 2, the CTIndex was established based on the fracture energy (Gf), post-peak slope (m75) and displacement at 75% post-peak load (l75), and diameter of the specimen (D):

where
Hamburg Wheel-Tracking Test
The HWTT measures the rutting and moisture resistance of asphalt mixtures according to AASHTO T 324 ( 37 ). Two replicate results per mixture were determined from four cylindrical specimens with a diameter of 150 mm, thickness of 61 mm, and air void content of 7.0% ± 0.5%. The specimens were submerged in a hot water bath at 45°C for north/freeze mixtures or 50°C for south/no freeze mixtures and subjected to repetitive loading of steel wheels. The specimens were tested at a loading rate of 52 passes per minute for a maximum of 20,000 passes or until 12.5 mm rut depth was achieved. The rut depth values were measured at 11 different positions along the track length for each load cycle. The average rut depths of the five middle deformation locations were plotted and used to calculate the output. Rutting resistance was assessed by the number of passes to 12.5 mm rut depth (N12.5). Moisture resistance was evaluated using the SIP and SN. The results were analyzed and reported using the typical HWTT rut depth curve. The SIP was determined as the intersection of two lines after the post-compaction phase that best fit the creep and stripping phases according to AASHTO T 324 (Figure 4a). The SN is an alternative parameter proposed by Yin et al. ( 55 ) and refers to the inflection point of the HWTT curve, where the curvature changes from positive to negative (Figure 4b). The SN was obtained by curve fitting of the entire curve and denotes the maximum number of wheel passes that the asphalt mixture could resist before adhesive failure occurred.
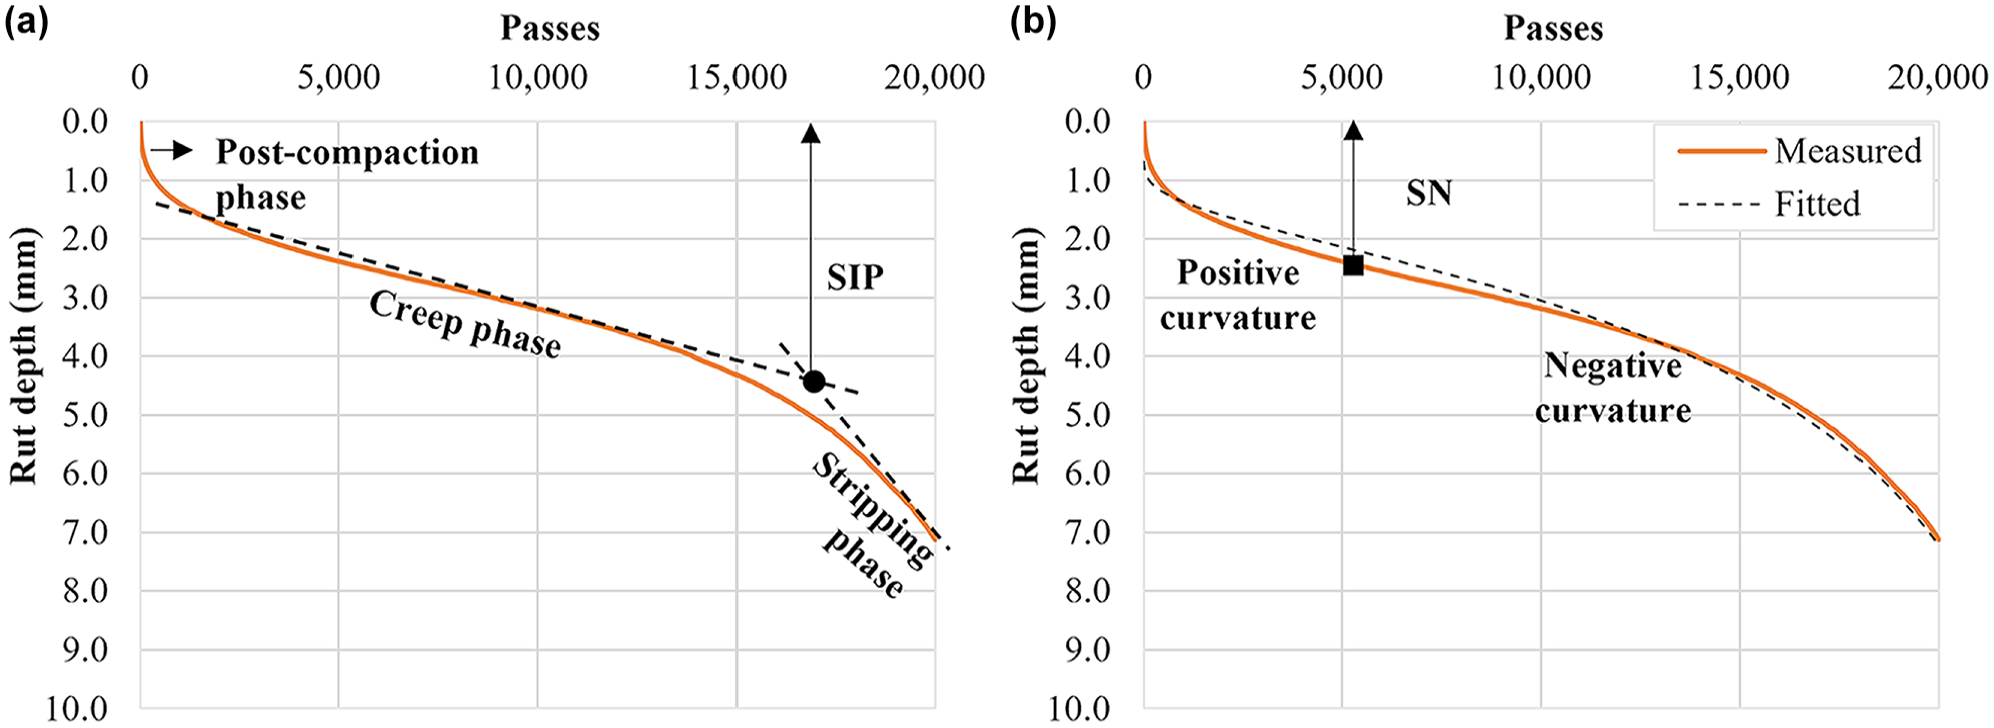
Hamburg wheel-tracking test output: (a) traditional parameter: stripping inflection point (SIP) and (b) alternative parameter: stripping number (SN).
Modified Lottman Test
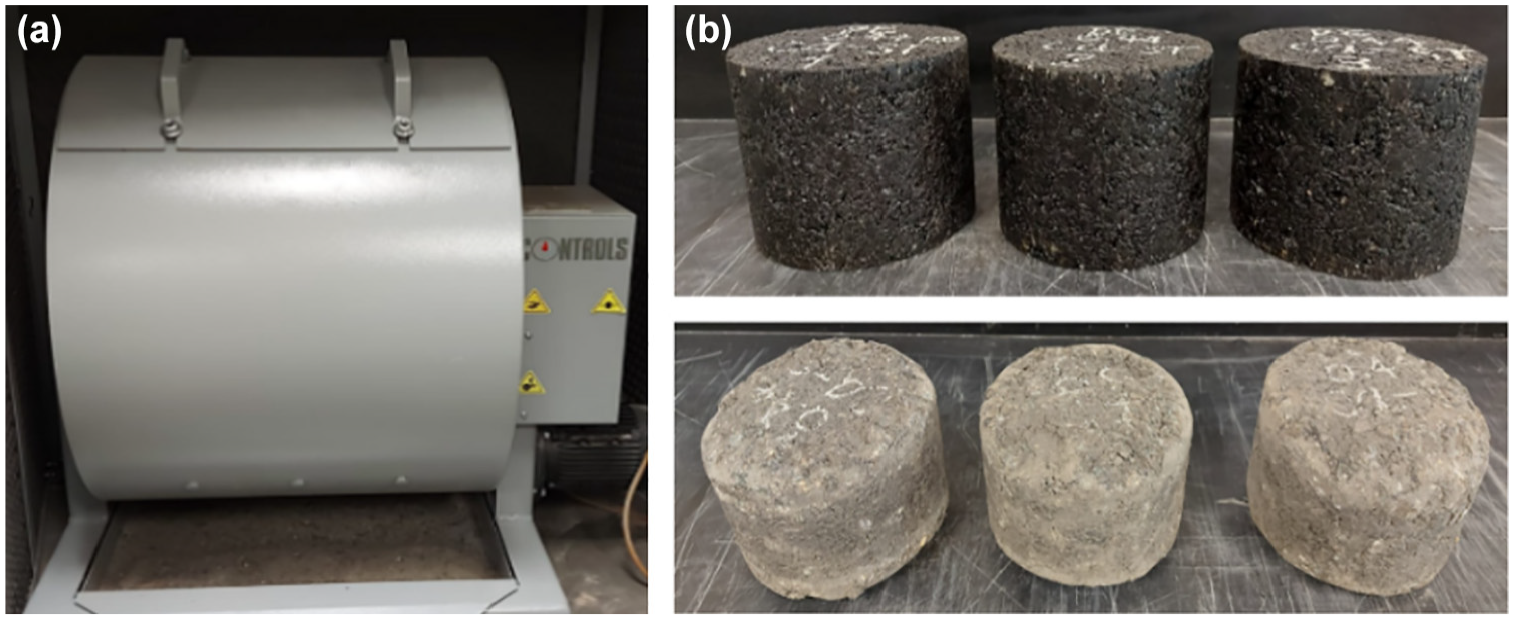
The modified Lottman test per AASHTO T 283 ( 36 ) measures the moisture resistance of asphalt mixtures based on the change in the tensile strength (ST) of compacted specimens caused by the effects of water saturation and accelerated water conditioning with or without a F/T cycle. At least six cylindrical specimens with 150 mm diameter, 95 ± 5 mm thickness, and air void content of 7.0% ± 0.5% were fabricated. The specimens were separated into two subsets with at least three specimens each. The first subset was tested unconditioned (dry), and the second subset (wet) was tested after moisture conditioning with or without the F/T cycle, according to the climatic zone. The conditioned specimens were vacuum saturated to achieve saturations of 70% and 80%. For north/freeze mixtures, specimens were wrapped in plastic and placed in a freezer at −18°C ± 3°C for a minimum of 16 h inside a plastic bag containing 10 ± 0.5 mL of water. The specimens were then immersed in water at 60°C ± 1°C for 24 ± 1 h. The specimens for the south/no freeze mixtures did not include a F/T cycle, meaning that these specimens were placed in water at 60°C ± 1°C for 24 ± 1 h immediately after vacuum saturation. The indirect tensile strength (IDT) was measured at 25°C under a constant displacement loading rate of 50 mm/min and dry and wet ST results were calculated using Equation 3. Images of the modified Lottman test are shown in Figure 5. The susceptibility of the asphalt mixture to moisture damage was assessed by calculating the retained IDT, expressed as a TSR. The TSR was determined as the ratio of the average IDT for the specimens under the wet condition to the average IDT in the dry condition, as shown in Equation 4:

where

where
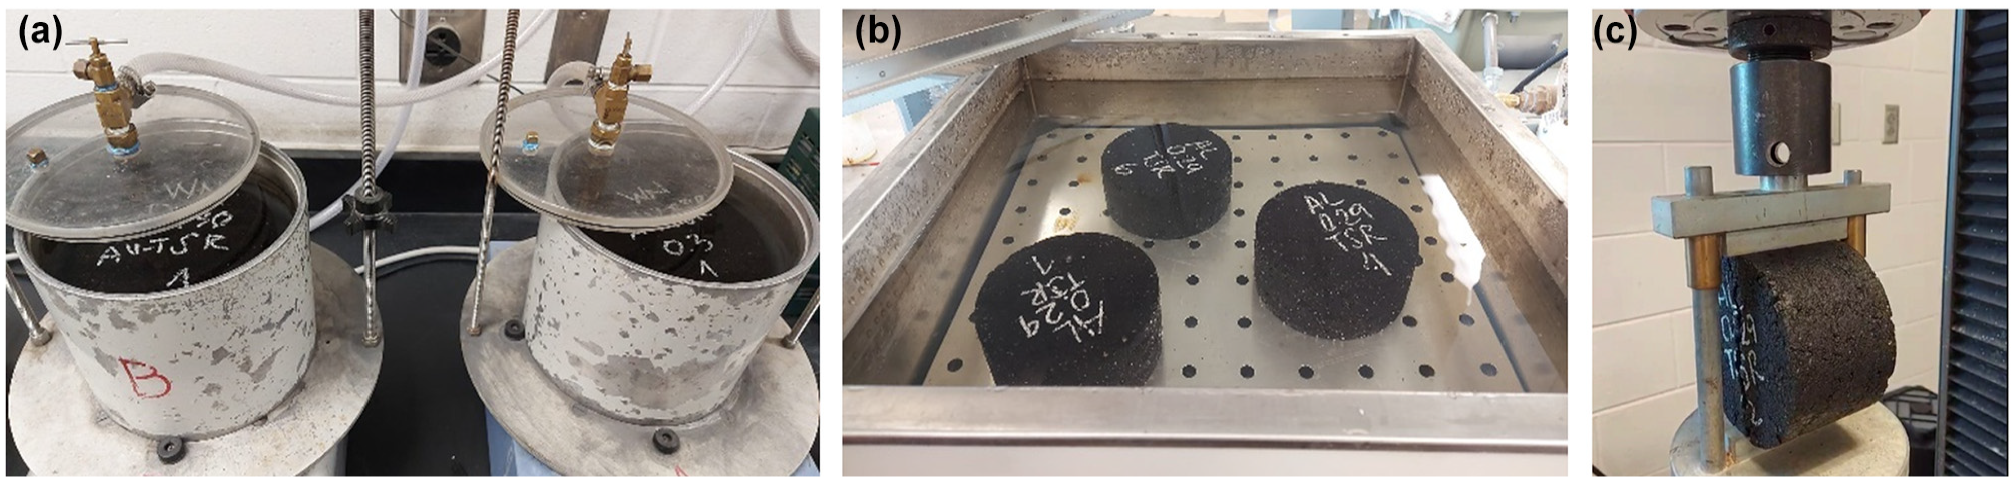
Modified Lottman test: (a) Specimens prepared for water saturation, (b) specimens in the warm water soaking cycle, and (c) indirect tensile strength test.
Cantabro Test
The Cantabro test determines the abrasion loss of asphalt mixtures according to AASHTO T 401 ( 38 ). Six laboratory-compacted cylindrical specimens with a diameter of 150 mm and thickness of 115 ± 5 mm were fabricated. Three samples representing the unconditioned subset were initially compacted to achieve 4.0% ± 0.5% air voids after STOA. The samples were then placed in a chamber at 25°C ± 1°C for at least 4 h before testing. Three additional specimens corresponding to the conditioned subset were compacted at 4.0% ± 0.5% air voids after STOA and varying longer and shorter mid-term critical aging protocols based on the climatic zone. In addition, the second subset (wet) was vacuum saturated to achieve saturations of 70% and 80%, and a F/T cycle was conducted for the north/freeze mixtures. Specimens saturated with water were dried overnight, followed by rapid drying to a constant mass using vacuum drying equipment, according to ASTM D7227/D7227M ( 56 ). Once dried, the samples were conditioned at 25°C ± 1°C for 4 h before testing. Samples were individually placed in the LAA equipment without steel balls and subjected to 300 revolutions in the Los Angeles drum at 30–33 rpm.
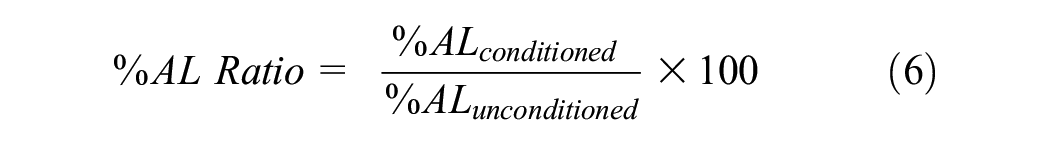
Figure 6 shows images of the equipment utilized and the samples before and after testing. The raveling resistance was determined by the percentage loss caused by abrasion (%AL), which was calculated based on the initial mass of the specimen, as shown in Equation 5. Similarly, to account for the combined aging and moisture effects, the Cantabro ratio (%AL Ratio) was determined as the fraction of abrasion loss with combined conditioning (STOA + critical aging + moisture) and that with only STOA, as shown in Equation 6:

where
where
Cantabro test: (a) Los Angeles drum and (b) specimens before and after testing.
Durability Evaluation
For each mix design or materials combination, the experimental plan shown in Figure 7 was used to evaluate cracking, moisture, and raveling resistance. Naming for mixtures was adopted for reporting results to identify aggregate source and type, binder PG and ΔTc, and any high RAM strategy, such as additives (RA, LAS) or decreased RBA. For example, the name of a high RBR mixture with 0.37 RAP RBR and NR aggregate, using a PG 58-28 virgin binder with low ΔTc along with a RA, corresponds to NR_0.37_58-28Low_RA.
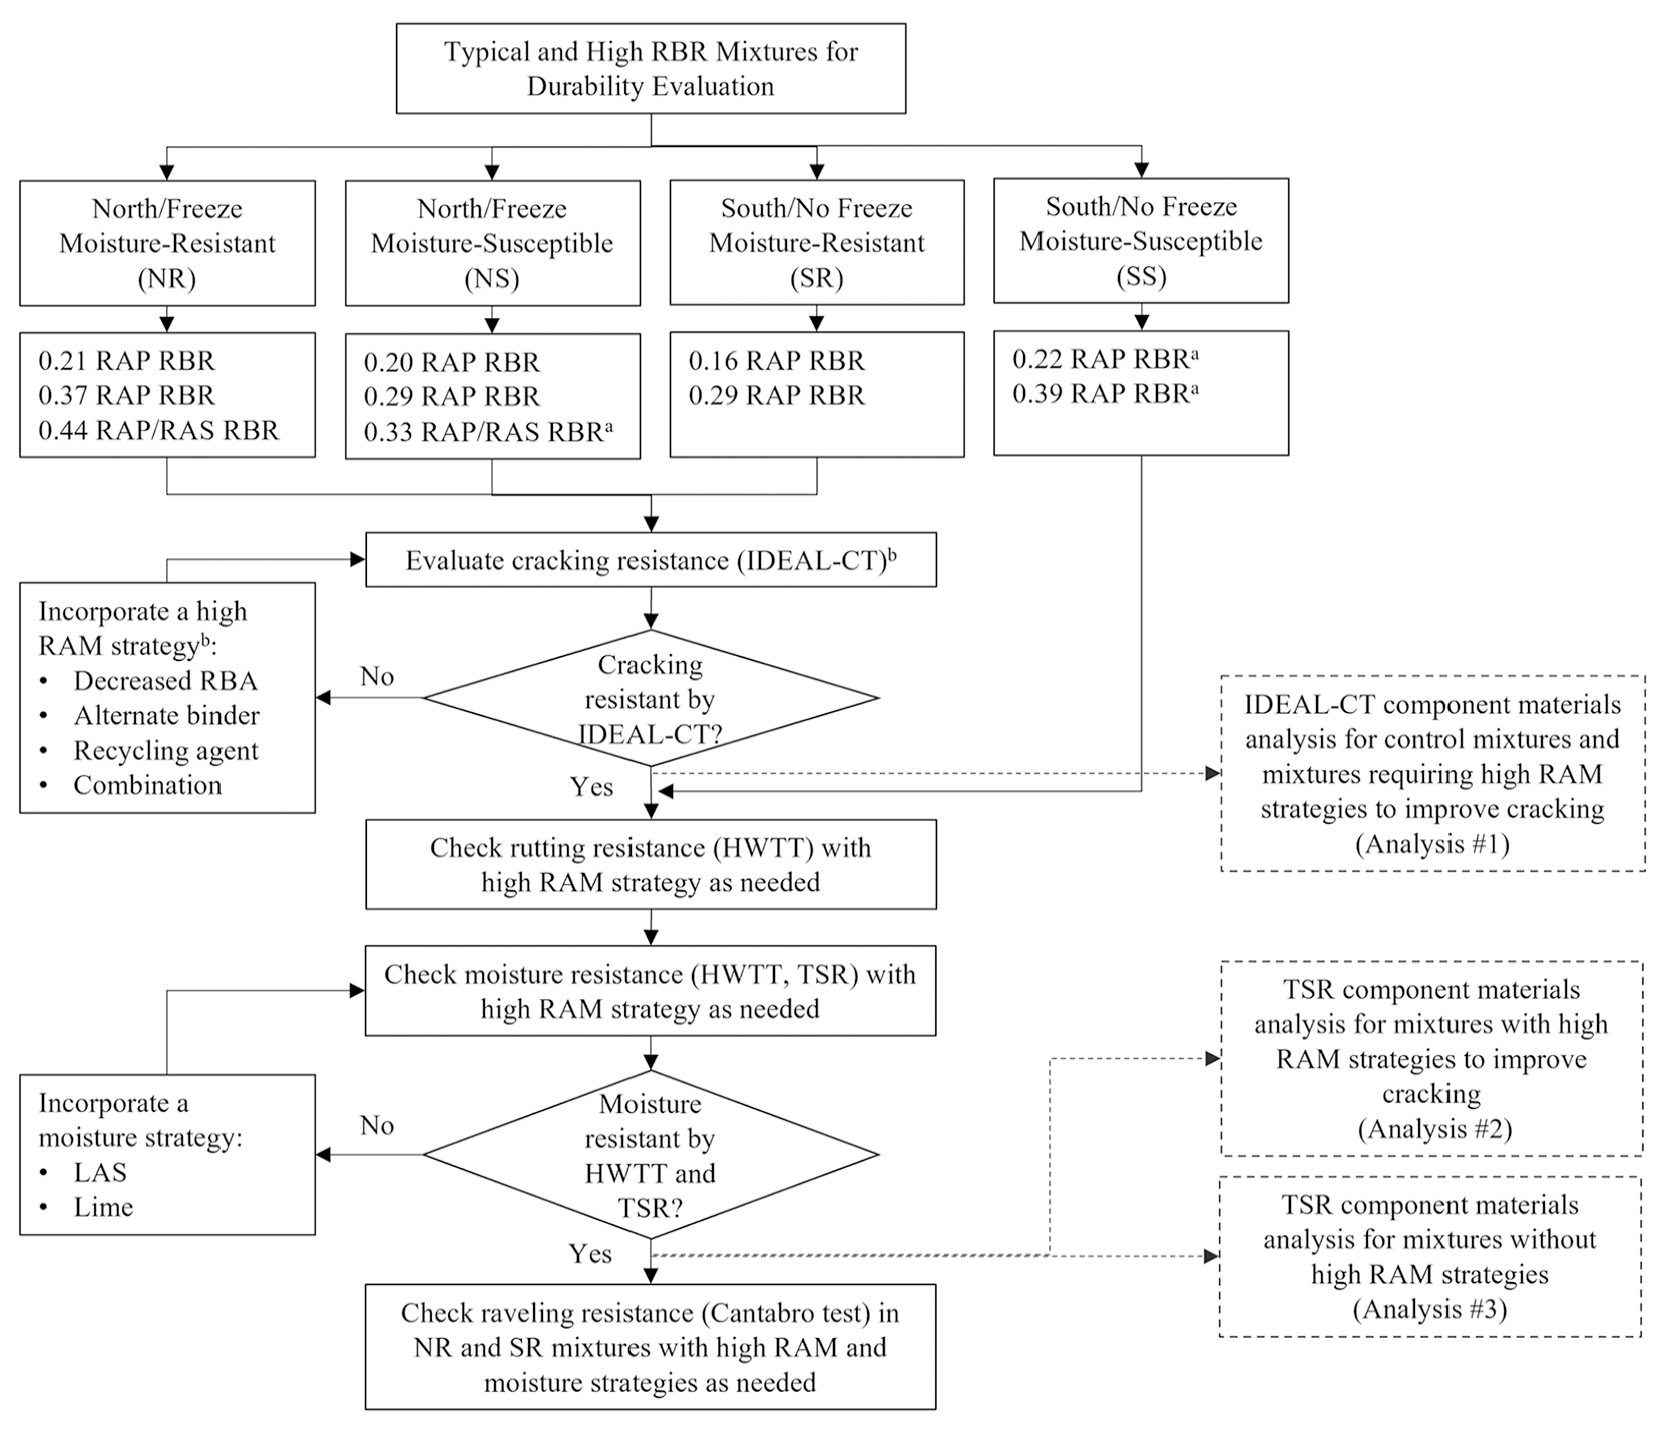
Experimental plan for durability evaluation.
Ten asphalt mixtures were evaluated, with seven mixtures undergoing overall durability evaluation, including cracking, moisture, and raveling. In addition, a smaller subset of three mixtures was specifically assessed for rutting and moisture resistance but was not evaluated for cracking resistance. This subset corresponds to the high 0.33 RAP/RAS RBR mixture with NS aggregate and the typical 0.22 and high 0.39 RAP RBR mixtures with SS aggregate.
As a starting point, control mixtures (i.e., without strategies) with typical and high RBRs were prepared. Subsequently, the cracking resistance at intermediate temperature was evaluated after critical aging with the IDEAL-CT by iterating a high RAM strategy that produced a passing CTIndex result. This evaluation was documented by Bairgi et al. ( 47 ). An analysis to determine the influence of component materials on cracking resistance was conducted for mixtures requiring high RAM strategies (Analysis #1). Next, rutting resistance at high temperature, based on the climatic zone, was evaluated after STOA for mixtures passing the cracking criteria, with the inclusion of high RAM strategies as necessary, to confirm balanced performance. Rutting in the control mixtures was also measured for comparative analysis.
Moisture resistance was then determined at intermediate temperature by TSR after STOA, with or without a F/T cycle for the north/freeze and south/no freeze zones, respectively. Firstly, the TSR was determined in balanced mixtures with high RAM strategies necessary to improve cracking and the corresponding control mixtures with no strategies for comparison. Subsequently, the TSR was also determined for mixtures without high RAM strategies, including those not requiring high RAM strategies to improve cracking and those excluded from the cracking evaluation. When necessary, a LAS agent or lime was added to achieve satisfactory moisture resistance. If the HWTT results indicated adequate moisture resistance but TSR did not, the moisture assessment was repeated, focusing on the TSR while implementing a moisture strategy. Finally, a component materials analysis was performed independently for both groups of mixtures, with and without high RAM strategies, using the TSR results (Analysis #2 and Analysis #3).
Finally, to evaluate the raveling resistance, the abrasion loss (%AL) at intermediate temperature was determined after both STOA only and combined STOA, critical aging, and moisture conditioning in the NR and SR mixtures with high RAM and moisture strategies, if needed. In addition, the Cantabro ratio (%AL Ratio) was determined to account for the combined effects of aging and moisture conditioning on raveling resistance. Thus, the experimental plan corresponded to a framework for evaluating durability mixtures with recycled materials, resulting in the development of robust mixtures with defined strategies that provide acceptable durability.
Results and Discussion
Cracking Evaluation
Figure 8 presents the cracking performance results previously reported for NR and SR mixtures by Bairgi et al. ( 47 ), along with the results for the NS mixtures obtained in this study. The error bars indicate one positive and one negative standard deviation from the average CTIndex. The labels indicate the group of mixtures (i.e., NR, NS, SR) and additional letters represent Tukey’s HSD results obtained at a significance level of 0.05. Mixtures not connected by the same letter were considered statistically different. The results indicated that all high RBR mixtures required the incorporation of a high RAM strategy to meet the cracking test requirement, and the most effective strategy differed among the mixtures. Two typical RBR mixtures, NR_0.21_58-28Low and NS_0.20_58-28Low, did not require a mitigation strategy. Conversely, the SR mixture with a typical RBR required a combination of strategies (softer binder + decreased RBA) to pass the cracking threshold (SR_0.16_58-28_RBA), likely because of its stiff RAM binder. In addition, mixtures with high ΔTc or PMA binders did not show significant improvement in the CTIndex compared to the corresponding control mixture without strategies based on Tukey’s HSD results. More details and analysis of high RAM strategies influencing the CTIndex can be found in Bairgi et al. ( 47 ).
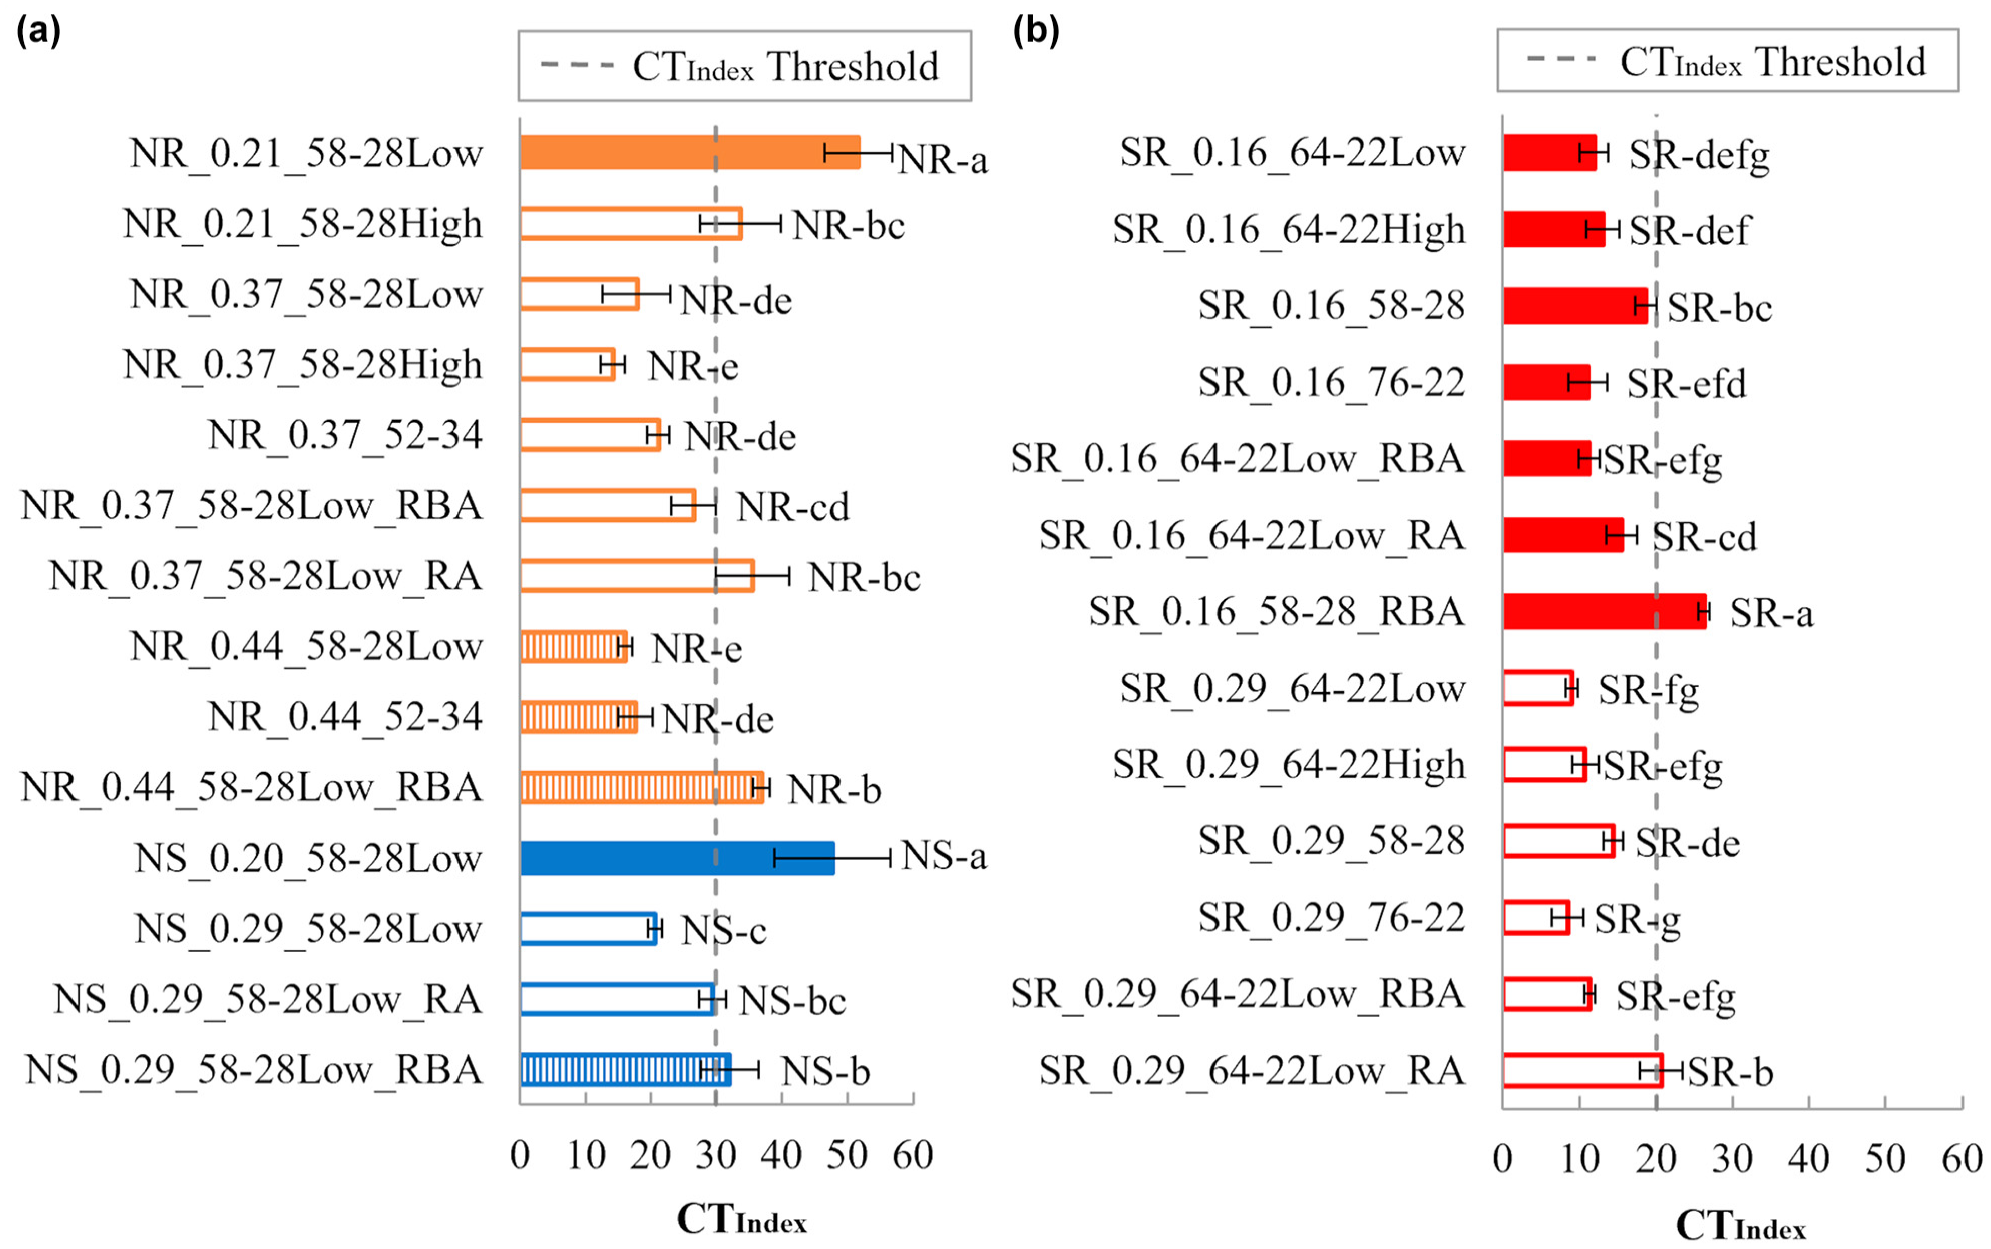
Indirect tensile asphalt cracking test results for (a) north moisture-resistant (NR), north moisture-susceptible (NS) and (b) south moisture-resistant (SR) mixtures ( 47 ).
An additional cracking performance analysis was conducted to identify the influence of the component materials and mixture properties on cracking resistance (Analysis #1). This analysis used the cracking results of control mixtures and the corresponding mixture with the high RAM strategy that showed a passing CTIndex result. For this evaluation, binder quantity and quality parameters were selected as the total binder content (Pb) in the mixture and the estimated PGH of the binder blend. The PGH values of the binder blends were estimated using linear blending charts for blends without RAs or those provided by the RA materials supplier. The ratio of the total binder content and estimated PGH of the binder blend multiplied by 100 was chosen as a tool for screening component materials that represent the interaction of both binder quantity and quality parameters.
Figure 9 presents an interaction plot that shows the effect of both binder quantity and quality parameters, expressed as Pb/Blend PGH ratio (multiplied by 100), on the CTIndex. The results are shown for mixtures without high RAM strategies (Figure 9, a and c ) and for those incorporating strategies, if needed (Figure 9, b and d ). For all the interaction plots presented in this study, the labels ‘T’, ‘H’, and ‘RAS’ represent the mixtures with typical RAP, high RAP, and high RAP/RAS RBRs, respectively, for each combination of materials (NR, NS, SR, SS) coded by color and symbol. In addition, the subsequent letters represent the high RAM strategy, if required, with ‘SF’, ‘RBA’, and ‘RA’, representing softer binder, decreased RBA, and RA, respectively.
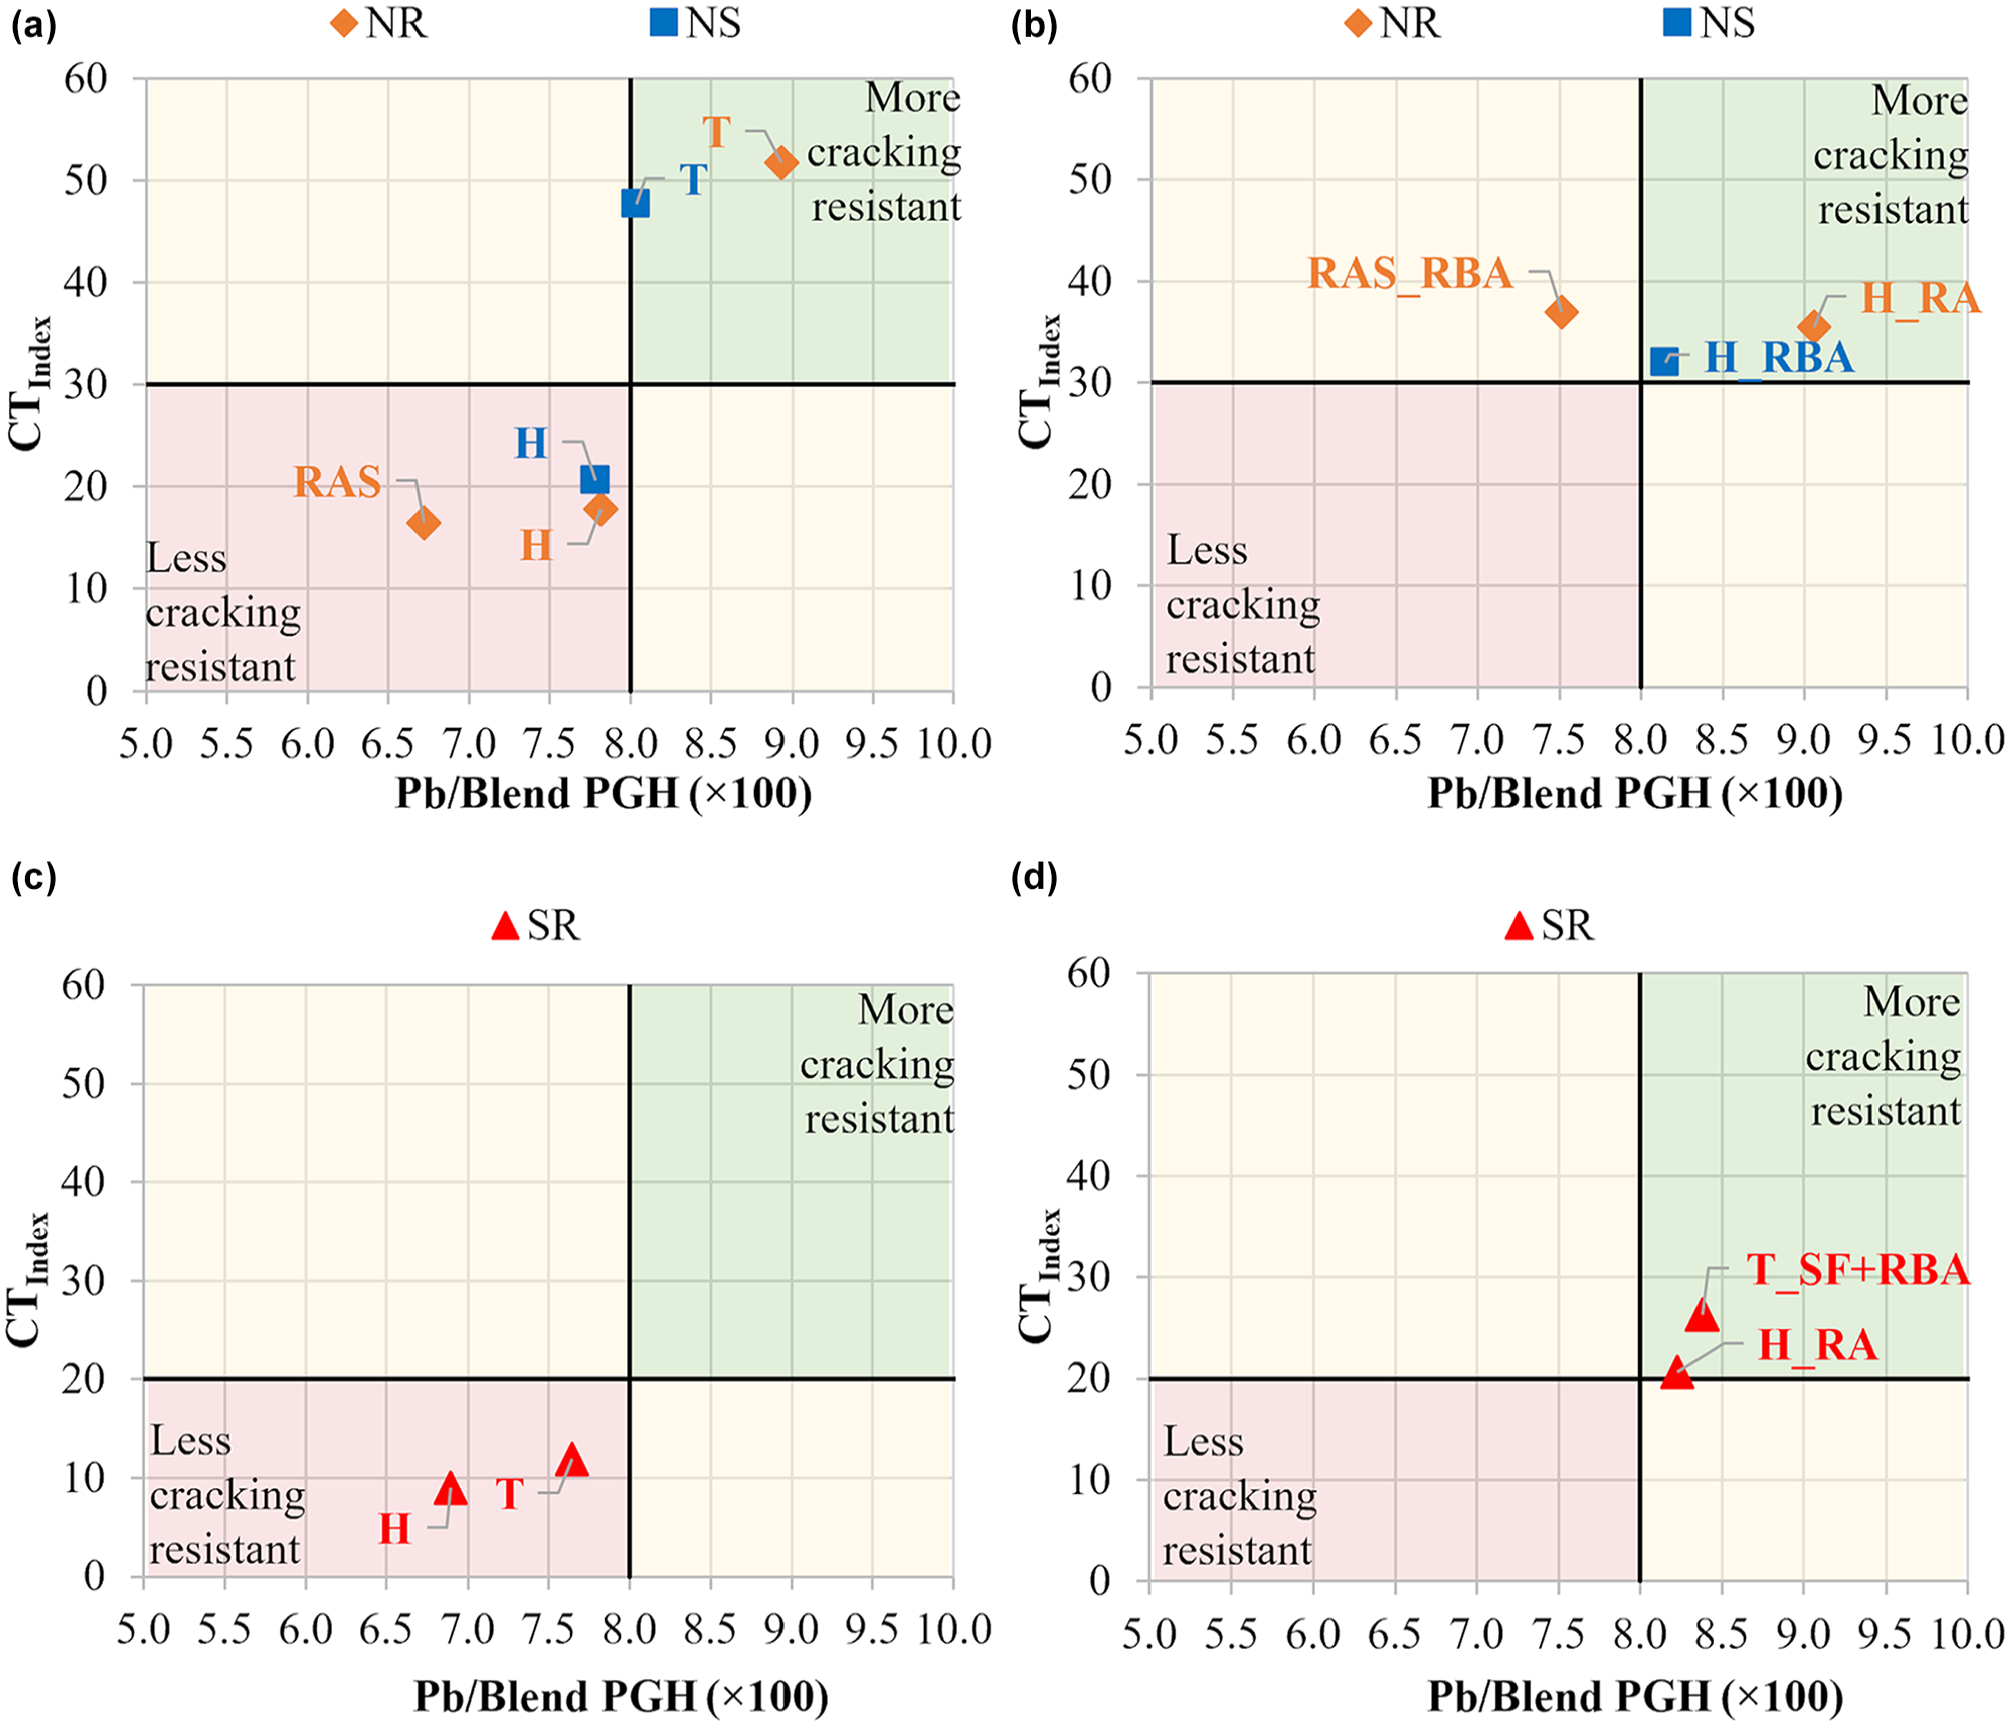
Cracking tolerance index (CTIndex) versus binder content (Pb)/Blend high-temperature performance grade (PGH) ratio interaction plot for mixtures with cracking evaluation: (a) control north moisture-resistant (NR) and north moisture-susceptible (NS) mixtures without strategies, (b) NR and NS mixtures with required high recycled asphalt material (RAM) strategies, (c) control south moisture-resistant (SR) mixtures without strategies, and (d) SR mixtures with required high RAM strategies (Analysis #1).
The results in Figure 9 show that both binder quantity and quality influence the mixture cracking performance. Most of the mixtures with Pb/Blend PGH ratios equal to or greater than 8.0 produced passing CTIndex values, falling in the green area (upper right quadrant). Conversely, the red area (lower left quadrant) contains mixtures with Pb/blend PGH ratios lower than 8.0, thereby failing the CTIndex threshold. Moreover, the yellow area refers to a result passing one of the criteria but failing the other (upper left and lower right quadrants). The influence of the selected binder parameters on enhancing cracking resistance is more evident when examining mixtures with high RAM strategies. These strategies led to higher total binder contents through decreased RBA or produced lower binder blend PGH values with the incorporation of softer binders or RAs, resulting in increased Pb/Blend PGH ratios, improving CTIndex, and moving cracking performance to the green area (upper right quadrant). Lastly, the result for the NR mixture with RAS showed that the minimum Pb/Blend PGH ratio to achieve a satisfactory CTIndex result could be slightly lower than 8.0 for this type of mixture, likely because of the increased effective binder content resulting from decreasing RBA of both RAP and RAS.
Rutting and Moisture Evaluation
Figure 10 presents the HWTT results for the NR, NS, and SR control mixtures and for those with high RAM strategies required following cracking evaluation. The results for the subset of the three mixtures assessed only for rutting and moisture resistance were also included (NS_0.33_58-28Low, SS_0.22_64-22Low, and SS_0.39_64-22Low).
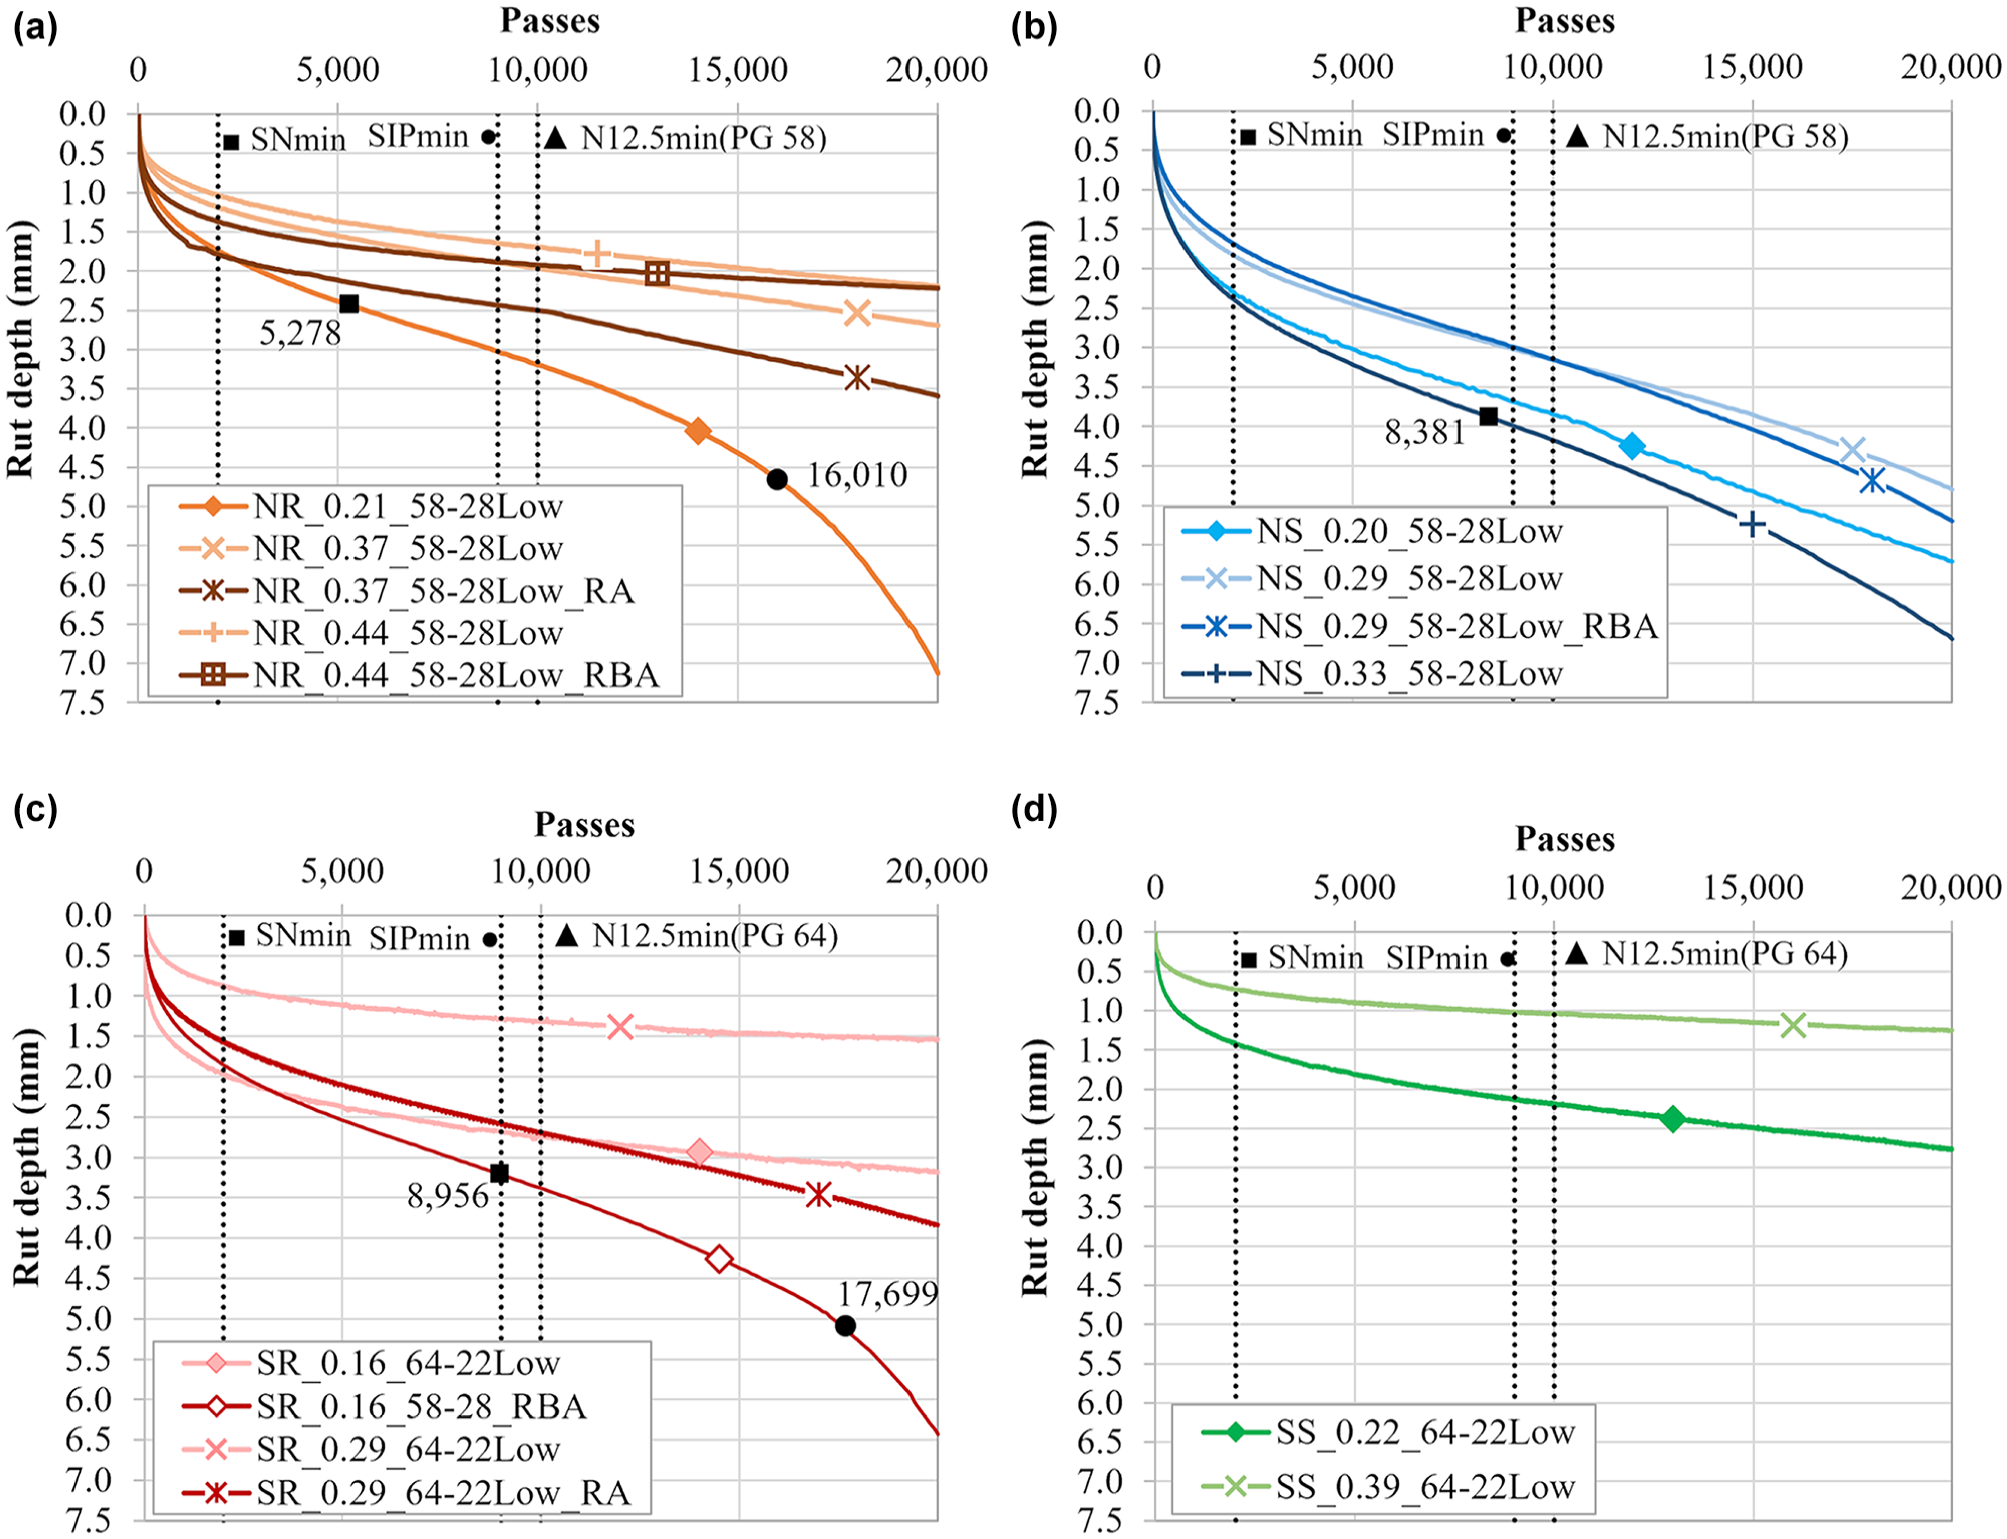
Hamburg wheel-tracking test results for (a) north moisture-resistant (NR), (b) north moisture-susceptible (NS), (c) south moisture-resistant (SR), and (d) south moisture-susceptible (SS) mixtures (12.5 mm = ½ in.).
The HWTT results are shown with an enlarged y-axis scale up to a maximum rut depth of 7.5 mm to facilitate visualization and comparison among mixtures. The results show that all the mixtures evaluated passed the rutting (N12.5) and moisture (SIP and SN) criteria, and the NS mixtures exhibited higher rut depths. In general, mixtures that met the cracking performance thresholds with or without high RAM strategies also met the rutting and moisture thresholds by the HWTT. Also, some mixtures exhibited higher rut depths at a larger number of passes when incorporating high RAM strategies compared to the corresponding control mixture, such as the NR_0.37_58-28Low_RA, SR_0.16_58-28_RBA, and SR_0.29_64-22Low_RA mixtures.
Tukey’s HSD pairwise comparisons at a significance level of 0.05 were performed with rut depth values at 10,000 passes and the results are presented in Figure 11. The error bars indicate one positive and one negative standard deviation from the average rut depth. The labels indicate the group of mixtures (i.e., NR, NS, SR, SS) and additional letters represent Tukey’s HSD results obtained at a significance level of 0.05. Mixtures not connected by the same letter were considered statistically different. In general, the mixtures with high RAM strategies did not exhibit statistical differences at 10,000 passes compared to the corresponding control mixture without strategies. However, the NR_0.37_58-28Low_RA mixture produced statistically different rut depth values compared to the same mixture without RA. Overall, all mixtures that met cracking performance also met the HWTT rutting and moisture thresholds (N12.5, SIP, SN), despite the increased rutting potential observed in some mixtures when high RAM strategies were incorporated.
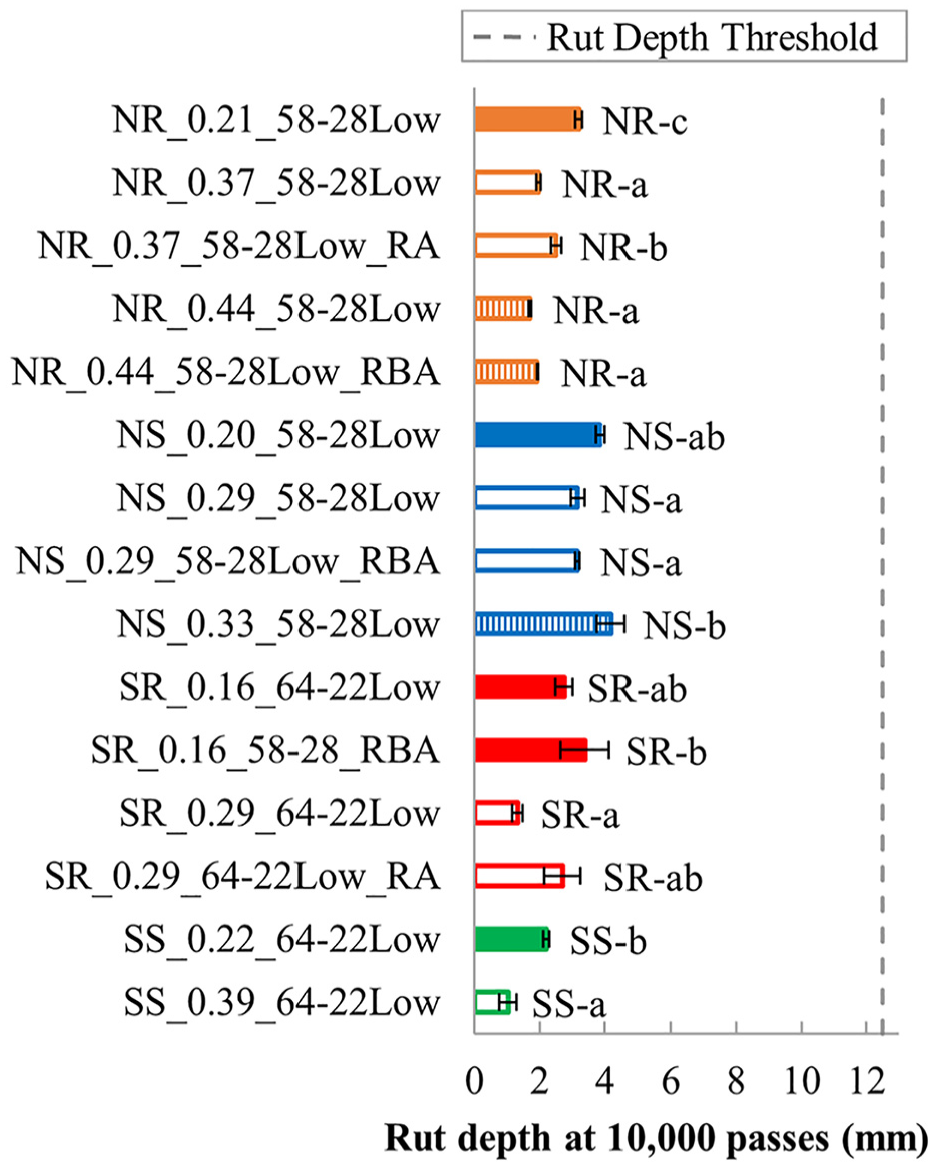
Rut depth results at 10,000 passes for all mixtures (12.5 mm = ½ in.).
Modified Lottman Test for Mixtures with High RAM Strategies
Figure 12 presents the moisture resistance results across all mixtures that required a high RAM strategy to pass the cracking performance threshold and the corresponding control mixture. Error bars indicate one positive and one negative standard deviation from the average dry and wet ST results, respectively. The bars overlayed in lighter colors in Figure 12a represent the wet ST results. In addition, the labels outside the bars indicate the TSR results and the labels inside the bars indicate the group of mixtures (i.e., NR, NS, SR) and Tukey’s HSD results obtained when comparing wet ST results at a significance level of 0.05. Mixtures not connected by the same letter were considered statistically different. In general, the results showed that mixtures with high RAM strategies also achieved acceptable moisture resistance, and no moisture strategies were required. In most cases, the results indicated that mixtures with high RAM strategies exhibited lower ST values but improved TSR results compared with the corresponding control mixture, as shown in Figure 12b. Tukey’s HSD pairwise comparisons demonstrated statistical differences in both dry and wet ST values across the majority of mixtures with high RAM strategies compared to the corresponding control mixture.
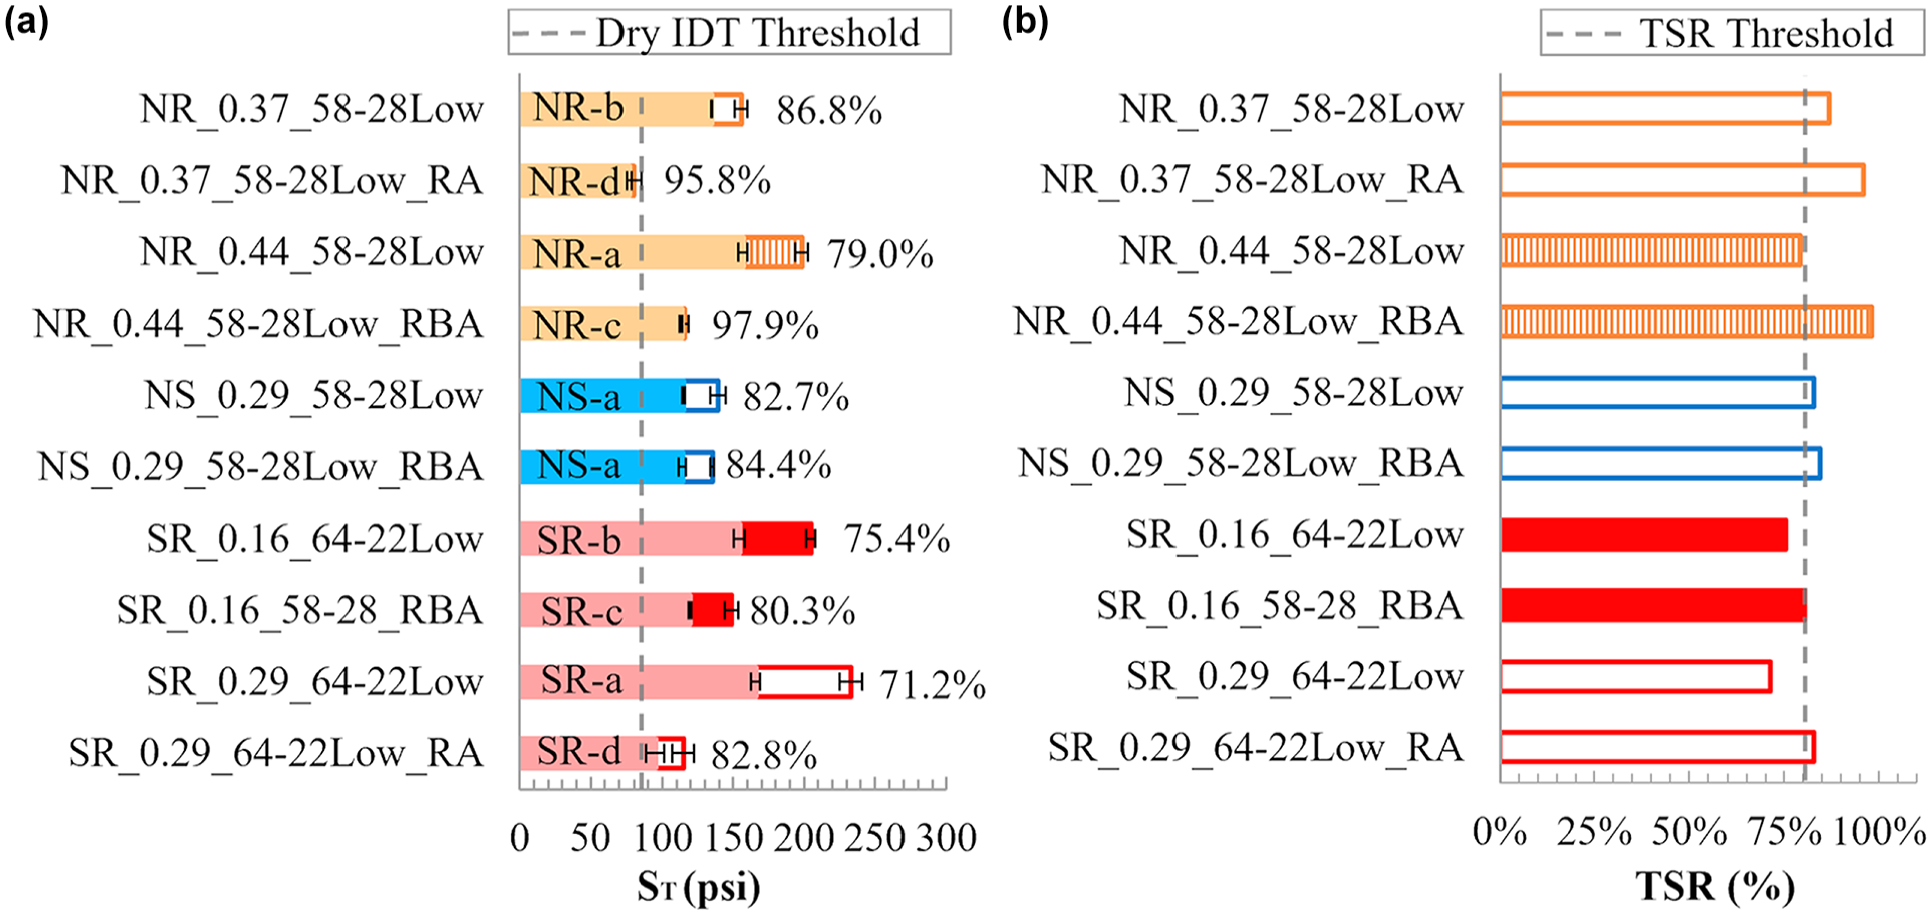
Modified Lottman test results for mixtures requiring high recycled asphalt material (RAM) strategies to improve cracking: (a) dry indirect tensile strength (IDT), wet IDT (bars overlayed), and tensile strength ratio (TSR) (labels) and (b) TSR results (100 pounds per square inch [psi] = 0.70 MPa).
Similar to the cracking performance analysis shown in the previous section, further analysis was conducted to assess the impact of the component materials on moisture resistance. In this case, the analysis utilized the TSR results of mixtures requiring a high RAM strategy to improve cracking and their respective control mixture (Analysis #2). Figure 13 presents the interaction plots that show the relationship between the Pb/Blend PGH ratio (multiplied by 100) and TSR. The results suggest that both the binder quantity (Pb) and quality (Blend PGH) parameters play a role in the moisture resistance of the mixtures. Based on the results, mixtures with Pb/Blend PGH ratios equal to or greater than 7.5 produced passing TSR values, falling within the green area (upper right quadrant). This threshold is a slightly lower ratio compared to the value identified in the cracking resistance analysis. One mixture, the SR control mixture with typical RBR, exhibited a result that fell within the lower right quadrant or yellow area in Figure 13a (i.e., Pb/Blend PGH ratio higher than 7.5, but failed TSR), which will be discussed subsequently. High RAM strategies to enhance cracking performance (Figure 13b) altered the Pb or Blend PGH values, leading to higher Pb/Blend PGH ratios and improved moisture resistance according to the TSR. This suggests that the high RAM strategies initially applied to improve cracking resistance do not create additional durability concerns with respect to moisture susceptibility and demonstrated positive effects on moisture resistance in the mixtures evaluated.
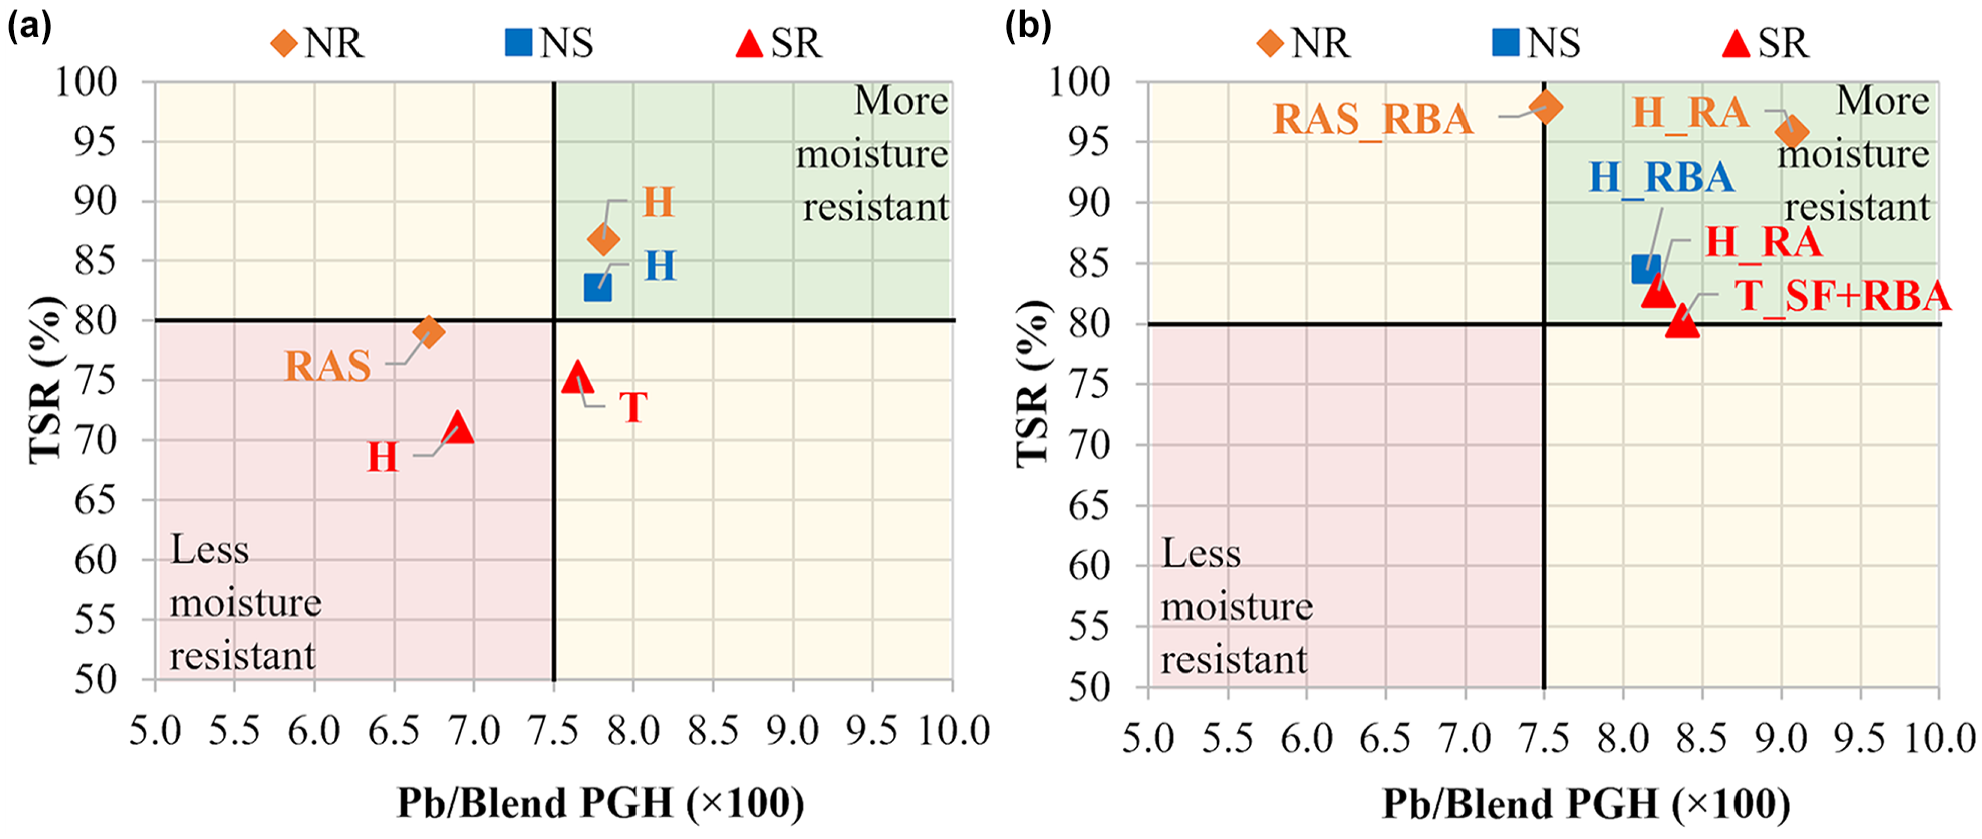
Tensile strength ratio (TSR) versus binder content (Pb)/Blend high-temperature performance grade (PGH) ratio interaction plot for mixtures requiring high recycled asphalt material (RAM) strategies to improve cracking: (a) control mixtures without strategies and (b) corresponding mixtures with high RAM strategies (Analysis #2).
Modified Lottman Test for Mixtures without High RAM Strategies
Figure 14 presents the TSR results for mixtures without high RAM strategies, which include both mixtures that did not require a high RAM strategy to enhance cracking performance (NR_0.21_58-28Low and NS_0.20_58-28Low) and the subset of mixtures excluded from the cracking performance evaluation (NS_0.33_58-28Low, SS_0.22_64-22Low, and SS_0.39_64-22Low). Most of these mixtures were fabricated with a moisture-susceptible aggregate source (e.g., NS, SS) and required an ASA, such as LAS or lime, to meet the TSR threshold, as shown in Figure 14a, except for the NS_0.20_58-28Low mixture. The mixture fabricated with a moisture-resistant aggregate also required an ASA (NR_0.21_58-28Low_LAS). This could be attributed to its original mix design formulation, which included a WMA additive that also has anti-stripping properties, as indicated in Table 1. Thus, the results show the effectiveness of LAS in improving the moisture resistance of recycled mixtures independent of the aggregate source.
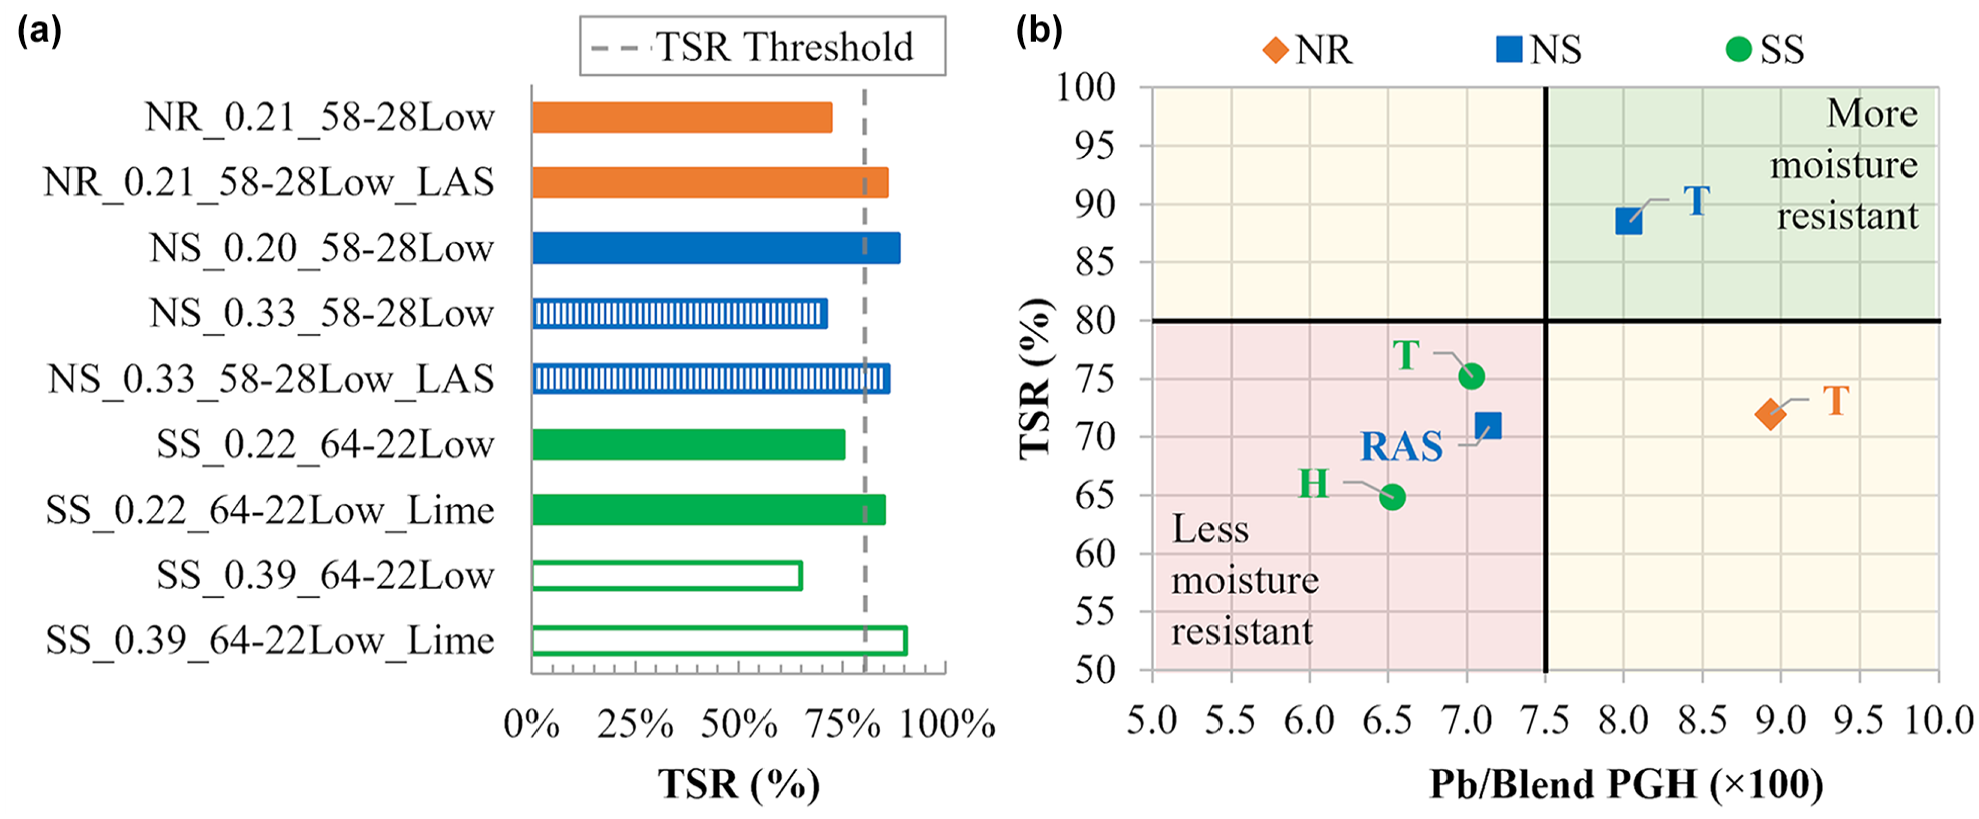
Tensile strength ratio (TSR) results for mixtures without high recycled asphalt material (RAM) strategies: (a) effect of moisture strategies and (b) TSR versus binder content (Pb)/Blend high-temperature performance grade (PGH) ratio interaction plot (Analysis #3).
A complementary analysis was conducted to identify the influence of component materials on the TSR for the mixtures without high RAM strategies because of satisfactory cracking performance or for those not evaluated for cracking (Analysis #3). Figure 14b shows the interaction plot that relates the TSR and Pb/Blend PGH ratio (multiplied by 100) for these mixtures. Similar to previous analysis, the Pb/Blend PGH ratio captured the effect of the binder quantity and quality on moisture resistance by the TSR. Mixtures with Pb/Blend PGH ratios below 7.5, such as the SS mixtures with typical and high RBR (SS_0.22_64-22Low and SS_0.39_64-22Low) and the NS mixture with high RAP/RAS RBR (NS_0.33_58-28Low), exhibited failing TSR results, shown in the red area (lower left quadrant), indicating the influence of binder quantity and quality on moisture resistance. The NS mixture with typical RBR showed a Pb/Blend PGH ratio higher than 7.5 and passed the TSR threshold, falling within the green area (upper right quadrant). Conversely, the NR mixture with a typical RBR showed a Pb/Blend PGH ratio greater than 7.5 but failed TSR, falling within the yellow area (lower right quadrant), similar to the result for the SR mixture with typical RBR shown in Figure 13a.
Further analysis was conducted to identify the factors leading to TSR failures in the SR and NR mixtures with typical RBR (SR_0.16_64-22Low and NR_0.21_58-28Low), which exhibited Pb/Blend PGH ratios greater than 7.5 but fell within the yellow areas (lower right quadrants) in Figures 13a and 14b. The product of each virgin aggregate proportion in the mix design (Blend%) and its water absorption capacity (AggAbs) was calculated for each mixture evaluated in this study. The maximum resulting product was chosen as an additional tool for screening component materials for moisture resistance evaluation, indicating the combined effect of the absorption capacity of a particular aggregate source and the corresponding quantity included in the mix design. Figure 15a presents the outcome obtained for mixtures that required a high RAM strategy as part of the cracking performance evaluation included in Analysis #2. Figure 15b presents the results for mixtures without high RAM strategies examined in Analysis #3. Similar to previous interaction plots, the labels ‘T’, ‘H’, and ‘RAS’ denote mixtures with typical RAP, high RAP, and high RAP/RAS RBRs, respectively, for each combination of materials (NR, NS, SR, SS) coded by color and symbol.
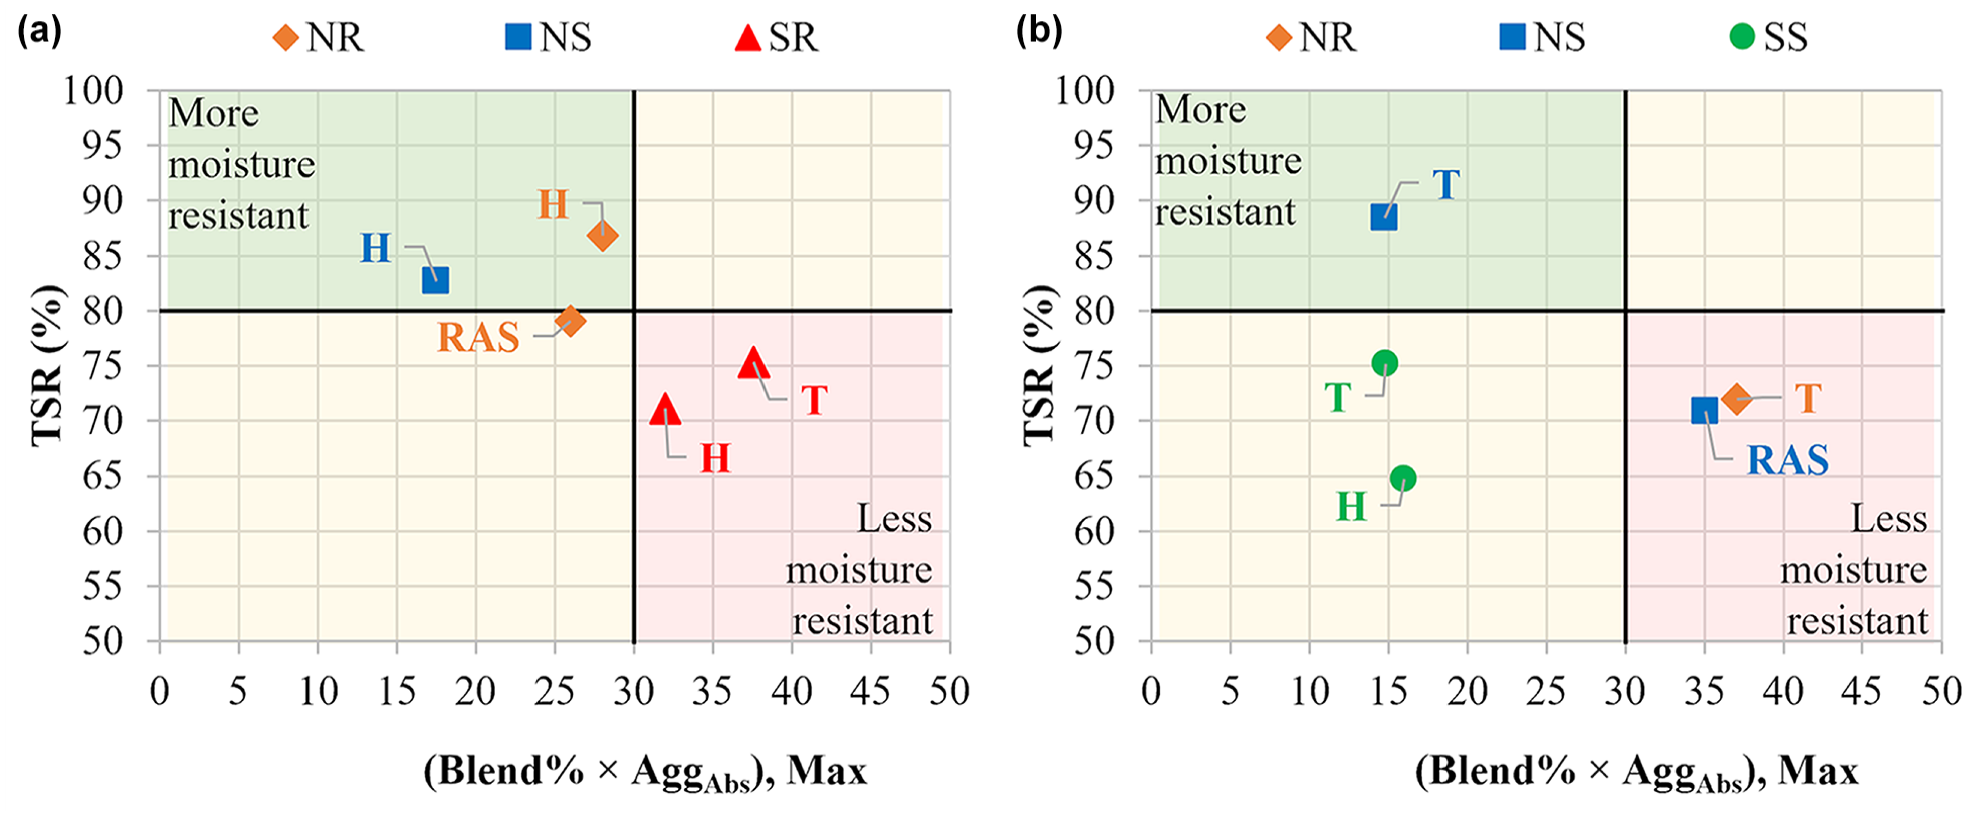
Tensile strength ratio (TSR) versus maximum product of aggregate blend proportion (Blend%) and its water absorption capacity (AggAbs) for mixtures (a) requiring high recycled asphalt material (RAM) strategies to improve cracking (Analysis #2) and (b) mixtures without high RAM strategies (Analysis #3).
The results suggested that most of the TSR results were acceptable when the maximum resulting products of the aggregate proportion and its water absorption capacity were less than or equal to 30. For instance, the SR and NR mixtures with typical RBR (SR_0.16_64-22Low and NR_0.21_58-28Low), which previously exhibited acceptable Pb/Blend PGH ratios ((Pb/Blend PGH) × 100 ≥ 7.5) but failed the TSR, showed products higher than 30 and fell within the red area (lower right quadrant). This indicates that the moisture resistance of these SR and NR mixtures with typical RBR was likely influenced by the selected aggregate sources and proportions. Conversely, the SS mixtures within the yellow area (lower left quadrant) in Figure 15b exhibited products lower than 30, but failed the TSR. The moisture resistance of these mixtures did not appear to be influenced by the aggregate proportion and its water absorption capacity. Instead, these mixtures showed Pb/Blend PGH ratios lower than 7.5, indicating the influence of binder quantity and quality on the TSR, as shown in Figure 14b. Finally, as expected, mixtures influenced by both the aggregate proportion and its water absorption capacity and the binder quantity and quality resulted in failed TSR, as evidenced in both the SR mixture with high RBR (SR_0.29_64-22Low) and the NS mixture with high RAP/RAS RBR (NS_0.33_58-28Low).
The results of this analysis indicate that the moisture resistance of mixtures with recycled materials can be captured by two screening tools defined based on component materials parameters, namely the binder quantity and quality, represented by the Pb/Blend PGH ratio (multiplied by 100), and the aggregate proportion and its water absorption capacity, represented by the Blend% × AggAbs product. Table 6 presents the results for each component material screening tool and TSR results for all 10 control mixtures evaluated in this study. The results demonstrated the relevance of meeting both screening tools to achieve acceptable moisture resistance. Some mixtures that met the binder quantity and quality criteria ((Pb/Blend PGH) ×100 ≥ 7.5) failed the TSR because of the influence of the aggregate proportion and water absorption capacity, such as the NR_0.21 and SR_0.16 mixtures. In contrast, some mixtures meeting the aggregate proportion and absorption capacity criteria (Blend% × AggAbs < 30) failed the TSR because their Pb/Blend PG ratios were not equal to or greater than 7.5, such as the NR_0.44 mixture and the two SS_0.22 and SS_0.39 mixtures. Therefore, the comprehensive analysis of all mixtures evaluated in this study identified that the component materials influencing mixture moisture resistance included the aggregate proportion (Blend%) and its absorption capacity (AggAbs), along with the total binder quantity (Pb) and quality (Blend PGH).
Component Material Screening Tools and Tensile Strength Ratio (TSR) Results Across All Control Mixtures
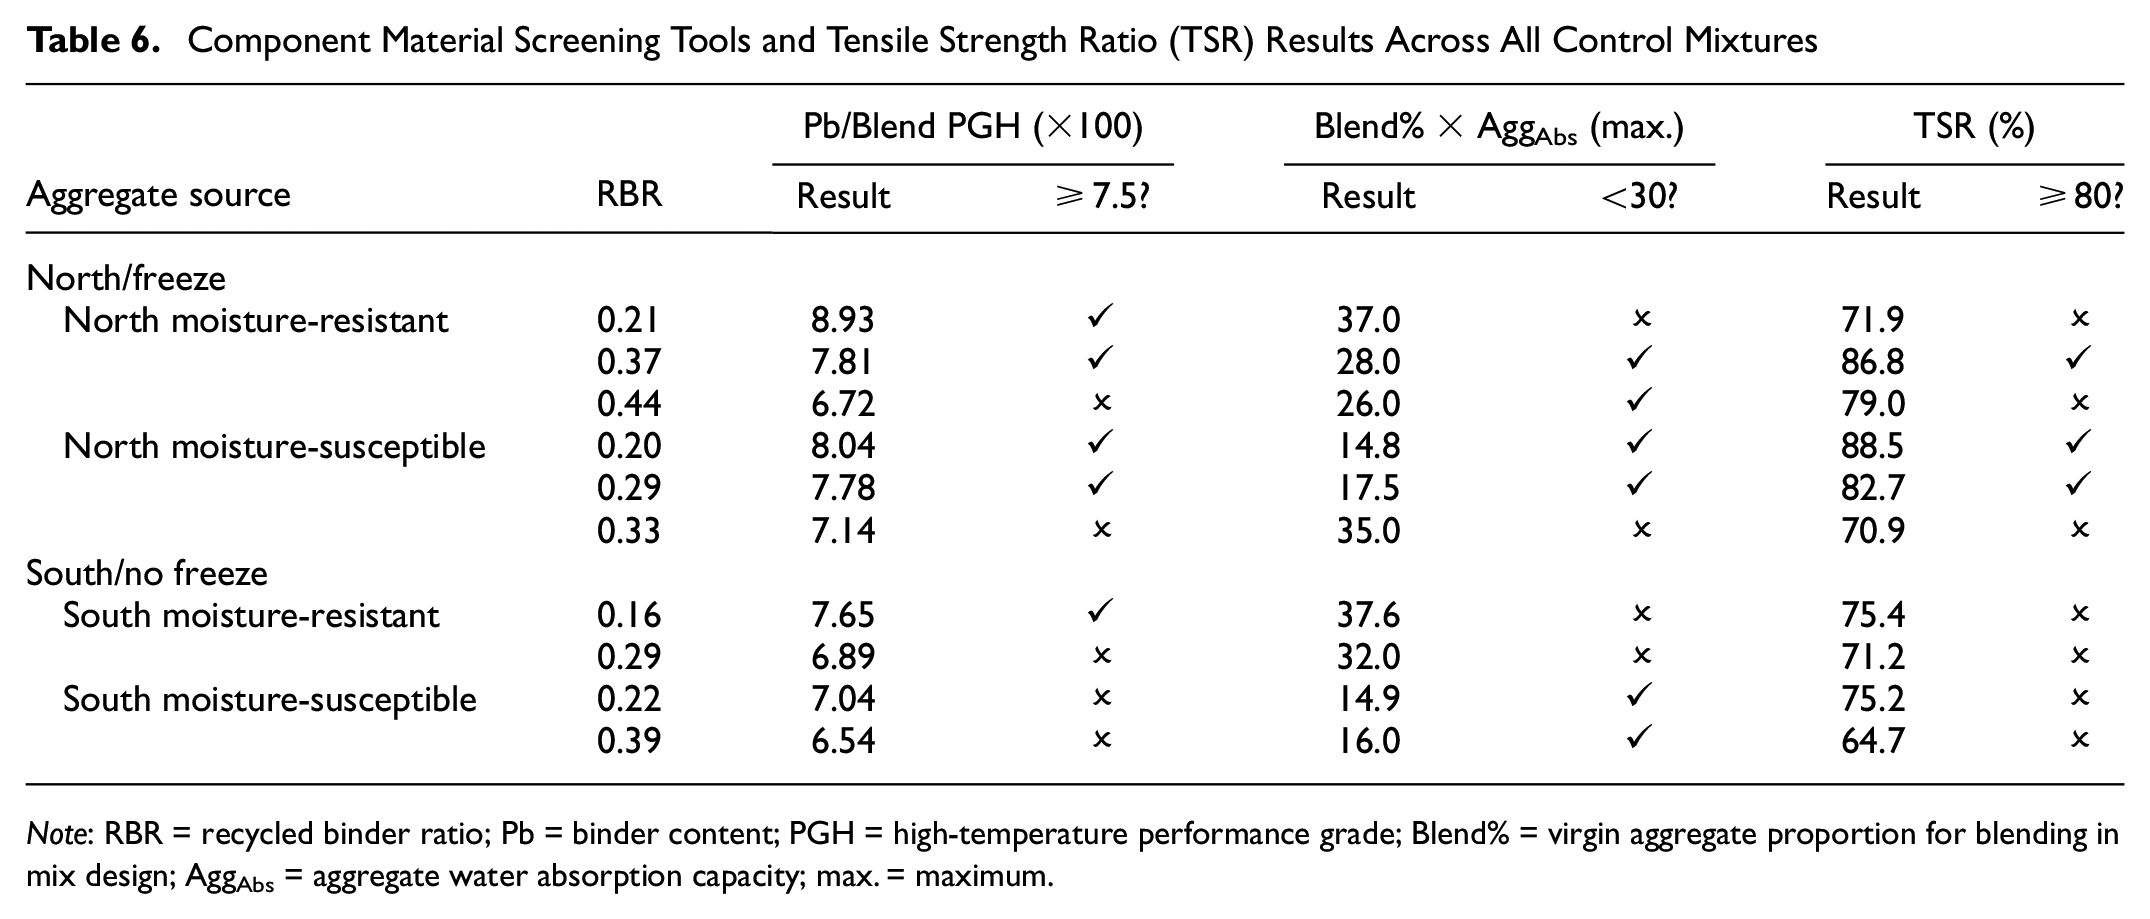
Note: RBR = recycled binder ratio; Pb = binder content; PGH = high-temperature performance grade; Blend% = virgin aggregate proportion for blending in mix design; AggAbs = aggregate water absorption capacity; max. = maximum.
Raveling Evaluation
Figure 16 provides the raveling results across the five selected NR and SR robust mixtures with high RAM or moisture strategies, if required, using the Cantabro test. Robust mixtures refer to those with the necessary strategies that provide acceptable results with respect to cracking, moisture, and raveling while also showing acceptable rutting resistance. Two results were included: %AL after STOA only and after combined (STOA + critical aging + moisture) protocols. These results are shown with error bars indicating one positive and one negative standard deviation from the average %AL, and the results after STOA only are overlayed in lighter colors.
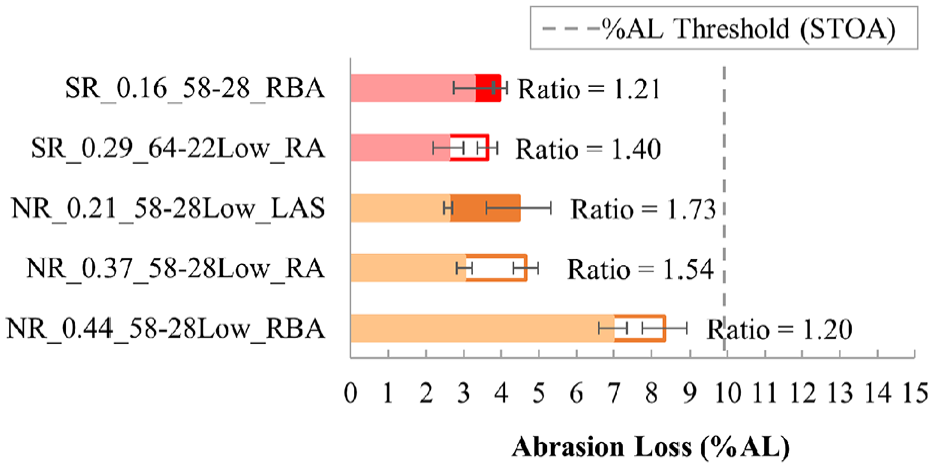
Raveling results for north moisture-resistant (NR) and south moisture-resistant (SR) robust mixtures (bars overlayed represent results after short-term oven aging [STOA] only).
The results indicate that all five mixtures evaluated passed both the %AL criteria after STOA and the %AL Ratio, which combines the %AL before and after combined critical aging and moisture conditioning. This suggests that the use of strategies to improve other durability issues, such as cracking or moisture, does not negatively affect the resistance of mixtures with recycled materials to raveling. Mixtures utilizing high RAM strategies showed greater benefits, as evidenced by the lower %AL Ratios, indicating lower susceptibility to combined aging and moisture effects. For example, the typical 0.16 SR mixture with a combined softer + decreased RBA strategy (SR_0.16_58-28_RBA) and the high 0.44 RBR RAP/RAS NR mixture with decreased RBA (NR_0.44_58-28Low_RBA) exhibited %AL Ratios of approximately 1.20. Conversely, the typical 0.21 RBR mixture with NR aggregate that required LAS as a moisture strategy (NR_0.21_58-28Low_LAS) exhibited the lowest resistance to combined aging and moisture effects, evident in the highest %AL Ratio (1.73). This suggests that mixtures with high RAM strategies offer improved resistance to raveling when subjected to combined conditioning, particularly those with additional virgin binders resulting from the decreased RBA strategy.
Conclusions
This study evaluated the overall durability of a set of mixtures with typical and high RBRs through practical laboratory tests and conditioning protocols tied to climactic zones in the U.S.A. (north/freeze and south/no freeze). This study builds on Bairgi et al. ( 47 ), who explored only the cracking resistance to ensure durability with respect to rutting, moisture susceptibility, and raveling. The durability of the mixtures was assessed by comparing the outcomes of durability parameters with preliminary thresholds also tied to the climatic zone. Furthermore, this study investigated the effect of strategies utilized to improve performance and explored the relationship between durability parameters and properties of component materials. The asphalt mixtures evaluated corresponded to 10 existing mix designs that represent actual mixtures produced in each climatic zone of the U.S.A. A set of high RAM strategies, including replacing the virgin binder, using a RA, or increasing the effective binder content by decreasing the RBA, was considered to mitigate the negative effects of high RAM contents in mixtures. Similarly, a LAS agent or hydrated lime were considered as moisture strategies to improve moisture resistance. The mixtures were evaluated for the primary durability issues following the proposed durability assessment framework, which evaluates first cracking performance with the IDEAL-CT, moisture damage with the HWTT, TSR by IDT, and finally raveling with the Cantabro test, while also checking for balanced rutting performance with the HWTT. Different analyses were conducted using interaction plots relating the durability parameters and selected screening tools based on component materials parameters to identify their influence on durability. The main outcomes and key findings of this study are as follows.
The most effective high RAM strategies required to improve cracking performance of asphalt mixtures with high RBRs varied with component materials and their proportions. All high RBR mixtures evaluated in this study required a high RAM strategy to achieve the desired cracking resistance suitable for the climatic zone. Two mixtures with typical RBRs did not require high RAM strategies, while one typical RBR mixture, the SR mixture with 0.16 RBR, required a combination of strategies (softer binder + decreased RBA), likely because of the high stiffness of the RAM source. Evaluation of rutting, moisture, and raveling resistance employing the required high RAM strategies to enhance cracking performance indicated that these mitigation strategies did not create additional rutting, moisture, or raveling issues.
The ratio of total RAP binder content (RAP Pb) to RAP binder PGH multiplied by 100 ((RAP Pb/RAP PGH) ×100) was found to have an impact on RAM binder activation, as measured by the DoA. Higher RAP Pb/RAP PGH ratios corresponded to higher DoA results. Similarly, the ratio of total binder content (Pb) in the mixture to binder blend PGH multiplied by 100 ((Pb/Blend PGH) ×100) influenced mixture durability. Mixtures with Pb/Blend PGH ratios exceeding 8.0 and 7.5 demonstrated improved durability with respect to cracking and moisture resistance, respectively. Therefore, the Pb/Blend PGH ratio could be used as a screening tool to capture the influence of the binder quantity and quality on the durability of mixtures incorporating RAMs. However, other binder quality parameters, aggregate properties, and binder–aggregate interactions should be explored toward future recommendations to enhance mixture durability.
The blend proportion of aggregate in the mix design (Blend%) and its corresponding water absorption capacity (AggAbs) influenced mixture moisture resistance. To assess its influence, the product of aggregate blend proportion and its absorption capacity (Blend% × AggAbs) was determined for each mixture. The results indicated that mixtures with maximum products lower than 30 exhibited acceptable moisture resistance, except for those failing to meet the Pb/Blend PGH ratio. Thus, Blend% × AggAbs emerges as an additional screening tool proposed in this study to capture the influence of aggregate source and proportioning on moisture resistance of mixtures with recycled materials. Moreover, both screening tools for moisture evaluation, the Pb/Blend PGH ratio and Blend% × AggAbs, were found to be useful and complementary to explain the results obtained in this study. However, analysis incorporating other component materials and mixture parameters should be developed to establish additional tools and recommendations for durability evaluation of high RBR asphalt mixtures.
In conclusion, this study demonstrates that implementing high RAM strategies to improve cracking performance can result in asphalt mixtures with balanced performance and satisfactory durability, while also obtaining the economic and environmental benefits of using RAMs. Further evaluation of mixtures incorporating additional combinations of materials across different U.S. climates is necessary to refine the framework and thresholds utilized in this study. In addition, the construction of field projects adopting the recommended guidelines for material selection and mixture performance evaluation proposed here will significantly enhance the durability assessment of high RBR mixtures.
Footnotes
Author Contributions
The authors confirm contribution to the paper as follows: study conception and design: A. Epps-Martin, E. Arámbula-Mercado, N. Tran; data collection: J. Montañez, M. Verma, B. K. Bairgi, R. Moraes; analysis and interpretation of results: A. Epps-Martin, E. Arámbula-Mercado, J. Montañez, N. Tran, F. Yin, M. Verma, B. K. Bairgi, C. Rodezno; draft manuscript preparation: J. Montañez, A. Epps-Martin, E. Arámbula-Mercado, F. Yin, B. K. Bairgi, C. Rodezno. All authors reviewed the results and approved the final version of the manuscript.
Declaration of Conflicting Interests
Edith Arámbula-Mercado is a member of Transportation Research Record’s Editorial Board. All other authors declared no potential conflicts of interest with respect to the research, authorship, and/or publication of this article.
Funding
The author(s) disclosed receipt of the following financial support for the research, authorship, and/or publication of this article: This research is part of NCHRP project 09-65, which is part of NCHRP. NCHRP is administered by the Transportation Research Board (TRB) and funded by participating member states of AASHTO. NCHRP also receives critical technical support from the Federal Highway Administration (FHWA), U.S. Department of Transportation.