
Abstract
In urban areas, searching for parking and electric vehicle (EV) charging can result in cruising, congestion, and environmental externalities. Recognizing the business opportunity of offering private parking and charging infrastructure access within multi-unit dwellings (MUDs) during daytime, we model a shared parking and EV charging management system. We maximize the revenue of MUD charging hubs in mixed land use, catering to public demand. Our approach accounts for the objectives of the two stakeholders involved: a demand model is fitted on the choices of EV charging users, and the supply model optimizes the allocation of parking and charging requests in an MUD parking lot. A binary integer linear programming model for the allocation of parking and charging spaces with a rolling horizon is integrated with matching rules that handle both parking and charging requests. In our numerical experiments in a neighborhood of Chicago, Illinois, we estimate the performance of the MUD parking and charging system with metrics that include revenue, number of matchings, and utilization rates. At any given time, MUDs with lower prices attract more charging requests, particularly those of longer duration, resulting in higher revenue and greater charging utilization. Dynamic pricing facilitates a more equitable distribution of requests; as MUD parking lots reach capacity and their fees increase, other MUDs become more competitive, attracting additional requests. Comparing our method against first-come-first-served and optimal-solution benchmarks, we demonstrate our model’s effectiveness in dynamically managing mixed parking and charging demand in MUD charging hubs.
Keywords
In urban areas, parking management emerges as a notable issue, raising concerns related to environmental and congestion externalities. Increased bottlenecks, vehicle tailpipe emissions, and fuel consumption are associated with spending more time searching for parking in city centers. Drivers in congested cities spend an average of 14% of their total driving time searching for parking ( 1 ), while up to 30% of urban traffic can be attributed to drivers searching for parking ( 2 ). A study in Chicago, Illinois, revealed that vehicles collectively traveled approximately 63 million miles a year in search of vacant parking spaces, resulting in 48,000 tons of carbon dioxide ( 3 ). This unproductive driving has a detrimental impact on air quality and public health because of increased greenhouse gas emissions. The circling and idling of vehicles while they are searching for parking are found to increase fuel consumption by anywhere from 3% to 14% ( 4 ).
A sparse network of parking spaces equipped with charging infrastructure poses an additional challenge to owners of electric vehicles (EVs) ( 5 ). Limited chargers in urban parking facilities hinder frequent and convenient public charging ( 6 ). The absence of urban destination charging can discourage the widespread adoption of EVs, as future owners are deterred by the unavailability of reliable charging infrastructure.
Shared parking and its management enables multiple users or businesses to share the same parking area, maximizing the utilization of available parking spaces ( 7 ). This concept allows the efficient allocation of parking spaces to different users at different times, such as office workers parked during business hours and residents of apartment complexes and multi-unit dwellings (MUDs) at night. The literature on shared parking is extensive, as demonstrated in Table 1. Most existing studies have concentrated on the challenges associated with sharing public parking spaces, often overlooking the complexities involved in sharing the private parking facilities located in MUDs. Only a few studies have addressed private parking lot sharing ( 7 , 8 ). In addition, the optimization objectives of existing studies focus on platform profits and social welfare, often overlooking and not integrating users’ behaviors. Finally, the literature presented here specifically concentrates on shared parking, while other studies (e.g., [ 5 ]) solely focus on EV charging, with limited research examining the intersection of shared parking and charging management.
Existing Literature on Shared Parking
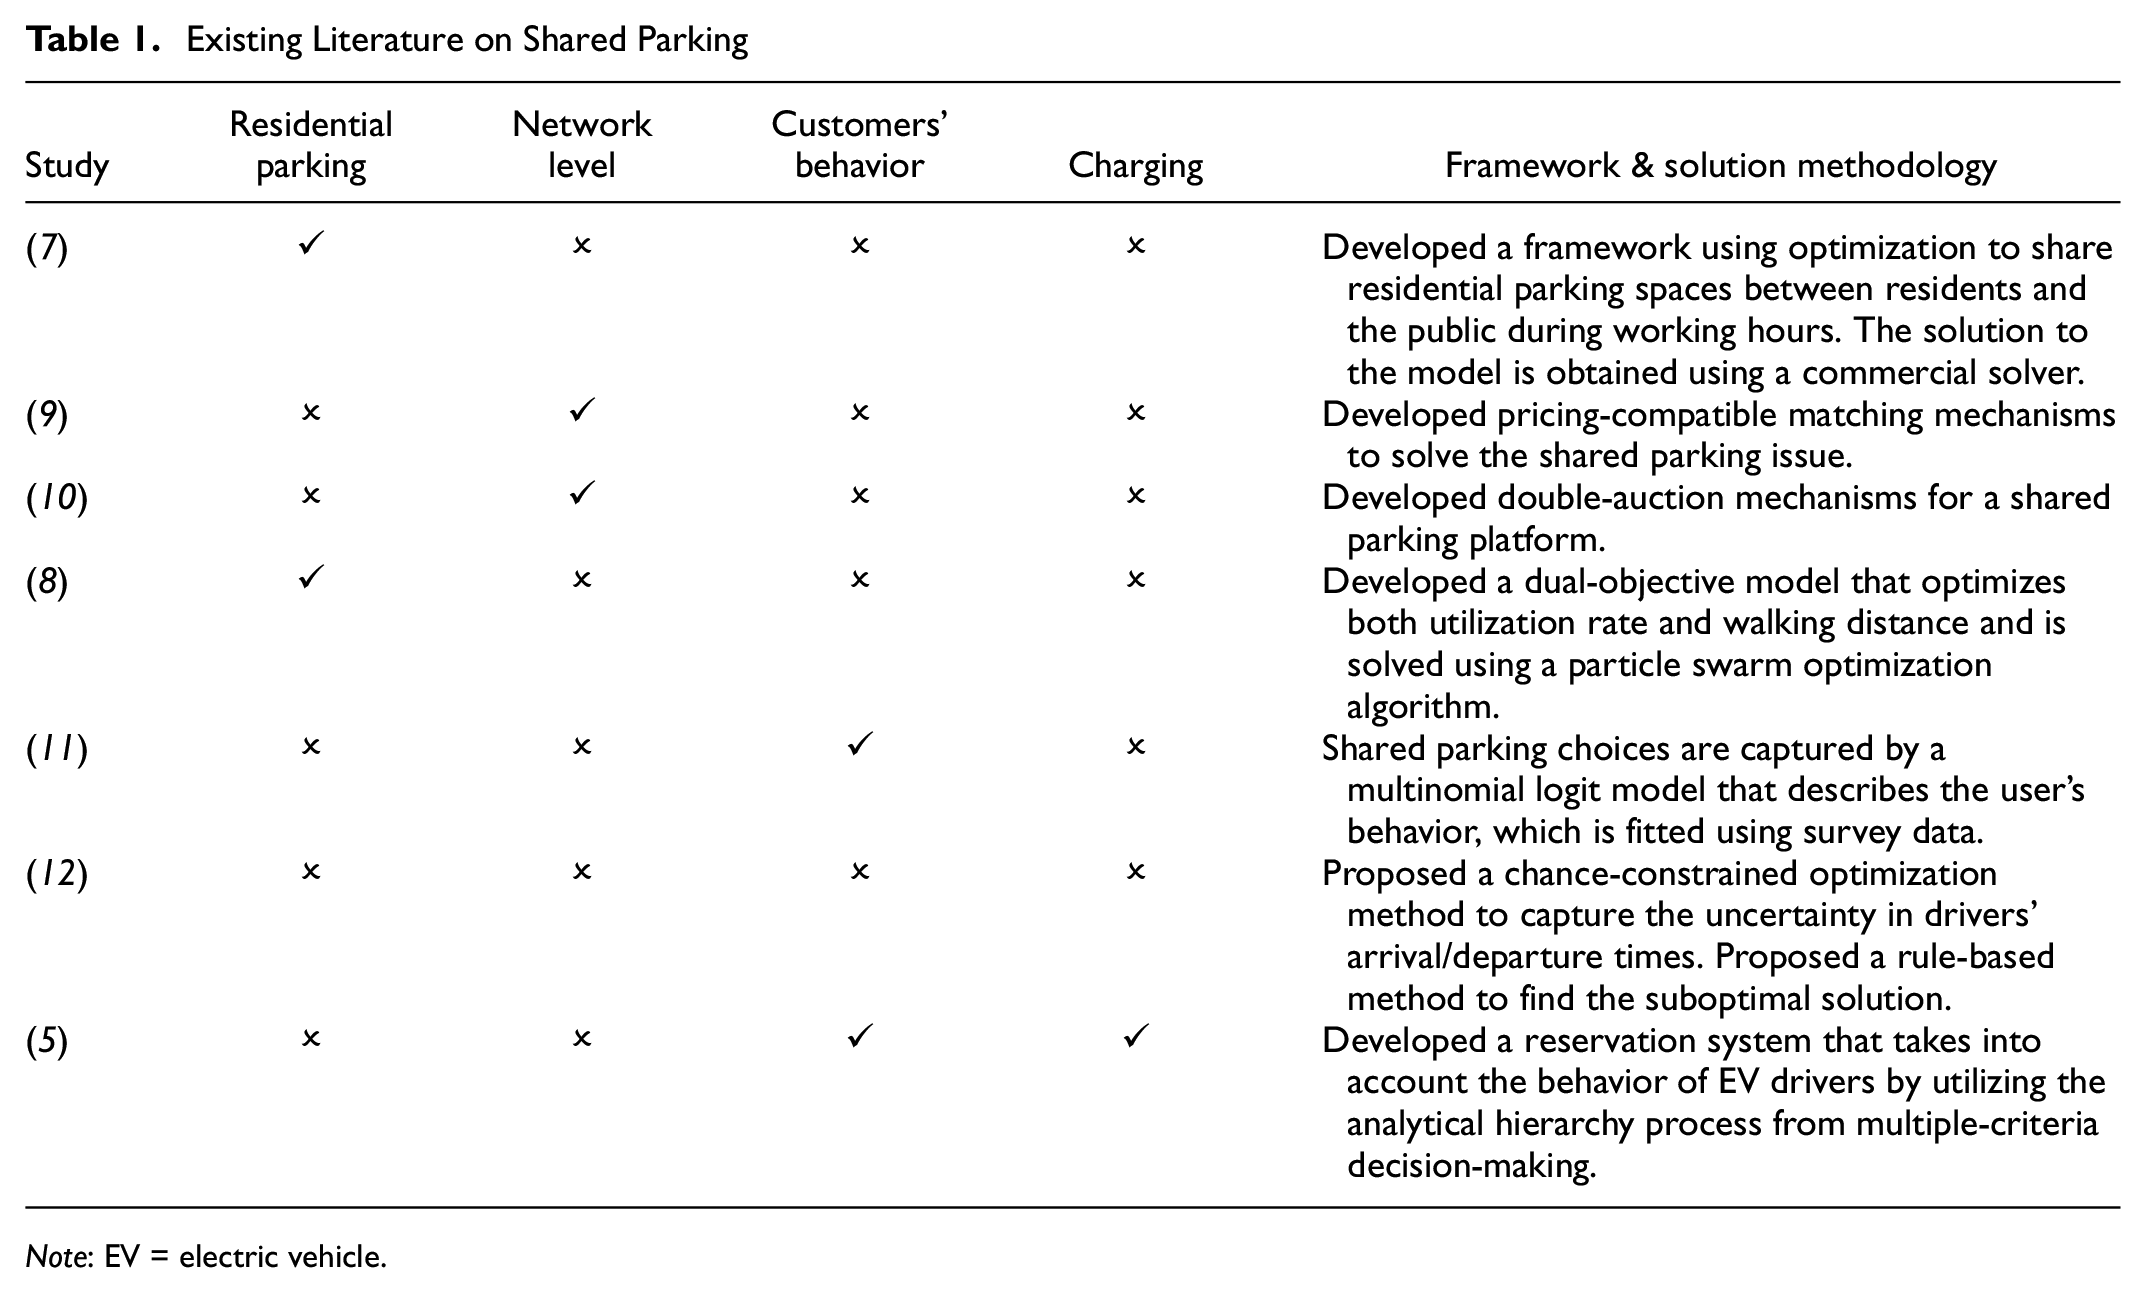
Note: EV = electric vehicle.
Our research focuses on the management of shared parking and charging infrastructure within MUDs. In our previous studies ( 13 , 14 ), we found that a significant portion of MUD residents (47%) tend to return home between the hours of 4 p.m. and 7 p.m. Furthermore, 17% and 15% of MUD residents come home during the time periods of 8 p.m. to 10 p.m. and 11 a.m. to 1 p.m., respectively. In relation to departures, approximately half of MUD residents (53%) leave their homes between 7 a.m. and 11 a.m., while 19% of residents leave between 1 p.m. and 3 p.m. Consequently, many private parking spaces and charging stations within MUD parking lots remain available during the daytime because these residents typically commute by car, resulting in low charging utilization rates. The average maximum utilization rate of charging infrastructure (i.e., the proportion of the day, which spans a full 24-h cycle, during which the charging infrastructure is actively in use) in MUDs is only about 29% ( 13 ). Given that the installation and use of home chargers in MUDs can be hindered by the capital and installation cost burden ( 15 ), the implementation of shared parking and charging management within MUDs presents a potentially viable business model in mixed land use where businesses and residences coexist. On the one hand, such a concept allows for increased utilization of parking spaces and chargers within MUDs, generating revenue that can help alleviate cost burdens. On the other hand, the general public gains increased access to parking spaces and charging services.
Our paper contributes to the existing literature as follows. We present a rolling-horizon shared parking and charging system specifically designed for MUDs while capturing the dynamics of a system of MUD parking and charging lots. We propose binary integer linear programming (BILP) to allocate parking and charging requests to available parking spaces, including those equipped with chargers. The model incorporates matching rules to handle scenarios involving a mix of parking and charging requests and determines the most appropriate rule. On the demand side, we conduct counterfactual analysis to fit a charging choice model using empirical data. The model includes variables such as charging duration, distance from a proxy destination, number of charging stations at a location, total parking fee, and amount of charging. Our proposed management model and its heuristic algorithmic solution are applied to a neighborhood of Chicago, Illinois, and we assess its performance by comparing it with a first-come-first-served (FCFS) strategy as well as optimal results derived by commercial solvers. The optimal solution is based on the assumption of a static scenario where all future requests are known in advance, unlike our system, which dynamically accepts and processes parking and charging requests in real time. This comparison not only showcases the practicality of our model but also its superior performance in managing the complex interplay of parking and charging needs.
Problem Statement
In areas with commercial land use in urban centers, drivers often face challenges in finding convenient parking spaces for their fossil-fueled vehicles and charging spots for their plug-in EVs. To address this issue, a shared parking and charging management system can be implemented in areas that have a mix of commercial and residential land uses. During the daytime, many private parking spaces and charging stations in nearby residential premises and MUDs become available as residents drive their cars to work, resulting in the underutilization of this home charging infrastructure. Our proposed system, shown in Figure 1, models user demand and parking and charging reservations received by MUD parking lots that implement management practices. Each MUD parking lot and user is considered a utility-maximizing entity and aims to maximize profit and minimize costs, respectively.
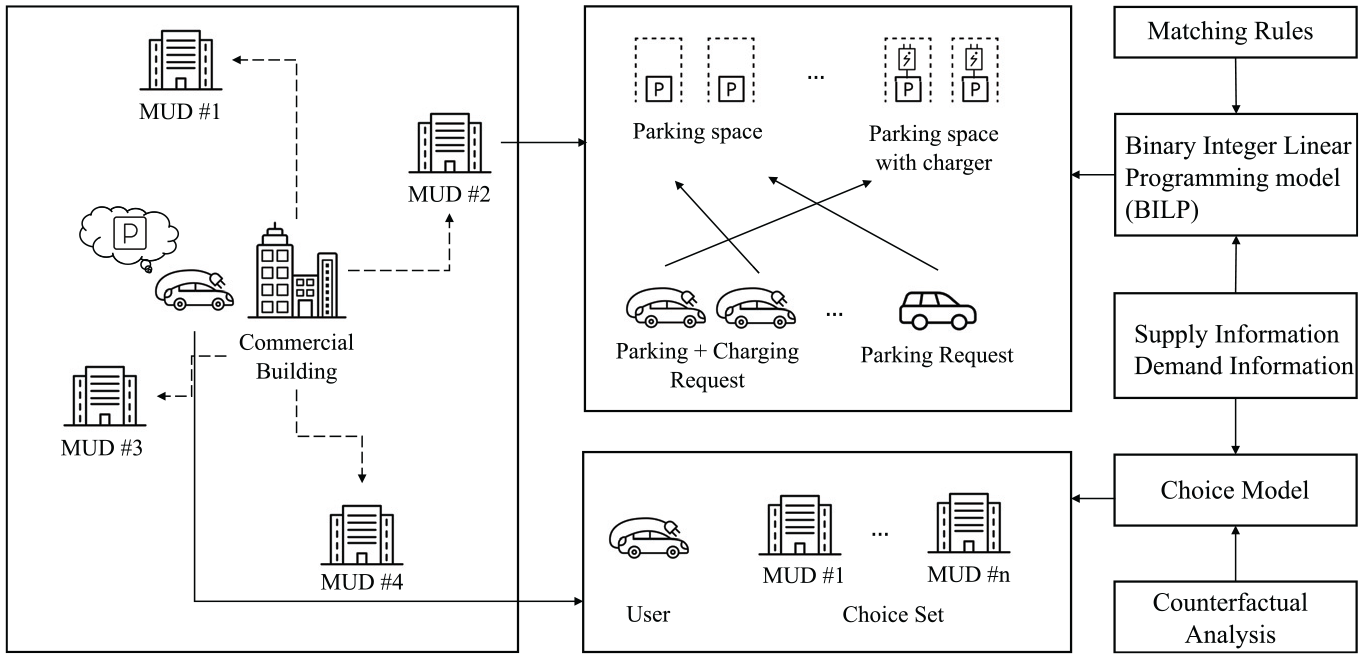
Schematic of our shared parking and charging management approach to MUD parking lots. This illustration outlines a user’s choice model based on utility maximization, which guides selection among various MUD parking/charging lots. Factors influencing this choice include fees, charger availability, and location. The proposed BILP model then allocates specific parking and charging spaces within the chosen MUD, accounting for current parking demand and space availability.
Within each MUD parking lot, there are two types of parking spaces: regular parking spaces and spaces equipped with charging infrastructure. MUD parking lots, like other commercial parking lots, can provide the general public with information on the availability of parking spaces and fees. Each MUD’s parking management receives two types of requests: both parking and charging requests or parking-only requests. These requests include information such as the desired parking time window and charging demand. The MUD manager solves a BILP model based on the available supply and demand information to allocate the requests to appropriate parking and charging spaces. To account for the mix of electric and gas vehicles, the BILP model incorporates a set of matching rules and determines the most appropriate rule at different decision points.
For users, the decision-making process involves selecting a suitable MUD parking lot based on a choice model that takes into consideration both supply and demand information. To obtain realistic results, we fit the user’s choice model by conducting a counterfactual analysis of observed charging choices. The user’s choice model is not about selecting specific parking spaces within an MUD parking lot but about selecting between different MUD parking lots in a neighborhood. Meanwhile, the BILP model focuses on the allocation of parking spaces within one MUD parking lot to maximize the revenue of the MUD parking lot manager.
Dynamic changes in parking demand and supply are captured throughout the day in the system. New parking requests are placed at any time (based on a distribution), and thus the availability of parking spaces varies as vehicles arrive and depart. Moreover, the dynamic reservation fees are a function of the occupancy rates of the MUD’s parking spaces. As occupancy fluctuates throughout the day, reservation fees are dynamically adjusted, which is a critical aspect of effectively managing the parking system. Therefore, to capture the dynamic nature of the system and the logit-based charging decisions, we implemented a rolling-horizon strategy. The rolling-horizon strategy allows the system to update periodically based on the latest information rather than relying on a travel schedule set in advance. This means that at each optimization time, the system is updated based on the most current data on parking requests and space availability. This informs a more accurate allocation of resources for efficient use of the parking and charging infrastructure. As illustrated in Figure 2, the strategy involves a process where users submit requests and the system operator periodically solves the BILP problem for each MUD lot at defined intervals known as optimization times. The duration between two successive optimization times is called an optimization period. At each optimization time
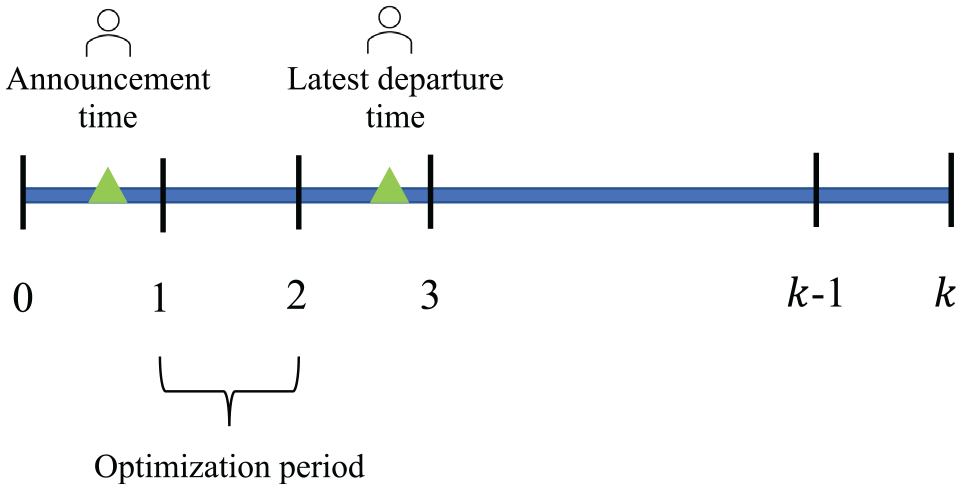
Illustration of the proposed rolling-horizon strategy.
By implementing this shared parking and charging management system, we aim to address the challenges associated with parking and charging infrastructure for both conventional cars and EVs, ultimately improving the efficiency and utilization of existing parking facilities in mixed-land-use areas.
Methodology
Parking and Charging Space Allocation Model for MUDs
During each optimization time, MUDs allocate parking spaces to the received requests by solving an optimization model. The decision variables and parameters associated with this model are presented in Table 2. The objective function aims to maximize the total revenue generated during the operation of the proposed system for each MUD parking lot. We design our BILP model based on a simple reservation and allocation model of shared parking lots created in ( 7 ).
Mathematical Notation
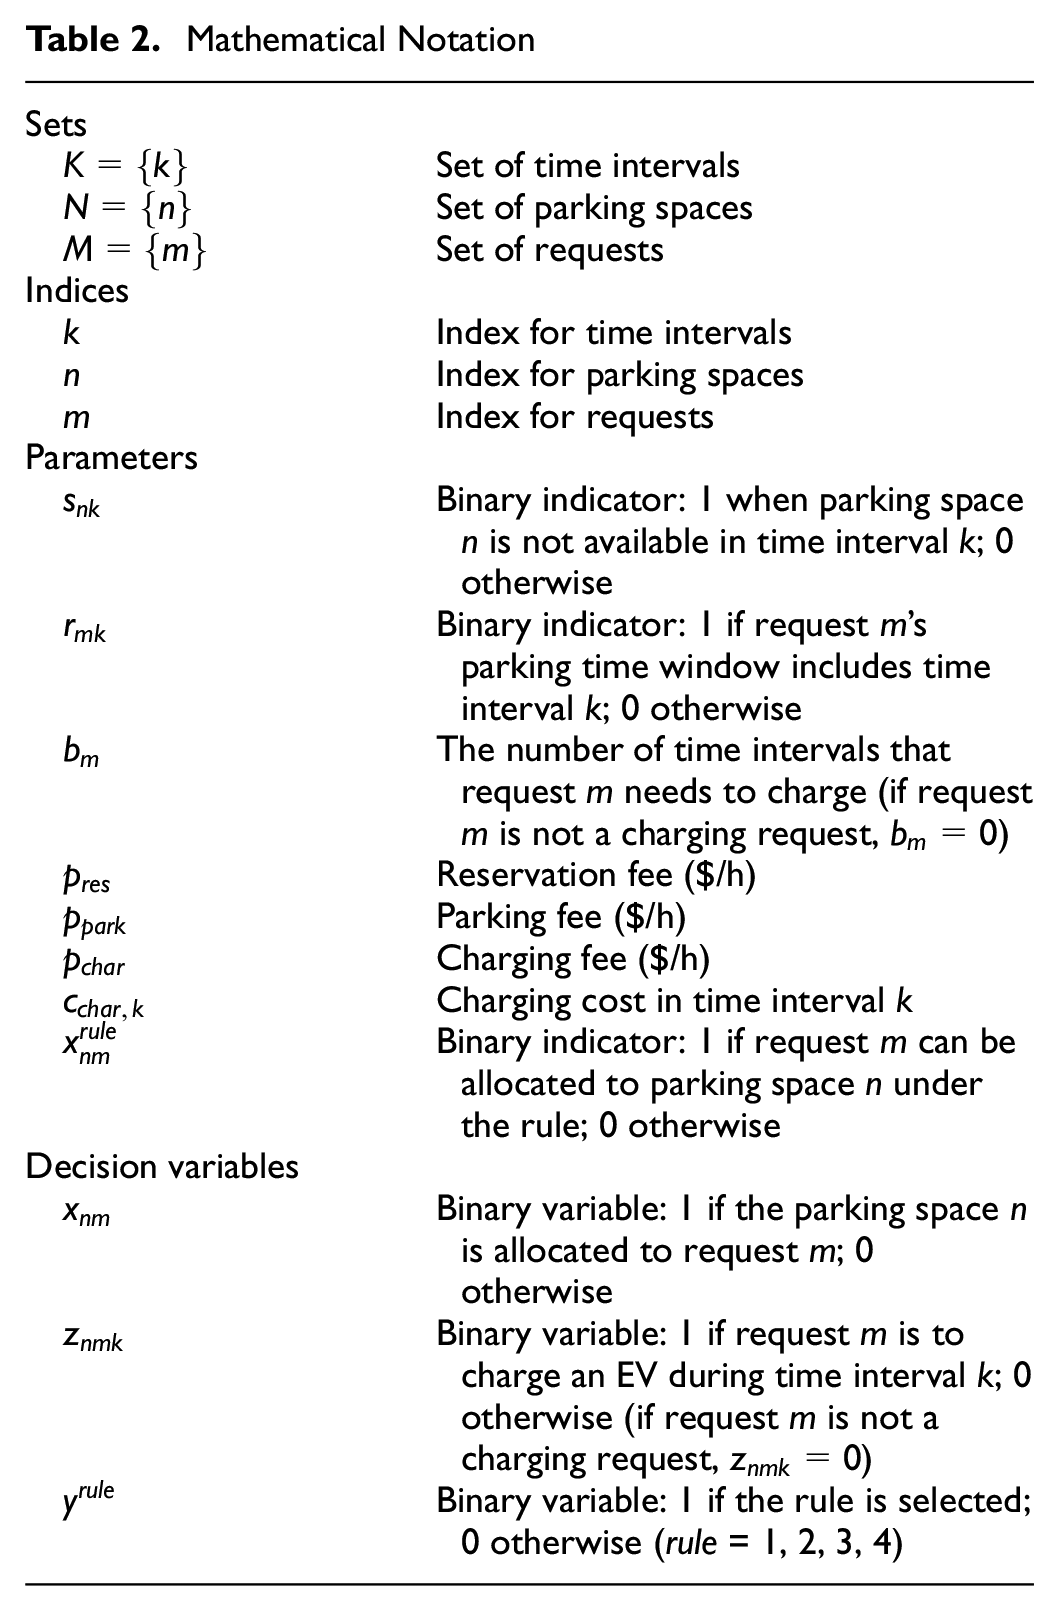
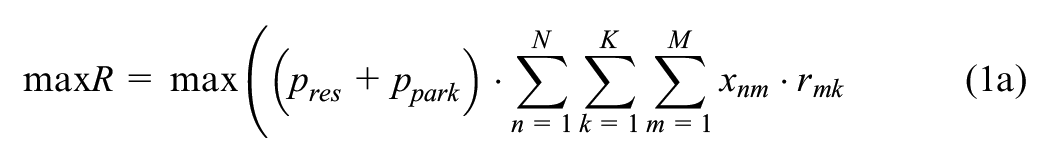
The first term of the objective function (1a in the equations listed below) corresponds to the revenue generated from reservation and parking fees. The reservation fee is a step function of parking utilization (
16
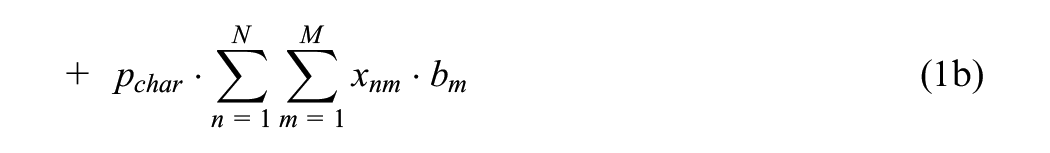
). Figure 3 provides an illustration of the dynamic nature of the reservation fee. The second term (1b) represents the revenue generated from the charging fee collected for the use of the charging infrastructure. The third term (1c) accounts for the cost incurred by MUDs for providing this charging service. This includes expenses related to electricity consumption and the maintenance of the charging infrastructure. The fourth term (1d) denotes the number of requests that are rejected because of unavailability of parking spaces or charging stations. The parameter
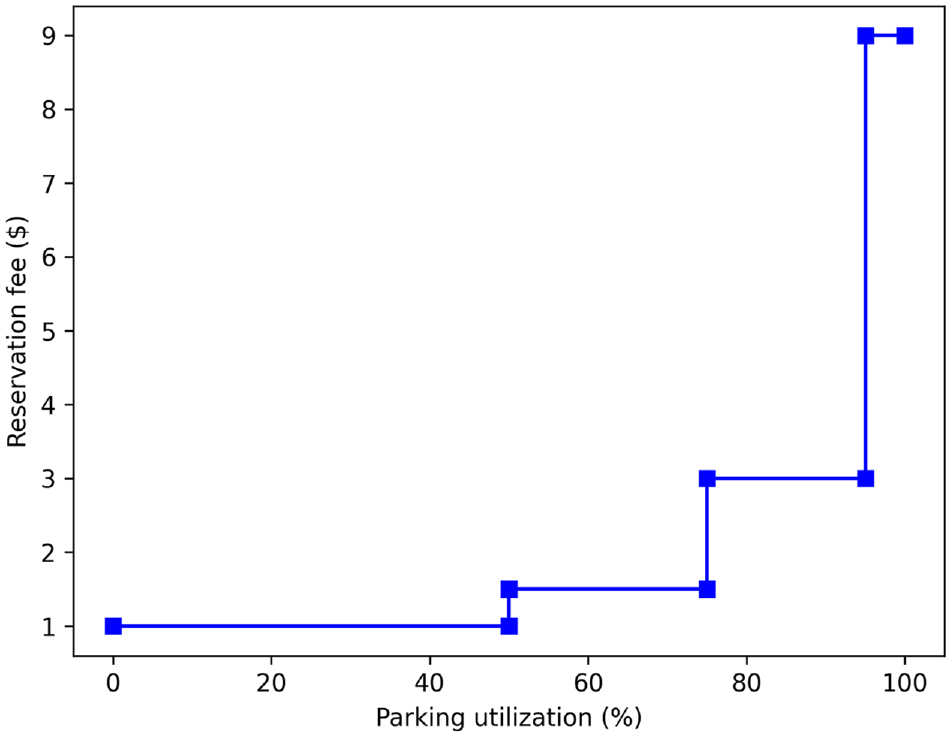
Dynamic parking reservation fee (in U.S. dollars) as a step function of parking utilization (%).
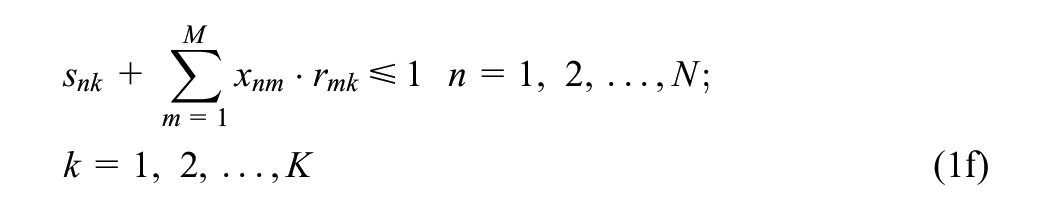
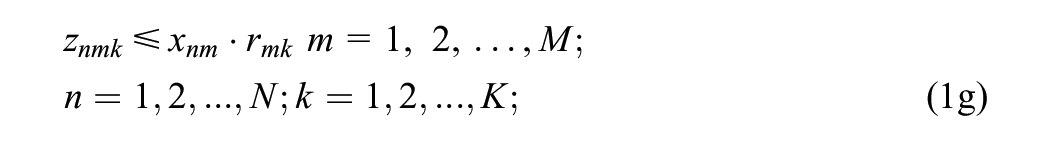
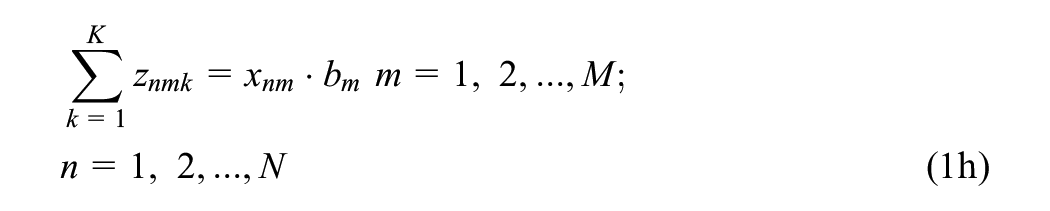
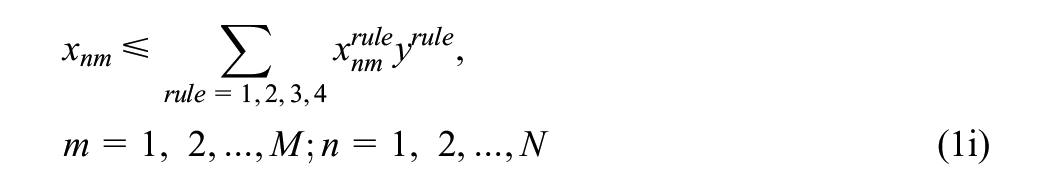
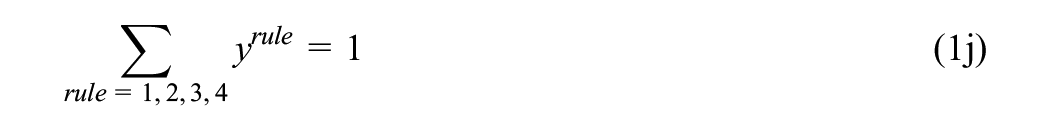
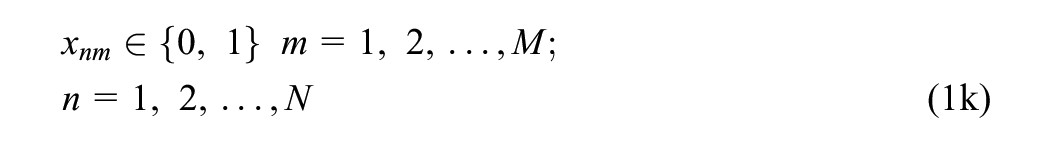
Constraints 1e ensure that each request can be allocated to only one parking space. Constraints 1f ensure that requests can only be assigned to parking spaces that are available and unoccupied during the specific time window requested by the user. These constraints prevent double booking or the allocation of a request to an already occupied parking space. To ensure that charging activities align with the parking time window specified by the request, constraints 1g are introduced. These constraints restrict the charging activities to occur only within the designated parking time window. Constraints 1h guarantee that the charging demands of the requests are met. These constraints ensure that charging infrastructure can accommodate the charging requirements specified by the requests. To enforce the selected matching rule and ensure that it is adhered to, constraints 1i and 1j are implemented. Constraint 1i ensures that the matching results comply with the chosen matching rule, while constraint 1j restricts the selection to a single matching rule out of the four rules. A detailed overview of the matching rules is provided in the next paragraph. Constraints 1k through 1m define the feasible domain of the decision variables.


The BILP model incorporates four distinct matching rules (
17
) (see Figure 4) to handle the allocation of parking and charging requests, as indicated by constraints 1i and 1j. These rules are designed to effectively manage a combination of electric and gas vehicles. Under rule 1, parking-only requests are exclusively assigned to parking spaces, while requests for both parking and charging are allocated to parking spaces equipped with chargers. Rule 2 ensures that parking-only requests can be accommodated in spaces with or without chargers, while requests for both parking and charging are exclusively assigned to spaces with chargers. To further enhance the allocation process, rule 3 specifically assigns parking and charging requests with longer charging durations to parking spaces equipped with chargers. This is achieved through constraint a:
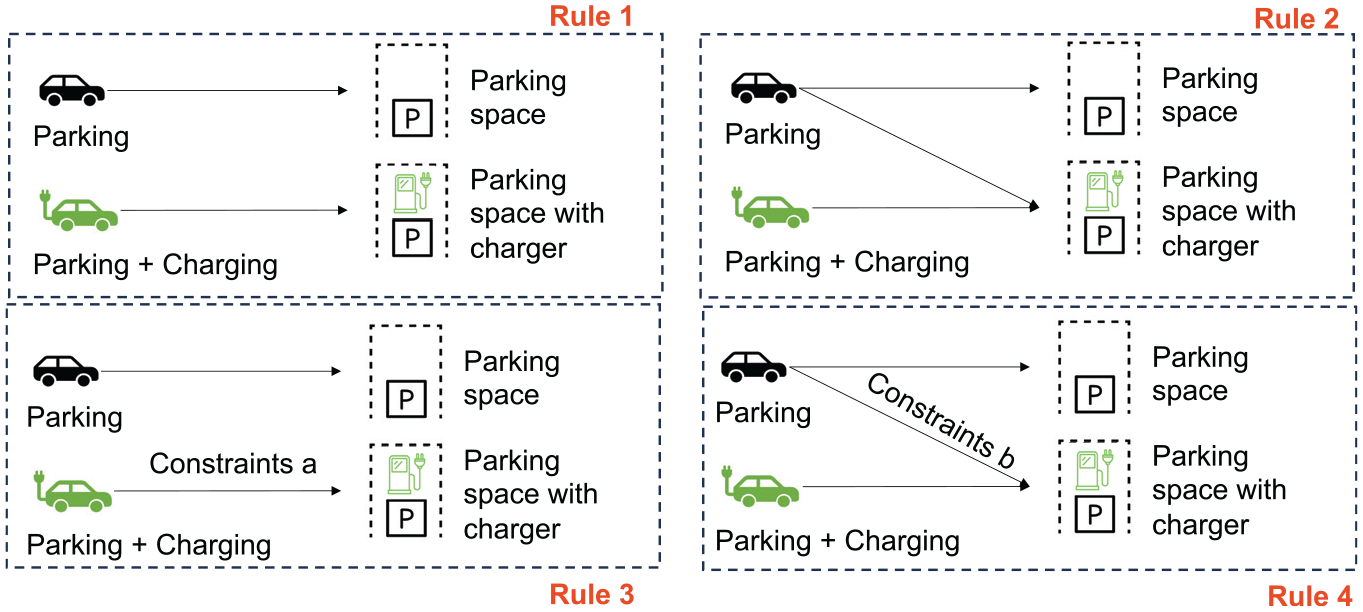
Matching rules embedded in the parking and charging request allocation model and integrated as constraints in our optimization model.
Charging Choice Model for Users
Understanding users’ choices and behaviors with regard to EV charging selection poses a significant challenge. To tackle this, we employ a counterfactual analysis leveraging observed choices made by users and construct the choice set after making reasonable assumptions. Counterfactual analysis, in the context of our research, refers to the approach that utilizes the EVWATTS dataset ( 18 ) to infer charging behaviors in the absence of real-world choice alternatives. This analysis is crucial when direct observational data on users’ choice alternatives are incomplete or unavailable. To construct the choice set in our analysis of EV charging station preferences, we follow a systematic approach for each observation, which corresponds to a charging session at a specific station. First, each observation in our dataset represents a charging session that occurred at a particular charging station. We determine a radius of 800 m around each observed charging station. This radius was chosen to reflect a reasonable walking distance that a driver might be willing to consider if alternative charging options were offered ( 19 ). Within this 800-m radius, we identified all other charging stations in addition to the one where the session occurred. This set of non-dominated stations constitutes the choice set for that particular observation. In the choice set, the specific charging station where the charging session actually took place is considered as the chosen option. The remaining non-dominated stations within the radius are regarded as the alternatives that were not selected by the user. By structuring the choice set in this manner, we ensure that it realistically represents the options available to the user at the time of the charging event.
An example of a choice set for users is illustrated in Figure 5, where the black marker denotes the chosen charging station and circles denote the alternative charging stations. Previous studies ( 11 , 20 , 21 ) have employed logit models to describe choice behaviors related to parking. We reviewed pertinent literature ( 22 – 25 ) to pinpoint common variables influencing EV charging station selection. These were found to include the specifications of the charging facilities (i.e., charging fees, queuing times, user reviews of the charging facility, etc.), sociodemographic attributes (i.e., characteristics of EV drivers, including age, income level, driving patterns, etc.), vehicle attributes (i.e., state of charge [SOC], remaining range, etc.), and trip characteristics (i.e., the expected conditions on arrival at the destination, the total distance subsequently traveled, etc.). While these variables are highlighted in the literature as being significant, our study selectively focused on the most impactful ones based on empirical evidence and practical considerations. Charging fees, for instance, have been consistently identified as significant determinants ( 24 ). Similarly, the availability of chargers ( 24 ) and the distance to the final destination are important ( 22 ), as they address the accessibility and convenience of charging stations. Our dataset, EVWATTS ( 18 ), which records individual charging sessions, guided the selection of variables for our analysis. Each observation in the dataset represents a charging session, with data fields including date, total energy consumed, fees, station location, the number of chargers available, and so forth. We prioritized variables that were both significant in the literature and available, given data limitations. We employed a logit model to capture the user’s preferences for alternative charging options based on key attributes: the distance to the user’s final destination, the charging fee, the estimated charging time, and the number of chargers available at the location. This analysis allowed us to gain insights into the charging users’ decision-making process and the factors influencing their choices.
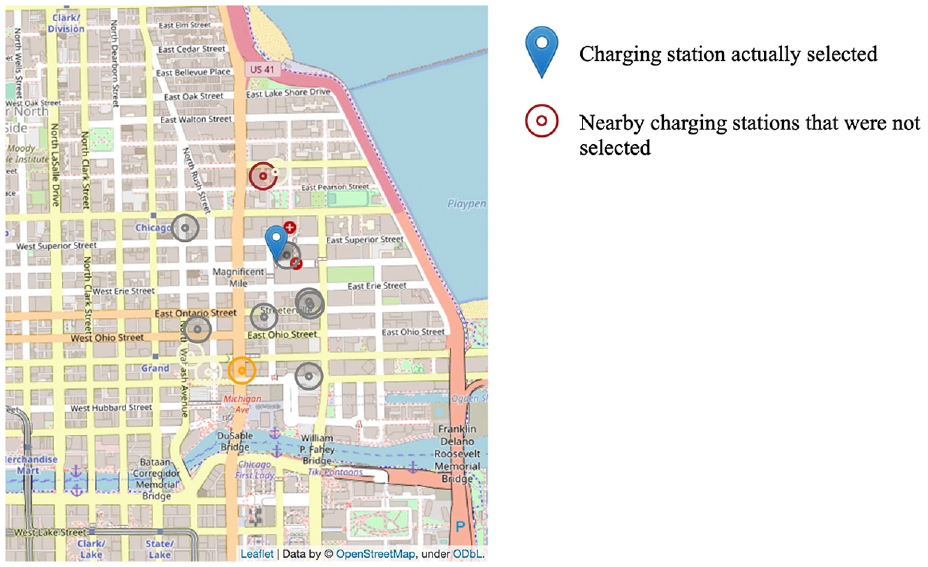
Example of constructing a charging choice set for EV drivers.
Data
Network Data
In our study, we focus on Chicago and present the distribution of multi-family residential and commercial land use based on the 2015 Chicago land use data ( 26 ). The boundary of Chicago was obtained from the Chicago data portal ( 27 ), as depicted in Figure 6a. Figure 6a illustrates the spatial distribution of multi-family residential and commercial land use in Chicago derived from the 2015 Chicago land use data ( 26 ). At the network level, we utilize the 77 Chicago community areas from the Community Data Snapshots provided by the Chicago Metropolitan Agency for Planning ( 28 ). By integrating the geographic data for the 77 community areas with land use, we are able to delineate the distribution of multi-family residential land use within each community, as shown in Figure 6b.
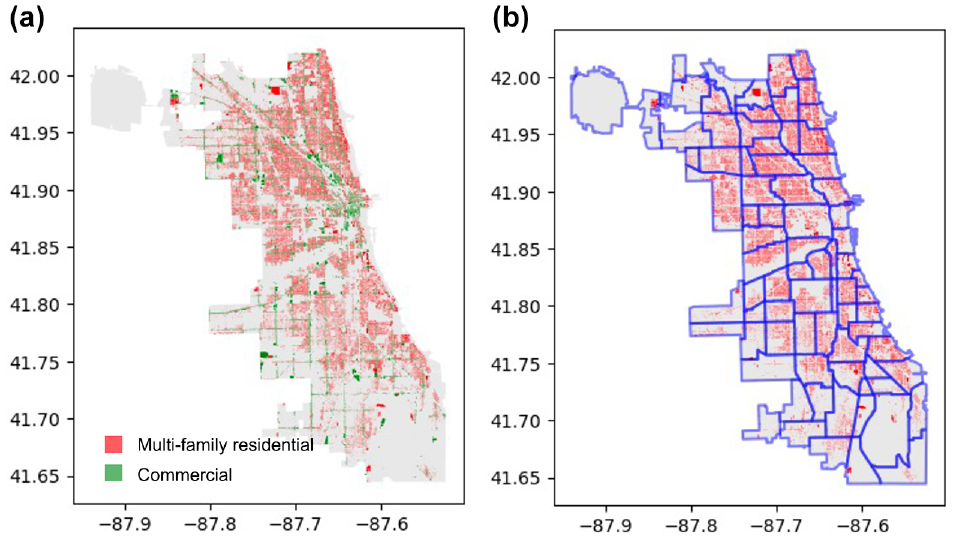
Commercial and multi-family residential land use in Chicago community areas: (a) multi-family residential land use and commercial land use in Chicago and (b) multi-family residential land use for each community in Chicago.
To estimate the parking and charging demand, we employ the four-step model for forecasting travel demand in the year 2030. For trip generation, we multiply the household trip generation rate of 1.90 from the 2017 Travel Model Validation Report ( 29 ) by the number of households, resulting in a trip generation estimate for 2020. Similarly, we calculate the trip production by multiplying the modeled home-based work attractions per observed employee of 1.37 from the 2017 Travel Model Validation Report ( 29 ) by the number of employees, providing us with the trip production estimate for 2020.
To complement these data, we gather social and economic attributes for each community in 2020 ( 28 ). These attributes include population, employment, and per capita income, as shown in Figure 7. By combining these attributes with the trip production and attraction data for 2020, we establish two regression equations: one for trip production and another for attraction. These equations assist us with estimating the parking and charging demand.
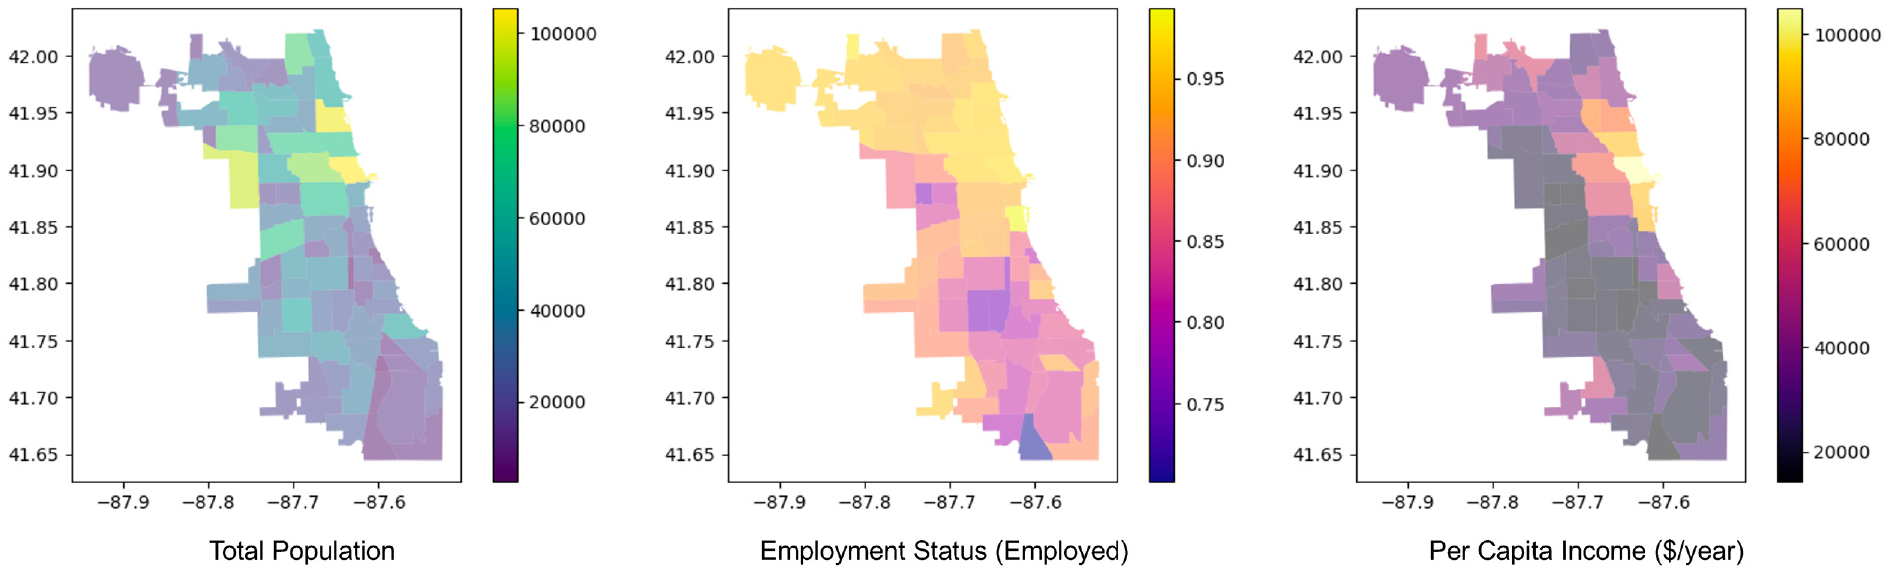
Socioeconomic attributes in Chicago community areas (for the year 2020).
We use openly accessible data to set the growth rates of the population (0.44%) ( 30 ), employment (0.5%) ( 31 ), and per capita income (1%) ( 32 ) for the year 2030 and project social and economic attributes. We estimate trip production and attraction for 2030, which are illustrated in Figure 8.
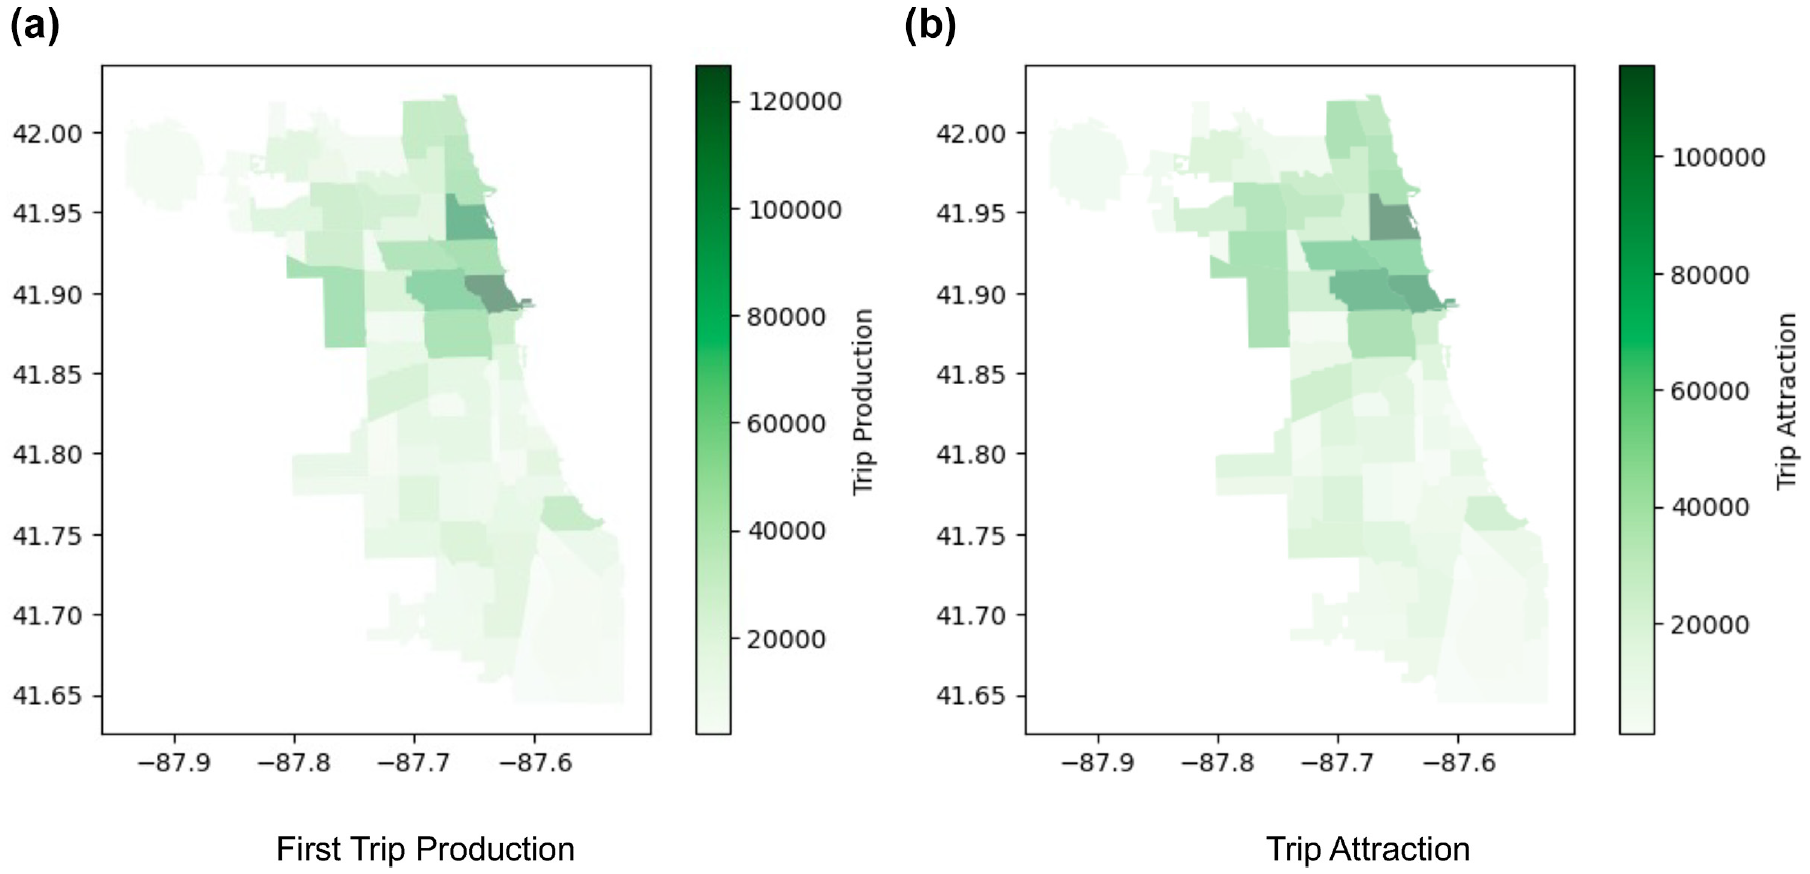
Trip production (a) and attraction (b) in Chicago community areas (for the year 2030).
Community Data
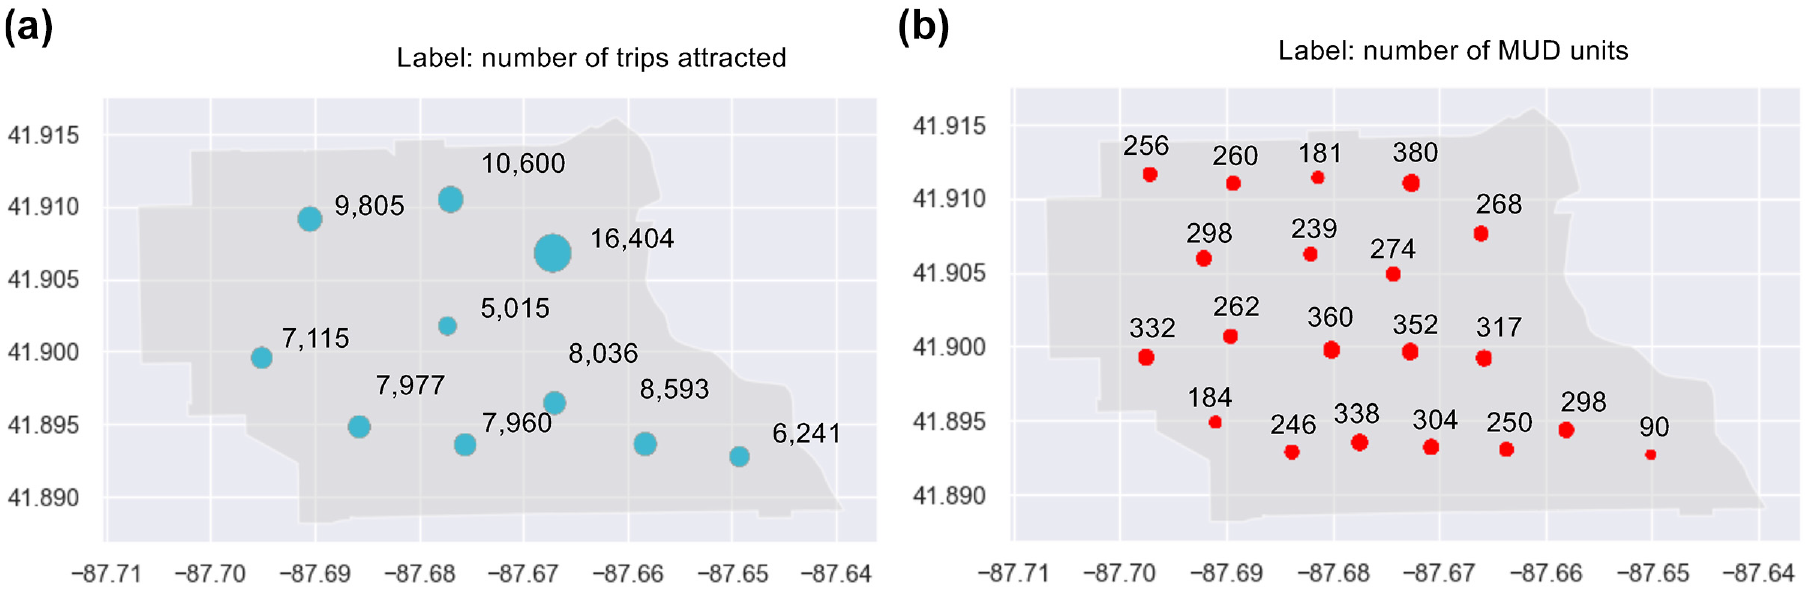
In our case study of Englewood, we also use multi-family residential land data (Figure 9a) and the distribution of MUD units (Figure 9b). Because of the absence of the precise spatial distribution of MUDs, we proportionally allocate MUDs to each residential land area based on its size, as in Figure 10, assuming that larger areas would naturally host more MUD units. This approach allows us to estimate the distribution of MUD unit size across different land parcels within Englewood’s community.
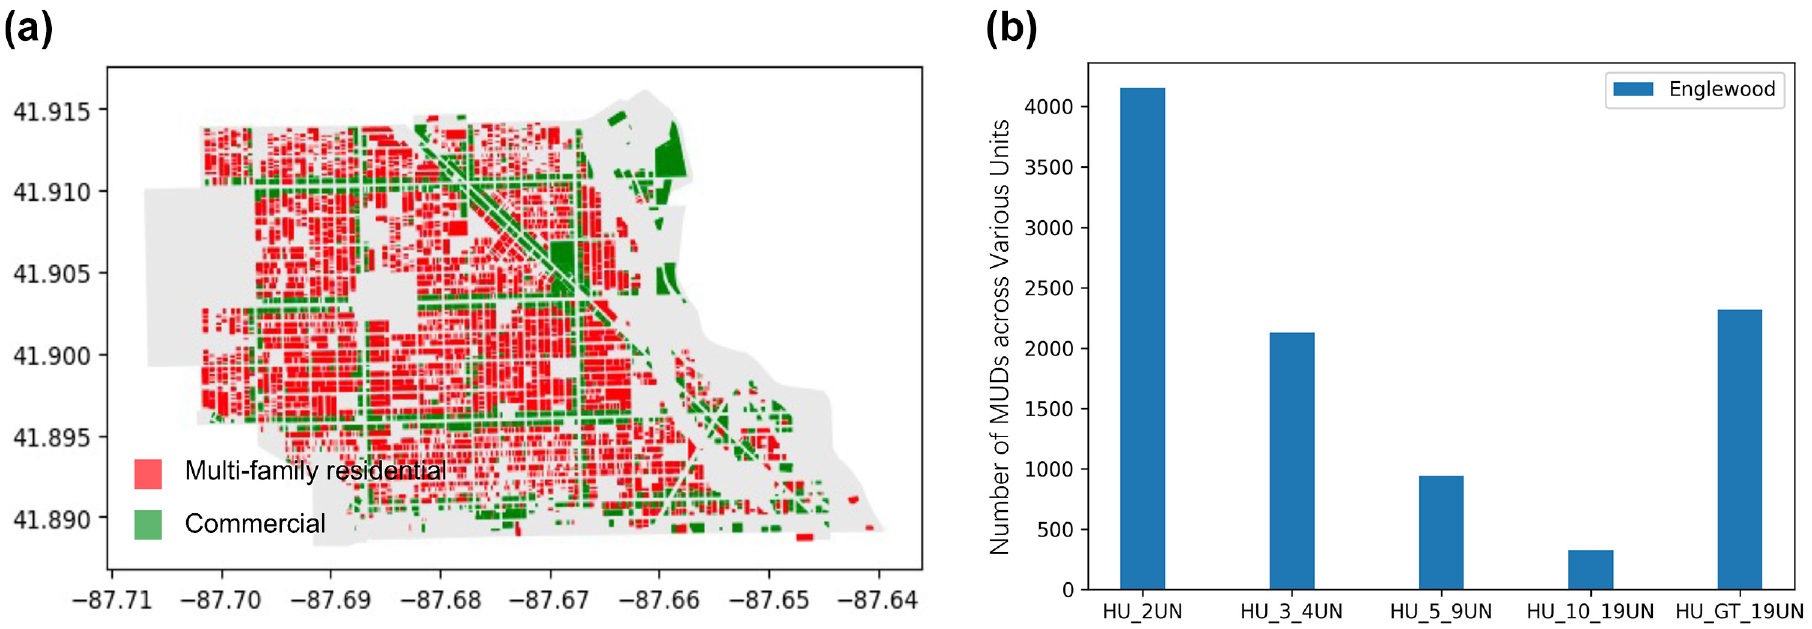
Land use and MUD data for the community of Englewood: (a) multi-family residential and commercial land-use data in Englewood and (b) the number of MUDs of each unit size (from CMAP).
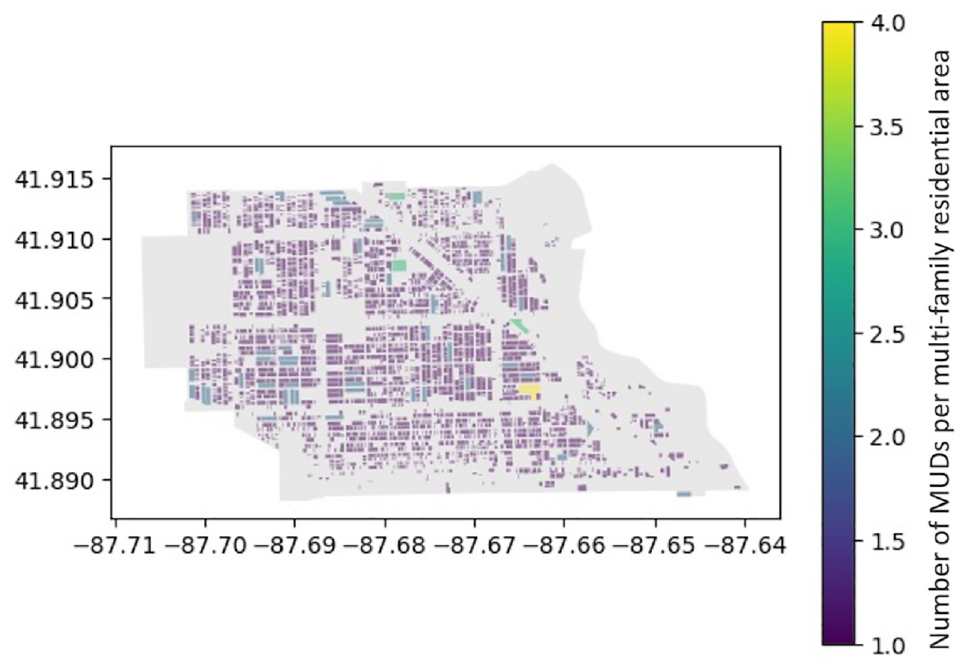
Assignment results for MUDs in Englewood.
While this method provides us with a high-resolution MUD distribution in Englewood, it also adds to the complexity of the user’s choice set in the charging choice model. We employ a
Clustering the results for commercial land uses and multi-family residential land uses in Englewood: (a) commercial land uses and (b) multi-family residential land uses.
Counterfactual Analysis
Suitable data that accurately represent charging choice sets are not openly available. That is the reason for employing counterfactual analysis. The available dataset, EVWATTS ( 18 ), provides information on charging stations and the corresponding charging sessions that took place. Concerning charging stations, these characteristics include ID, latitude, longitude, zip code, city (Chicago), access type (public, limited, and private), the number of stations at each location, and the venue type (fleet, multi-unit dwelling, and multi-use parking garage). As for the charging sessions, we have information on the charging date, energy usage, charging fee, and duration. The dataset consists of 76 charging stations.
For each charging station recorded in the EVWATTS dataset, we identify the nearby charging stations. We gather information on all charging stations located in Chicago, IL ( 33 ), and compare them with the charging stations listed in the EVWATTS dataset. We select the charging stations within a distance of 800 m from the station where the charging session occurred. An example illustrating this process is presented in Figure 5, where the blue marker represents a charging station that was actually selected in the EVWATTS dataset. Subsequently, we extract relevant details about the nearby charging stations, including their network, location, power level, the number of charging stations at each location, and the associated charging fee. We obtain charging fee information from the available data on each provider’s website. As for the distance to the final destination, we assume that the user’s final destination is at the location of the chosen charging station. For the other stations in the choice set, we apply a threshold for the distance to the final destination: if the distance to the final destination for these stations is less than 250 m, we set it to zero to indicate a negligible distance. For distances greater than 250 m, we retain their original continuous values. This adjustment was made after testing our model for improved performance.
The dataset consists of 15,318 observations. Each observation includes as input variables the total charging energy (kWh), charging duration (h), charging station’s power (kW), distance (km) from the actual parking and charging location, number of charging stations at the location, parking fee ($), charging fee ($), and total fee ($). The predictor is binary, with values of 0 or 1. When the charging stations are situated in a parking lot, users are required to pay a parking fee, while the parking fee is set to zero if the stations are not located in a parking lot. For the parking fee, we have set it at $4/h. In cases where the distance values are less than 0.25 km, we set them to zero (they are assumed to be close to the actual commercial destination); otherwise, we retain the original continuous values of the distances (in km). The fitted logit model suggests that the selection of a charging station is negatively associated with distance, total fees, and the number of charging stations at the location, while it demonstrates a positive relationship with charging duration. The fitted logit model is shown in Appendix II in the supplemental material.
Charging Demand
Charging demand is a crucial modeling input that is estimated in our analysis. We focus on public chargers, yielding 6,583 observations. We randomly select a varying number of observations, ranging from 100 to 6000. On analyzing the results, we observe that when the number of observations exceeds 1000, the mean charging energy remains relatively consistent at approximately 32 kWh. This trend is illustrated in Figure 12a. The standard deviation of the charging demand is depicted in Figure 12b.
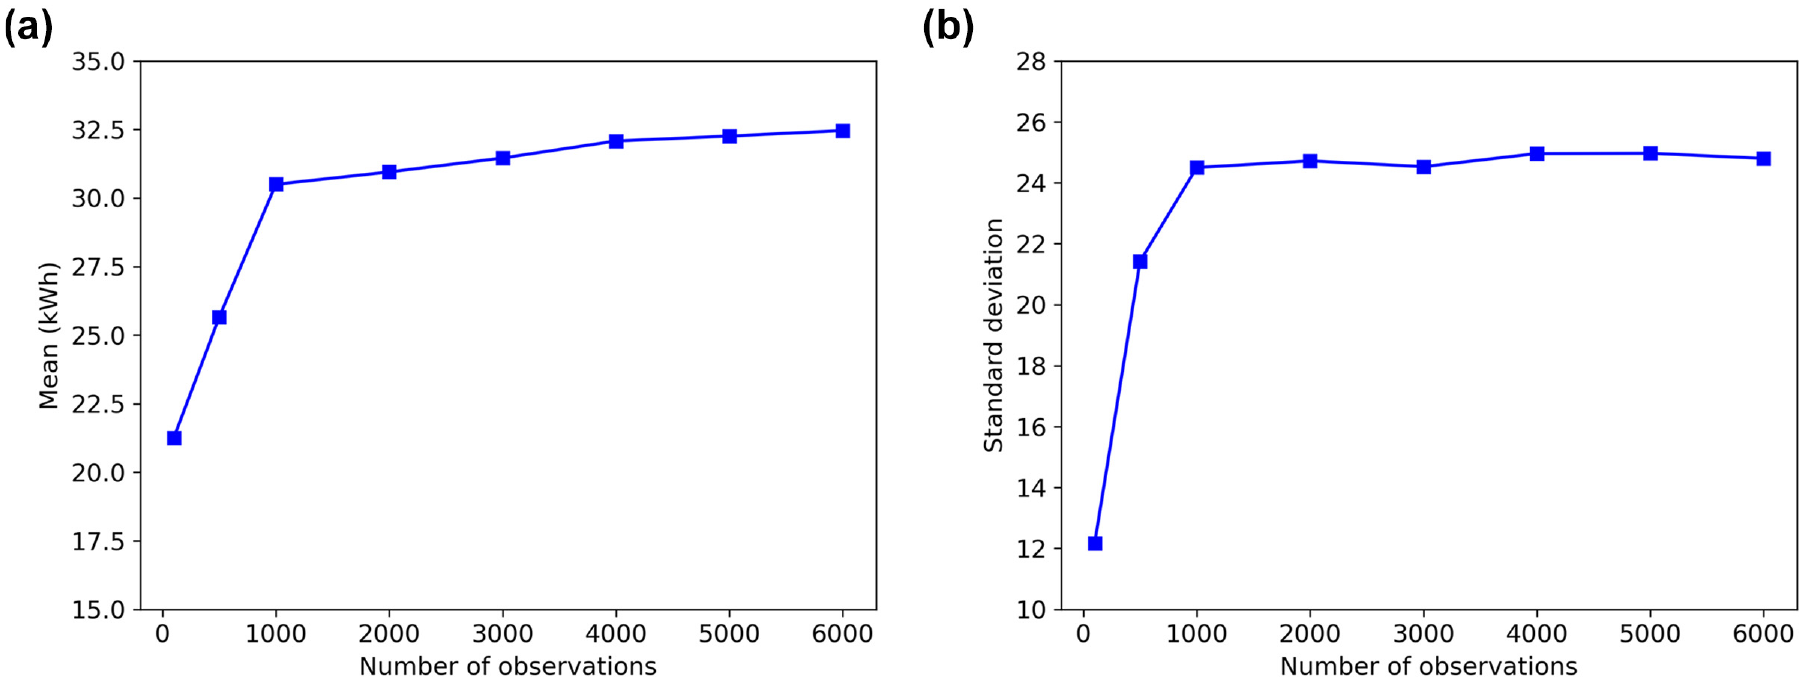
Mean (a) and standard deviation (b) of the charging demand for different numbers of charging session observations.
We sample the charging demand from the EVWATTS dataset after fitting a normal distribution with a mean of
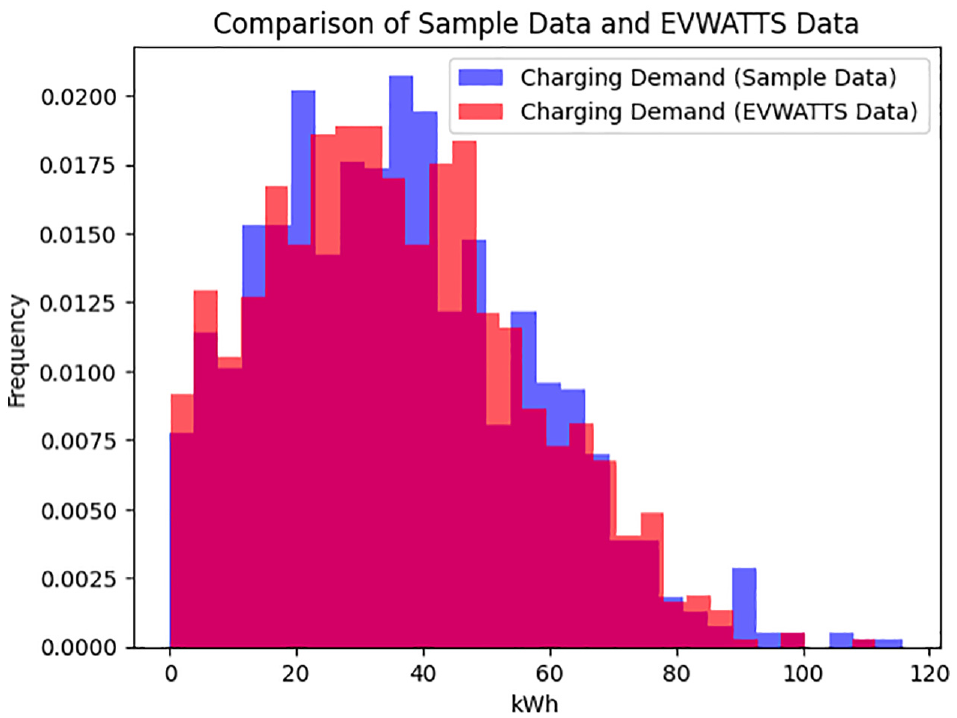
Comparison between sample results and the actual charging demand in the EVWATTS dataset.
Numerical Experiments
MUD Parking and Charging Management System Settings
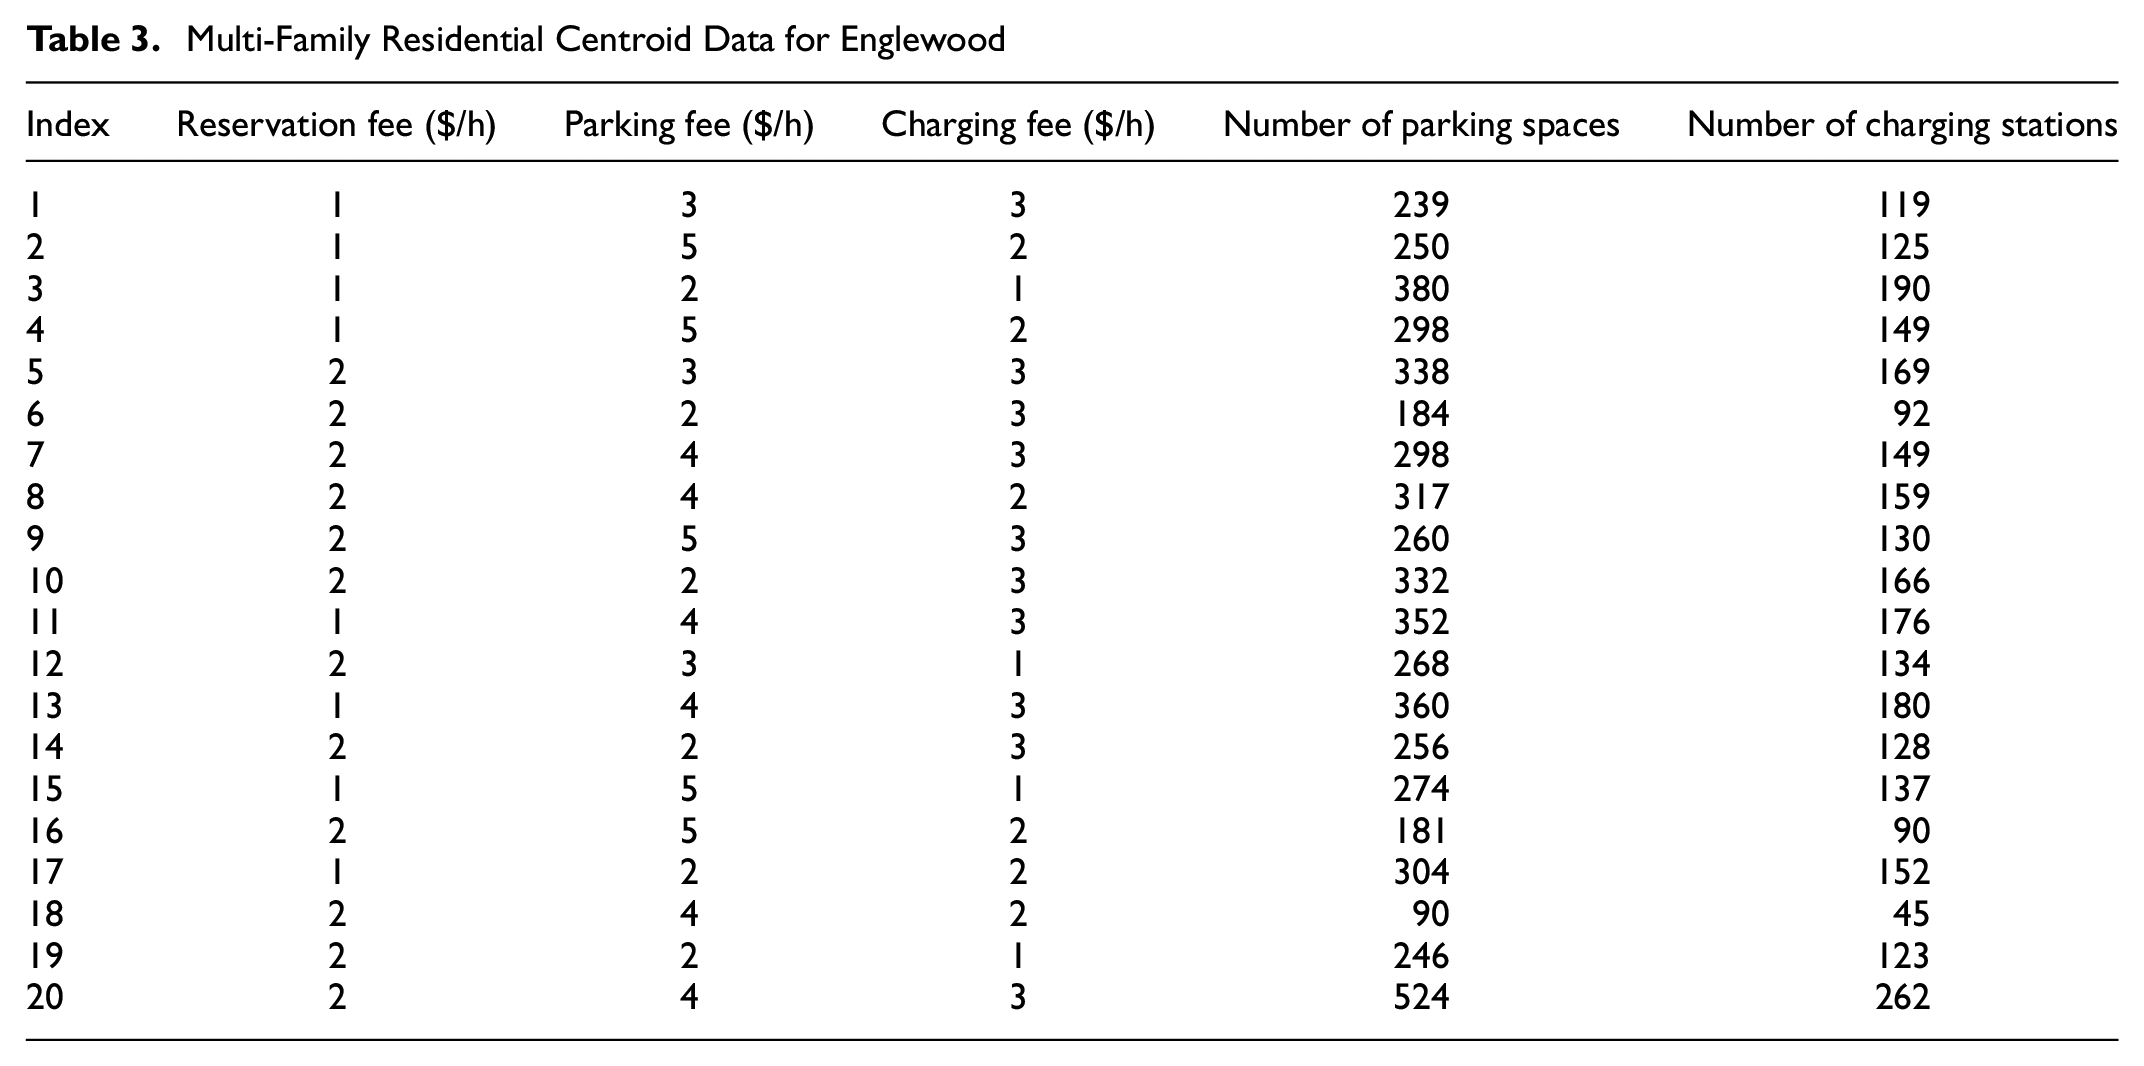
To illustrate our findings, we focus on the Englewood community. Based on Figure 11, Englewood consists of 10 commercial cluster centroids and 20 MUD cluster centroids. Individuals visiting the commercial cluster centroids for work or leisure purposes can utilize nearby MUDs to find parking spaces or charging infrastructure. The sharing period for these facilities is from 9:00 a.m. to 5:00 p.m., with the system reassigning parking requests every 10 min.
In our analysis, we consider level-2 charging stations with a power rating of 6.6 kW. To ensure an adequate supply and demand, we set the ratio of parking spaces with chargers to the total supply (
Multi-Family Residential Centroid Data for Englewood
Reservation requests follow a Poisson distribution, while the duration of parking follows a negative exponential distribution with an average of 120 min ( 7 ). In Appendix IV in the supplemental material, we select the most popular MUD, MUD 2 (which received the most requests), to showcase the problem size and the solution time required for each iteration.
Choice Model
We employ the charging choice model for 63,411 requests. Table 4 depicts the outcomes obtained from the choice model. We observe that users typically opt for multi-family residential areas that are either closer to their destinations or offer lower overall fees.
Results of the Charging Choice Model
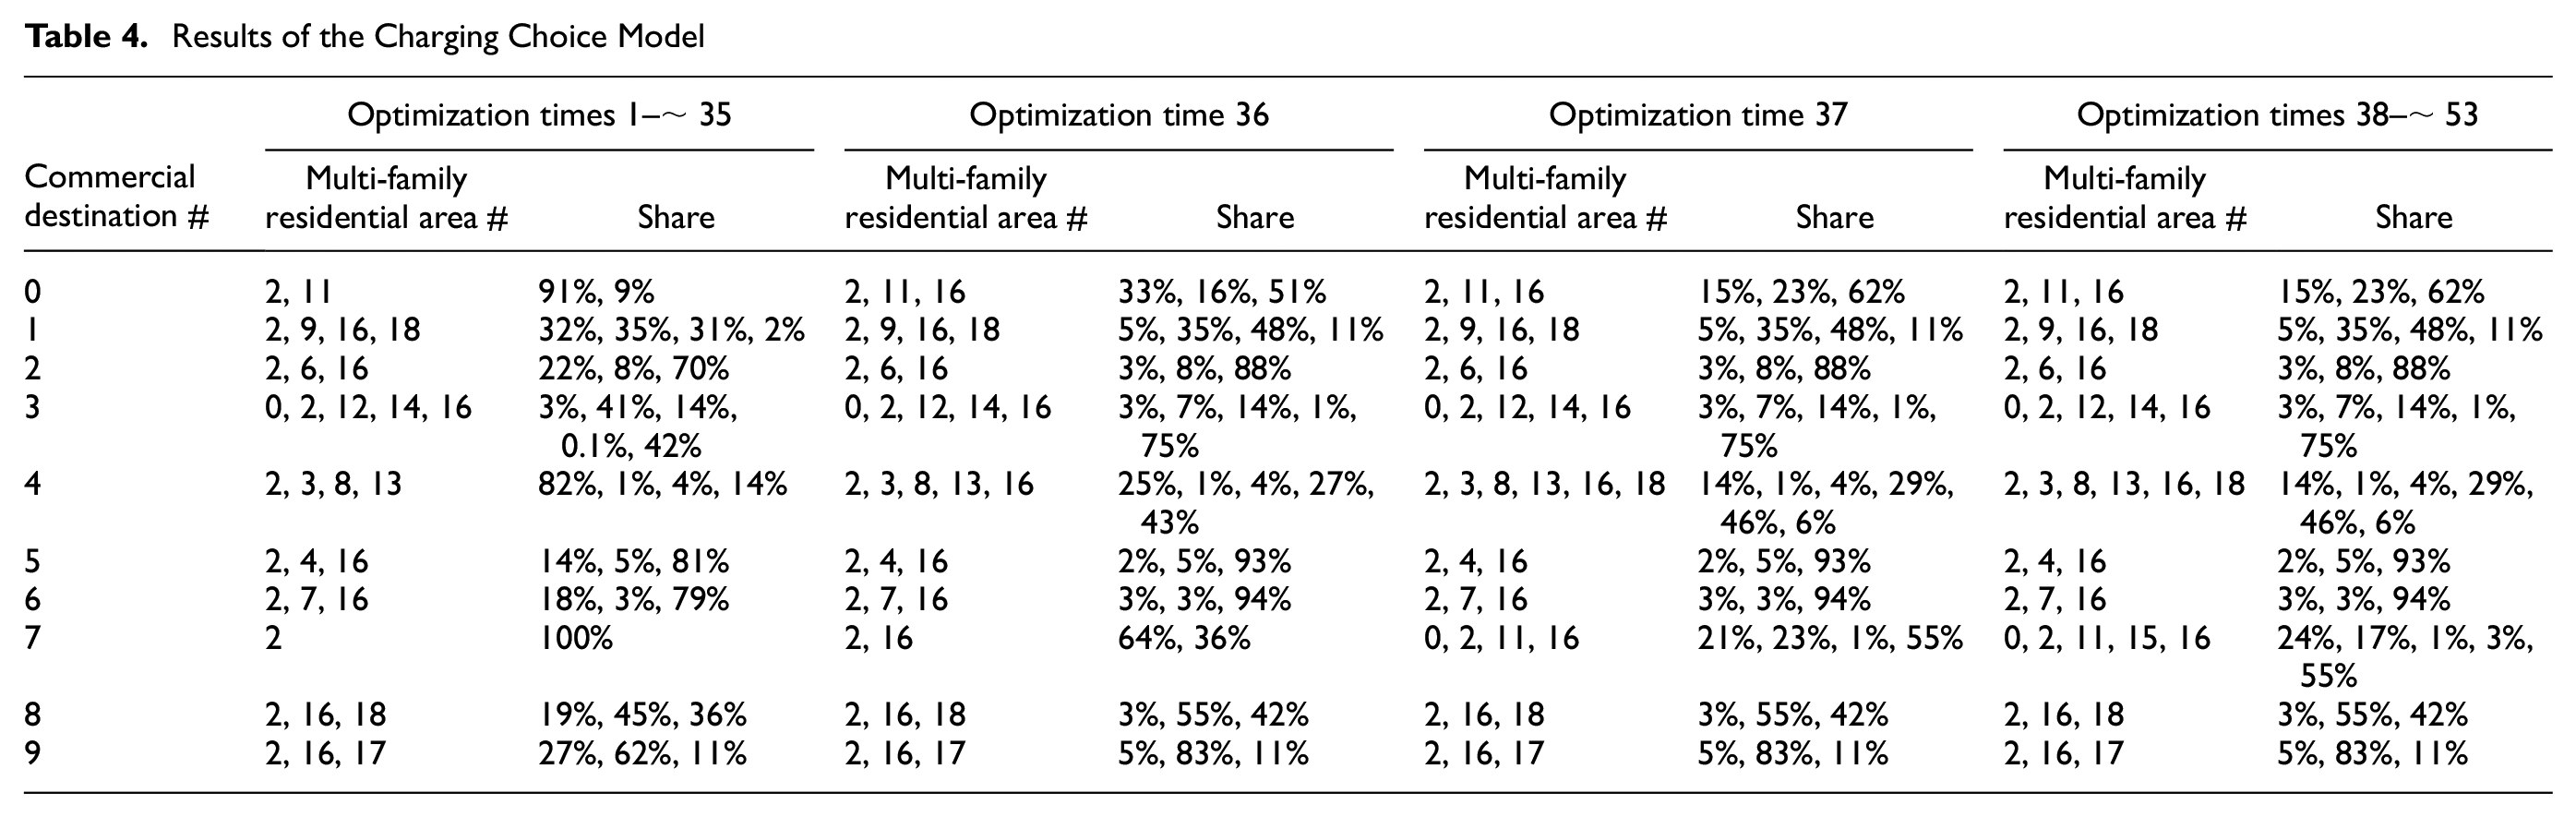
Let’s consider a user whose destination is commercial centroid 1, as indicated in the third row of Table 4. The driver’s initial parking/charging choice set includes MUDs 2, 9, 16, and 18. Notably, MUD 9 emerges as the closest option to commercial centroid 1. Additionally, based on the insights from Table 3, MUDs 2, 16, and 18 offer the lowest combined sum of reservation, parking, and charging fees. It is evident that a significant portion of users opt for MUD 2 primarily because it offers the lowest fee among the available options.
By the 36th optimization time, there is a significant decrease in the share of users selecting MUD 2. To illustrate this, let’s consider users whose destination is 0 (see the second row of Table 4). The share of users choosing MUD 2 decreases from 91% to 33%. This decline can be attributed to increased parking utilization of MUD 2, leading to an increased reservation fee. Consequently, the fee in MUD 2 is no longer the lowest compared with the other available MUDs. As a result, at this point in the modeling horizon, users opt for alternative MUDs. According to the choice modeling results, not all MUDs are selected by users. MUDs 1, 5, and 10 are never visited by any users throughout the evaluation period. This is also an artifact of the offering of many parking spaces compared with the corresponding demand or is a result of high rejection rates.
Parking and Charging Allocation Results for Each MUD
Figure 14 illustrates the results for five metrics—the number of matchings (first row), the number of matched charging requests (second row), the parking utilization (third row), the charging utilization (fourth row), and the revenue (fifth row)—for five selected MUDs: MUD 0 (first column), MUD 1 (second column), MUD 2 (third column), MUD 9 (fourth column), and MUD 16 (fifth column). These five MUDs are chosen as representatives for our analysis.
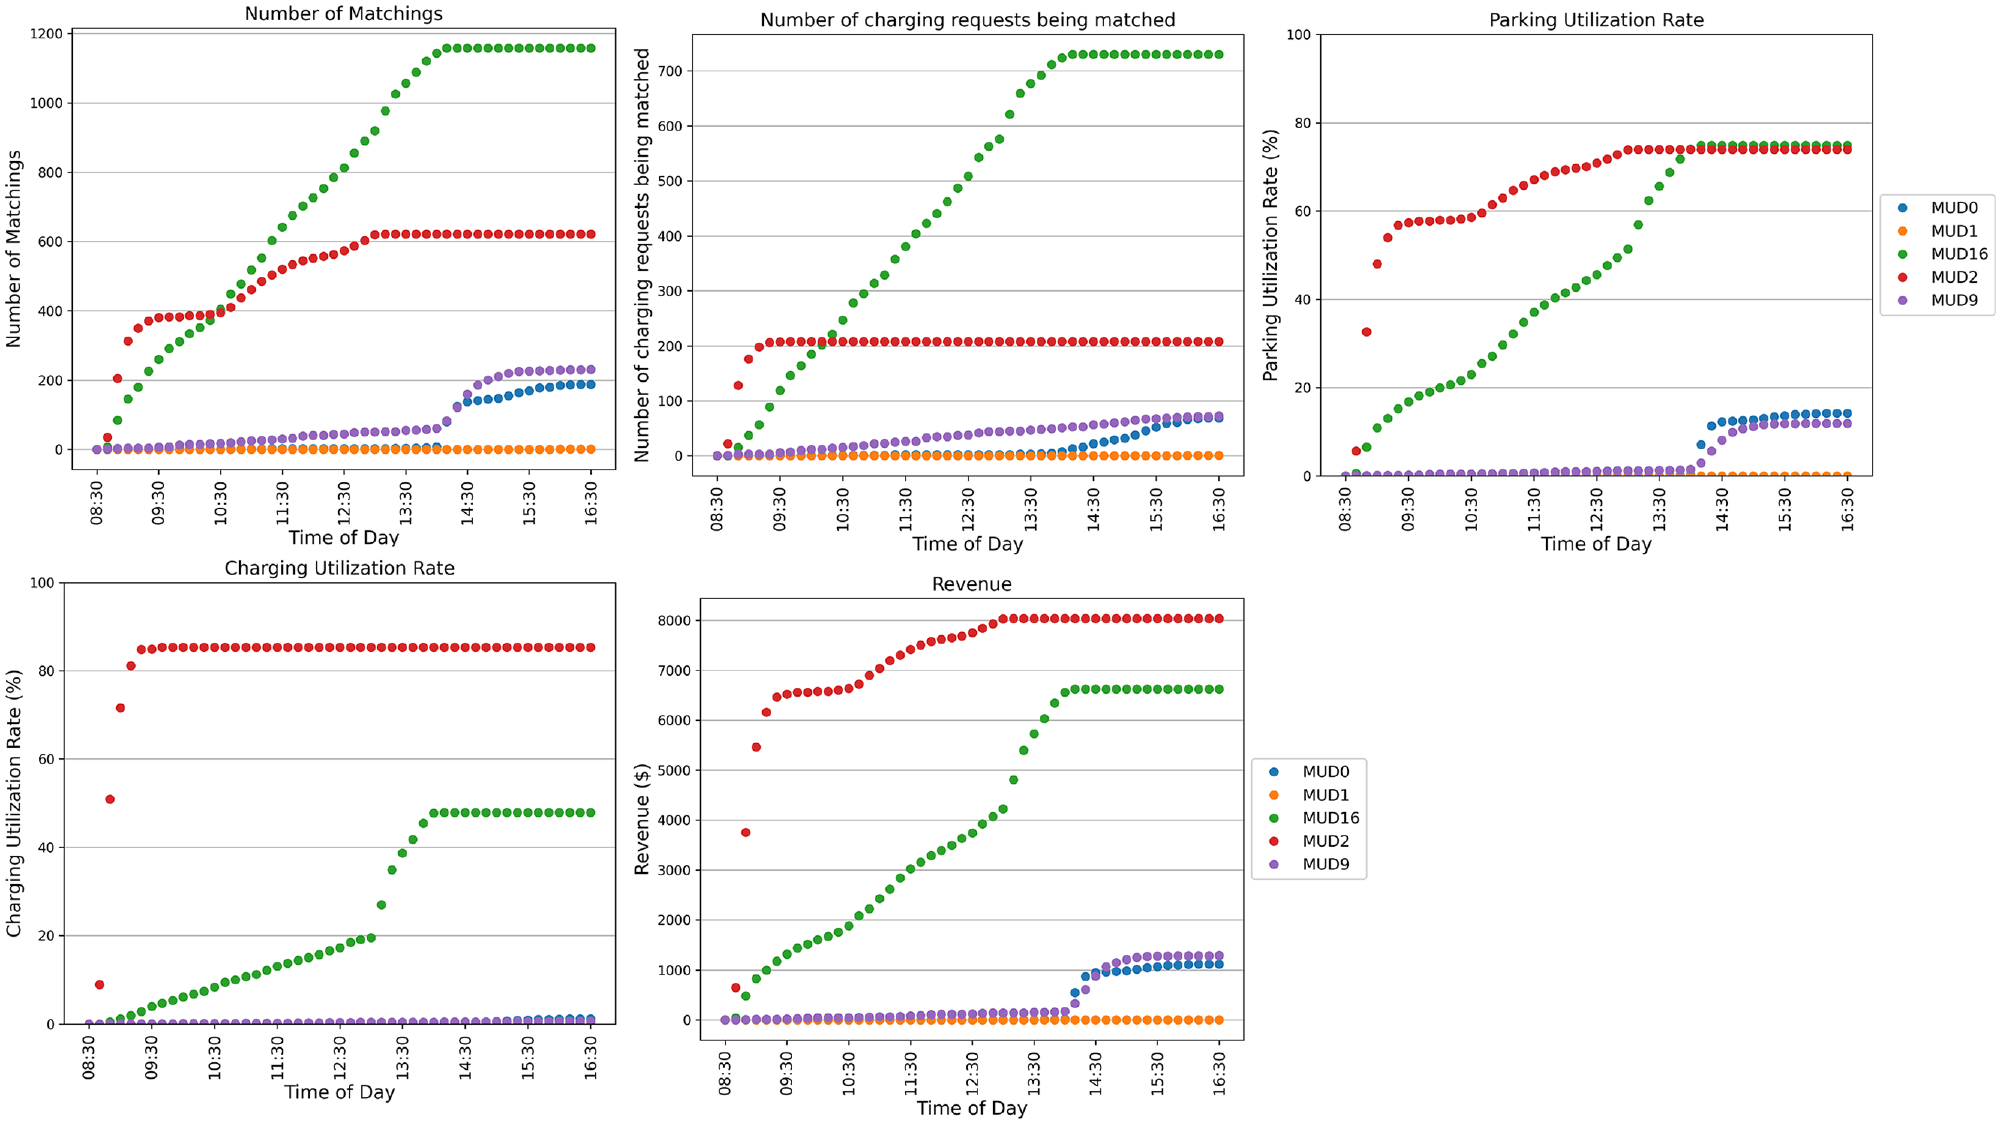
An overview of five parking and charging management metrics (number of matchings, number of charging requests being matched, parking utilization, charging utilization, and revenue) for a subset of representative MUDs.
MUD 0 represents MUDs that initially do not receive any visits but start to be utilized once the occupancy rates of other MUDs become high. MUD 1 represents MUDs that are not visited throughout the simulation period. MUD 2 emerges as the most popular choice because of its lower fees, resulting in an influx of requests at the beginning, which quickly reach a saturation point. The saturation point occurs when parking utilization rates reach a threshold where the dynamic fee will significantly increase. MUDs 9 and 16 are compared with MUD 2. MUD 9 receives fewer requests than MUD 2, while MUD 16 receives a similar number of requests to MUD 2, but the values of each metric change in a distinct manner, as discussed below.
The rate of increase varies across the MUDs and occurs at different times. For instance, MUD 0 and MUD 9 experience the quickest increase around 2 p.m., while MUD 2 exhibits its fastest growth at approximately 8:30 a.m. (at the initial stage). On the other hand, MUD 18 witnesses its most rapid increase around 1 p.m. MUD 2, being the preferred choice for the majority of users, attracts a high volume of requests right from the beginning, leading to a swift escalation in all five metric values. Once the occupancy rate of MUD 2 reaches 75%, users begin selecting alternative MUDs as their next best options (such as MUD 18). Consequently, MUD 16 experiences a rapid increase in its metrics. Furthermore, as the occupancy rate of MUD 2 continues to rise, users opt for other MUDs (e.g., MUD 0 and MUD 9), resulting in subsequent increases in their metrics.
Comparing MUD 2 with MUD 16, even though the latter accepts more requests in the last iteration (621 requests for MUD 2 and 1158 requests for MUD 16), it generates less revenue. This can be attributed to two primary factors. First, MUD 2 exhibits a higher charging utilization rate compared with MUD 16. As more charging stations are occupied, a greater amount of charging fees can be collected, contributing to a higher revenue. Second, there is a difference between the parking durations of the accepted requests for MUDs 2 and 16, as shown in Figure 15. On average, MUD 2 users are parked for longer periods than MUD 16 users. Drivers with longer parking durations are more sensitive to fees, as indicated by the choice model. Therefore, users with longer parking durations choose MUD 2 over MUD 16. This phenomenon also explains why MUD 2 generates more revenue compared with MUD 16. The aforementioned factors contribute to the observed difference in revenue between MUD 2 and 16 despite MUD 16 accepting a greater number of requests.
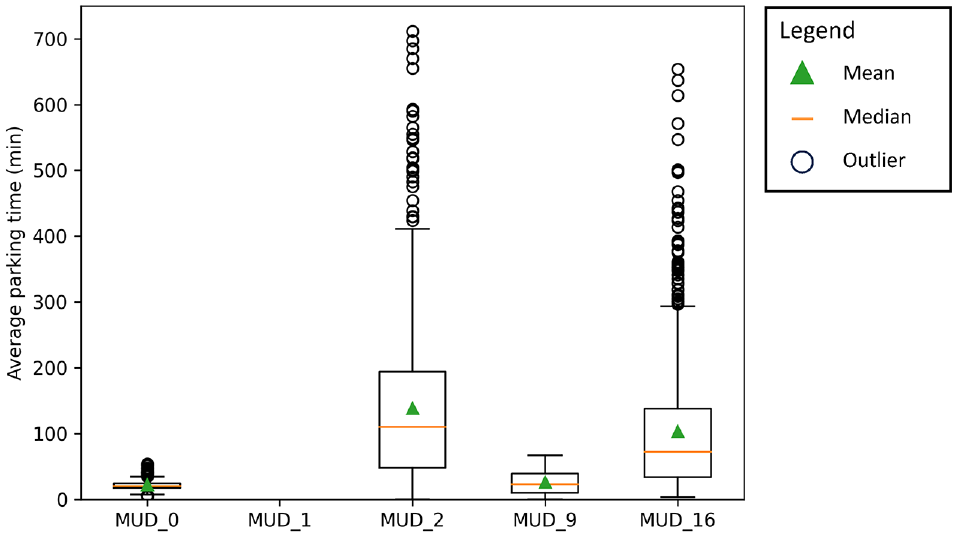
Parking duration distributions for a subset of representative MUDs.
Comparison with FCFS and the Optimal Results
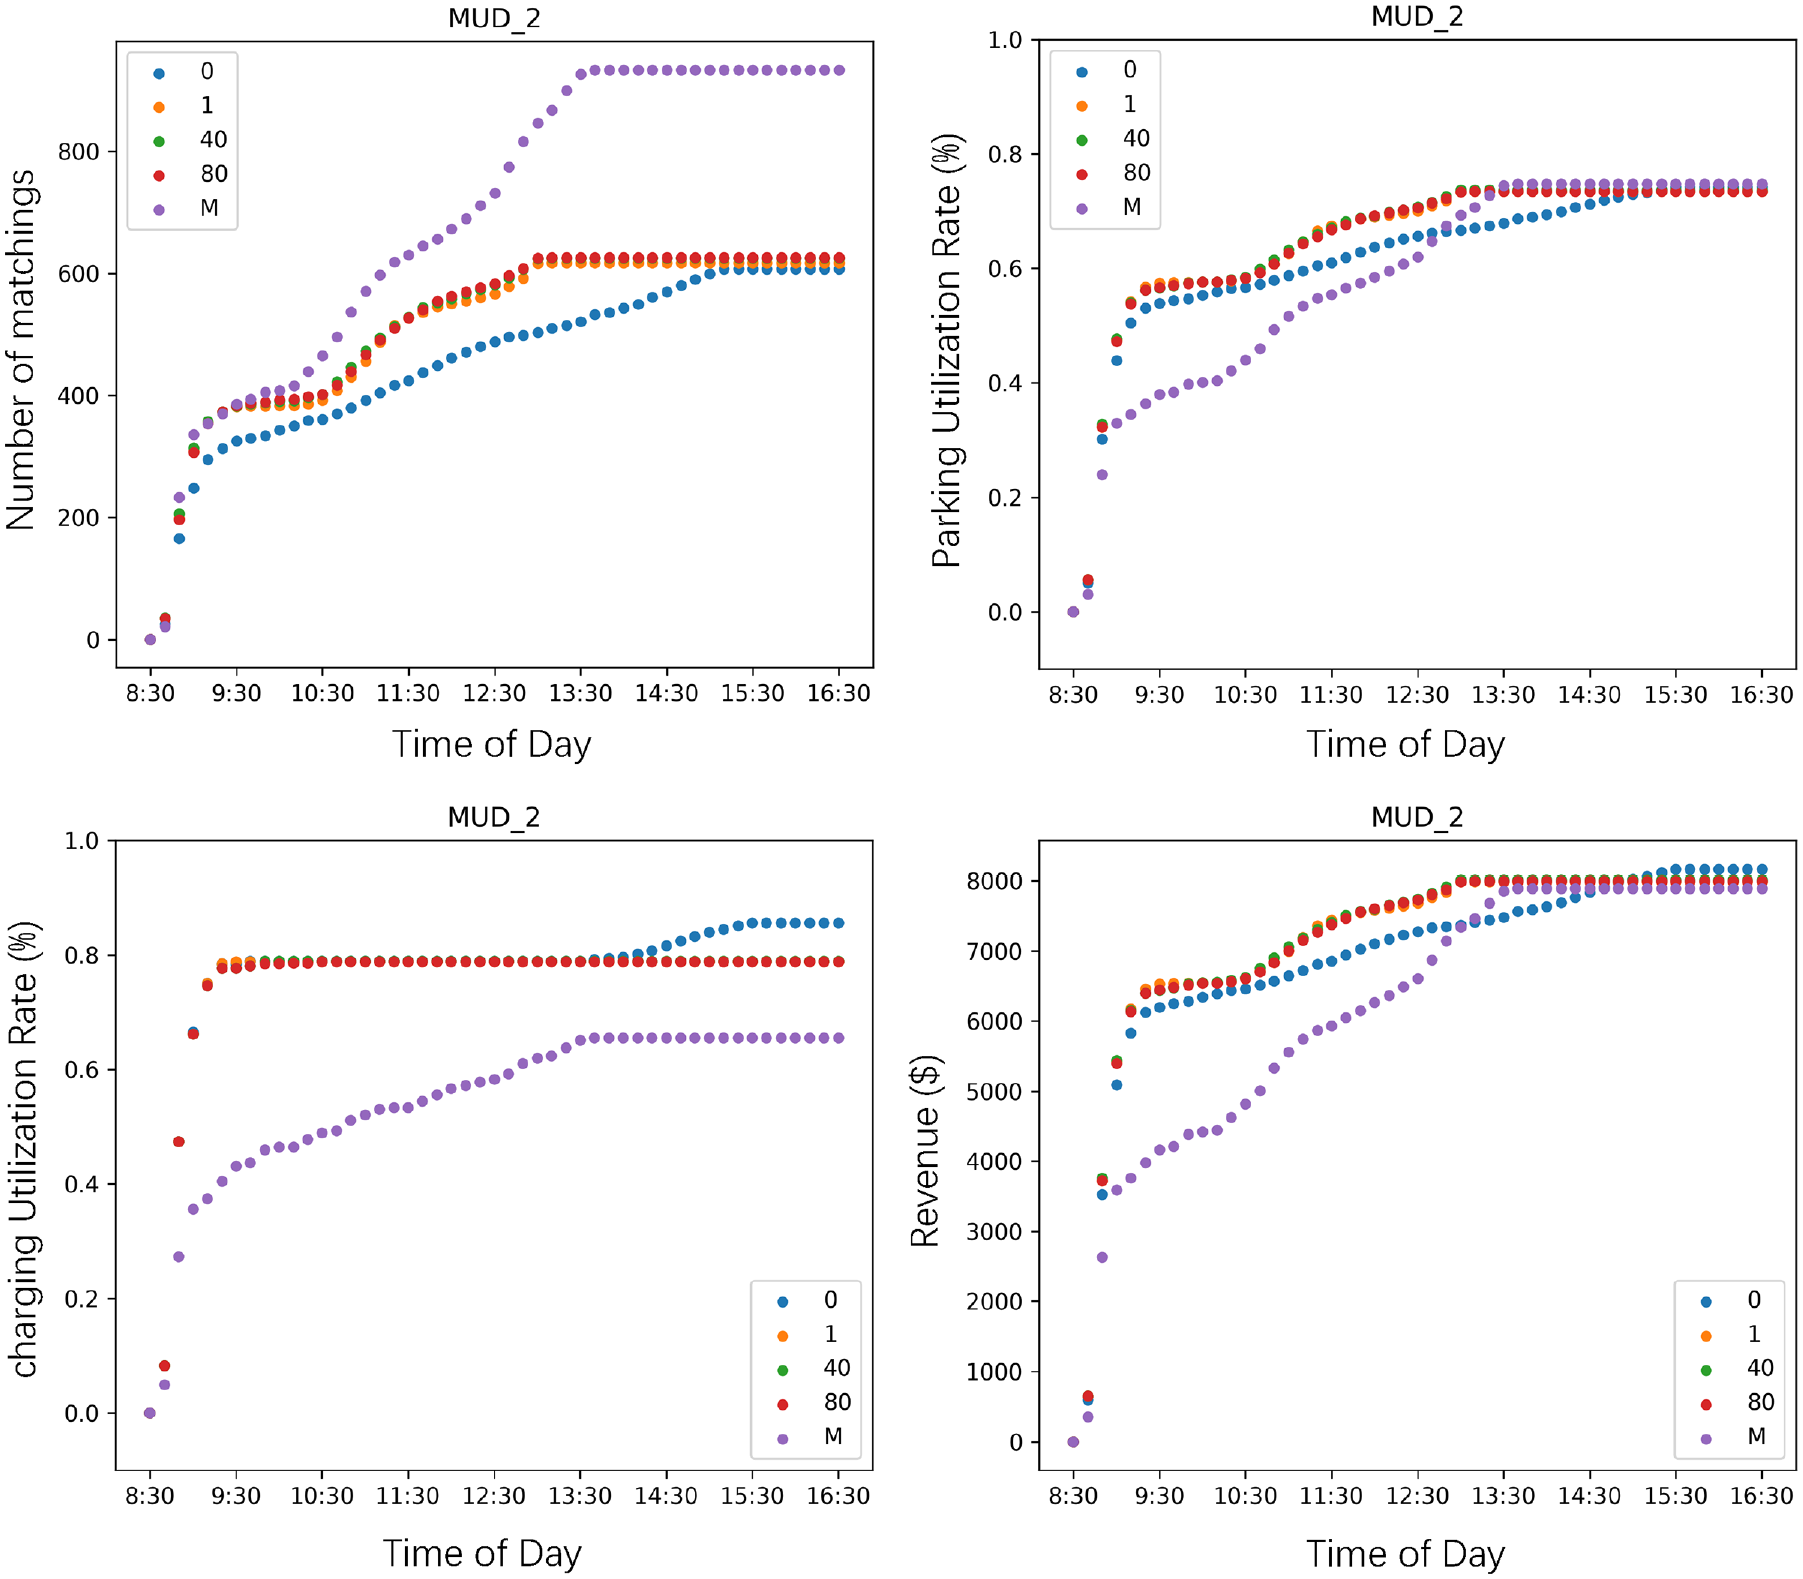
In this section, we conduct a comparison between our proposed method, an FCFS strategy, and the optimal results to assess the effectiveness of our approach. We focus on evaluating the performance of MUD 2 in relation to four key metrics: number of matchings, parking utilization, charging utilization, and revenue. The metrics for MUD 2 are presented in Figure 16. The FCFS strategy entails accepting a request at a MUD if it can be accommodated or rejecting it otherwise. This process is repeated throughout the simulation until its conclusion. The optimal results are obtained by solving a BILP model, assuming complete knowledge of all requests in advance. Other comparative results for four representative MUDs are shown in Appendix III in the supplemental material.
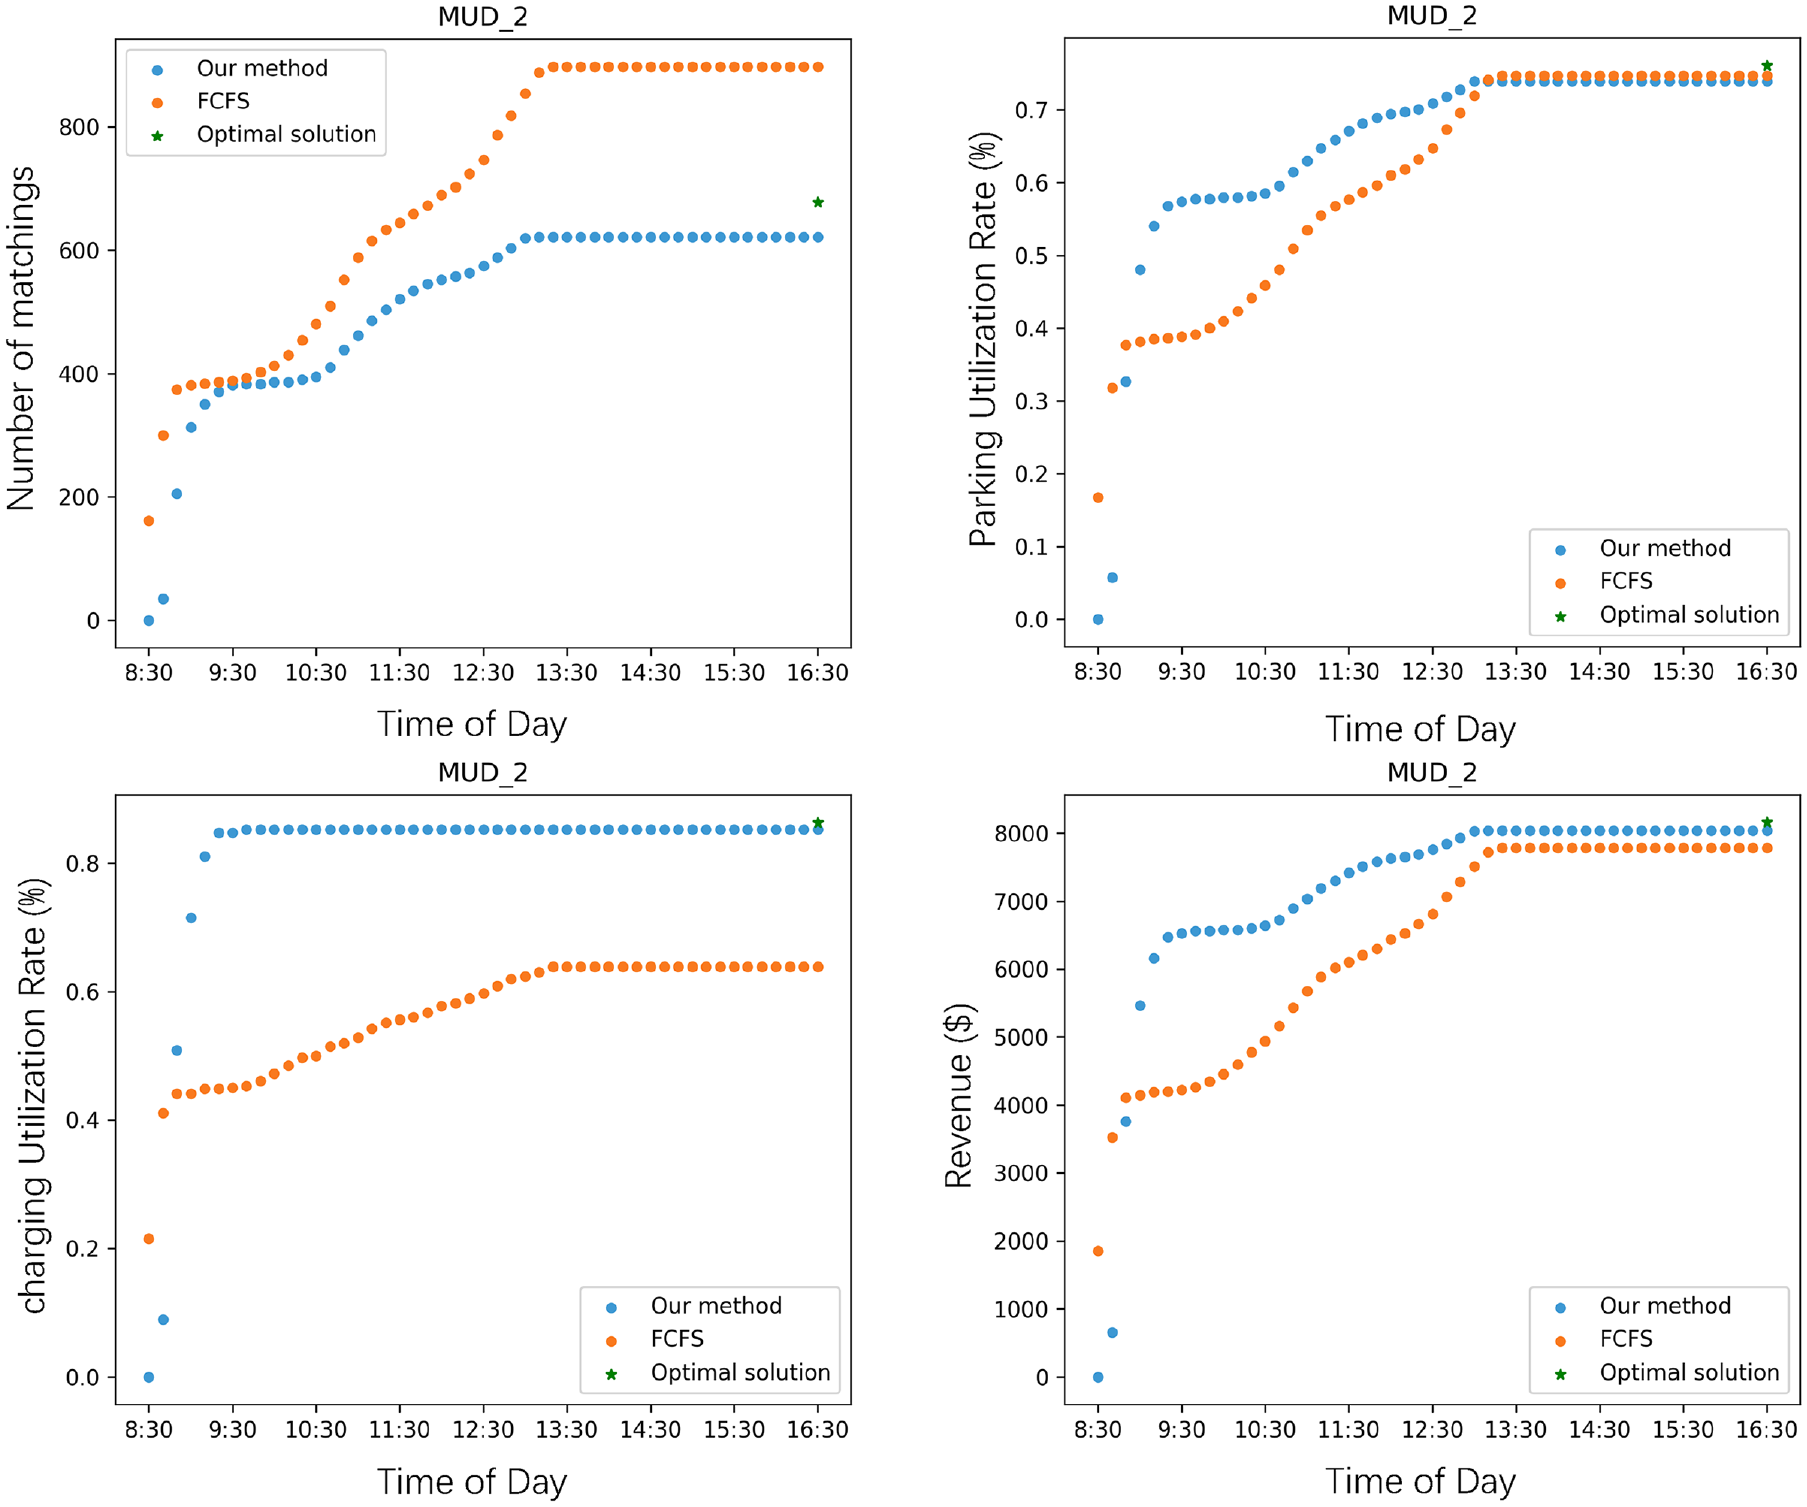
Comparisons of our method with an FCFS scheme and the optimal solution based on four metrics (number of matchings, parking utilization, charging utilization, and revenue).
The FCFS strategy yields a higher number of matched requests compared with our proposed method. In fact, the number of matchings achieved through FCFS even surpasses the optimal results. This discrepancy can be explained by noting that the optimal results are obtained by solving the BILP model, with the same objective function (maximize the revenue) utilized as in our method. It is important to note that the objective function incorporates a parameter called
Our method has a consistently higher charging utilization rate, outperforming the FCFS strategy until approximately 1 p.m. Beyond this point, the parking utilization rate of our method remains unchanged, while the FCFS strategy starts to outperform our method. This shift in performance can be attributed to the implementation of our dynamic reservation fees. As shown in Figure 3, when the parking utilization rate reaches 75%, the reservation fee significantly increases. When this threshold is reached, users are deterred from selecting MUD 2 as their preferred choice. This explains why, after a certain time, the parking utilization rate for our method remains stagnant while the FCFS strategy gains an advantage. Furthermore, both the FCFS strategy and our method exhibit results that are closer to the optimal results in relation to parking utilization rate.
Our method demonstrates significantly higher charging utilization compared with the FCFS strategy: much closer to the optimal results. Accepting a greater number of charging requests leads to higher revenue generation. As a result, our method prioritizes the accommodation of charging requests, contributing to a higher charging utilization rate. At the same time, the BILP model incorporates matching rules that give priority to charging requests over parking requests. These matching rules are designed to improve the utilization of charging stations. Consequently, our method aligns with these rules, resulting in a higher charging utilization rate compared with the FCFS strategy. The combination of revenue maximization and the integration of charging-specific matching rules into the BILP model contributes to the superior performance of our method in relation to charging utilization rate, bringing it much closer to the optimal results.
The same pattern is observed for the fourth metric, revenue. Similar to the charging utilization rate, our method exhibits better performance compared with the FCFS strategy (which is expected since our method is set to maximize revenue) and achieves results that are aligned with the optimal outcomes.
Sensitivity Analysis
Parameter
The objective function of the BILP model consists of four components. The first three components aim to maximize revenue by considering the reservation, parking, and charging fees. The fourth component represents the number of rejected requests, with
Sensitivity analysis results for parameter
We experiment with different values of
When
The maximum parking utilization rate is not sensitive to the value of
As anticipated, reducing the value of
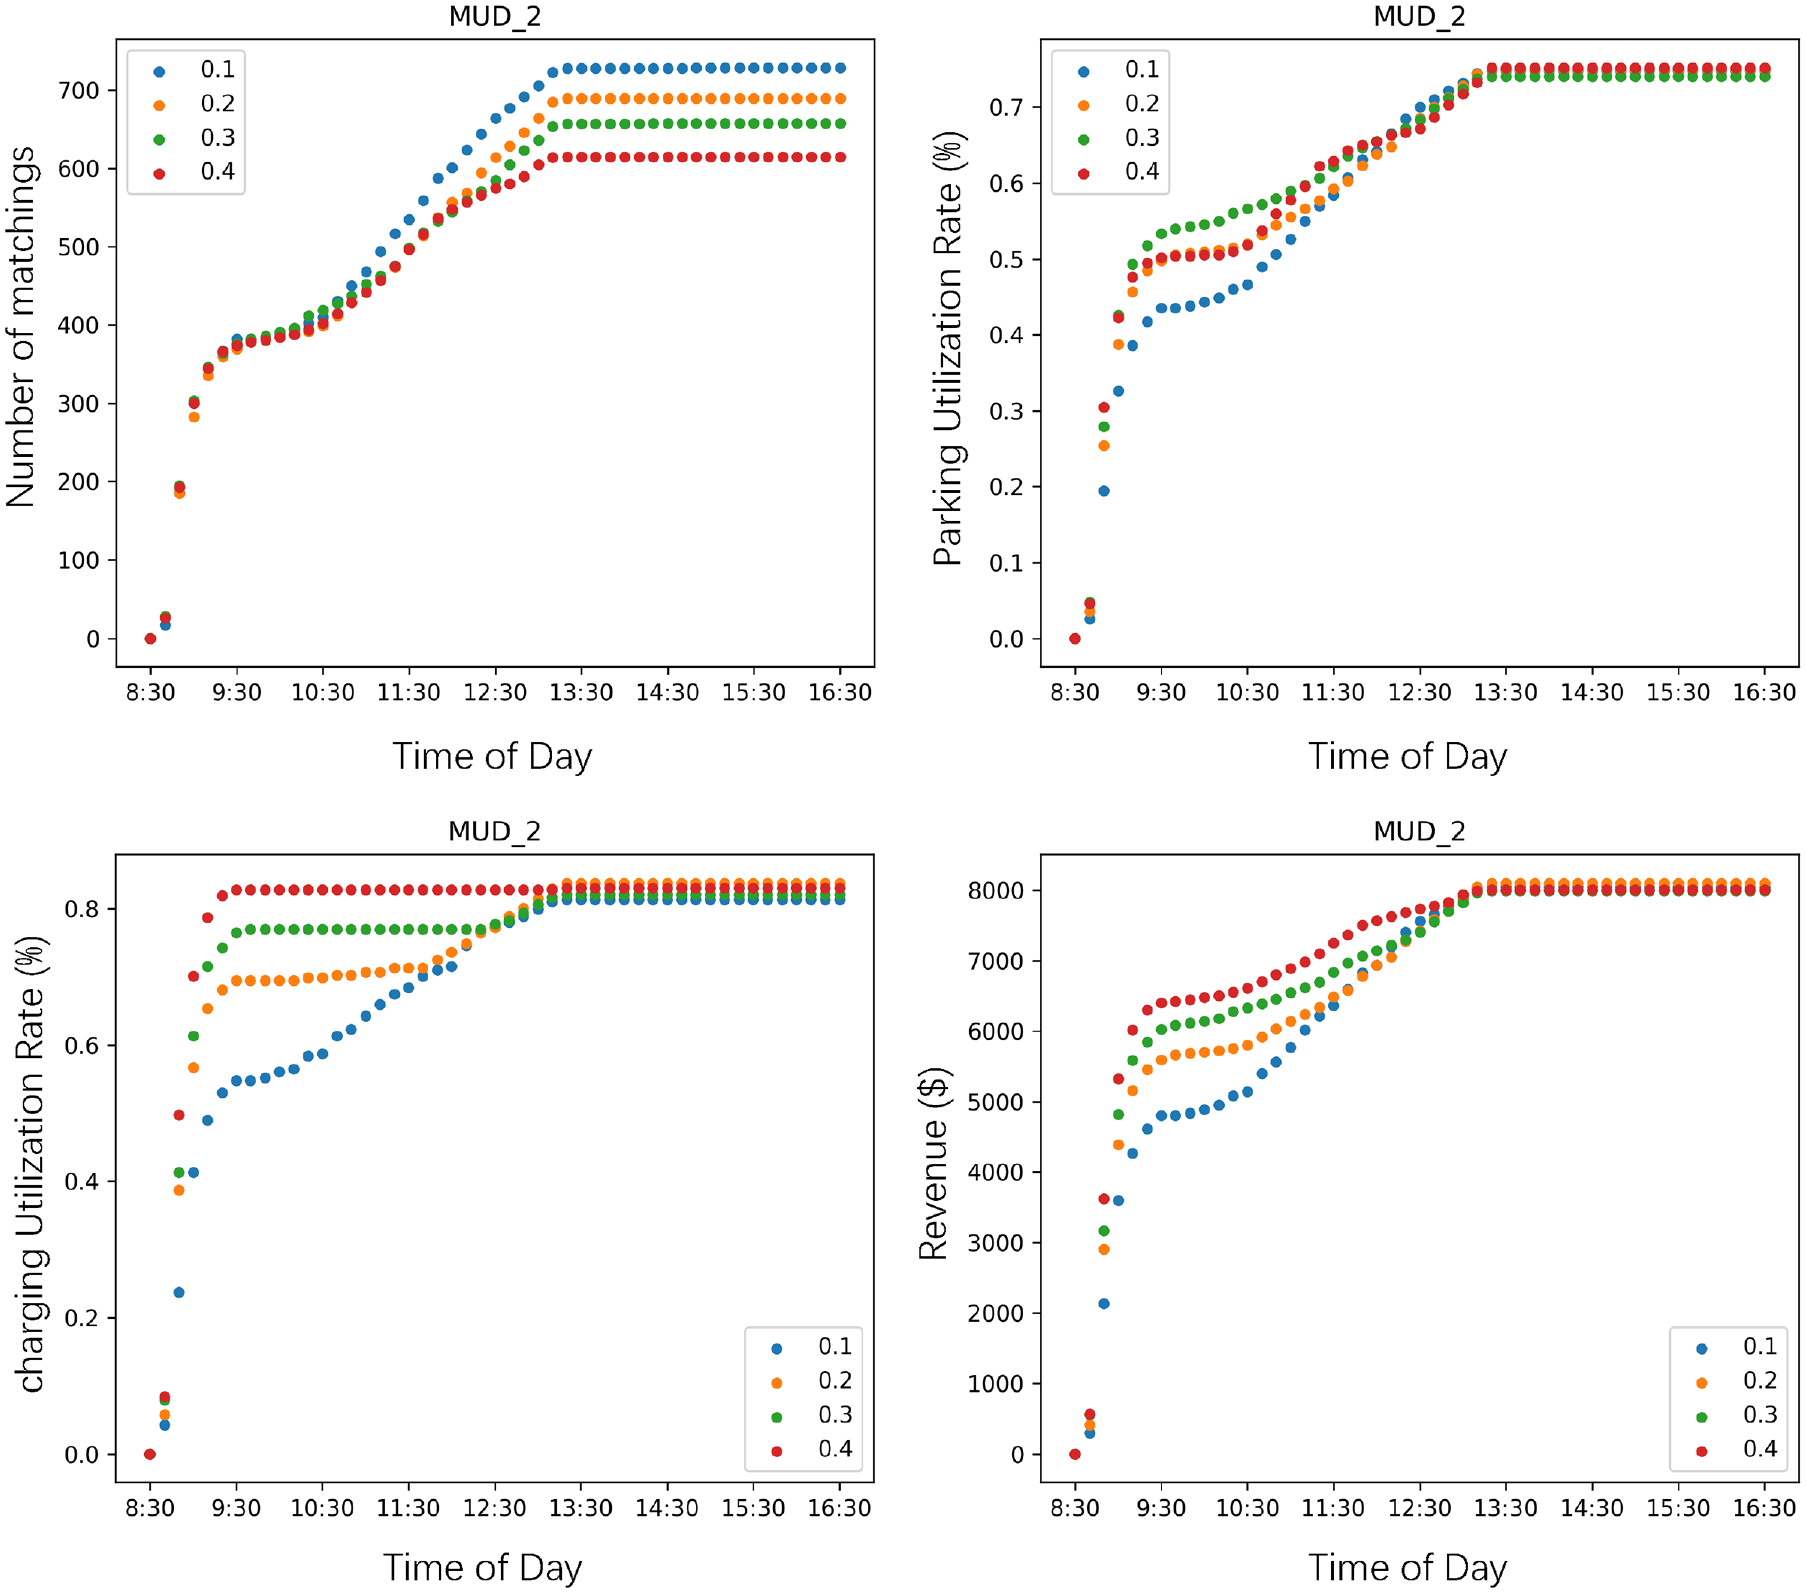
Parameter
In the numerical experiments, we set the ratio of parking spaces with chargers to the total supply, denoted as
Sensitivity analysis results for parameter
As the value of
The parking utilization rate also increases as the value of
The value of
Last, as the value of
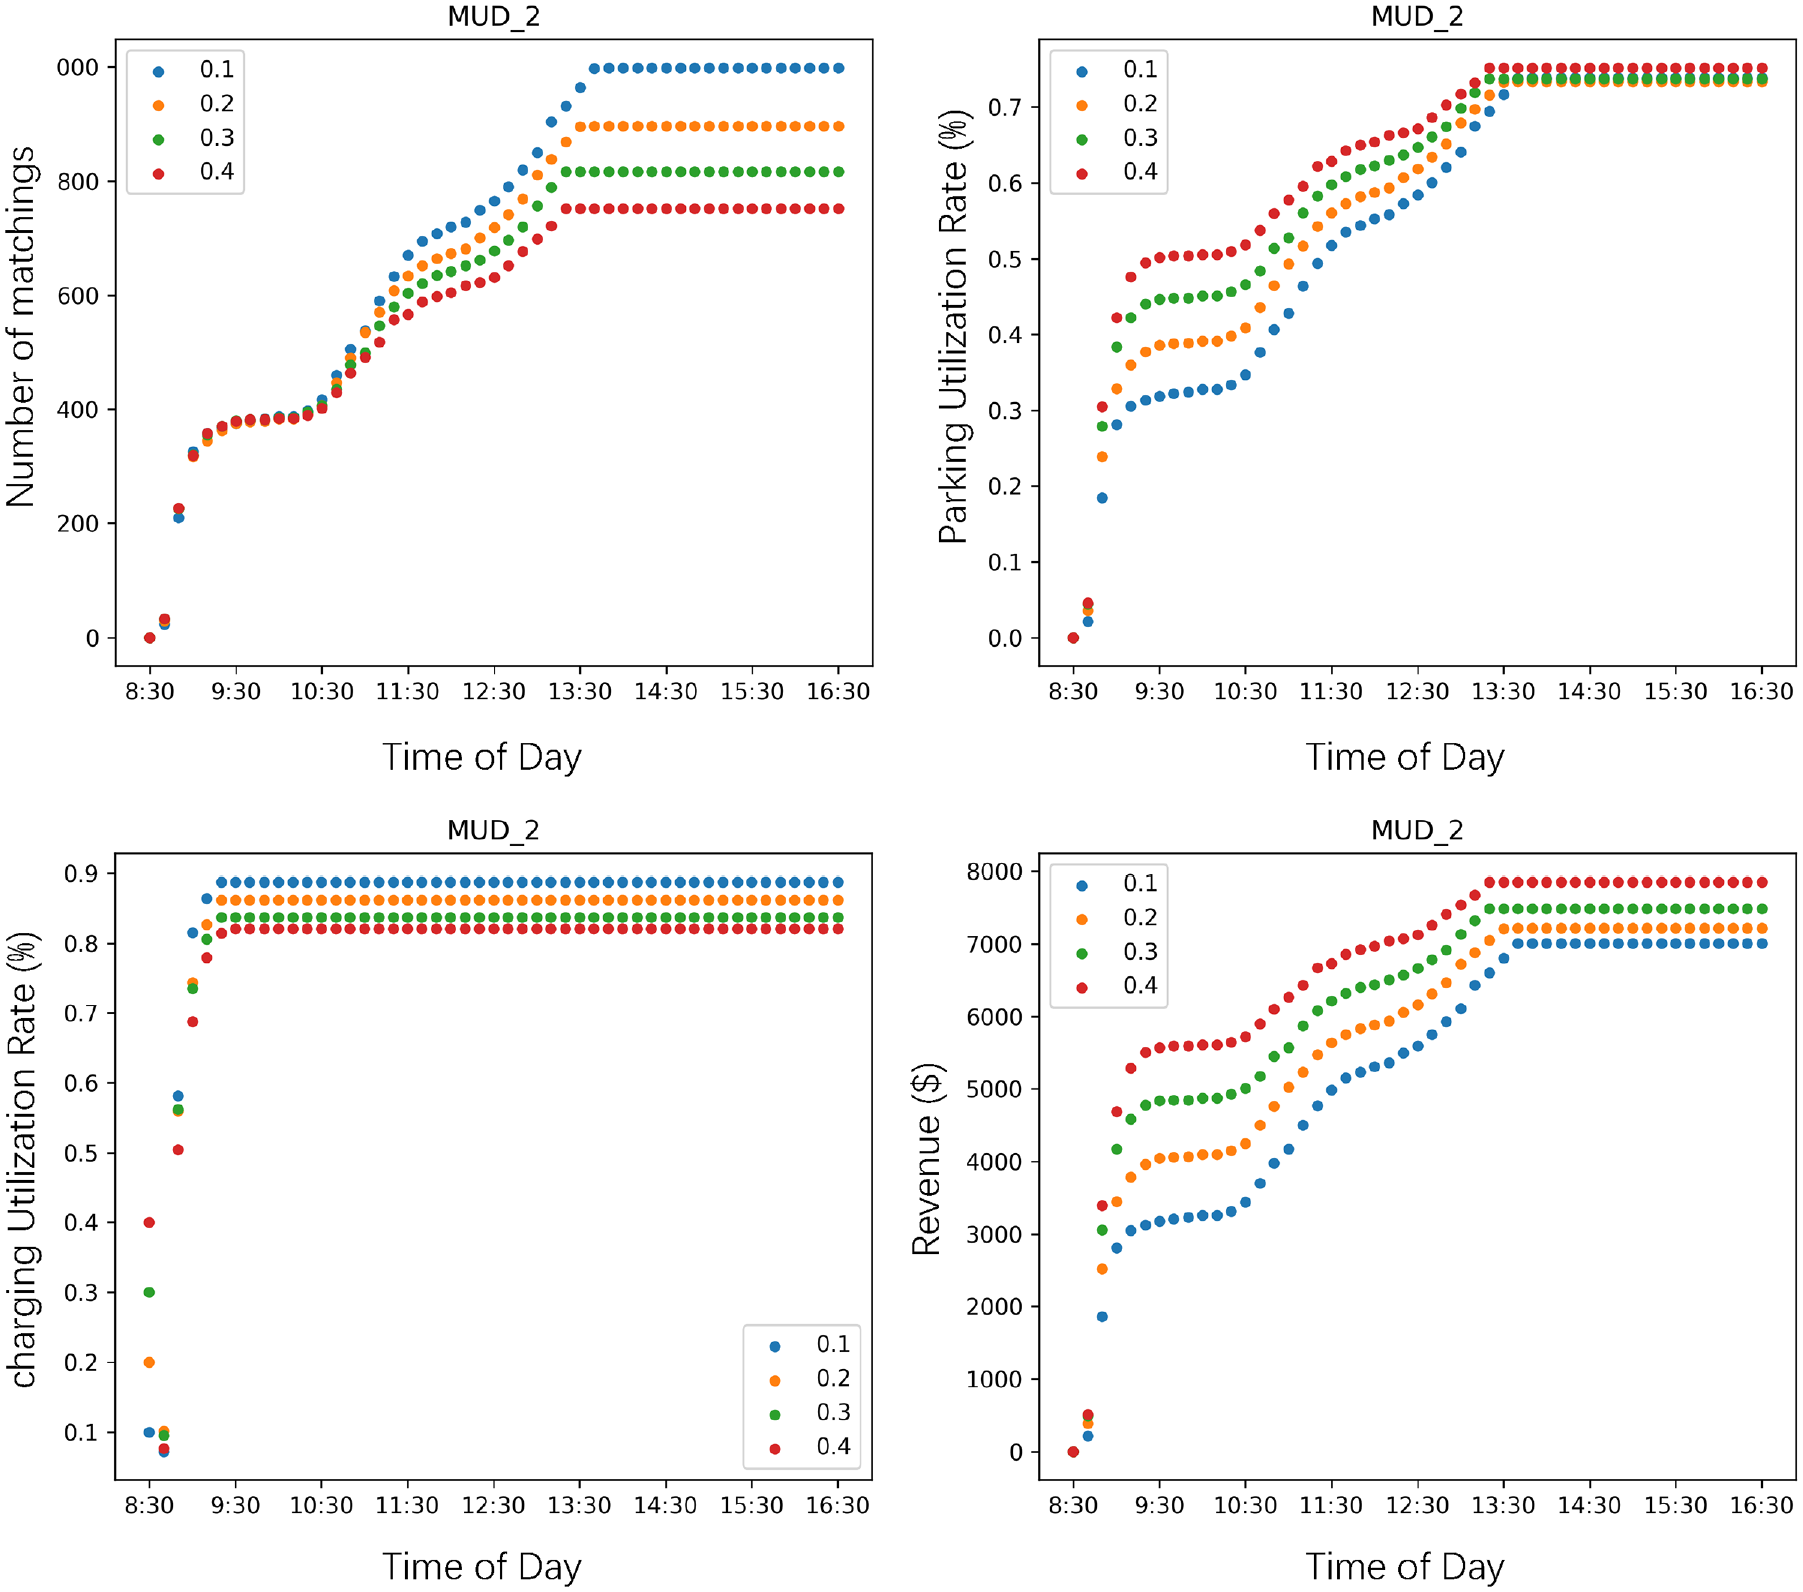
Parameter
In the numerical experiments, we initially set the ratio of charging requests to the total demand, denoted as
Sensitivity analysis results for parameter
As the value of
In addition, no significant differences are observed between the final revenue values across all cases. Even for the case with a relatively small value of
Conclusion
During the daytime, the availability of vacant parking spaces and the EV charging infrastructure in MUDs can address the limited network of public parking and charging options in urban mixed-land-use areas. Our research assesses the viability of a shared parking and charging system in MUDs for public use, building on our previous work that focused on modeling the charging management for MUD residents during evening and overnight periods ( 13 ). We develop a rolling-horizon shared parking and EV charging system. A BILP model is proposed to efficiently allocate parking and charging requests among available spaces, with the objective of maximizing total revenue for the MUD operator. In this dynamic environment with a mix of gasoline vehicles and EVs, a set of matching rules is incorporated into the BILP model. We consider the user’s preferences by conducting a counterfactual analysis and developing a charging choice model using real-world data.
The effectiveness of our management system is demonstrated through its application to a neighborhood of Chicago, Englewood. We assess its performance using various metrics, comparing it with an FCFS strategy and the optimal results derived from a commercial solver. Sensitivity analysis is performed to explore the impact of the weight of rejected requests, the ratio of EV charging requests to total demand, and the ratio of parking spaces with chargers to the total supply on the system’s performance.
Through our research, we devise both parking management and EV charging behavior models, thereby offering holistic insights derived from shared parking and charging in MUDs. By evaluating various performance metrics, our approach proves to be more effective in relation to charging utilization and revenue compared with an unmanaged FCFS strategy. Our method achieves results that are also close to optimal outcomes. Although our numerical experiment is limited to a neighborhood of Chicago, other neighborhoods and cities can readily adopt our model since it is transferable. The sensitivity analysis investigates the system’s performance in relation to revenue maximization, request rejection, and supply-and-demand balance. Our findings can guide managers and residents of MUDs in selecting the most appropriate parameter values based on their specific objectives and priorities.
Nonetheless, our study can be extended to address existing limitations. Reservation requests follow a Poisson distribution and parking times adhere to a negative exponential distribution with an average of 120 min, based on literature. As a result, our numerical experiments may not fully capture behavioral elements related to drivers’ request times. The vehicle’s state of charge could be a significant variable that influences charging users’ parking lot decisions and may also affect the duration of their charging. However, because of a lack of relevant data, we were unable to incorporate such a variable into our charging choice model. While our model effectively simulates the general behavior of the parking and charging dynamics in MUDs, it does not fully capture the dynamic nature of private parking availability as a result of the sharing of spaces between MUD residents and public users. Our numerical experiments, based on the travel patterns of MUD residents, provide a static snapshot of parking space availability, which may not always align with the reality of day-to-day usage. We acknowledge that our model’s current framework may underestimate the private parking space occupancy by MUD residents. The introduction of the parameter
Our system is currently tailored to city centers with a mix of residential and commercial land use, making the implementation of the proposed approach in rural and suburban areas challenging. Future research should expand the charging options available to EV drivers in MUDs by exploring the feasibility of curbside parking ( 35 ) as a viable charging location for ubiquitous access to sustainable passenger transport options.
Footnotes
Acknowledgements
We would like to acknowledge the assistance of Drs. Noah Horesh and Joann (Yan) Zhou from Argonne National Laboratory, who processed the EVWATTS dataset. We also thank Dr. Raphael Isaac and Patrick Walsh for their comments and suggestions.
Author Contributions
The authors confirm contribution to the paper as follows: study conception and design: E. Kontou, R. Zhang; data collection: R. Zhang; analysis and interpretation of results: R. Zhang, E. Kontou; draft manuscript preparation: R. Zhang, E. Kontou. All authors reviewed the results and approved the final version of the manuscript.
Declaration of Conflicting Interests
The author(s) declared no potential conflicts of interest with respect to the research, authorship, and/or publication of this article.
Funding
The author(s) disclosed receipt of the following financial support for the research, authorship, and/or publication of this article: this research was sponsored by a United States Department of Energy (DOE) grant (DE-EE0009235).
Supplemental Material
Supplemental material for this article is available online.
The views and ideas expressed in this paper are strictly those of the authors and may not represent the views and ideas of the funding agency in any form.