
Abstract
A network of reliable corridor charging stations is essential to building driver confidence in long-distance battery electric vehicle trips. Here, we propose a detailed methodology to measure station reliability based on charging infrastructure data. By assigning charging events to unique charging visits, our methodology can capture a holistic overview of the driver’s charging experience. We use real world charging data collected between 2019 and 2022 from 54 Direct Current Fast Chargers (DCFCs) in 36 corridor charging stations across California to demonstrate that our overarching reliability framework is close to the experience of users. Our analysis of two different charging networks shows that users of these networks have an average chance of 83% and 77% generally successful outcomes, respectively, after one or more tries at a charging station location. We also find significant variation in station performance within the same network (i.e., 79%–87% and 13%–95%, respectively). Furthermore, we observe that at least 3% of users are facing unexpected charging interruptions. In addition, we demonstrate a practical application of our framework for deep diagnostics of the charging eco-system using error codes to identify common issues such as vehicle/charger communication issues, safety issues, payment issues, and cable/connector issues. We compare how error codes alone are not a good proxy to diagnose charging failures. As more data from DCFCs becomes available, our methodology can become a mainstream tool for evaluating station reliability.
Keywords
The U.S. transportation sector is rapidly undergoing a transition to zero-emissions vehicles, with electric vehicles (EVs) having the most promise of wide adoption. By 2035 and beyond we can expect our passenger mobility and logistics services to be dependent on EVs ( 1 ). As with internal combustion engine (ICE) vehicles relying on the refueling infrastructure, the success of these new energy vehicles will hinge on the development of a robust and reliable network for energy supply and a charging infrastructure to meet their transportation energy requirements ( 2 ). Such a national network is beginning to take shape with the infrastructure funding made available by the Infrastructure Investment and Jobs Act of 2021 (IIJA) and other state and local initiatives ( 3 , 4 ). A total of US$7.5 billion has been made available by the IIJA for the EV charging infrastructure. The National Electric Vehicle Infrastructure Formula Program (NEVI) was created as part of the IIJA to administer US$7.5 billion of public funds dedicated to the corridor DC fast charging infrastructure. In addition, US$2.5 billion will be disbursed as a charging and fueling infrastructure (CFI) discretionary grant. There is increasingly evidence that the greatest hurdle to EV adoption may be the unreliable public charging system ( 5 , 6 ).
Battery electric vehicles (BEVs) can typically meet the energy needs of most vehicle days across the U.S.A., relying primarily on a night-time home charger ( 7 ). However, long-distance BEV trips have higher energy requirements than a typical day of driving, making a network of convenient and rapid recharging stations necessary to facilitate such trips. Public corridor chargers that are strategically placed along major highways are well suited to serve such trips. With the improved range of new BEVs and better BEV route planning tools, such as ABetterRoutePlanner and Plugshare trip planner, range anxiety is becoming less common with drivers. However, charge anxiety appears to be becoming a predominant barrier for EV adoption. It is characterized as the feeling of uncertainty about the ability to use chargers while on a trip, as opposed to locating a charging station ( 8 ). It encompasses a larger set of issues, such as availability/presence of stations, characteristics of vehicles (i.e., range), and reliability of charging stations. This paper will use real world charging data to study the reliability of public Direct Current Fast Chargers (DCFCs) using data from chargers, but focusing on the perspective of users.
At its core, the reliability of a system can be defined as “the probability that the system will perform its intended function” ( 9 ). Reliability models should describe the system and its functions as realistically as possible. Several studies consider the reliability of power electronics in fast charging stations as their components are exposed to extreme high-power stresses ( 10 – 12 ). However, these studies typically define the system with respect to its components and operations within the charger. This framework falls short in considering the user’s interactions with the charging station. To ensure that NEVI program funded chargers are reliable, a proxy measurement to reliability was proposed as “uptime.” Chargers are required to meet a minimum annual uptime of 97% according to the latest rules issued in 2023. According to the NEVI definition, “A charging port is considered ‘up’ when its hardware and software are both online and available for use, or in use, and the charging port successfully dispenses electricity in accordance with requirements for minimum power level” (see § 680.106(d) of NEVI guidelines) ( 13 ). The final ruling also specifies that each DCFC “must simultaneously deliver up to 150kW, as requested by the EV” ( 13 ) so as “to ensure a consistent and satisfying customer experience regardless of which charging port a customer selects and how many other ports are currently in use” ( 13 ). The uptime rule overlooks important aspects of the charging experience. That is because (1) hardware and software being online does not always ensure successful charging, (2) it overlooks the many interoperability challenges with different vehicle and charger models in the charging eco-system, and (3) it does not provide guidance on charging interruptions and emergency stops that can be observed from the charging data. Moreover, the rules relevant to the minimum power level do not provide enforcement guidance nor provide guidance for relevant data collection, such as disparities in the power levels requested by the EV and what is provided by the changer. Overall, we think uptime as a reliability measurement falls short of capturing many aspects of reliability that are important for driver experience and oversimplifies the operations of a charging station.
Many authors have questioned the validity of this time-based metric to measure the reliability of DCFCs ( 13 – 15 ). Other reliability studies have findings that are at odds with the 95%–98% uptime reported by charging station operators. A recent study found that public open-access charging stations in the Greater Bay area are far less reliable than what station operating companies have reported. Out of a random sample of public, open-access DC fast charging stations, only 72.5% were found to be functional ( 14 ). A survey conducted by the California Air Resources Board (CARB) found that out of the 1290 drivers that responded, 439 drivers cite “charging station operability issues” as a barrier to using charging stations. In the same survey, out of the 617 drivers that contacted customer services, 261 cite they did so because the charging station unit was not working ( 15 ). Therefore, this is evidence of the discrepancy between uptime and reliability. It appears that a driver’s perception of charger reliability is different from the various aspects that can be measured by “uptime.” We believe uptime will offer limited value in rectifying the negative charging experiences of drivers ( 14 , 16 , 17). We fear that substandard industry incentives could develop around ensuring high uptime, rather than prioritizing meaningful reliability from the user’s perspective. In anticipating this disparity, the new California Assembly Bill 2061, passed in 2022, encourages the development of additional reliability metrics. Unless resolved, low charger reliability has the potential to derail the state’s goals to achieving a cleaner passenger transportation system.
In the rest of the paper, we propose a new methodology to calculate the reliability of public DC fast charging stations from real world charging data. Here we also define charger reliability holistically based on different levels of charging failure and partial successes that have been observed in the data. Finally, we include an analysis of the common error codes and what they mean in this context.
A Broad Framework of Reliability
In our reliability analysis, we define the system broadly considering the broad charger eco-system with respect to the user and the BEV. Figure 1 provides a summary of the various levels of reliability failures a driver may experience when they arrive at a charging station with the intent of charging their vehicle. We have attempted to make this list as comprehensive as possible. The shaded region marked in blue indicates the focus of our study that directly analyzes data from charging events. We have limited information on situations where access to the charging station may be physically blocked or when the station is offline. Some definitions of different charging errors indicated in Figure 1 are found below.
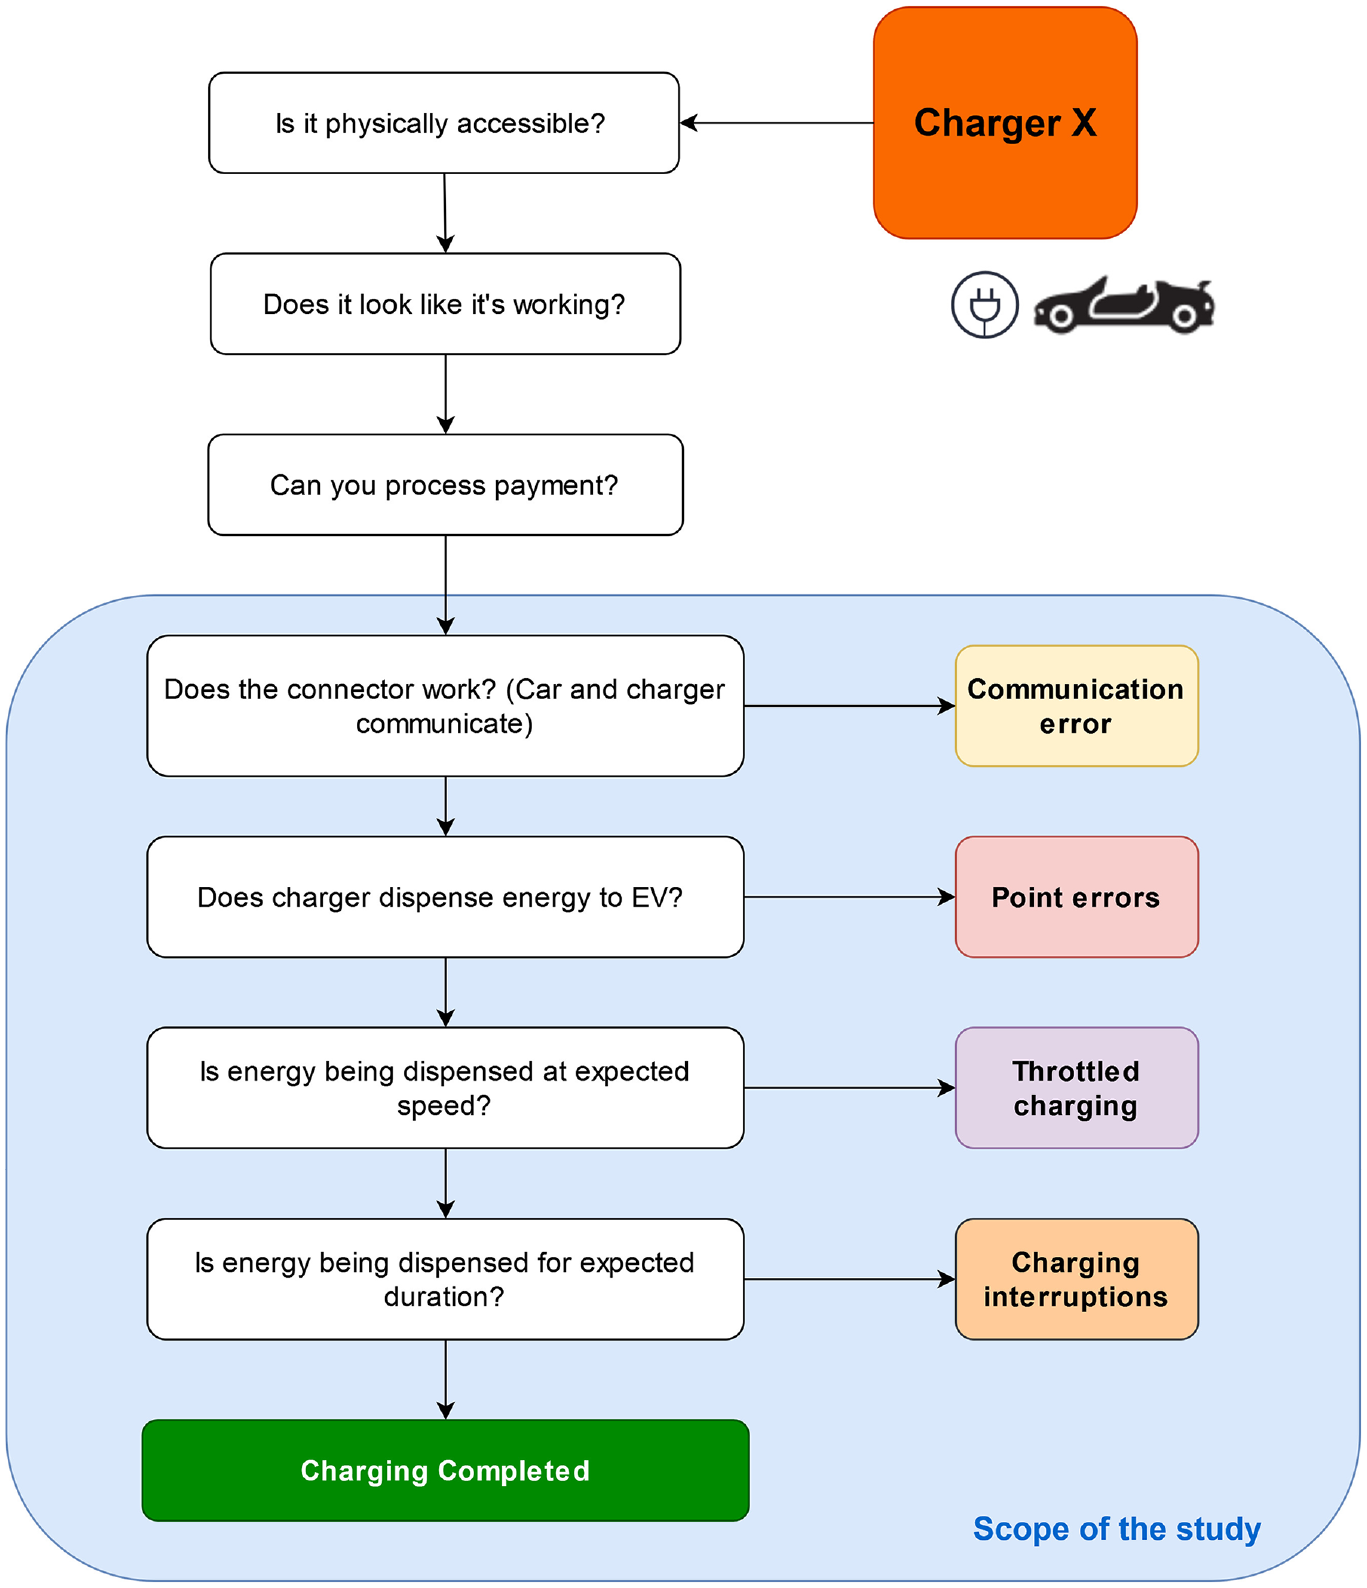
Possible levels of reliability failures at a charging station from the perspective of the driver (user). Our focus in this study is highlighted in blue.
Some definitions of charging failures, as described in Figure 1, are as follows.
From the point of view of charging station users (i.e., drivers), a successfully completed charging event is an uninterrupted charging event that delivered fast charging consistently meeting advertised speeds for the desired duration of time.
Methods
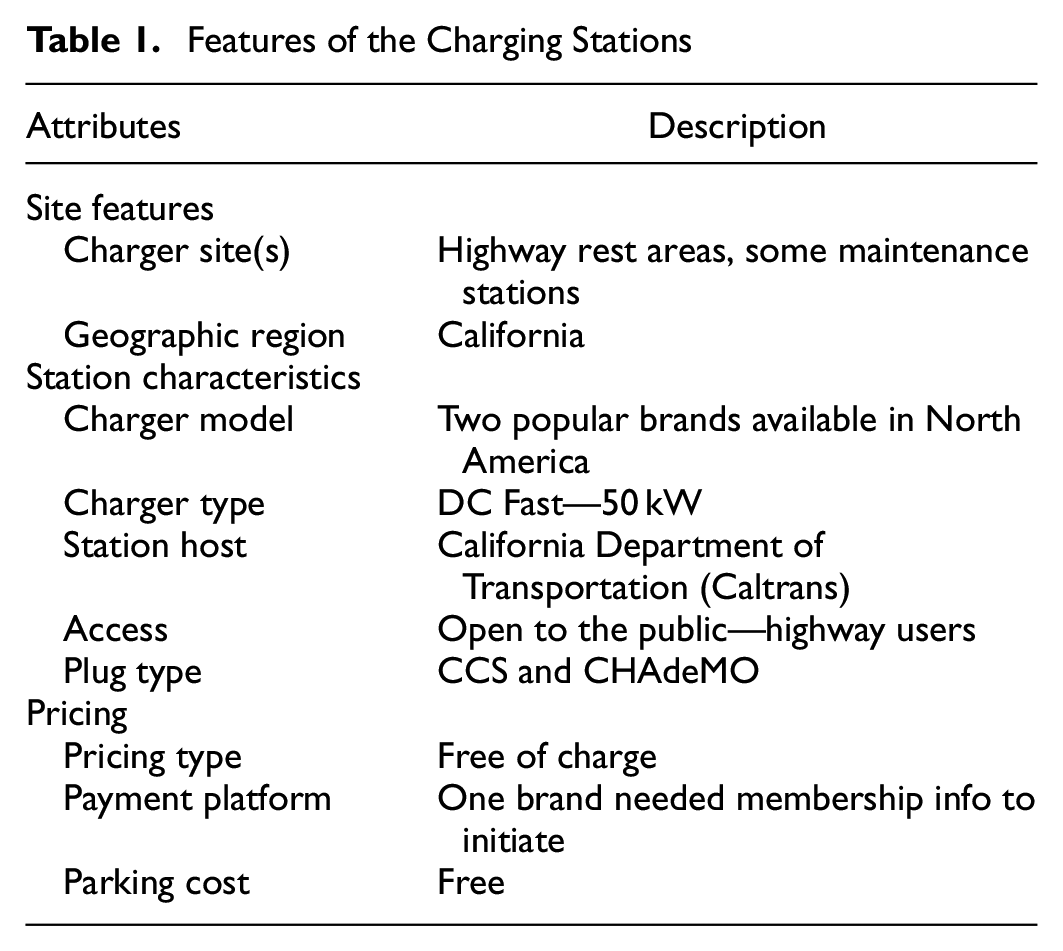
This study analyzes data from the 54 corridor DC fast chargers installed in 36 different locations by the Caltrans ZEV 30-30 project. These chargers were constructed during 2020 and almost all stations were operational and were open to the public by early 2021. Major features of the charging stations can be found in Table 1. Two popular charging providers available on the market were chosen for the project. Here we will refer to them as brand A and brand B. Other monitoring and ancillary services, such as cloud services, that recorded and remotely monitored charging sessions were provided by their respective brands.
Features of the Charging Stations
Data Preparation
The charging data was shared with us by Caltrans personnel in the form of a downloaded Excel file. The original datapoints contains different aspects of the recorded charging events as 32 variables. We filtered the following variables, expanded in Table 2, for our study as they were the most relevant.
Data Dictionary
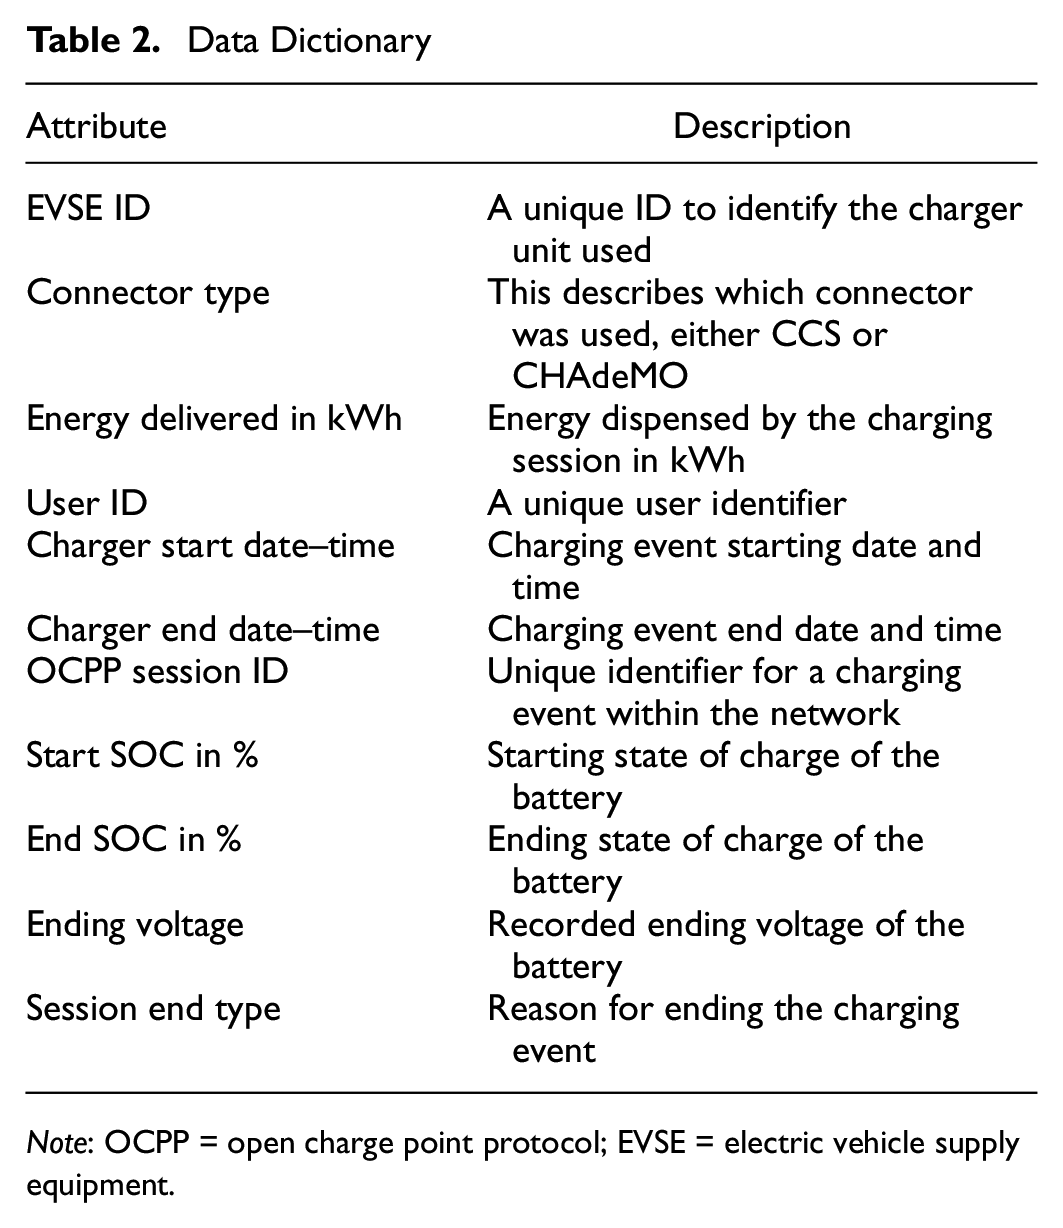
Note: OCPP = open charge point protocol; EVSE = electric vehicle supply equipment.
As part of the data preparation, we created a “Station ID” combining different Electric Vehicle Supply Equipment Identifications (EVSE IDs) that were in the same charging station. Only chargers within proximity to each other on the same side of the freeway were considered as part of the same station.
A charging event consists of an attempt by the user to connect the charger plug to the EV charger socket in the vehicle. The charger records such attempts regardless of whether energy was dispensed or whether the charger was able to communicate with the vehicle. When the charger did not communicate with the vehicle, certain attributes such as starting and ending state of charge (SOC) and ending voltage were not captured in the data and remained as missing values.
Step 1: Initial Screening of Charging Events
Here we differentiate charging events based on the energy output of the event. Any event that dispensed more than 1 kWh is considered as a successful event. All events that do not meet this criterion are considered unsuccessful events or no-charge events. A separate column was created to indicate if the event was a success or not. (This is an initial definition to screen charging events. A more comprehensive definition of a successful charging event is introduced in Figure 1.)
In this step, we attempt to filter events that have negligible energy transfer. We think 1 kWh is a good cut-off point to make this distinction. The equivalent electric range added by 1 kWh is about 3–4 mi. This does not make a significant difference in outcome for long-distance BEV trips. A distribution of the energy output of events that fall under these criteria is found in Figure 2 as an example. According to Figure 2, most of the no-charge events have an energy output of less than 0.1 kWh.
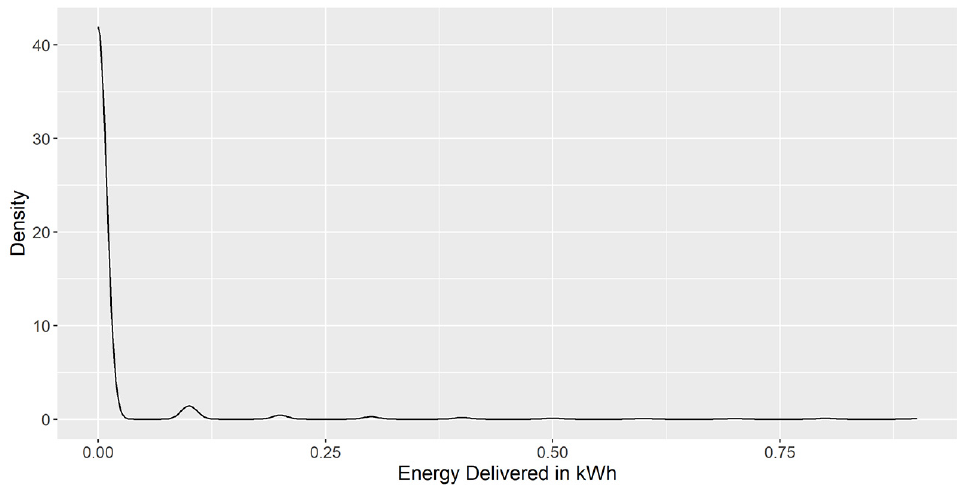
Distribution of energy output of charging events that dispensed less than 1
Step 2: Determining Visit Threshold and Defining Visit ID
We needed to establish a time threshold to differentiate different charging visits from the same user. This threshold represents the minimum time gap required to differentiate whether two charging sessions are part of the same visit or distinct visits. Initially we selected a time threshold of 5 min intuitively. After careful analysis of the data (found in Figure 3), we identified that the time threshold for 5 min agrees with the evidence.
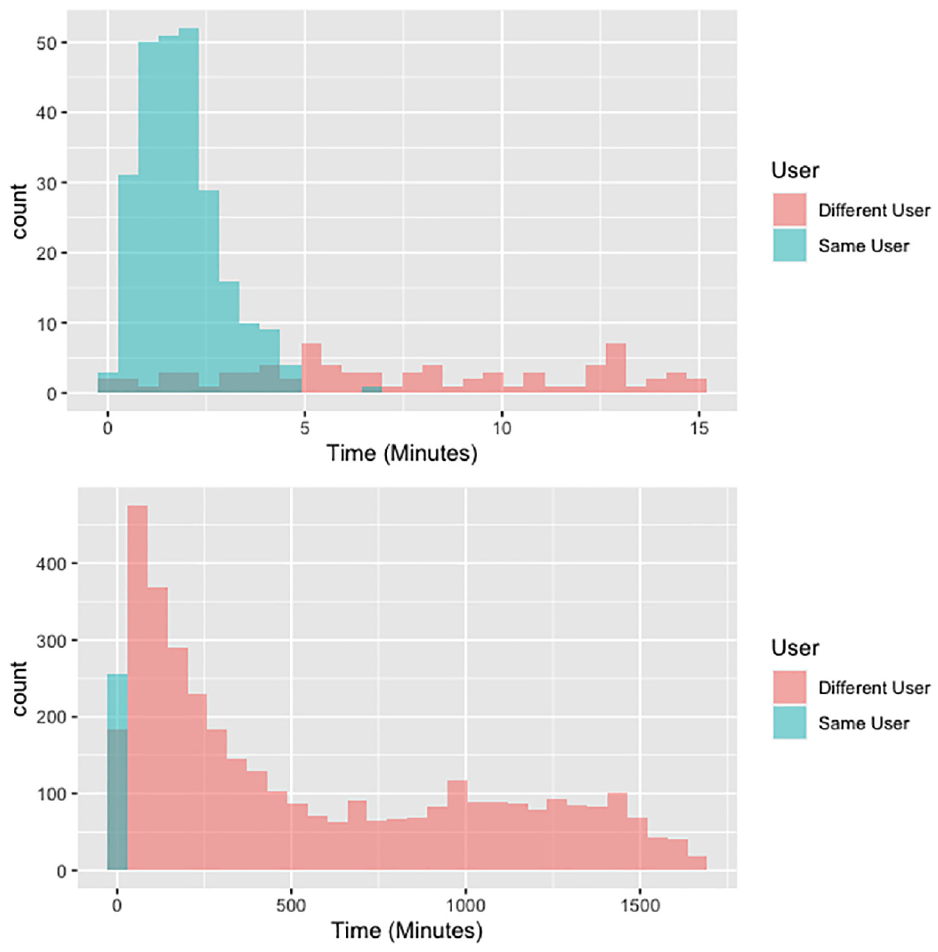
Distribution of the time interval between recorded charging events at the same charging station between the same user and a different user. (Top) Distribution is a subset of the data for 15 min.
Figure 3 draws charging data that included unique user IDs. We were able to group charging data by station location and arrange by chronological order to plot the time difference between consecutive charging events. According to Figure 3, we identified that if there are multiple charging events recorded by the same user, almost all such charging events by the same user at a given station takes place within 5 min of each other. We observed that attempts from different users are usually recoded after 5 min of the end of the previous event. This trend might change with corridor chargers as more EVs are driven for long-distance trips. However, using user ID information, such events can be differentiated. Intuitively, multiple attempts by users within the visit threshold indicate some difficulties in successfully initiating charging.
Visit Identification
Based on the visit threshold determined before, we group all charging events recorded by a user during a single visit to a charging station by defining a visit ID. Firstly, we arranged all the charging events in the dataset by station ID and charger start date–time to ensure chronological order. Then we grouped the data by station ID and user ID to process each charging station separately.
Step 3: Group Events by Visit ID
In this step, we created a new summary dataset from the previous dataset that had visit ID information. We grouped data by user ID, by the success/failures of the event, station ID, and visit ID. This dataset gives more information about how many successful and unsuccessful attempts were made by a user for a given visit.
In the next step, we further summarize the previous data by summarizing the count of successful as well as unsuccessful attempts grouped in the same row by user ID, station ID, and visit ID. This summary table provides a more comprehensive grasp of the events that transpired in a visit to the charging station.
Variation 2 for Datasets Without Unique User ID Information
Some datasets may not contain user ID information. Until industry-wide charging data collection best practices are adopted, some charging databases may have data without user IDs to differentiate events by users. In such a situation, we can approximation the previous rigorous visit identification process by differentiating events by a 5-min time threshold by stations. We had to use this methodology for data collected from one EVSE provider as they did not include the user ID.
Step 4: Identifying Failure/Success Categories
Based on the summary database created from Step 3, we are able to classify outcomes from charging visits as follows.
We define persistent failures as visits where either (1) the users could not successfully have the chargers working as intended even after multiple attempts (multiple failed attempts with no success) or (2) users did not attempt to try again after first failed attempt. In both instances, the users leave the charging station not having received any energy.
We can filter such persistent failures using visits where the outcome follows the criteria mentioned above.
These are charging visits where users had some initial difficulties in initiating the charger but managed to get the charger working after some attempts. We can filter such visits using the criteria here.
Here we identify a unique situation where the charging event was stopped or interrupted during a charging session. We hypothesize that the charging station or vehicle ended the charging event as part of a safety feature that prompted an emergency stop. This is a necessary feature built into the charger eco-system to prevent damaging the equipment or prevent harm to the user. However, charge interruptions can result in incomplete charging, longer charging times, and inconvenience to the EV driver if they were not notified in real time of the charge interruption.
Charging interruptions can happen at any point of the charging process. Therefore, to better capture such events, we can expand the visit threshold previously defined from 5 min to 2 h. Unfortunately, that means only datasets with user IDs are able to fully capture interruptions using this method.
We filter out visits where two or more “successful” events were recorded back-to-back. We hypothesize that this is an indication of forcing the driver to re-start the charging process to achieve a desirable level of SOC.
We refer to a situation where the charging speed or output power in kW was much lower than the advertised speed as a throttled charging event. There are many factors that can limit the charging speeds, such as the SOC of the battery and limitations set by the vehicle. Conceptually, this is a situation where the charger is failing to meet the desirable speed by the vehicle, considering limitations in the power rating.
Step 5: Identifying Successful Events and Measuring Performance
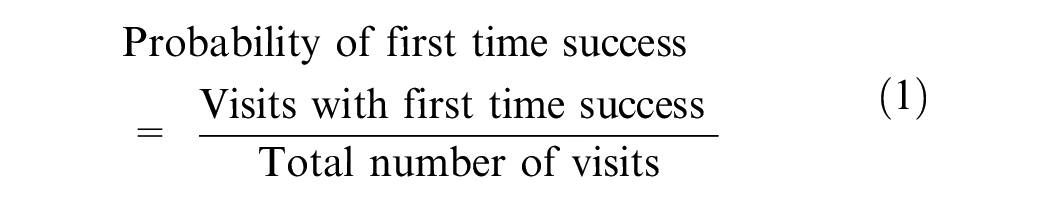
A successful outcome in the first charging attempt should be the aim of charging service providers and can greatly enhance the charging experience of users. Here we use the following criteria to identify first time success:
A simple probability can be calculated for every level of success/failure based on charging visits as follows:
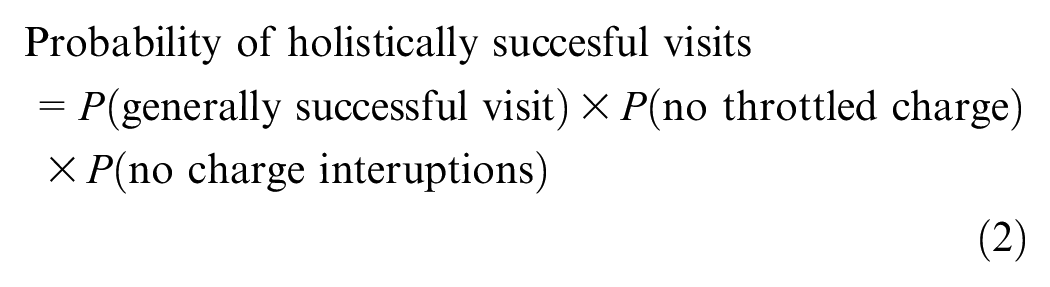
Practically, we think troubled success should also be considered as part of overall successful outcomes. In our analysis we aim to include (1) first time success, (2) troubled success, and even (3) interrupted charging in the first layer of success. Then we can identify the probability of throttled charging out of the generally successful visits.
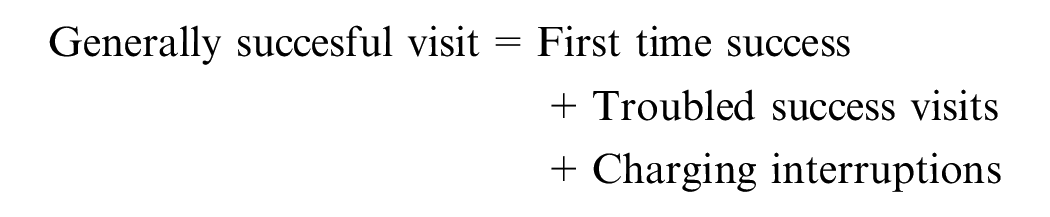
Holistically, we use Equation 2 to calculate the probability of a successful visit with no throttled charging and no interruptions:
Summary of the Data Collected
The data in our database starts from August 2019 starting from brand B. The stations from brand A were finished in January 2021. We have data collected until November 22, 2022, used for this study. Figure 4 provides a summary of the number of charging events ordered by charging station and network provider.
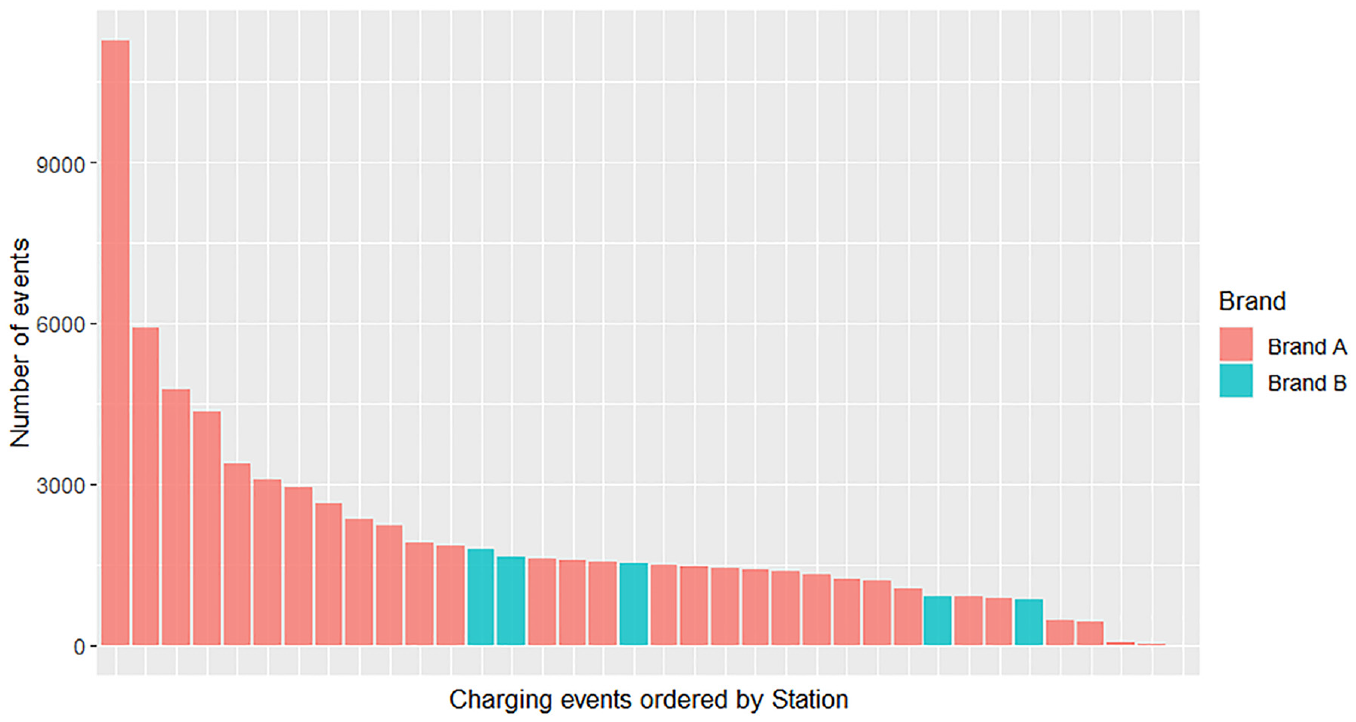
Summary of the data by station and brand of EVSE (station names on the x-axis are muted here to protect the EVSE brand identities).
Table 3 provides a summary of the number of recorded charging events from each charger brand and the number of chargers included in the dataset (some stations included two chargers and a few stations had four co-located chargers). The generally recorded number of charging events appears to be low compared to other similar databases for the given period. We believe this is because this data is from en route corridor chargers selected for this project by Caltrans because of the lower BEV traffic volumes as opposed to destination chargers installed in high-traffic long-dwell locations such as department stores or workplaces. A map of the charging station locations is given in Figure 5.
Summary of Data Source Collection
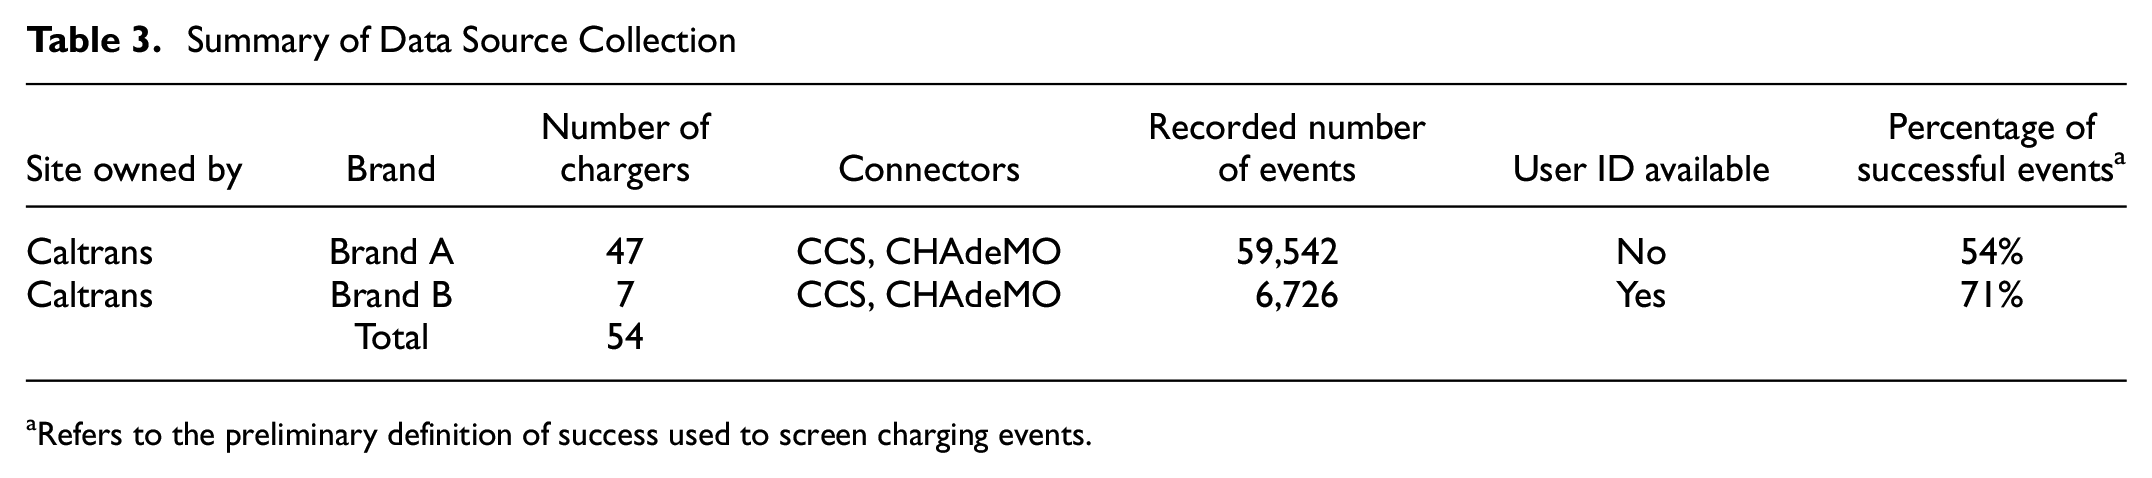
Refers to the preliminary definition of success used to screen charging events.
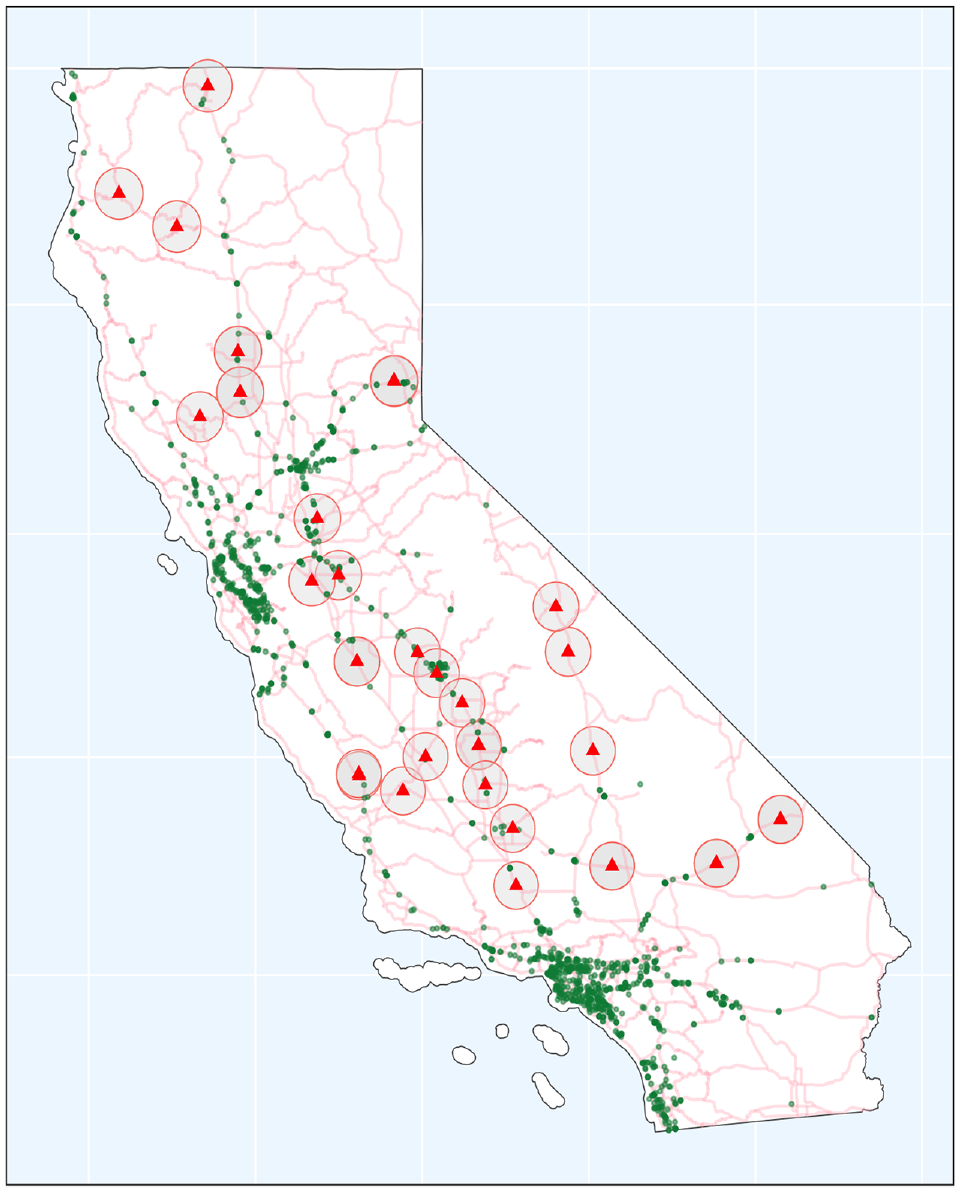
Location of the ZEV 30_30 charging stations (in red) with respect to other public DCFCs in California (in green).
Results
This section covers the results of the reliability calculations from the dataset described above. We show this as a practical application of the methodology section for a network as a whole and for individual stations. In this section, we also use the methodology to identify causes of persistent failures.
Overall Probabilistic Reliability Results for the Brand B Network
A summary of the analysis for brand B data is provided in Figure 6. For brand B, the total number of 6726 recorded events from the DCFCs in our analysis maps to 5761 unique visits where multiple charging events are assigned to the same charging visit. With this information, we can determine the failed visits with no successful outcome. Figure 6 includes a summary of this information for all the charging stations that installed brand B in the network. About 25% of the visits experience first time failure. However, 8% of them try again and manage to get the charger started. We then add these visits to the overall success. About 17% of the drivers experience failed visits. This is comprised of 14% of the drivers who did not try again and 3% who experience persistent failures despite trying again. Overall, we identify an 83% probability of generally successful visits in this network of chargers.
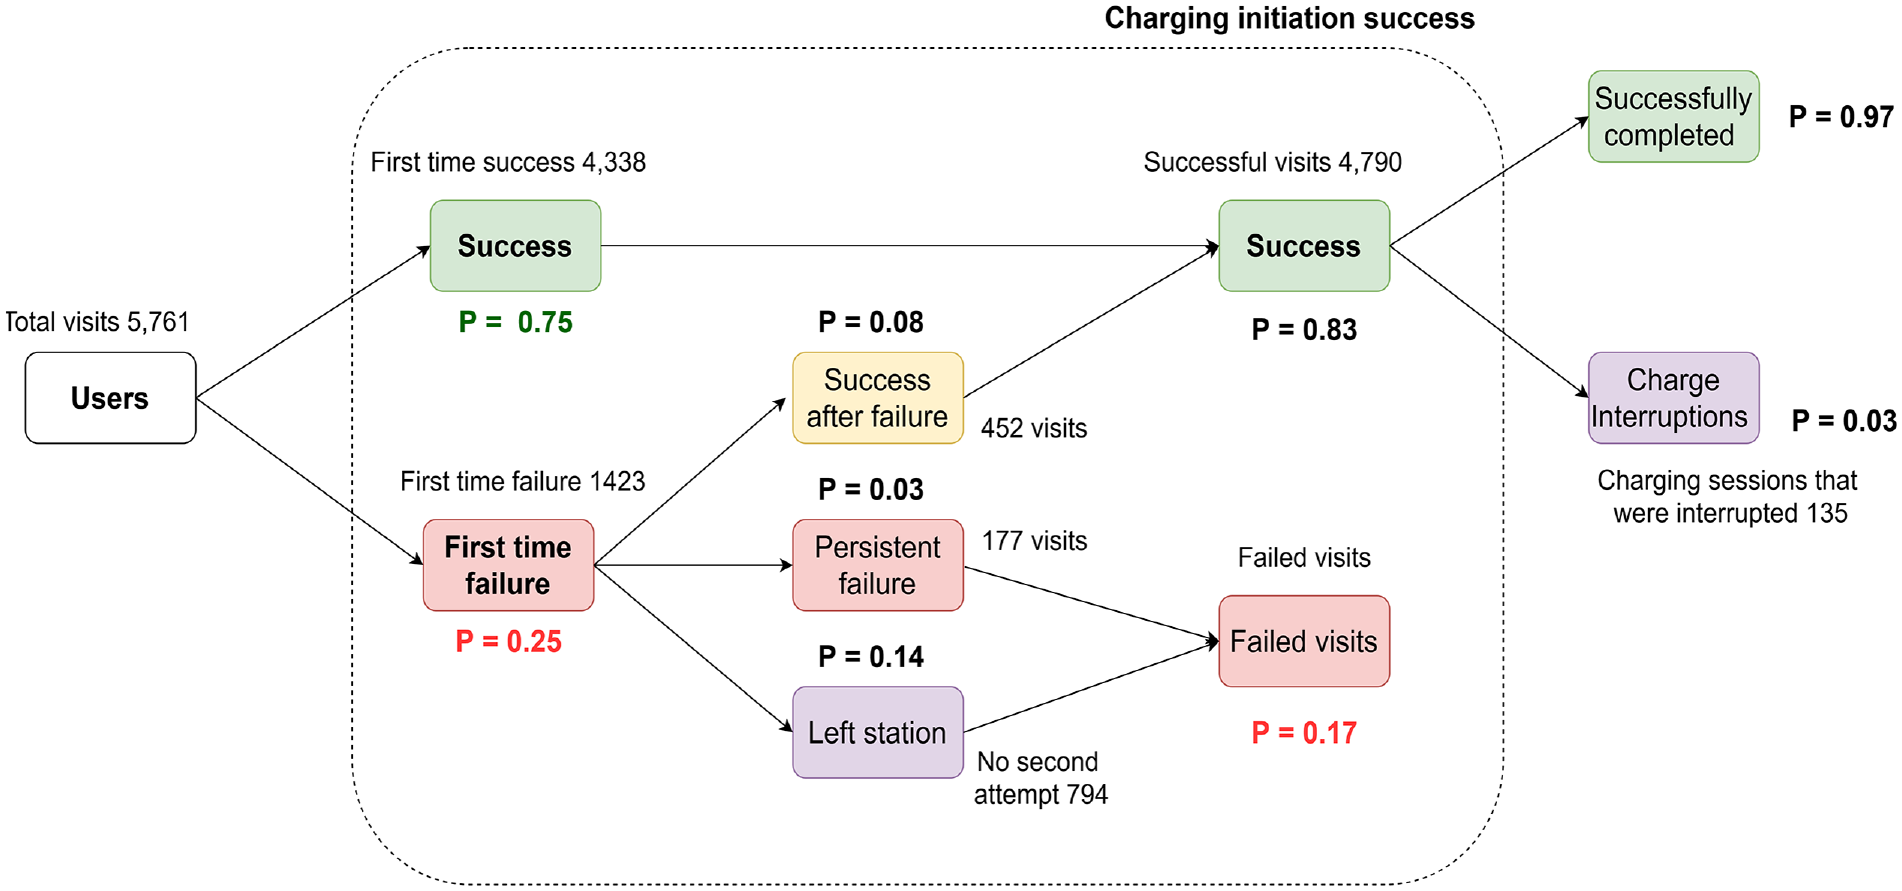
Summary of reliability probabilities for brand B.
We identify that out of the 4790 successful visits, at least 3% of the drivers experienced charging interruptions based on our methodology. Therefore, we can calculate the probability of holistically successful outcomes for the network as follows using the previous equation (Equation 2):
Brand A Network
Using our methodology, the total of 59,542 recorded events at brand A charging stations converts to 42,014 visits, as summarized in Figure 7. As the brand A network data did not collect user ID information, we are approximating the charging events recorded by different users. To do this, we are using our methodology and grouping charging events by connector type to further separate data by different users. As indicated, about 24.5% of the users did not have a successful outcome from the charging visits. About 8.5% of the drivers experienced troubled success (had some initial trouble charging but managed to have a successful charging in the end). So, overall, we can assign a 75.5% probability of success in the brand A network.
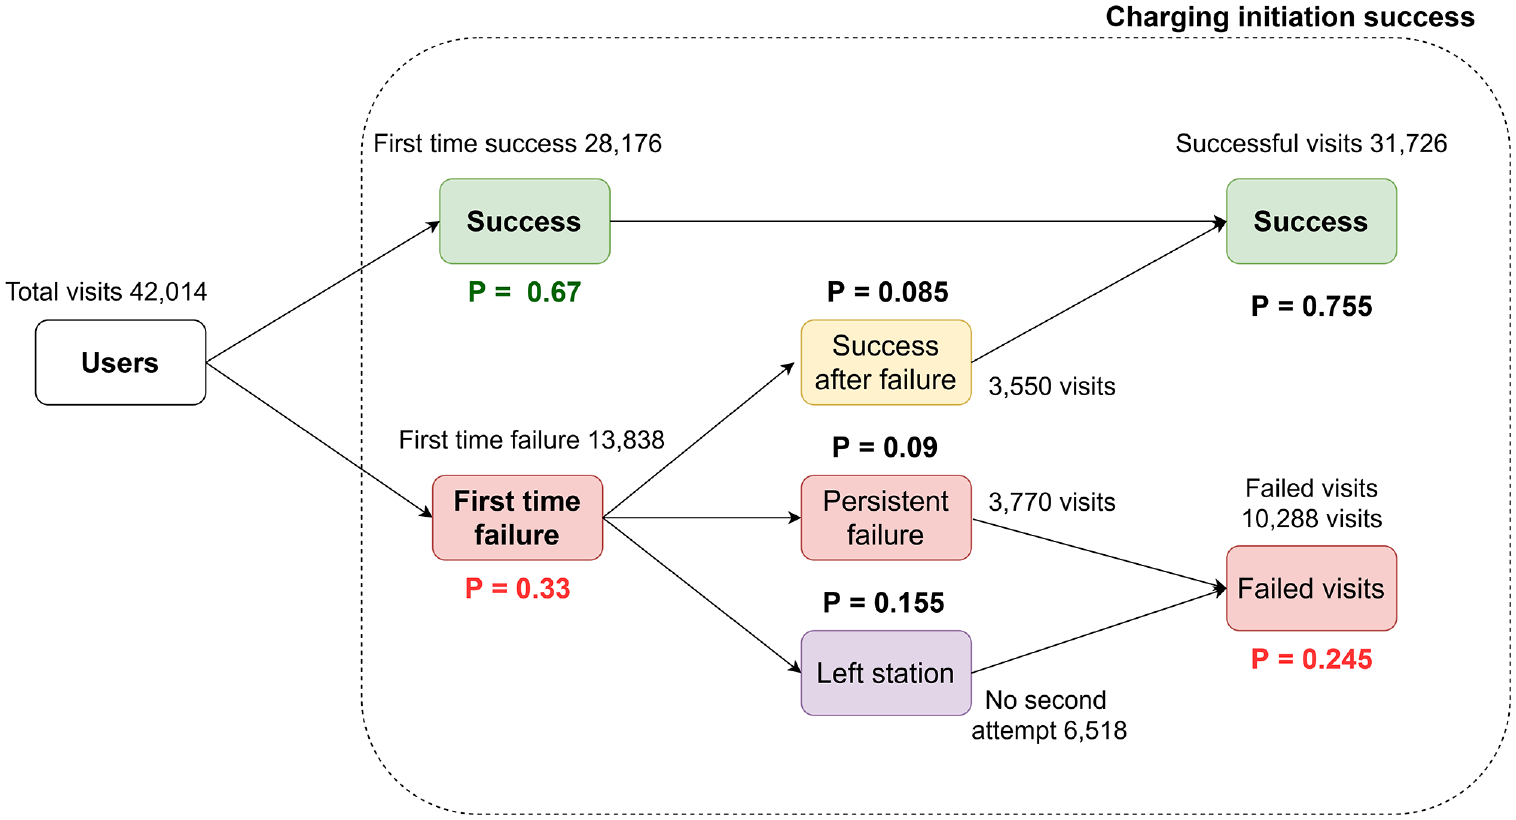
Summary of reliability probabilities for brand A.
As the brand A network data did not collect User ID information, we are unable to holistically calculate charging interruptions.
Probability of Generally Successful Visits by Station Level
To better understand station-based reliability, we can separate the charging visits by stations and calculate a probabilistic reliability value by stations. Such a distribution is available in Figure 8. The color legend is as follows. Stations that have 0.9 probabilities or higher are represented in green, stations with 0.8–0.9 probabilities of general success are represented in orange, and stations with probabilities less than 0.8 are represented in red.
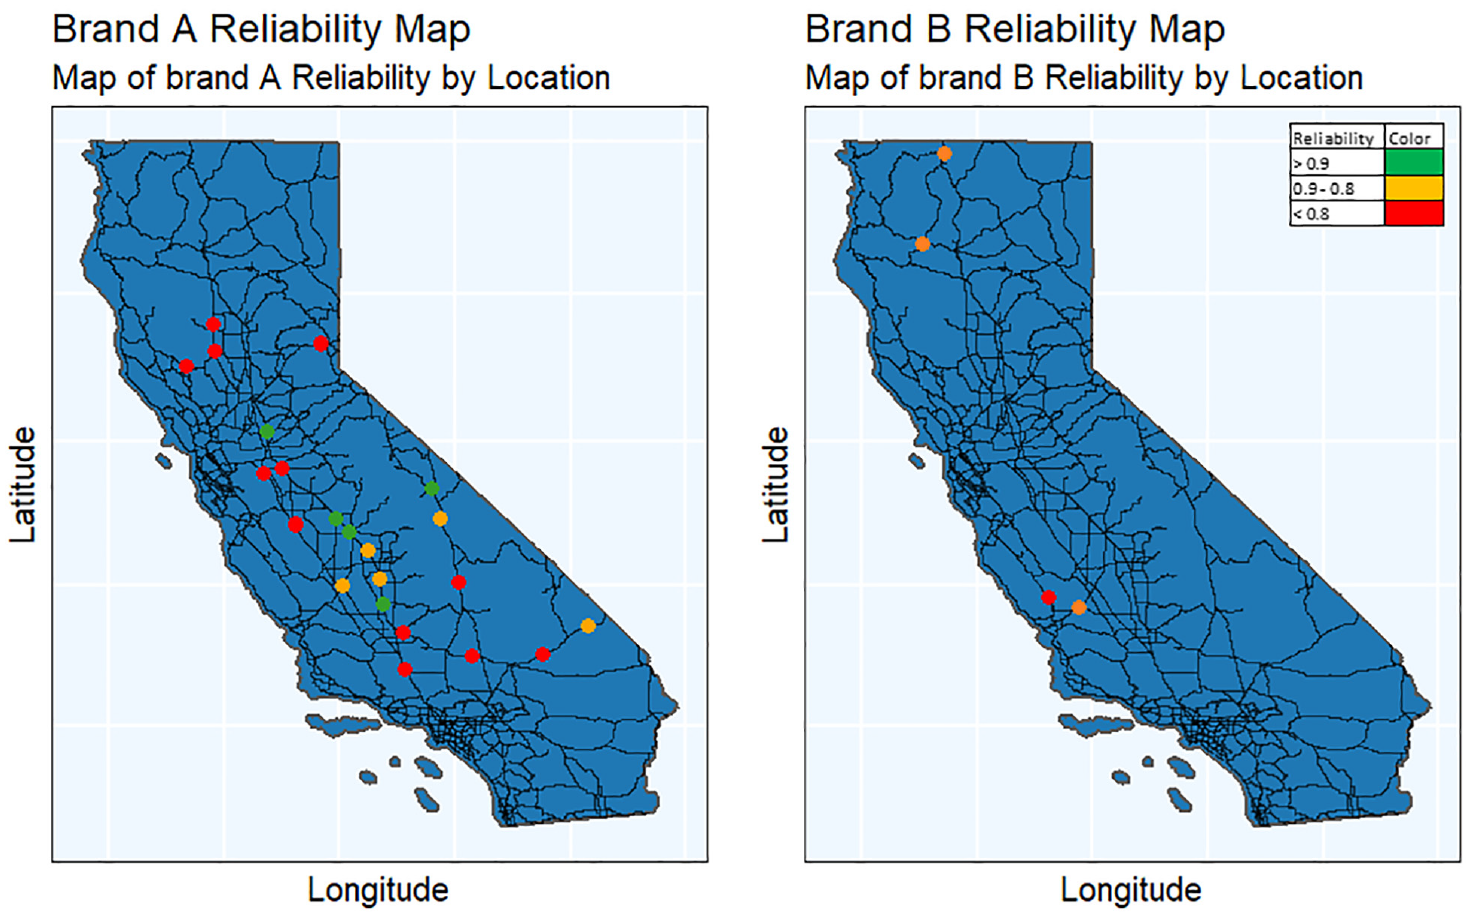
Probabilistic reliability of charging stations with brand A (left) and brand B (right).
Diagnostic Analysis Based on Persistent Failures Based on Charger Error Codes
Using the classification made with visit IDs, we are able to filter persistent failures using the criteria described in the methodology. These are visits (1) where the users could not successfully get the chargers working as intended even after multiple attempts or (2) did not attempt to try again after first failed attempt. Then we can reverse our strategy in converting charging events to visits by mapping visits back to individual charging events. This is because successive errors considered in the same charging visits can have different reasons. Furthermore, errors are assigned in the dataset to a specific charging event, not visit. Here we conduct a deeper diagnostic analysis of the charger eco-system of the causes of persistent failures.
Error Codes
We derive error codes from the session end type information that is recoded in the dataset. Error codes are typically a subset of the session end types, which can also include information of successful charging and normal shutdown of the charging stations. For our analysis, an error code is an indication of a failed charging session. These include issues such as communication errors, over-current errors, temperature-related errors, connector/cable issues, and system errors. These codes are not consistent across different EVSE brands and there is an ongoing effort by the National Charging Experience Consortium to standardize diagnostic and testing tools, such as error codes ( 18 ).
Types of Error Codes and Sub-categories
With brand A we were able to identify 39 distinct error codes from the recorded charging events that map to persistent errors. We have attempted to group together the 39 charging error codes into larger error categories to the best of our understanding using publicly available information and information provided in EVSE user manuals. Brand B only had 11 distinct error codes for the persistent errors, and we have summarized how we grouped the error codes in Table 4.
Error Categories Used for Analysis
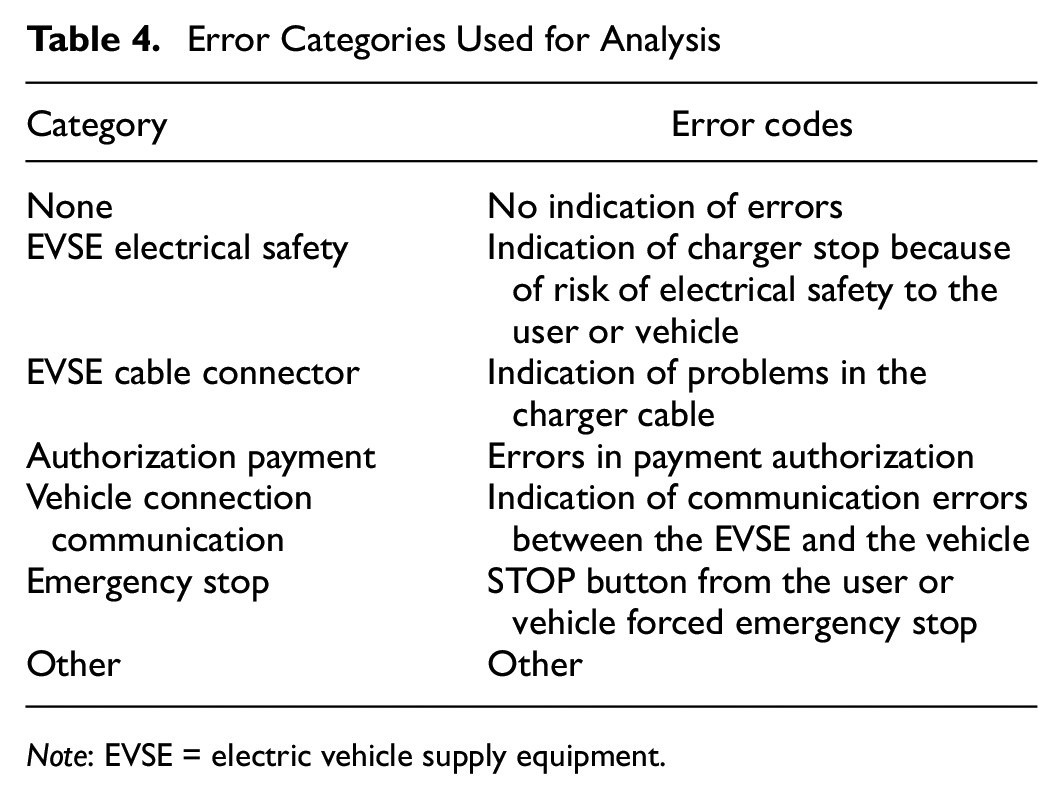
Note: EVSE = electric vehicle supply equipment.
Brand A
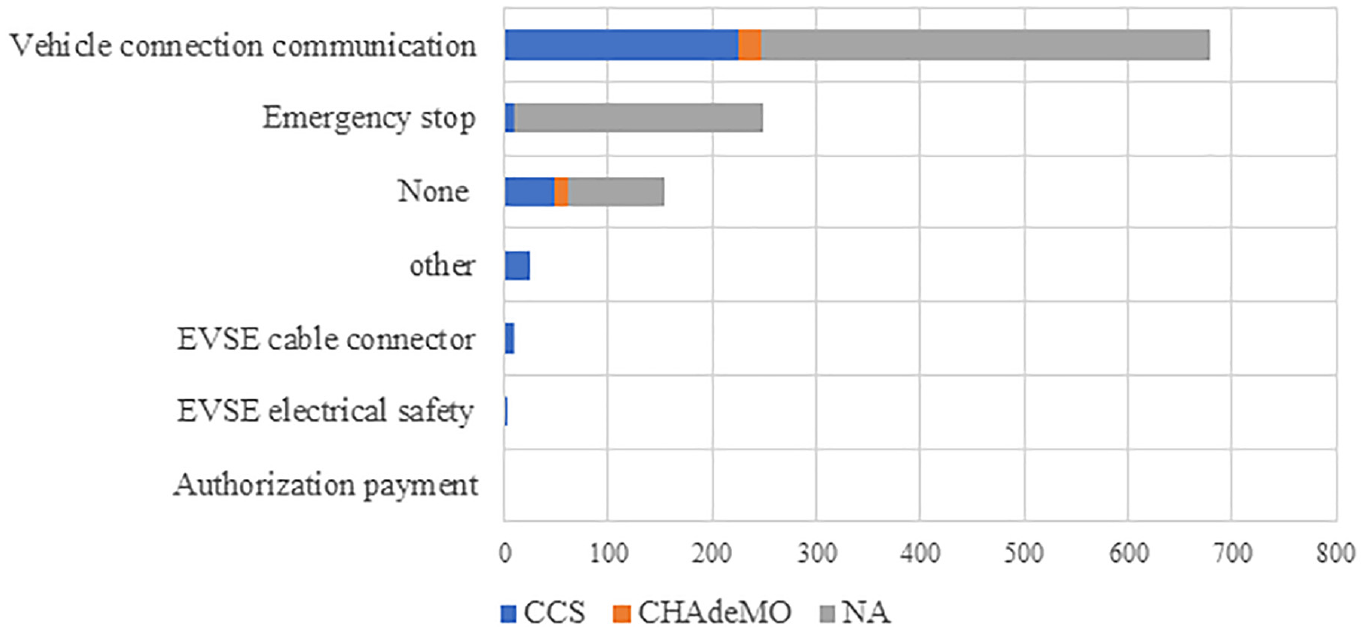
Figure 9 represents the causes of persistent reasons for errors out of 40,724 total charging visits. We identified unique error codes pertaining to the CCS and CHAdeMO connectors. We identified overall 12,874 events mapped from persistent failures. A summary is found in Figure 9.
Causes of persistent errors for brand A.
Brand B
Figure 10 represents errors out of 5760 total visits. A total of 1116 events are mapped from persistent failures. Here we observe that some events are not able to identify the connector used by the user and are listed as NA. Brand B had far less distinctive error codes by their design. Although we could not find a manual that describes the meaning behind the brand B error codes, they were descriptive enough to infer some meaning.
Causes of persistent errors for brand B.
Comparing EVSE Networks
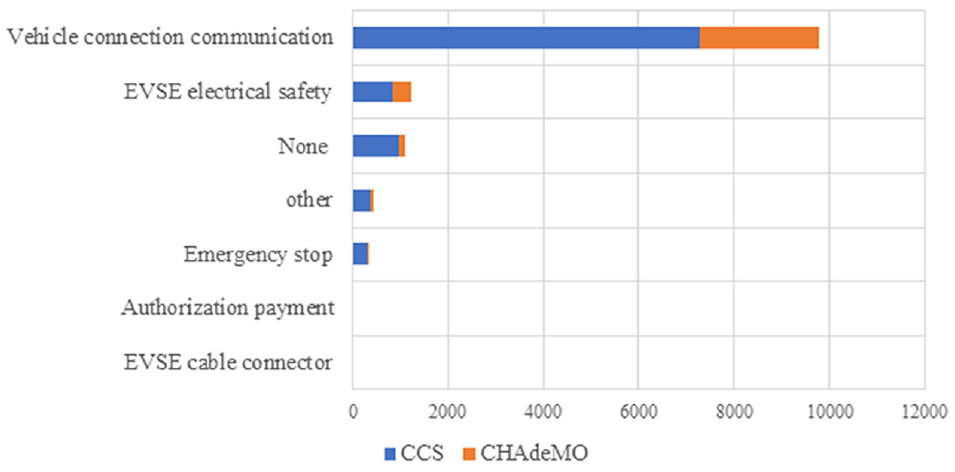
The data from Figures 9 and 10 were not comparable because the total number of visits and charging events that lead to the error counts were vastly different. Also, the same network may have different hardware models by the same manufacturer. To rectify this, we created a plot to count errors per 1000 charging visits, given in Figure 11. The purpose is not to compare the two brands but rather to identify common trends. It is clear that communication failures between the vehicles and the EVSE is a major cause of persistent errors.
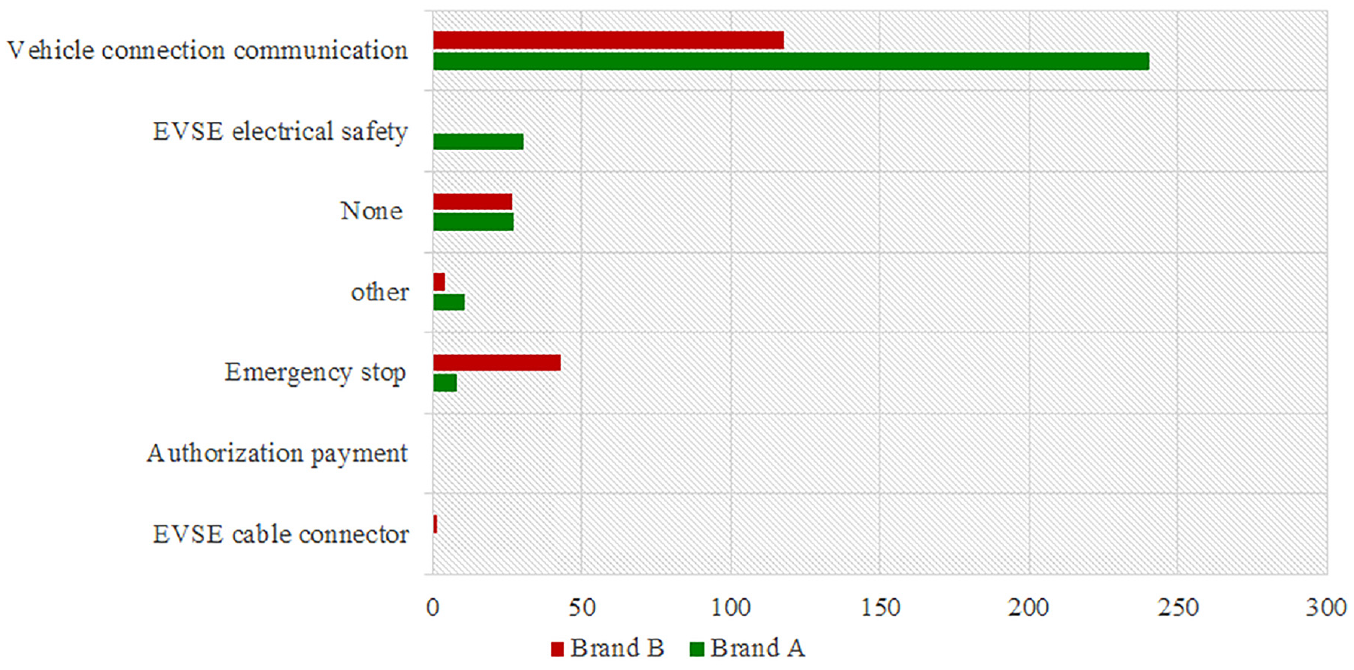
Errors counts by both brands per 1000 charging visits (error counts are in events, and therefore not an indication of the outcome of charging visits).
Discussion
Deeper Diagnostics
The most prevalent reason for persistent charging errors was communication errors. This indicates the inability of the charger and the vehicle to communicate with each other. When this error is identified, we see that charging events only record minimum information such as attempted time, open charge point protocol (OCPP) ID, and plug type, that can be recorded from the charger sensors. Information that is communicated from the vehicle, such as starting SOC and battery voltage, are not recorded as expected. The communication errors in Figure 11 can stem from multiple reasons: (1) the charger is not able to initiate communications with the vehicle; (2) the connector is not properly connected to the vehicle; or (3) the vehicle is not communicating with the charger. Based on some informal interviews we conducted with industry partners, this type of error is largely caused by problems that may prevent physical contact between the connector pins and the vehicle charger port (i.e., having some dirt in the connector pins, damaged connector pins, or misaligned connector preventing communication). When physical contact is established, this error can be caused by interoperability issues of digital communication between the vehicle and the charger ( 19 ). The assumption is that charging is not initiated because communication cannot be established. The common industry standard for DC fast chargers is the ISO/IEC 15118, which includes a whole subset of standards for plugs, charging topologies, communication, security, and safety ( 20 ). ISO 15118-2 is the vehicle-to-grid communication interface that is commonly used right now. However, other communication standards, such as DIN SPEC 70121, exist with the new ISO 15118-20 standard promising to be an advancement to the ISO15118-2 standard. The California Energy Commission’s (CEC’s) analysis suggested that DC fast chargers in the market are already ISO 15118 ready ( 21 ). Therefore, any interoperability challenges suggest a gap in testing and compliance of these chargers. More recently, automakers have made announcements supporting the North America Charging Standard (NACS) as they move forward. While the NACS is the design of the physical connector, it is unclear what communication interface is going to be used to support the NACS.
As 8%–9% of users experienced troubled success in both networks, we hypothesize that this is because of the challenges of maneuvering the cumbersome plugs designs. Adopting the NACS connector may alleviate some of these challenges as it is smaller and easier to use ( 22 ). Some customer education and outreach may also help alleviate frustration at charging stations.
DC fast chargers are essentially operating in a complicated eco-system of physical infrastructure, standards (also called public key infrastructure), users, and vehicles. In this eco-system both the physical infrastructure and vehicles are supplied by many different market actors (brands) for users who have very different education and experience with charging station usage. When setting reliability expectation to such a complicated techno-economic user eco-system, regulators should consider the broadest possible understanding of the full eco-system. Furthermore, trying to achieve very high reliability without fixing major design problems within the eco-system may even cause more problems. For example, throttled charging and charger interruptions can occur because of several reasons, such as protecting the battery from overheating, charging cable overheating, ensuring safety to the vehicle and user, and general faults in the charging equipment. In trying to fix such nuanced problems, it is important to have an open dialogue with EVSE manufacturers, designers, and charging standards and protocol planners to get to the bottom of existing design faults. Federal and state government agencies are well placed to initiate such discussions. The ChargeX consortium initiated by the Joint Office of Energy and Transportation is a step in the right direction.
Policy Implications
The aim of this study is to demonstrate the effectiveness of our proposed methodology in assessing the reliability of charging stations, providing insights into the actual experiences of drivers at these stations. We can employ certain metrics outlined in this study to gauge industry progress, such as achieving consistently successful visits in the short term and first time success (every time) in the long run. Our approach to reliability is outcome-based, placing more emphasis on customer experience compared to uptime. Figure 1 illustrates how uptime is missing a comprehensive range of errors and customer pain points. While high uptime is a necessary precursor to high reliability, first time charging success when chargers are online should be the definitive goal of the industry and policymakers. Nearly all metrics suggested in the paper are dependent on the accuracy of visit identification. Here we want to emphasize the importance of capturing the user ID or some form of anonymized personally identifiable information (PII), such as the vehicle identification number (VIN), that can be used to differentiate multiple attempts to charge the same vehicle at a given visit.
From the results we can determine that the corridor charging stations we analyzed are not meeting our reliability expectations. The brand A and B networks respectively have an average of a 77% and 83% chance of a generally successful visit. We also find significant variation in performance in different charging stations. Individual stations in network A had a chance of a general success between 13% and 95% whereas network B stations had a range of 79%–87%. While the quality of the EVSE brand appears to have some impact on the station performance, we believe other factors, such as frequency of maintenance and frequency of usage, affect the reliability of charging stations. As found in Figure 8, some charging stations had less than 80% of successful visits. This means that at least 20% of visits to the charging station may result in failures. In comparison to the current gas station business model, this level of reliability is unacceptable. We also think that a high count of usage data per station will improve the accuracy of the probabilistic reliability indicator proposed in this study. As more charging data is made available with higher EV adoption, our methodology can be modified to measure the reliability over time.
The broader goal of our study was to evaluate the scale of reliability failures in California’s network of corridor fast chargers. This is an exploratory study to identify the depth of the problem. The results are very clear, and the problem is severe. Unless resolved, current reliability numbers will hinder the further adoption of EVs and might slow down California’s ambitions plans. The urgency of this problem cannot be understated, and we need all stakeholders to prioritize their efforts and focus on addressing the reliability of public DC fast charging stations. California legislation, such as AB 2127 and AB 2061, have focused on improving public charger reliability. The federally funded NEVI program also has a strong focus on ensuring reliability. The reliability indicator proposed in this study helps measure and achieve high reliability better from a customer focus.
As suggested in AB 2061, further reliability metrics should be encouraged. We present our probability-based reliability metric here as one possible measure. As more usage data from DCFCs become available, our methodology can be a mainstream method for evaluating the reliability of charging stations that closely represents the true outcome at a charging station. We are optimistic that the Electric Vehicle Charging Analytics and Reporting Tool (EV-ChART) that is being developed by the Joint Office will facilitate further research to that end. We recommend further research into developing metrics and performance indicators to measure other aspects of customer satisfaction, such as (1) ease of use, (2) accessibility, and (3) real-time information availability. The ChargeX consortium is in the process of developing key performance indicators (KPIs) at the time of writing this document. Another interesting study relating to reliability is exploring the causes of throttled or slow charging when it appears both the vehicle and charger are capable of higher speeds. We believe having access to more detailed charging session information can help us understand this problem.
Footnotes
Acknowledgements
The authors want to thank the California Department of Transportation (Caltrans) for sponsoring this study and sharing internal documents, analysis, information, and learning insights with the authors. We want to particularly thank all the officials from Caltrans for contributing their time and knowledge, whose insights were incorporated into this study. The authors also want to thank Dahlia M. Garas from the Institute of Transportation Studies, University of California Davis, for project coordinating with all parties of the study.
Author Contributions
The authors confirm contribution to the paper as follows: study conception and design: T. Gamage, A. Jenn, G. Tal; data collection: T. Gamage; analysis and interpretation of results: T. Gamage, A. Jenn, G. Tal; draft manuscript preparation: T. Gamage. All authors reviewed the results and approved the final version of the manuscript.
Declaration of Conflicting Interests
The author(s) declared no potential conflicts of interest with respect to the research, authorship, and/or publication of this article.
Funding
The author(s) disclosed receipt of the following financial support for the research, authorship, and/or publication of this article: The authors received financial support for the research, authorship, and/or publication from the California Department of Transportation.