
Abstract
The introduction of electric mobility solutions mitigates transportion-related greenhouse gas emissions. Transit buses are considered a promising candidate for electrification. This study contributes to the growing literature on battery-electric buses (BEBs) and aims to quantify the optimal allocation of BEB infrastructure and charging schedules. A generic model for the charging capacity and scheduling of the BEB network is developed. The proposed model proposes an algorithm for the calculation of trip-level BEB energy consumption based on a surrogate model-based space mapping algorithm. Instead of using vehicle simulators or constant values for the energy consumption rate for each trip, the input space mapping has been applied to a simple coarse model to build an accurate surrogate model. The proposed algorithm is tested on the bus transit network in Belleville City in Canada considering BEBs using both Flash and Opportunity charging. The results show the efficiency of the proposed model and highlight the impact on the optimization results of calculating the trip-level energy consumption compared with the traditional methods.
Keywords
Recent population growth is leading to an increased demand for transportation services in many countries ( 1 , 2 ). In response to such growth, the transportation industry contributes 24% of the global greenhouse gas (GHG) emissions ( 3 ). In Canada, the transportation sector accounts for a major share (25%) of Canadian GHG emissions ( 4 ).
The electrification of the transportation sector is seen as a promising solution to significantly reduce GHG emissions. Typically, GHG emissions are quantified across two stages: well-to-tank and tank-to-wheel emissions ( 5 ). The first is addressed by utilizing renewable energy resources ( 6 ), while for the latter, the adoption of electric mobility can significantly reduce tank-to-wheel GHG emissions. The results of a study by Mahmoud et al. ( 5 ) indicate that the total GHG emissions will decrease significantly through the use of renewable electric sources coupled with electrified transportation modes.
Unlike personal vehicles, there are many features in public transit networks that facilitate full electrification. Fixed routes, shared infrastructure, timely operation, and predetermined schedules allow bus networks to transition smoothly toward electrification ( 7 ). Further, the technology of the battery-electric bus (BEB), including energy storage, direct chargers, onboard batteries, and electric motors, have been developing rapidly in the past few years ( 5 , 8 , 9 ).
However, in the design process of electric bus transit networks, the limited driving range and/or availability (defined as the ratio between the charging and operation time) of BEBs are considered the main challenges. To overcome this issue, a sufficient power supply throughout operation must be available. In this respect, several methods are proposed to address this problem, such as battery exchange, wireless charging, and onboard battery charging ( 5 ). According to the highlighted disadvantages of battery exchange and wireless charging schemes ( 5 , 10 ), an onboard battery charging scheme is considered the best way for electric bus systems.
The onboard battery charging system for BEBs is available in three types: flash, opportunity, and overnight. The trade-off between the charger’s power, charging time, and battery size is the main difference between these three charging concepts. Flash and Opportunity BEBs charge during the recovery time between trips, and they often feature fast chargers and a smaller battery capacity ( 9 ), while the Overnight BEBs charge at the end of operation schedule, which often require a larger battery capacity. The main differences between Flash and Opportunity charging concepts are the charger rated power (higher in Flash) and the bus battery capacity (higher in Opportunity). Previous studies indicated an increased fleet size associated with Overnight BEBs ( 6 ). Thus, several calls are made to optimize Flash and Opportunity BEB infrastructure allocation to reduce the total operating costs.
Several optimization models aimed at minimizing the infrastructure and operation costs of BEBs have been developed, such as the works presented in Table 1. These studies estimated BEB energy consumption through different models. However, as detailed in Table 1, previous studies fall short in accommodating a trip-specific energy calculation model. In other words, their energy calculation is either constant with a linear function based on Newton’s second law of motion, or predetermined based on energy simulation models. Both approaches fail to account for various parameters that affect the energy consumption of BEBs at the trip-level.
A Sample of Battery-Electric Bus (BEB) Optimization Studies in the Literature
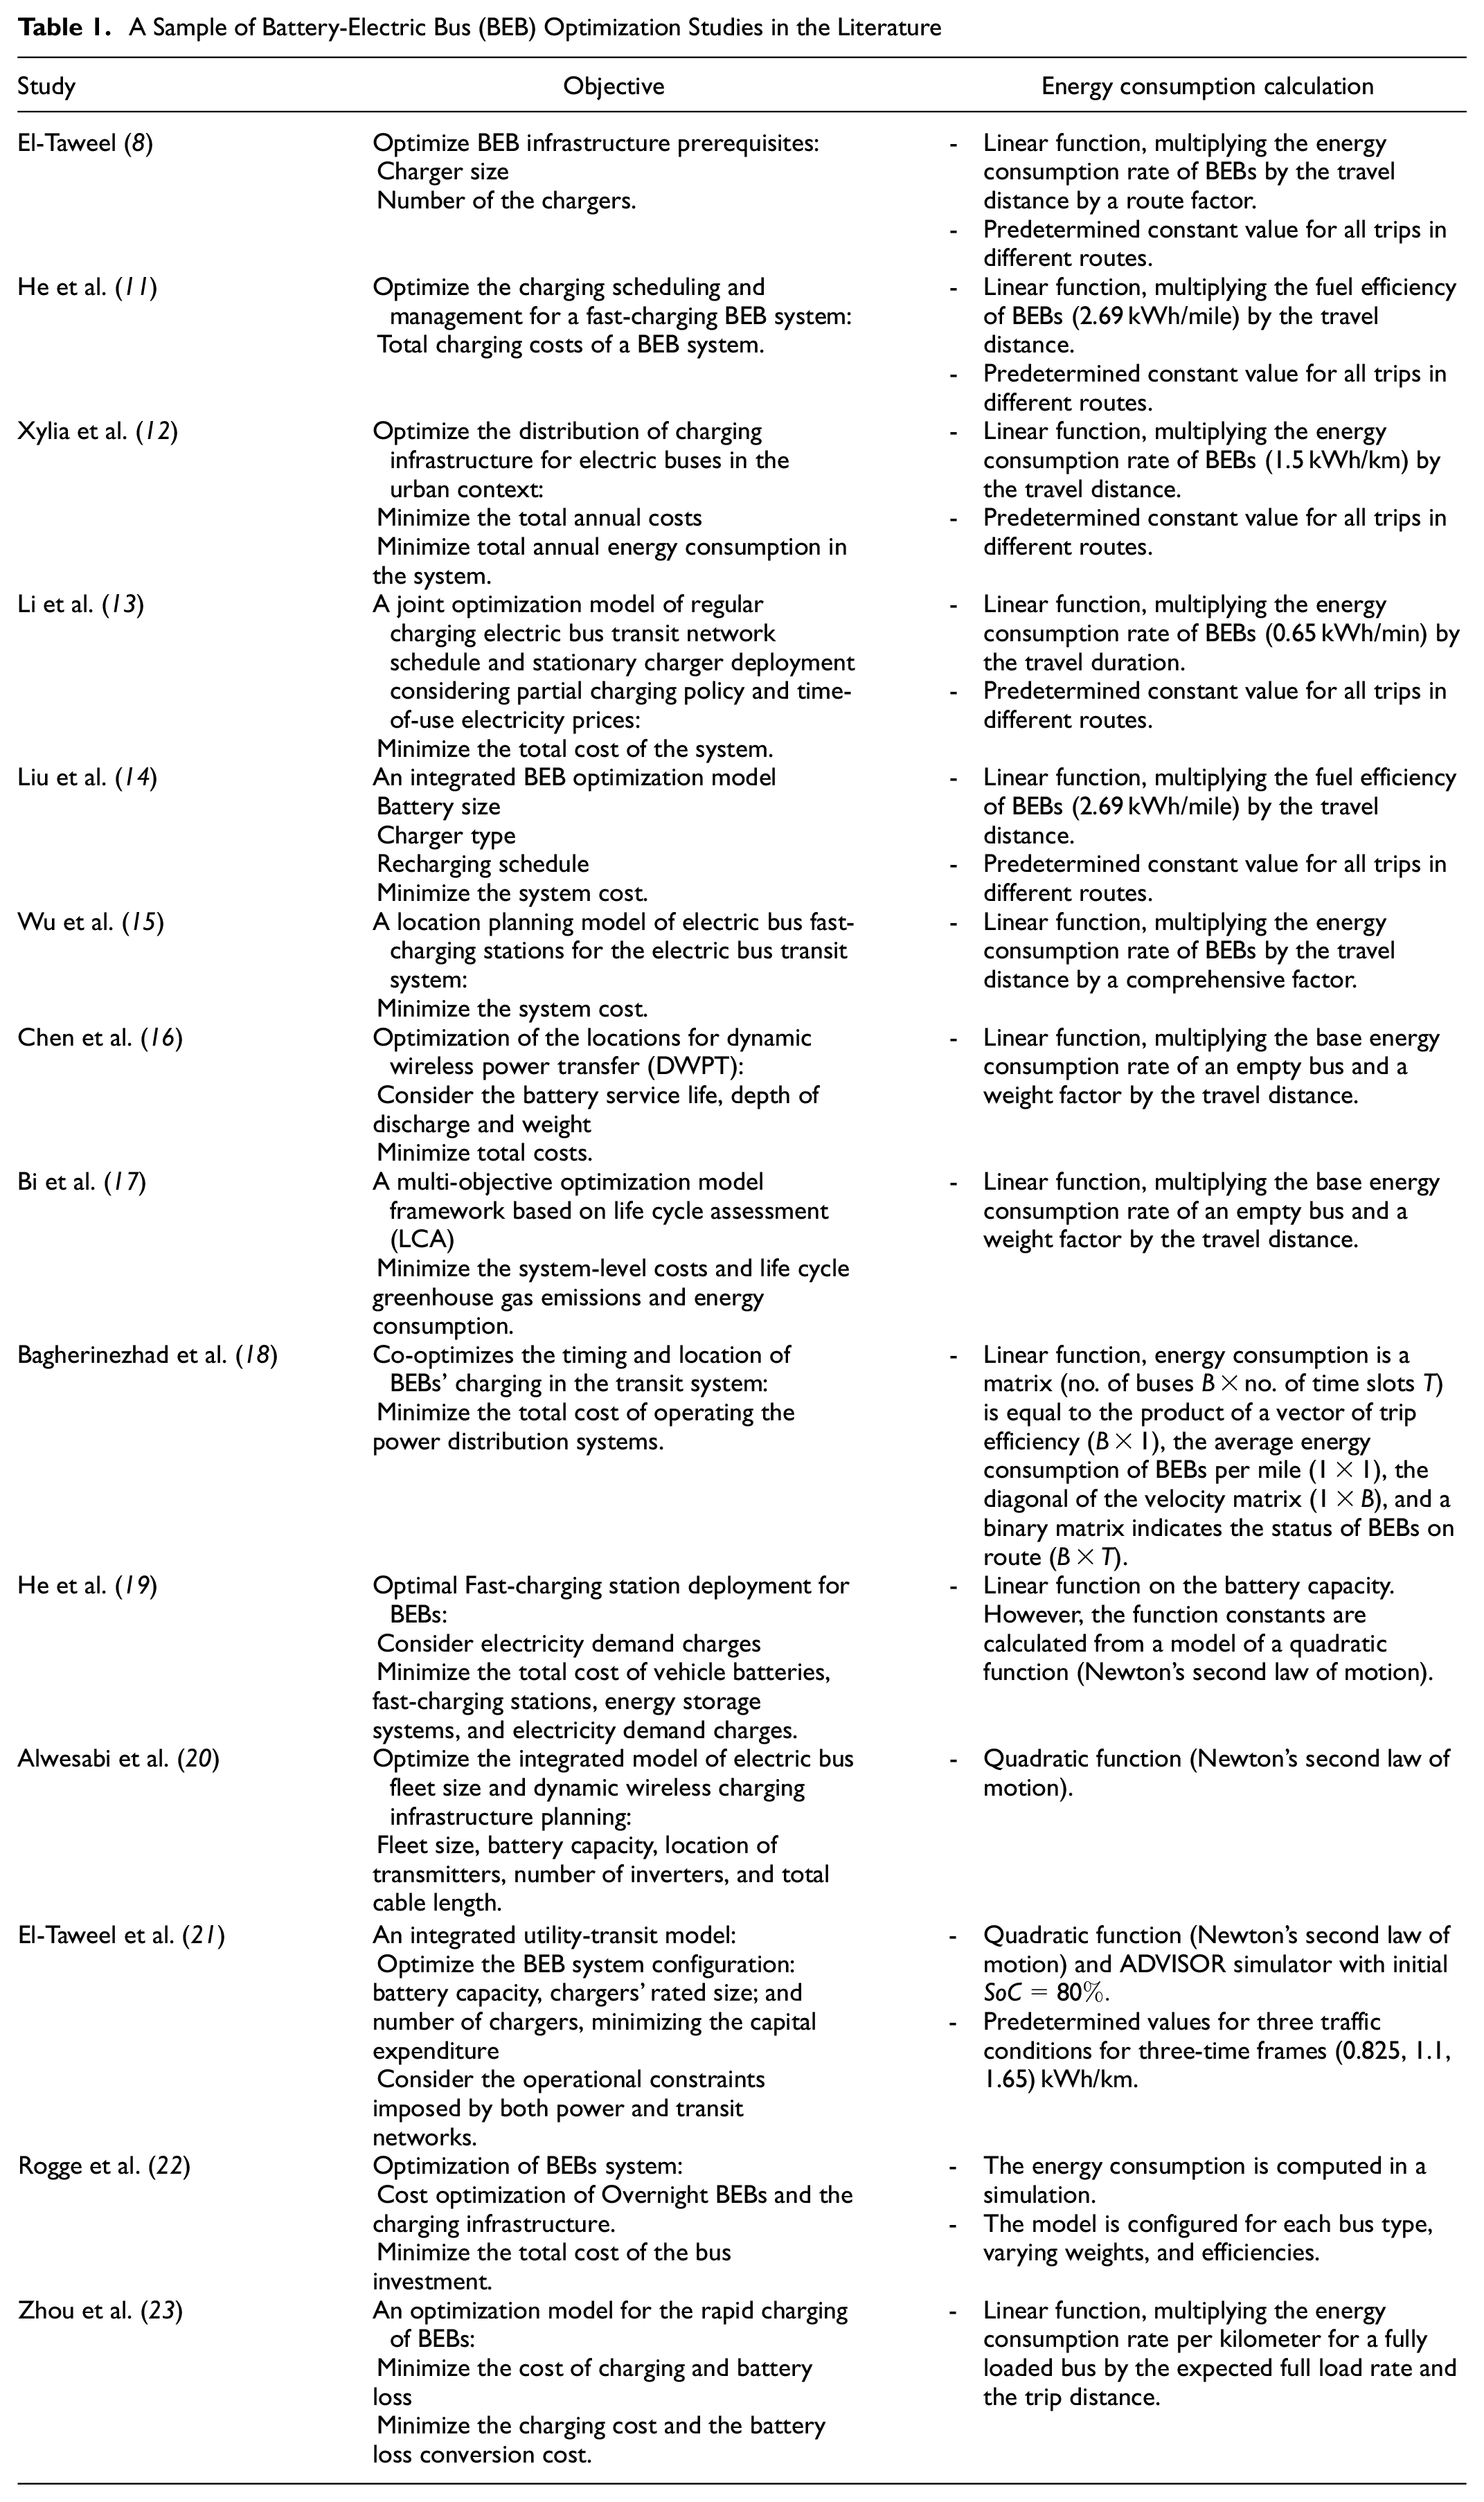
For example, He et al. ( 11 ) and Xylia et al. ( 12 ) assume that the energy consumption rate is a constant value for all trips in different routes and calculate trip-level energy consumption by multiplying the energy consumption rate by the trip distance. Li et al. ( 13 ) follow the same procedure, but estimate the trip-level energy consumption rate as a factor of operation time.
The second procedure to estimate the trip-level energy consumption is a linear function equal to the product of a predetermined constant energy consumption rate, route length, and a compensating factor (7, 11, 14–18, 22). This factor varies between studies as presented in Table 1. The models in He et al. ( 19 ) and Alwesabi et al. ( 20 ) used Newton’s second law of motion in estimating the energy consumption rate. El-Taweel et al. ( 21 ) and Rogge et al. ( 22 ) used simulators to enhance their estimated energy consumption value by considering more related parameters. To that end, all these procedures estimate the trip-level energy consumption as a predefined constant value.
However, these efforts fall short in providing a high-resolution, dynamic, and trip-specific estimation of BEBs’ energy consumption during operation. Recent works indicated that BEBs’ energy consumption is very sensitive to operational (e.g., speed and traffic), vehicular (e.g., battery status of charge and mass), topographic (e.g., road grade), and external factors (e.g., ambient temperature and heat, ventilation, and air conditioning [HVAC]) ( 24 , 25 ).
Therefore, there are valid concerns about the utilization of constant BEB energy consumption rates for the optimization of BEB infrastructure. In this respect, the present study proposes a novel model that integrates a surrogate model-based space mapping (SMSM) algorithm and Advanced Vehicle Simulator (ADVISOR) to optimize BEB infrastructure and operational costs in transit while considering the varied BEB energy consumption at the trip level.
First, ADVISOR MATLAB/Simulink environment is considered an accurate tool for simulating BEB conduct ( 25 , 26 ). ADVISOR was first developed by the National Renewable Energy Laboratory (NREL). ADVISOR offers a user-friendly, flexible, yet robust analytic package for advanced vehicle modeling. In the BEB context, ADVISOR estimates the energy consumption rate using vehicular parameters (e.g., vehicle configuration), trip parameters (e.g., speed profile), route parameters (e.g., grade and topography), and external parameters (e.g., drag coefficient, rolling resistance, HVAC) ( 27 ). Although ADVISOR is documented to provide accurate energy consumption results, each simulation takes a relatively long time, and the model is complex, which hinders its use in optimization models ( 24 ).
Second, the SMSM algorithm offers several advantages to overcome this issue. It incorporates two different optimization approaches: space mapping optimization and surrogate-based optimization ( 28 ). Both approaches are used to optimize accurate and time-intensive models efficiently. The space mapping model uses a less accurate but rapid coarse model. In contrast, the surrogate-based optimization exploits an approximate model by iteratively solving the original design problem. In essence, the SMSM algorithm combines the two approaches to optimize a precise but time-consuming model efficiently. The accuracy of the SMSM algorithm is enhanced in each iteration through the fine model (ADVISOR simulation) ( 29 ).
The contribution of this paper is to propose a novel general mathematical model to optimize the configurations of the BEB system in transit, including the capacity of the onboard battery, the size and power of the chargers, the number of chargers, and the BEB charging schedules. The proposed optimization model is tested using two different charging schemes, Flash and Opportunity, with different battery capacities and charger rated power, and carried out on the bus transit network of Belleville City, Canada.
After this brief introduction, the remainder of the study is structured as follows. The proposed optimization model is outlined in the second section, which describes the proposed infrastructure and operation optimization model, the SMSM algorithm to calculate the energy consumption rate for every trip, and the methodology used to solve the proposed model. The third section illustrates the case study analysis, which is followed by the results section. Lastly, the conclusion and summary of the contributions are highlighted in the final section.
Model Formulation
Model Objective Function
In general, an electric bus transit network can be described by a set of BEBs
The model’s objective is to minimize the infrastructure and operation costs. The decision variables are: the number of chargers

The operation cost

The charger expenditure cost
The objective function for the optimum infrastructure allocation and operation cost is presented in Equations 1 and 2 as follows:

All costs are calculated in U.S. dollars ($). Although the goal is to keep the cost to a minimum, several restrictions are needed. The constraints of the optimization model are outlined in the following subsections.
Model Constraints
Battery State of Charge
The onboard battery has a status of charge (SoC) that should keep the battery life long and avoid limp problems. The battery should normally not be released below the capacity of the minimum state of charge limit,

Similarly, Equation 5 states that the departure state of charge

The SoC calculation begins with an initial value assumed as

Energy consumption rate
The SoC after trip

where

When the bus leaves from the charging station for

Charging Time
All buses between trips have recovery time

Number of Buses Charging at the Same Time
Given that buses share charging stations, there is a possibility during the schedule that more than one bus will be in the charging station at the same time. The number of buses charging instantly should not exceed the available number of chargers for all time slots

Charger Power
The power of the charger is limited by the specifications of chargers available in the market. Thus, in Equation 12, minimum

Number of Chargers
To alleviate the impact of BEBs on the utility grid, the number of chargers per charging station is capped, as illustrated in Equation 13.

In a nutshell, the model is expressed under the constraints in Equations 4–13 as a mixed-integer programming problem with the objective function described in Equation 3. To simplify the model to integer linear programming, the charger rated power takes two values, which reflect Flash and Opportunity charging concepts.
Energy Consumption SMSM Algorithm
One of the important parameters calculated in the proposed model is the BEB energy consumption for every trip. The energy consumption of every trip
To calculate an accurate
Fine Model
In this study, the fine model to calculate the energy consumption rate is the ADVISOR model. This model was created in the MATLAB/Simulink environment. MATLAB provides an easy-to-use matrix-based programming environment for performing calculations, while Simulink can be used to represent complex systems graphically using block diagrams.
The user provides the data of the bus, the route, and the trip. This data inventory describes every parameter related to the energy consumption rate during the trip, such as the mass of the bus, the estimated number of passengers, the average velocity during the trip, number of stops in the route, the routing topology, the driver behavior, HVAC, and departure state of charge of the bus battery
To overcome the complexity and the long estimation time for the ADVISOR model, the SMSM algorithm was used to generate a surrogate model. The surrogate model is generated by using input space mapping (ISM). ISM is used to enhance a simple coarse model presented in the following subsection. However, in this study the ADVISOR simulator is used in two steps. The first step is using the ADVISOR simulator to estimate the constant energy consumption rate in the base model for every route. The second use is to calculate the coarse model constants and update the ISM parameters (
Coarse Model
The data required on the route and bus for the energy consumption rate are realized in advance. However, the parameter that depends on the decision taken during the schedule is the departure SoC,

where
Surrogate Model
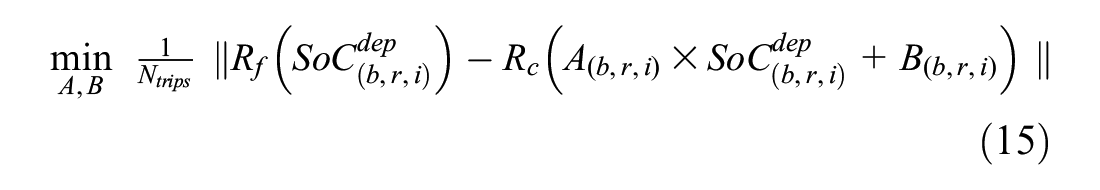
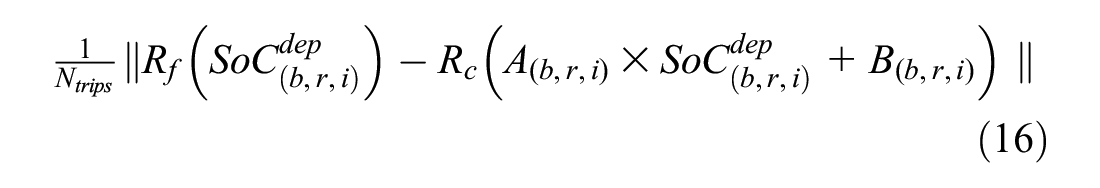
ISM is used to modify the coarse model presented in Equation 14.
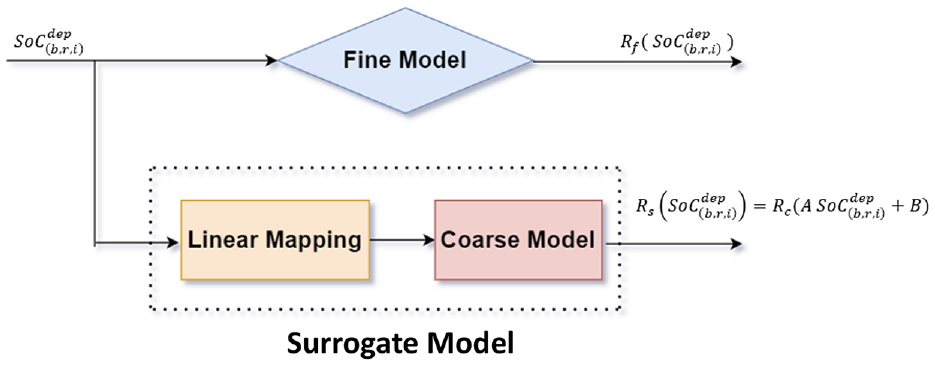
Input space mapping.
The linear ISM ensures that the model is still mixed-integer linear programming.
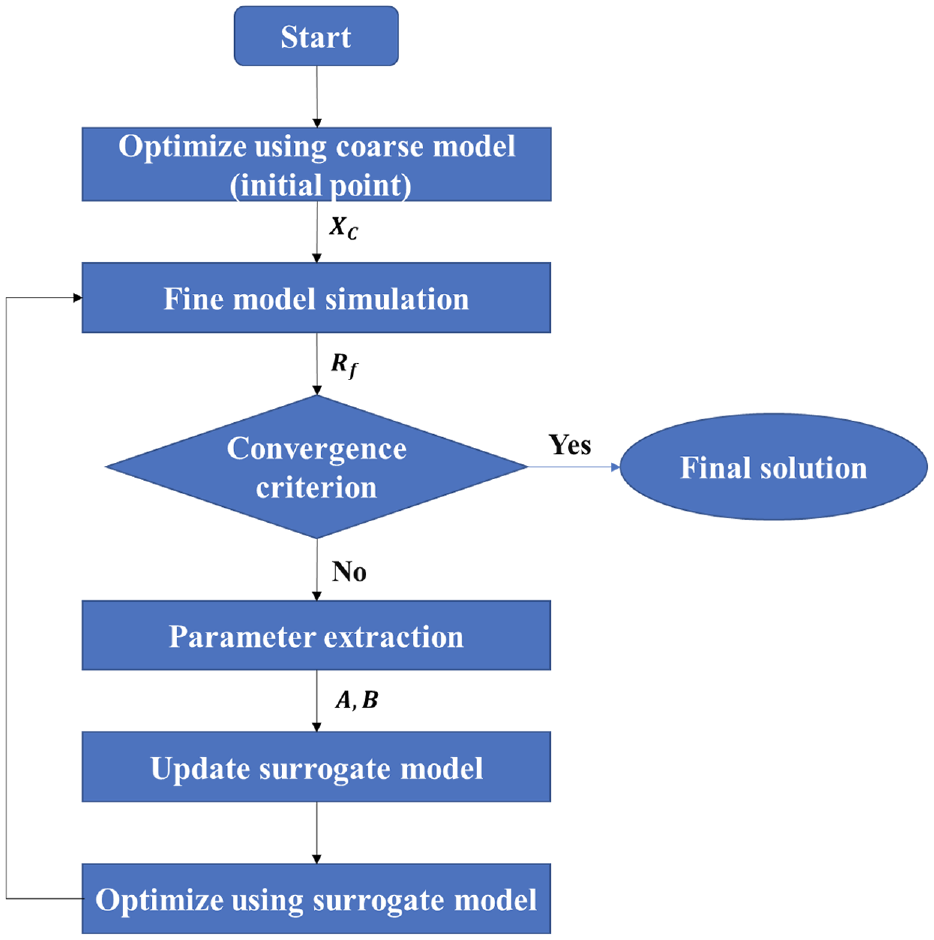
Surrogate model-based space mapping (SMSM) algorithm.
Algorithm 1
Case Study
Building on the authors’ previous BEB research ( 7 , 8 , 21 ), Belleville City in Ontario, Canada, is selected as the case study for this study. In short, the network includes 11 buses operating nine routes. The network follows a central station hub-and-spoke model.
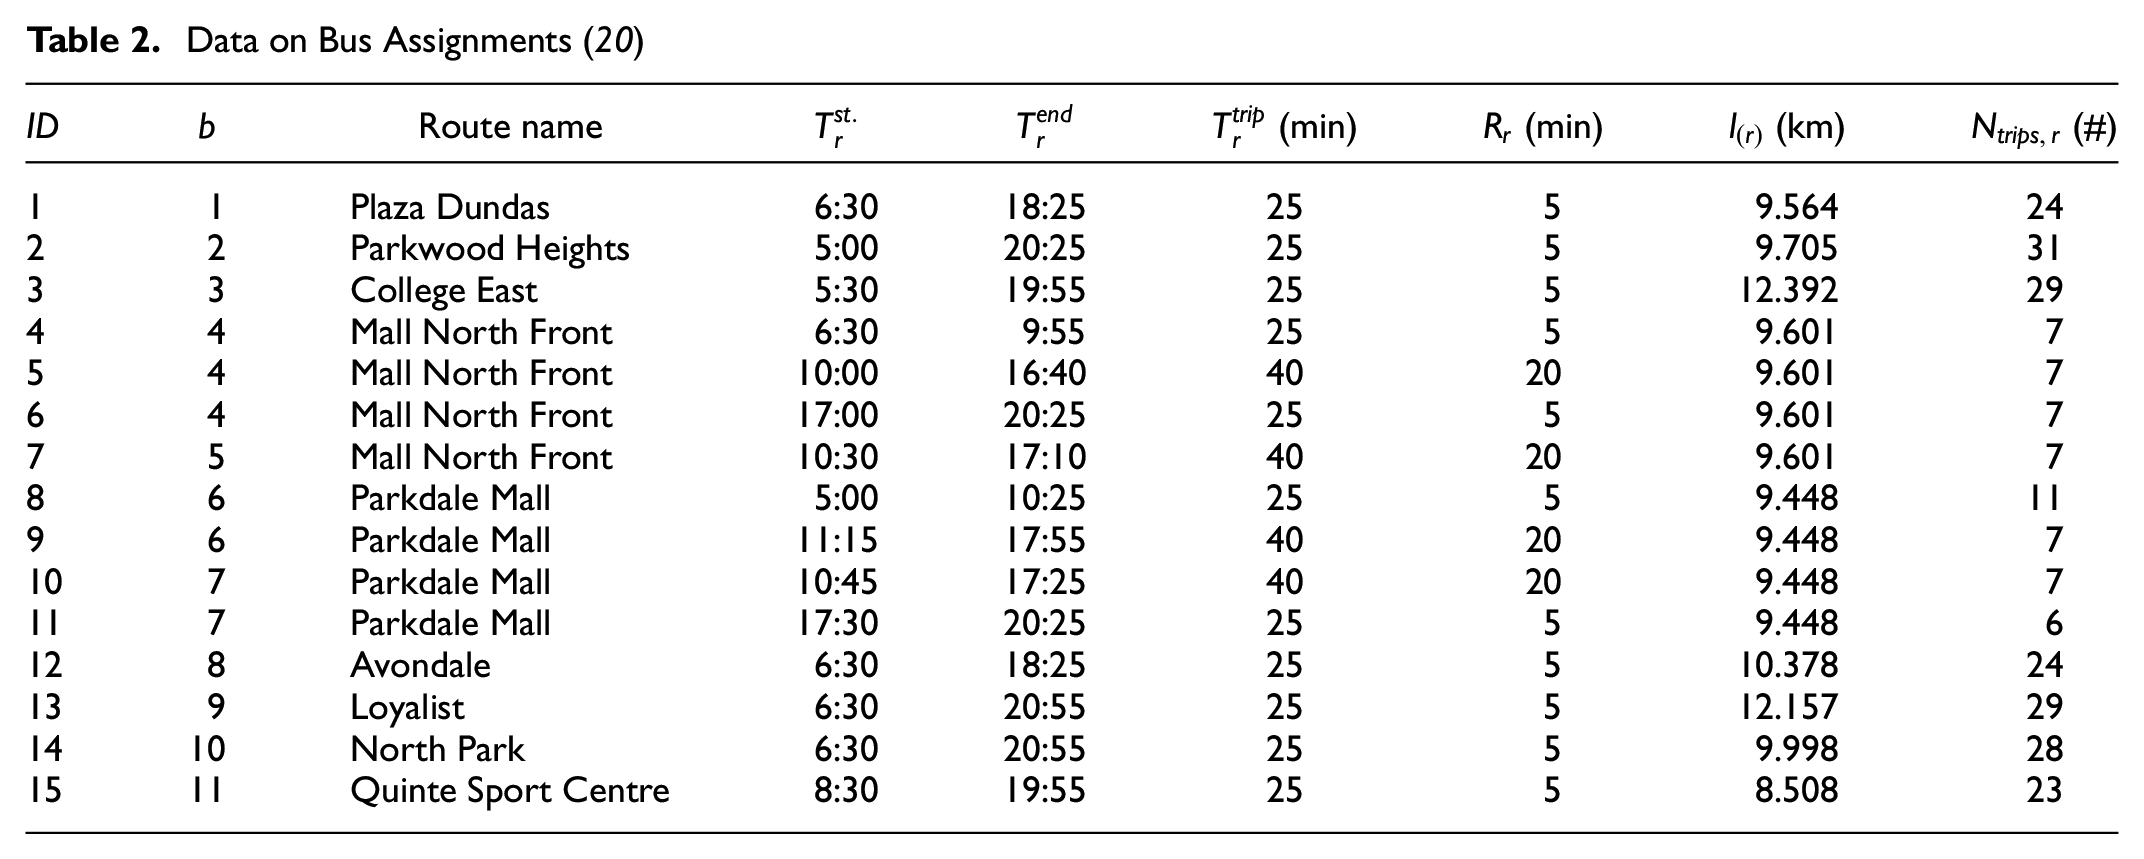
Table 2 illustrates, for every route
Data on Bus Assignments ( 20 )
Model Parameters
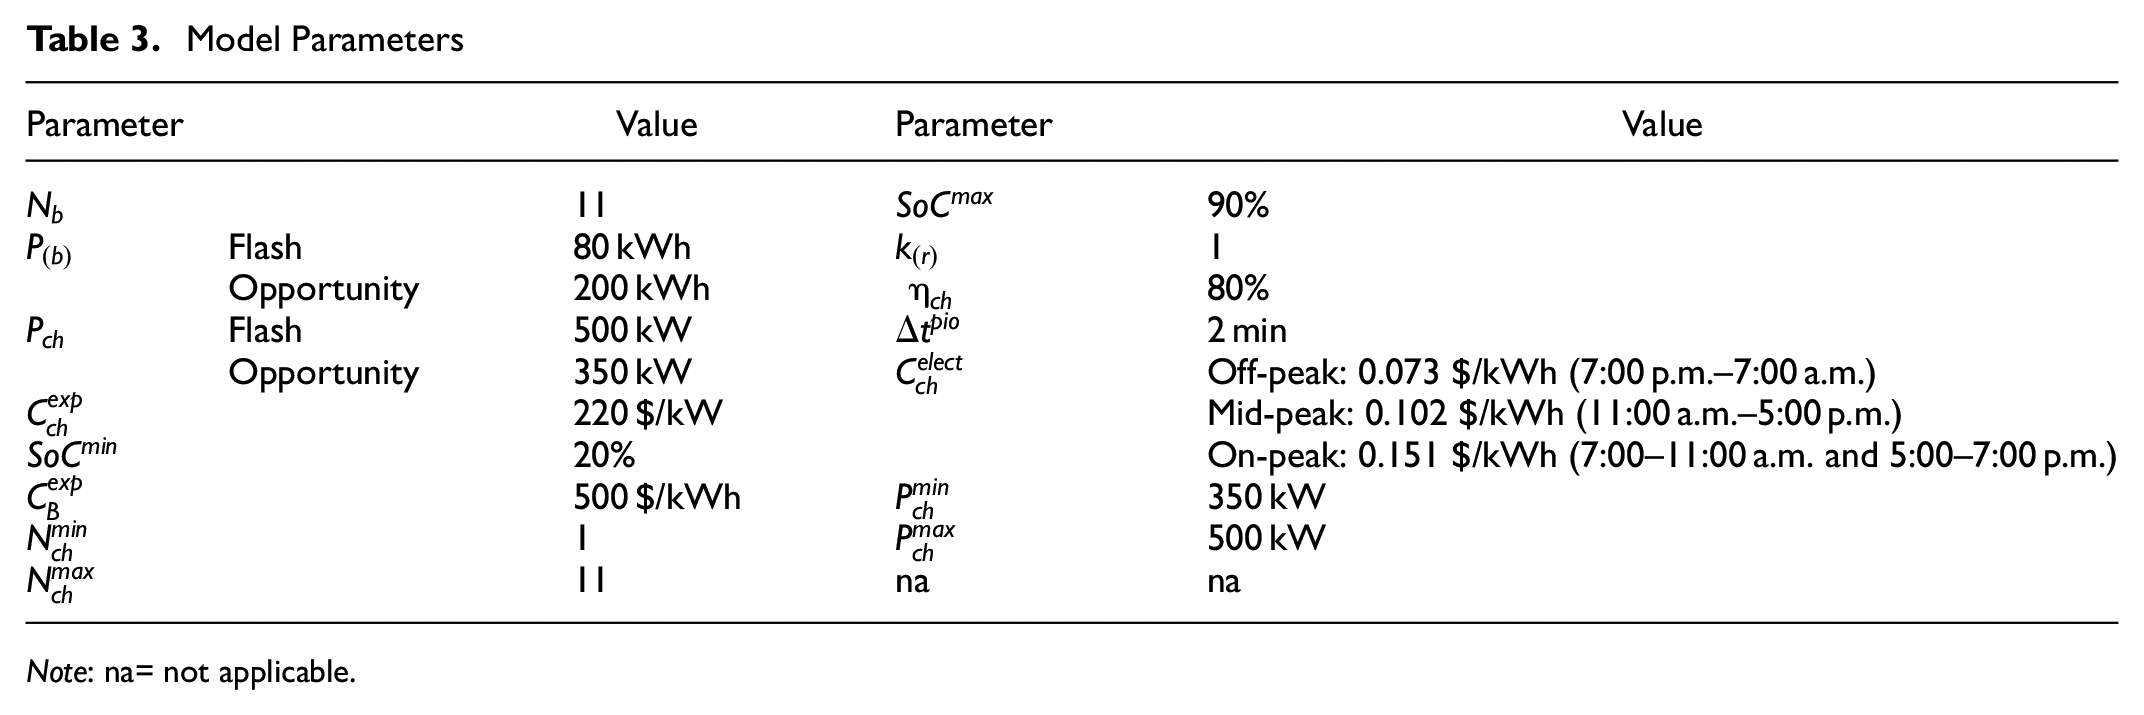
Note: na= not applicable.
The parameter values for the tested BEB models are outlined in Table 3. The number of buses is the same as the current diesel fleet. If the solution to the problem is infeasible, the number of buses will be increased by one for each iteration. The electricity rates in Ontario, Canada used are for a winter weekday based on the ToU as published by the Ontario Energy Board website ( 30 ) and these rates converted to U.S. dollars ($1 USD = $1.17 CAD). The charger cost reflects the market values and includes the unit, maintenance, and installation costs. The charger lifetime is assumed to be 12 years.
Further, the selected battery capacity and charger rated power values are suited to model Flash and Opportunity charging concepts (8). The Proterra-E40 ( 31 ) and the New Flyer-XE40 ( 32 ) buses are assumed for all routes in the Flash and Opportunity charging concepts, respectively.
Three different speed profiles were utilized in ADVISOR for the routes in the case study to simulate the bus behavior during all trips. This is to overcome the high-resolution speed profiles data for Belleville (and for most transit networks in general) being unavailable. The rationale for using three speed profiles of the routes instead of one is the nature of the routes and the service areas (e.g., road speed limit, route length, and daily traffic condition). Routes in Belleville City are classified according to their average speed into three categories: local, collector, and express routes. The Orange County Bus Cycle (OCC) speed profile in ADVISOR is used to simulate the behavior of buses in College East and Loyalist routes (express route). The BUSRTE speed profile in ADVISOR is used to represent the behavior of buses in the Quinte Sport Centre route (local route), and finally, the MANHATTAN speed profile is used to simulate other routes. The three speed profiles are described in Figure 3 ( 33 ).
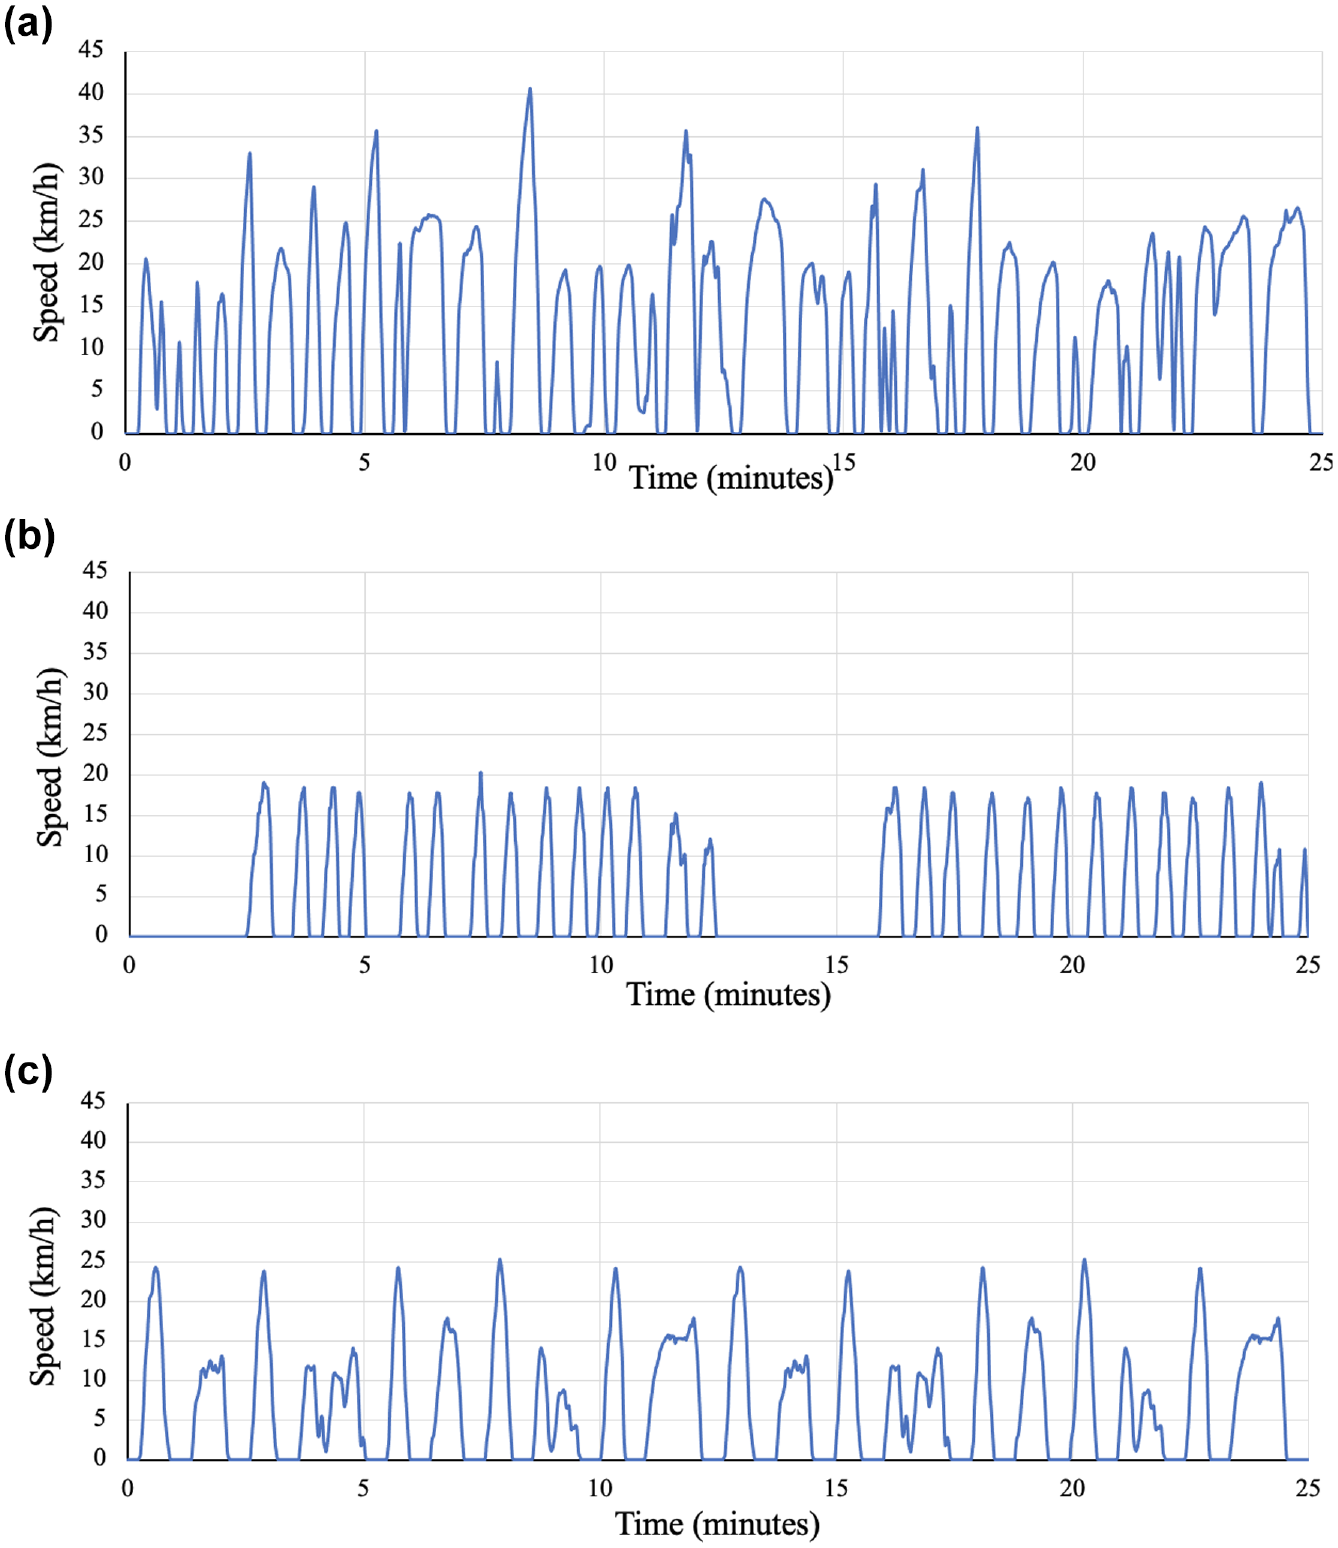
Speed profiles: (a) Orange County Cycle (OCC), (b) BUSRTE Cycle, and (c) MANHATTAN Cycle.
Results
The proposed model is solved twice to highlight the effectiveness of the proposed SMSM algorithm in calculating the energy consumption rate. First, a constant trip energy consumption rate model is estimated (base model), then the model is solved using the proposed SMSM algorithm for calculating the trip energy consumption rate.
The proposed model is solved for a typical weekday. The model is coded on MATLAB and solved by Gurobi interface for MATLAB. The model is solved on a 4.2 GHz computer with 16 GB of RAM and 0.01% relative optimality gap.
Base Model: Constant Energy Consumption
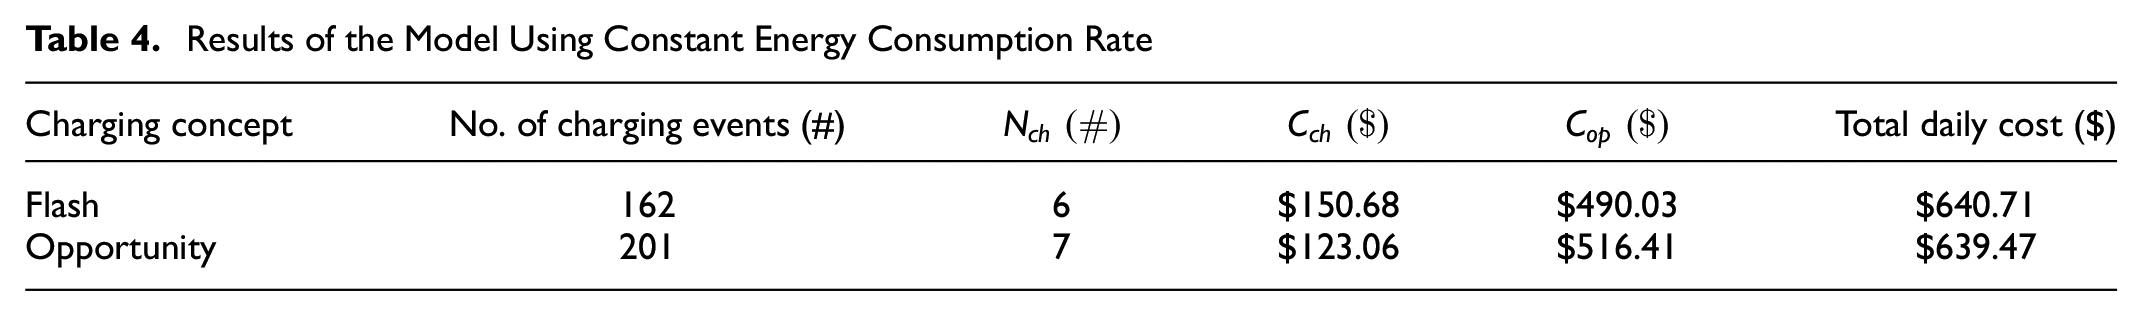
For the base model, constant energy consumption values are utilized for all trips. The values of the constant energy consumption rates for Flash BEB (Proterra) are 1.3019, 1.7032, and 1.53 kWh/km for OCC, BUSRTE, and Manhattan cycles, respectively. For the Opportunity BEB (New Flyer), the energy consumption rates are 1.4899, 1.9449, and 1.7662 kWh/km for OCC, BUSRTE, and Manhattan cycles, respectively. These values are derived from the ADVISOR fine model.
The results of the base model, described in Table 4, indicate that a Flash BEB system will require six chargers that will be utilized for 162 charging events with a total daily cost of $640.71. The Opportunity BEB system will require seven chargers, 201 charging events, and incur a total daily cost of $639.47.
SMSM Model: Trip-Specific Energy Consumption
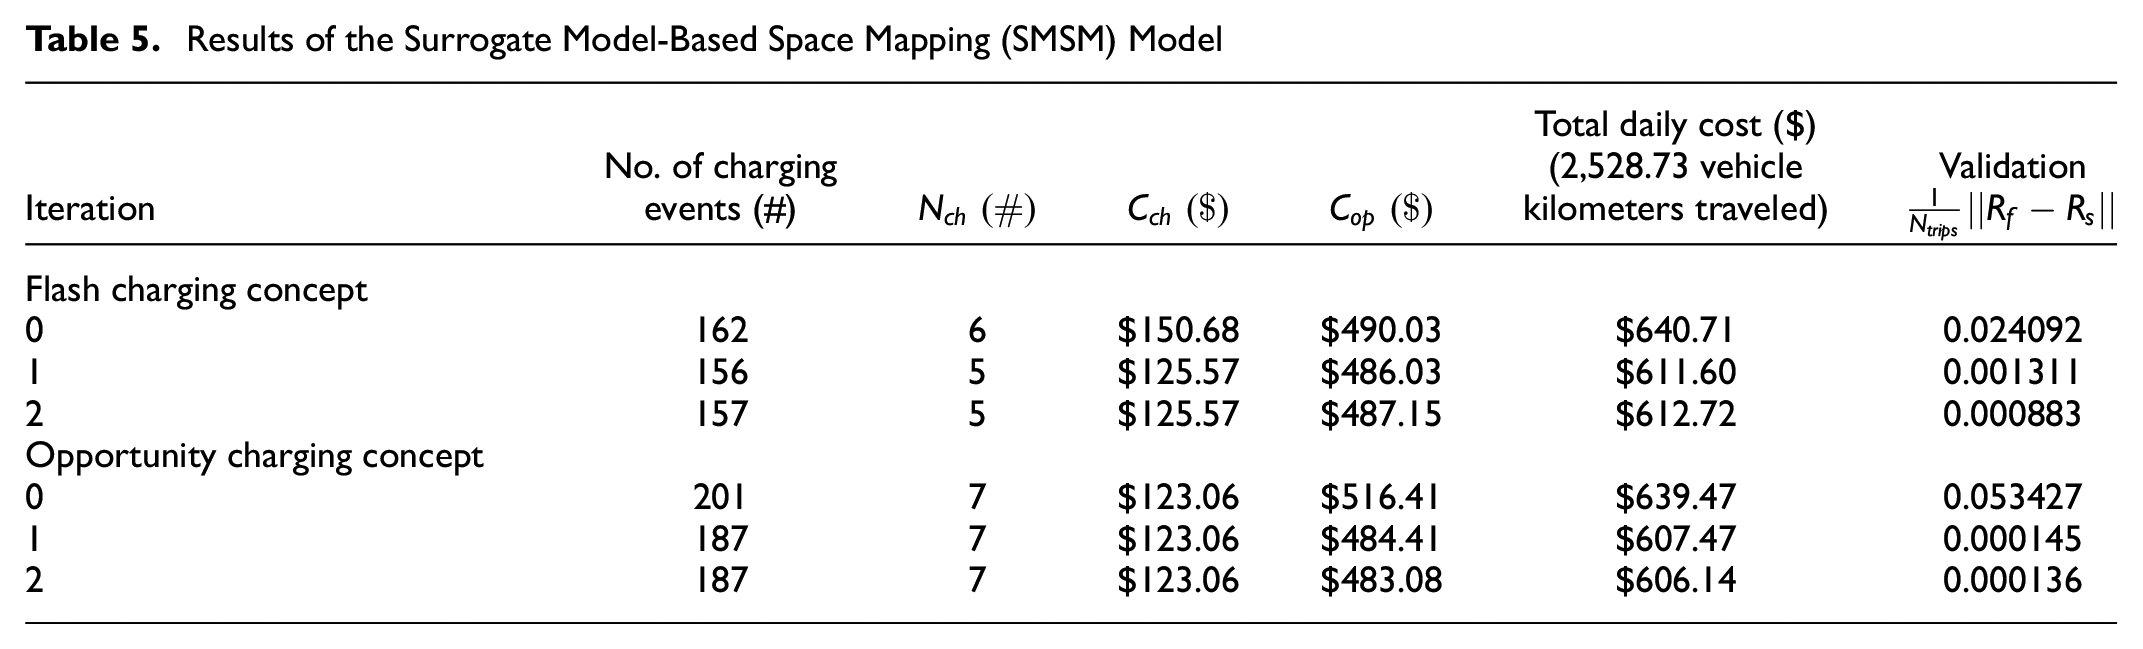
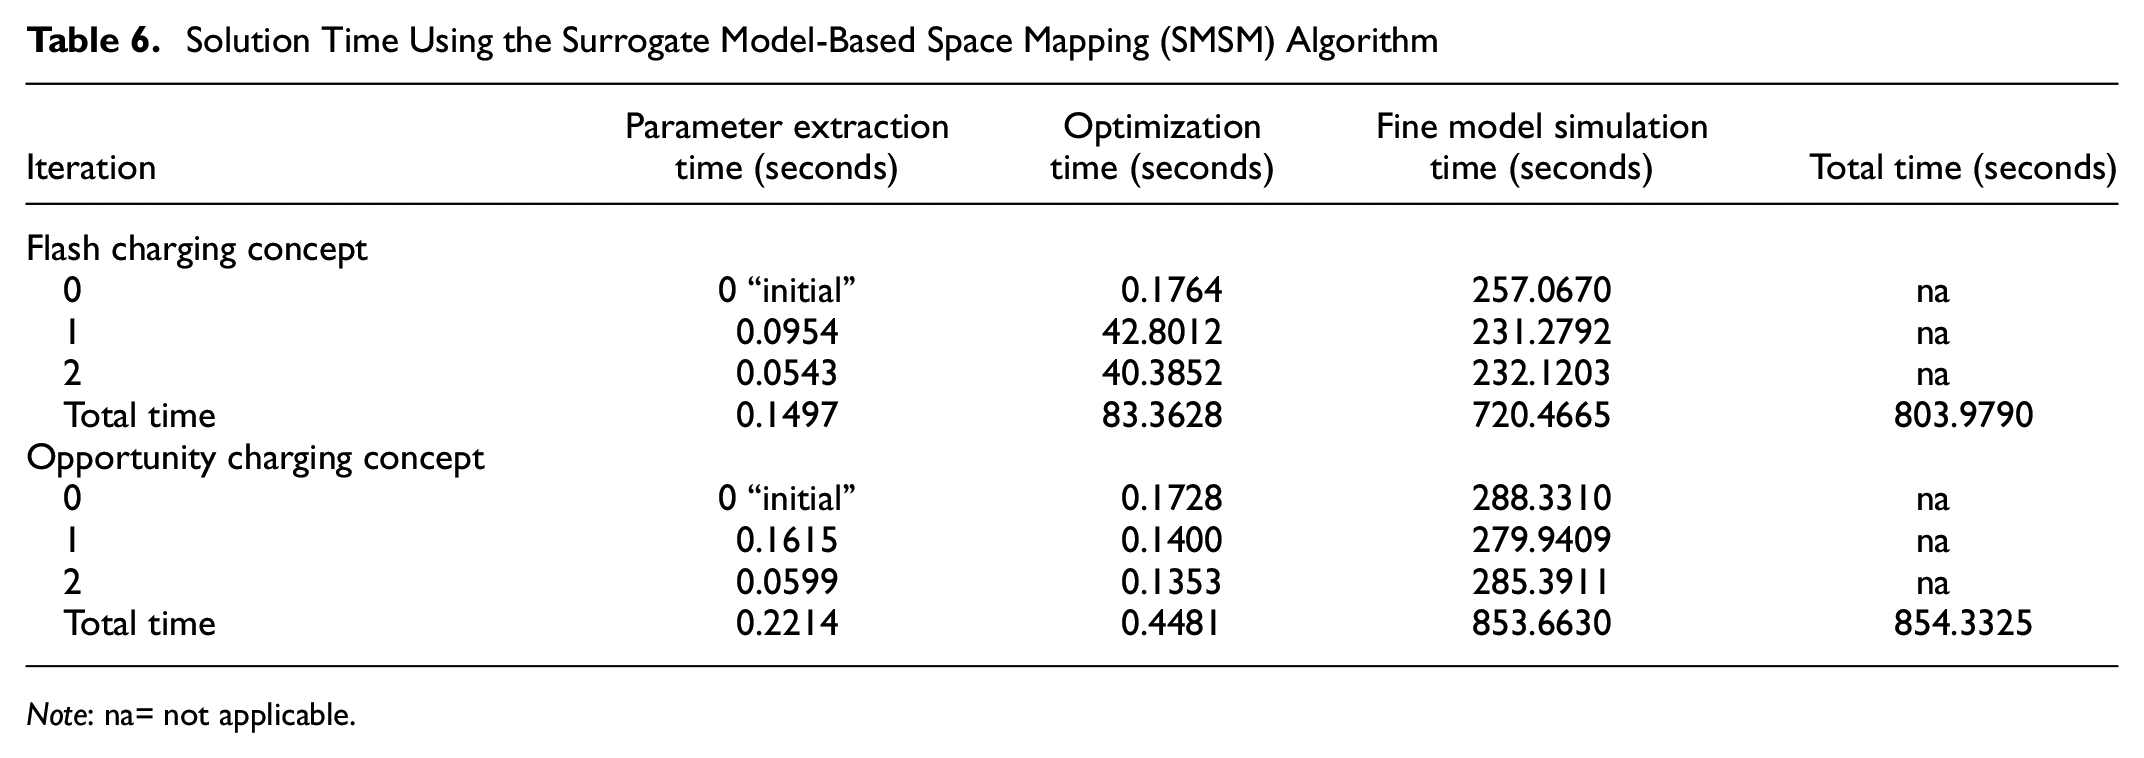
Algorithm 1 is applied to solve the case study presented in the previous section. The parameter extraction problem in the SMSM algorithm is solved using the MATLAB particle swarm algorithm function. The results of the proposed model using the SMSM algorithm to calculate the energy consumption rate are described for Flash and Opportunity charging concepts in Tables 5 and 6.
Results of the Model Using Constant Energy Consumption Rate
Results of the Surrogate Model-Based Space Mapping (SMSM) Model
Solution Time Using the Surrogate Model-Based Space Mapping (SMSM) Algorithm
Note: na= not applicable.
Total Costs Using Two Net Present Value Assumptions
Note: SMSM = surrogate model-based space mapping.
The results show that the optimal solution was reached by only three ADVISOR simulations in the two charging concepts. The validation value in iteration 2 illustrates that the surrogate model provides an accurate approximation of the energy consumption rate for all 247 trips in the case study.
For the two charging concepts, in Table 5, iteration 0 is the base model scenario. The validation value in this iteration, in the two charging concepts, is relatively high. This value illustrates that the energy consumption rate for the trips in the base model is different from the accurate values using ADVISOR. After two iterations using the proposed SMSM algorithm, the validation value is minimized. This value indicates that the surrogate model response matches the ADVISOR response in calculating the trip energy consumption rate.
The optimal total daily cost using the SMSM algorithm in the two charging scenarios is less than the base model. The Flash BEB system requires five chargers with a total daily cost of $612.72. In comparison, the Opportunity BEB system requires seven chargers with a total daily cost of $606.14.
Models Comparison
State of Charge
Figure 4 describes Bus 1 battery SoC during the daily operation for the two charging concepts. The figure illustrates that the error of the bus SoC between the surrogate model and the ADVISOR is very small. The cumulative errors in the SoC at the end of daily operation for Bus 1 are 3.7% and 1.4% of the Flash and Opportunity charging concepts, respectively.
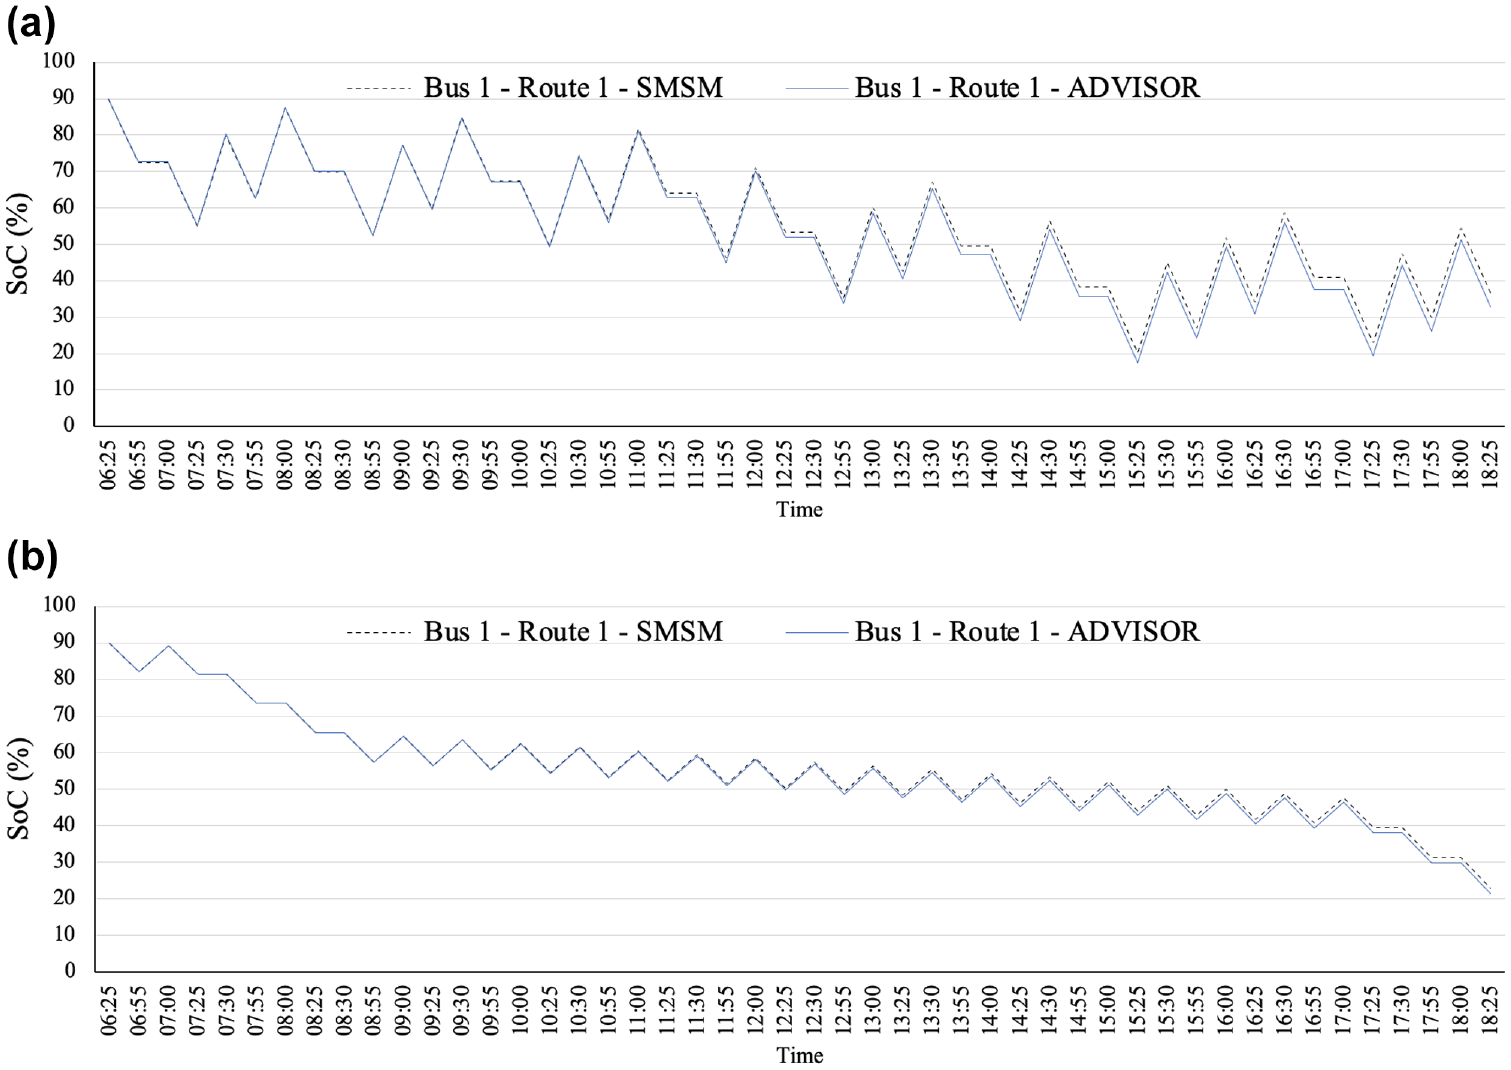
Bus 1: state of battery charge: (a) Flash charging concept, (b) Opportunity charging concept.
For the trip-level energy consumption in the proposed surrogate model and considering Bus 1 as an example, the trip energy consumption varies from
Total power load
The total energy demand on the charging station is described in Figure 5 for the two charging concepts in the two models. This is estimated for each five minutes interval and aggregated for all charging outlets. The figure indicates that buses mostly charge during off-peak and mid-peak periods. This is because of the high cost of on-peak electricity rates. In addition to the reduced charging cost, off- and mid-peak charging reduce the impacts of the electrification of bus transit networks on the utility grid.
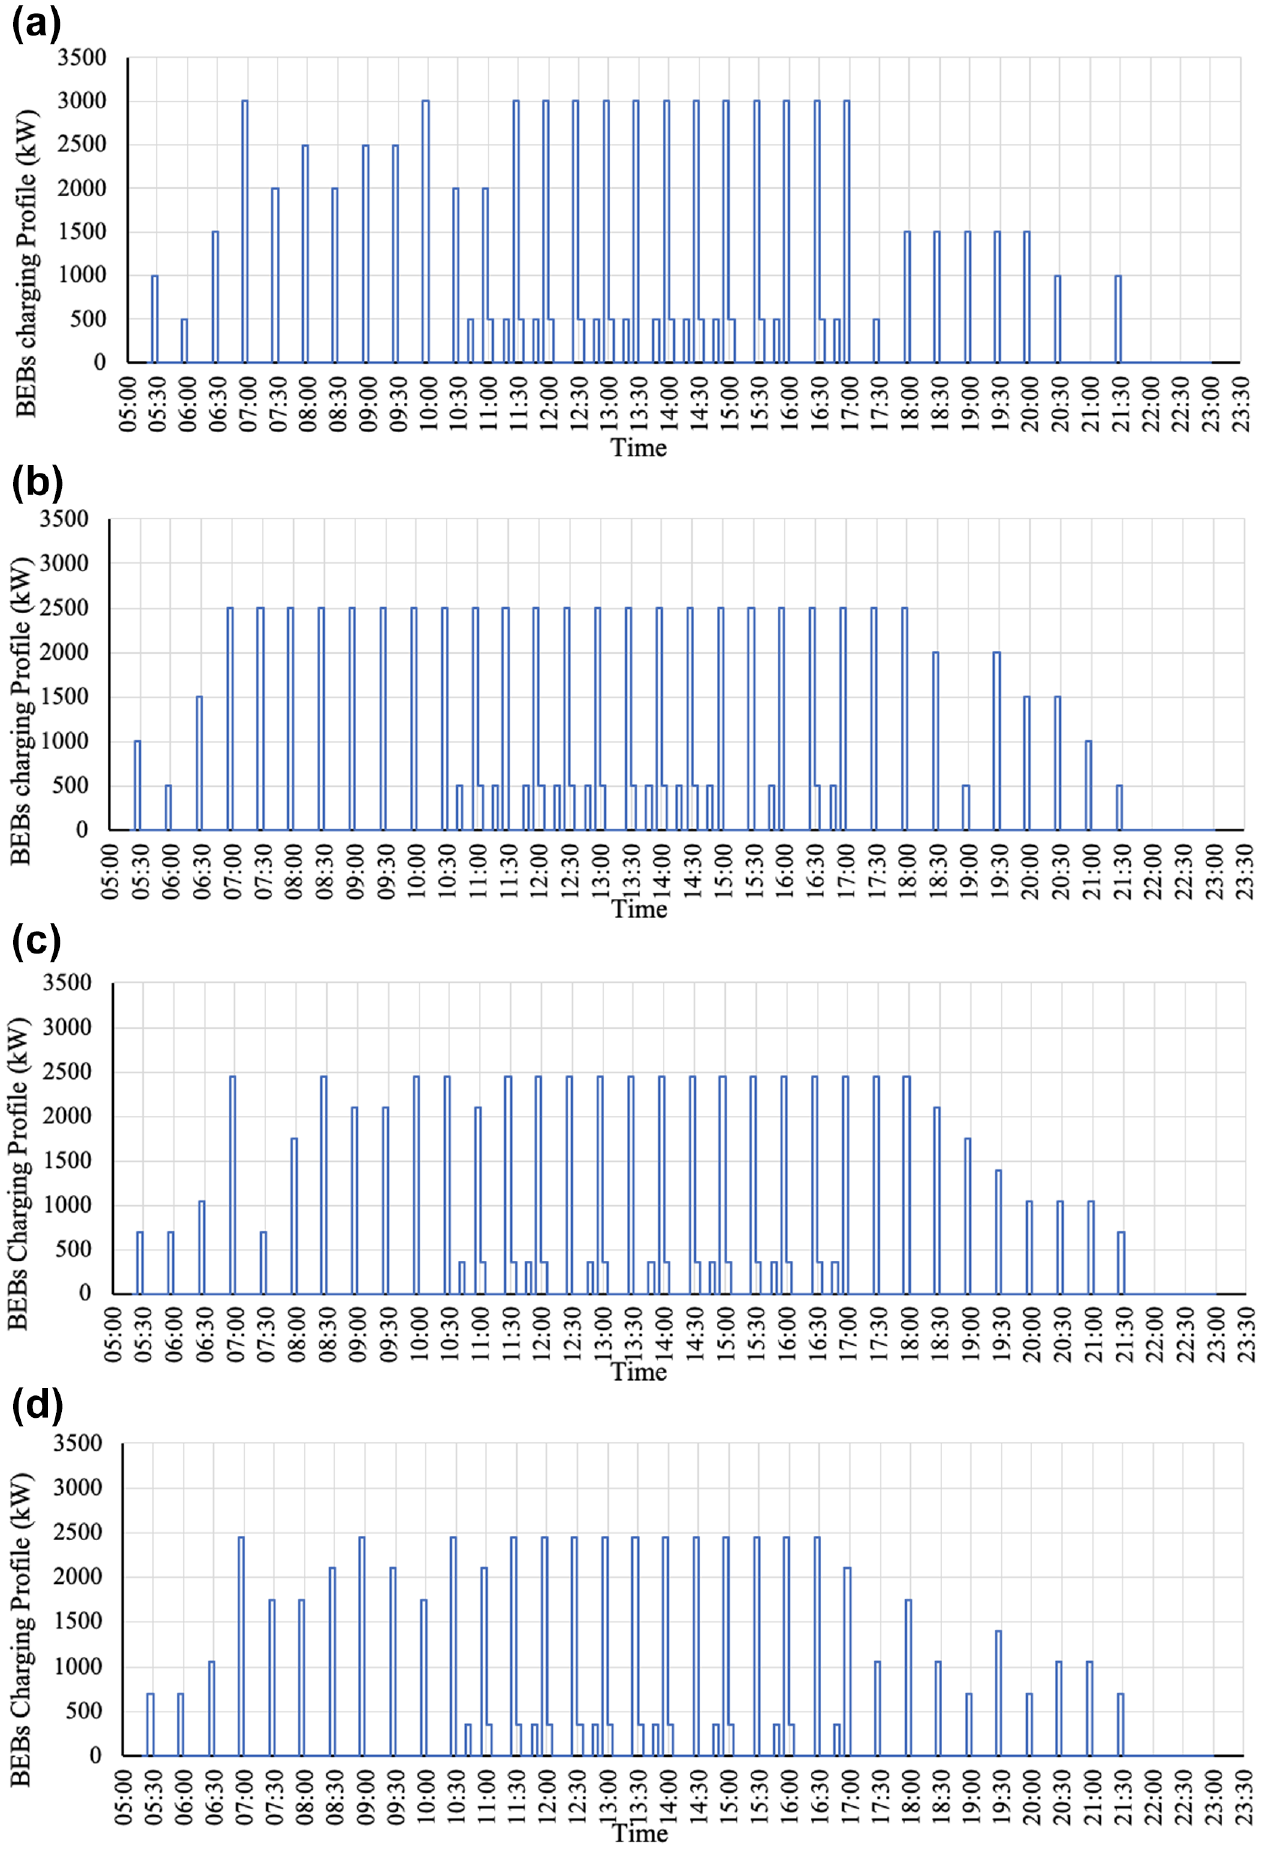
Daily energy demand of battery-electric buses: (a) Flash – Constant
For the Flash BEB, Figure 5, a and b , illustrate the importance of the SMSM algorithm in calculating the energy consumption rate at the trip level. Compared with the base model, the maximum power demand decreases from 3,000 kW to 2,500 kW. This reduction arises from the reduction in the chargers required in the case study from six to five chargers.
For the Opportunity BEB, Figure 5,
c
and
d
, illustrate that the number of chargers is equal in the two models. However, the total load during the day is decreased in the surrogate model. Also, the charging times deviate from the on-peak periods. This is also described in Table 5 as the daily operation cost is reduced from
For more illustration of the differences in the daily operation (e.g., charging) cost between the base model and the SMSM model, the energy demand in off-, mid-, and on-peak periods, and the total values are shown in Figure 6.
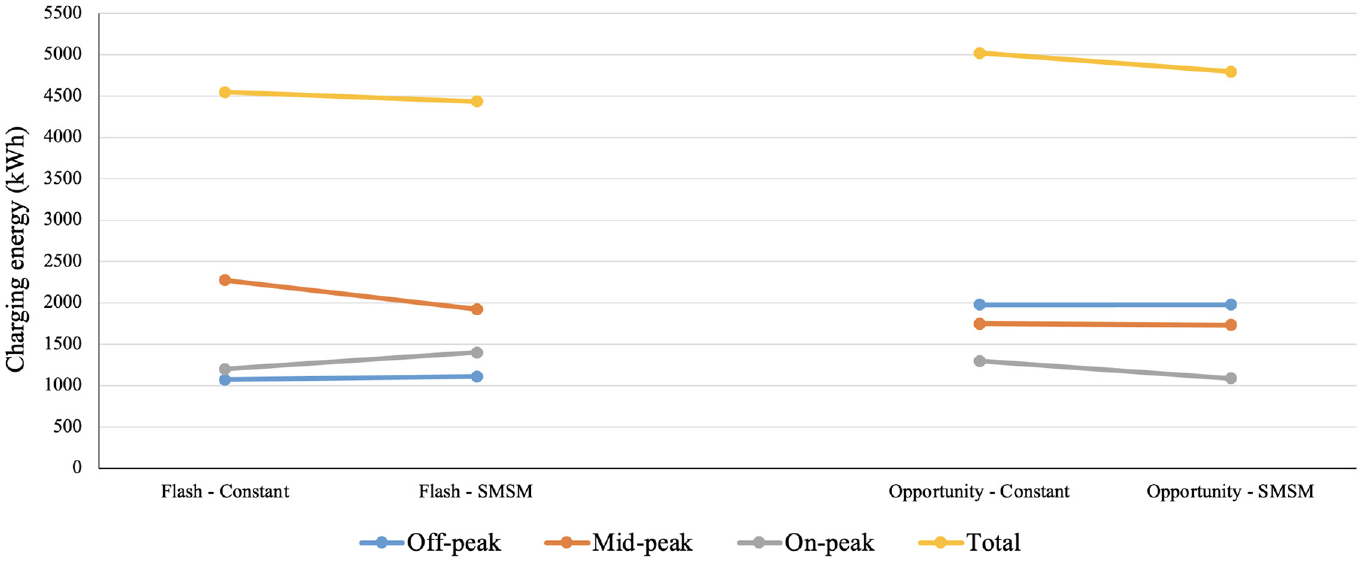
Daily charging energy for the battery-electric buses (BEBs).
First, in Figure 6, the total daily charging demand in the SMSM model is less than the base model for the two charging concepts. This reduction states that the SMSM algorithm informs the optimization process to reach a suitable charging schedule to mitigate the trip-level energy consumption. Second, for the Flash charging concept, even though the total daily energy demand is decreased from 4,550.5 kWh in the base model to 4,436.5 kWh in the SMSM model, the reduction in the operation cost is relatively small. This can be observed in Figure 6, as there is a reduction in the charging demand between the two models during off- and mid-peak periods, but an increased demand for energy in the on-peak period. Third, in the Opportunity charging concept, the total daily energy demand is decreased from 5,021.5 kWh in the base model to 4,794.5 kWh in the SMSM model, and the reduction in the operation cost is $33.34 (from $516.41 in the base model to $483.08 in the SMSM model). This reduction is attributed to the decrease in energy demand during the on-peak period (210 kWh), as presented in Figure 6. The SMSM model chooses to reduce the operation cost instead of reducing the required number of chargers to optimize the total system cost.
System Cost
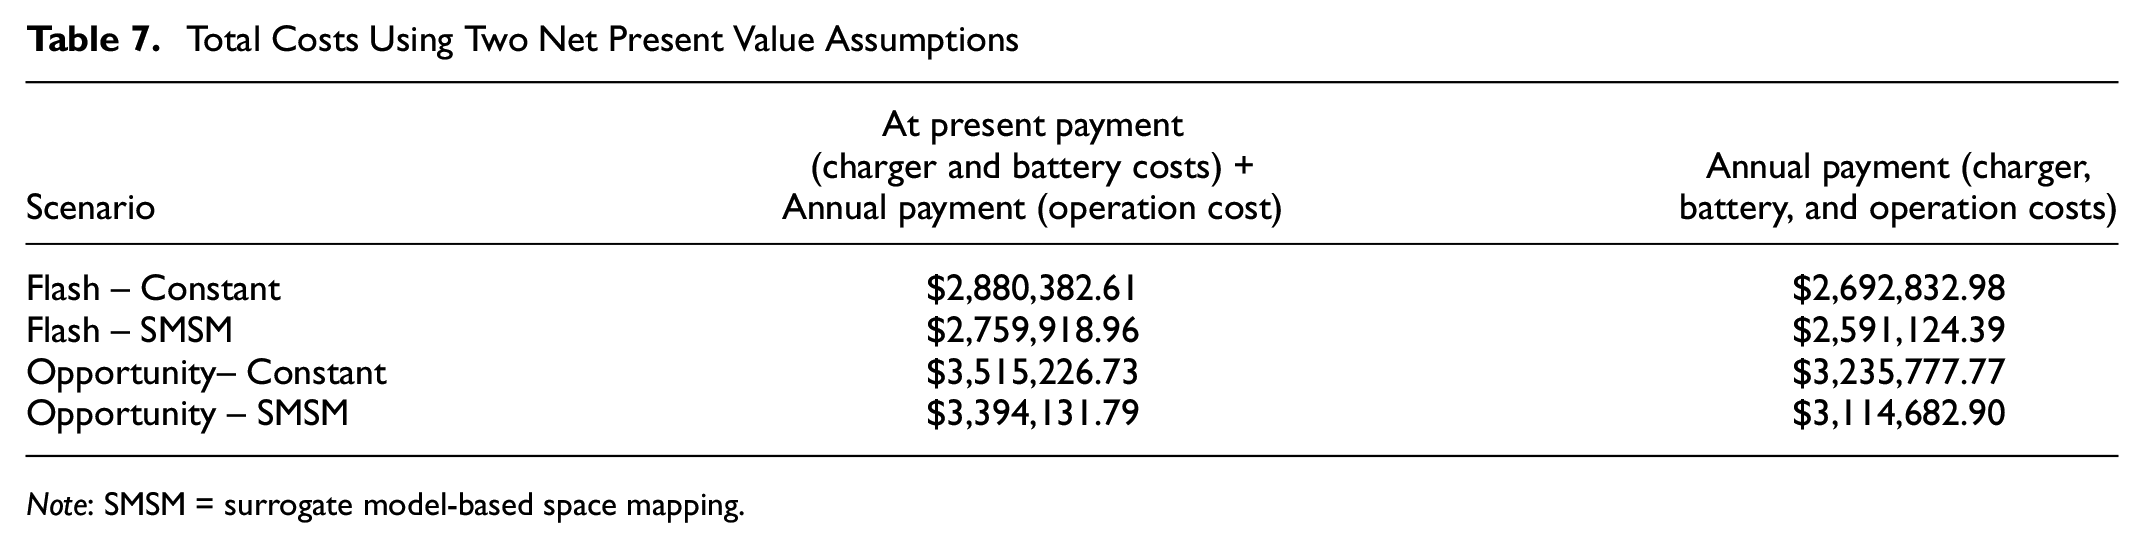
The total system cost could be estimated under various procurement scenarios. Therefore, the net present value (NPV) for fleet procurement is estimated using Equation 17 and assuming a 3% annual discount rate

The NPV estimates were developed using two distinct assumptions: (i) the costs of battery and chargers are paid upfront, and (ii) the costs of battery and chargers are paid annually (12-year lifetime). These values are presented in Table 7. The NPV estimates suggest that transit agencies should consider the annual payment option for the charging and battery costs. In this respect, the 12 years NPV for the annual payment option (detailed in Appendix I) will contribute to a saving of $168,794.57 in the Flash BEB SMSM Model and a saving of $279,448.89 in the Opportunity BEB SMSM Model over the 12-year operation lifetime.
For the Flash BEB, and compared with the base model, the daily total is reduced by
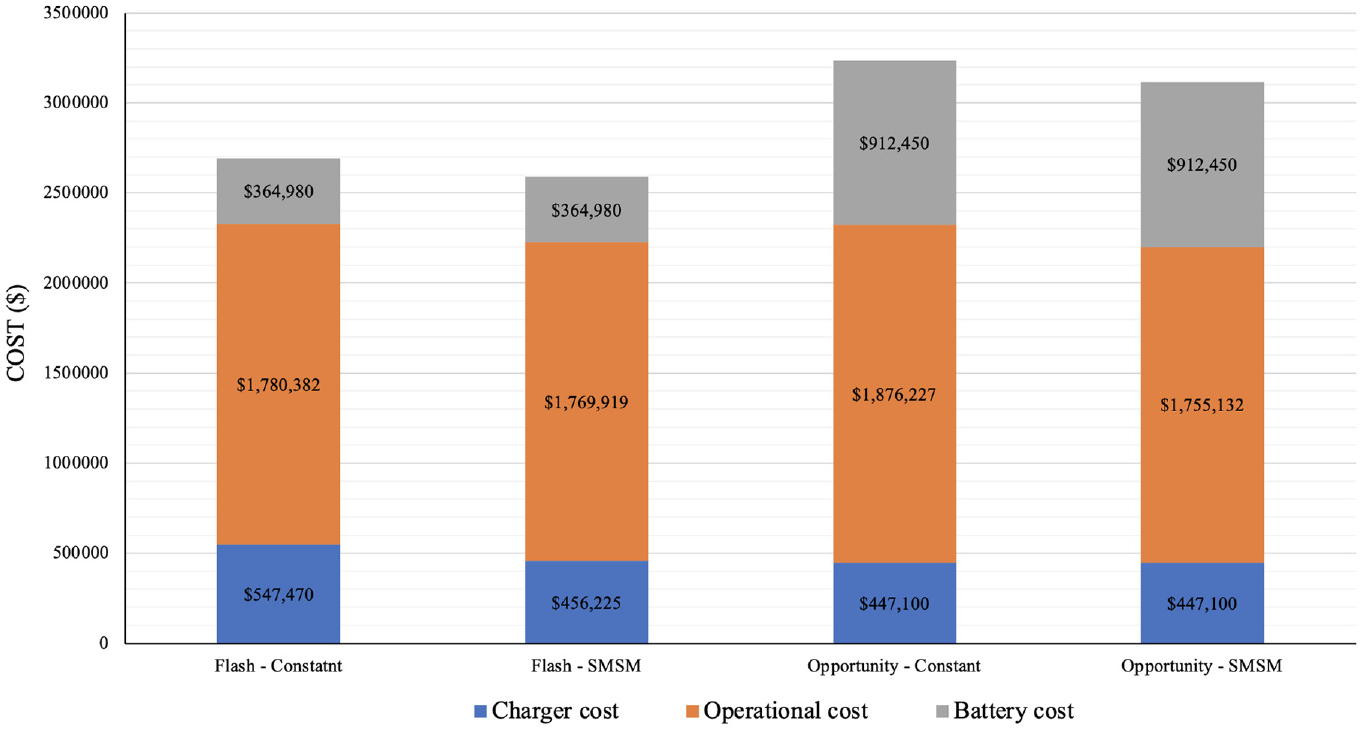
Total cost of the electric bus transit charging station (annual payment assumption).
To arrive at the optimal BEB network design, the cost of the bus battery should be added because of the different battery capacities in the two charging concepts. For the Flash charging concept,
Lastly, as this study aims to optimize the BEB infrastructure system in the City of Belleville, the findings of the optimization model highlight that a Flash BEB coupled with five chargers (500 kW each) is the most cost-effective BEB system.
Conclusion
This study has introduced a new general model to minimize electric bus transit network operation and infrastructure costs. The model introduces a novel algorithm to estimate the trip-level energy consumption during the optimization process. The proposed model covers the cost of the battery, the charging station, and the cost of operation computed by the electricity ToU and the associated rates. The model is applied to two charging concepts, Flash and Opportunity, using the transit network in Belleville City, Canada, as a case study. It should be noted that the optimization scope does not include battery size or charger power (component sizing).
An ADVISOR fine model is used to evaluate the trip-level energy consumption of BEBs. The ADVISOR model was used to inform a SMSM algorithm to estimate the energy consumption rates for BEBs.
The fine model is replaced during the optimization problem by the surrogate model. The surrogate model is then modified in every iteration during the algorithm to deduce a good approximation to the fine model. This surrogate model integrates two parts. First, a linear ISM is applied to the input. Second, a coarse linear model was obtained from the ADVISOR simulation model for different initial states of charge. This approach keeps the problem linear, reduces the computing time, and produces more accurate results.
The results clearly demonstrate the advantages of the proposed model. These advantages include the reduction of the solution time, accuracy in calculating the energy consumption, and reliability of the proposed model in optimizing the BEB transit system. More importantly, the results indicate that a constant energy consumption rate would lead to over-allocation of resources resulting in higher operation costs.
Overall, this work provides a methodological contribution to the estimation of the energy consumption rate during the optimization process of the e-bus system using the SMSM algorithm. However, there are some limitations that should be considered in future work. First, the e-bus is optimized for a hub-and-spoke (e.g., one central location for charging stations) small public transit network (e.g., number of buses, number of routes, route length, and route duration). Secondly, while the SMSM algorithm is a method for enhancing the accuracy of the estimated trip-level energy consumption during the optimization process, it is only tested in a BEB infrastructure and operation optimization problem to calculate the optimal required number of chargers and charging schedule. That said, the proposed SMSM model is applicable to large and complex transit networks.
Lastly, it should be noted that the assumption of using a homogenous fleet (e.g., Flash or Opportunity BEB) is utilized to facilitate operational flexibility and to enable rotating buses across all routes. This is essential in transit operation. Furthermore, the assumption that the buses are charged during the recovery time assumes that there are no significant delays during operation. Although both assumptions are well established in the literature, these will be addressed in the authors’ future research. Furthermore, future work must consider the uncertainty of transit operation in the optimization process.
Supplemental Material
sj-docx-1-trr-10.1177_03611981221100242 – Supplemental material for Dynamic Surrogate Trip-Level Energy Model for Electric Bus Transit System Optimization
Supplemental material, sj-docx-1-trr-10.1177_03611981221100242 for Dynamic Surrogate Trip-Level Energy Model for Electric Bus Transit System Optimization by Ahmed Foda, Moataz Mohamed and Mohamed Bakr in Transportation Research Record
Footnotes
Notations
Sets
Author Contributions
The authors confirm contribution to the paper as follows: study conception and design: A. Foda, M. Mohamed; data collection: M. Mohamed; analysis and interpretation of results: A. Foda, M. Mohamed; draft manuscript preparation: A. Foda, M. Mohamed, M. Bakr. All authors reviewed the results and approved the final version of the manuscript.
Declaration of Conflicting Interests
The author(s) declared no potential conflicts of interest with respect to the research, authorship, and/or publication of this article.
Funding
The author(s) disclosed receipt of the following financial support for the research, authorship, and/or publication of this article: the Natural Sciences and Engineering Research Council of Canada (NSERC) Grants No: RGPIN-2018-05994.
Supplemental Material
Supplemental material for this article is available online.
References
Supplementary Material
Please find the following supplemental material available below.
For Open Access articles published under a Creative Commons License, all supplemental material carries the same license as the article it is associated with.
For non-Open Access articles published, all supplemental material carries a non-exclusive license, and permission requests for re-use of supplemental material or any part of supplemental material shall be sent directly to the copyright owner as specified in the copyright notice associated with the article.