
Abstract
Battery electric vehicles (BEVs) form a big part of the UK’s agenda for decarbonizing road transport. Although there have been various policies such as purchase grants and vehicle tax exemptions, the BEV penetration rate in the UK was only 2.5% in September 2023. Most research analyzing electric vehicle (EV) ownership in the UK is either based on stated preference survey data or includes plug-in hybrid vehicles in the analysis because of the sparsity of BEV ownership data; there is limited research based on household revealed preference (RP) data. This paper develops a BEV ownership model using RP household-level data from England to discover influential factors, to validate the findings in the literature, or both. Specifically, this paper uses the subset of the UK National Travel Survey (NTS) special license data to estimate a series of binary logit models of BEV ownership as a function of several sociodemographic, regional, and temporal factors, and discusses the related policy implications. Household income, multivehicle ownership (resulting from range anxiety), and overnight parking on street (resulting from insufficient public charging infrastructure) are influential factors found in this study that align with previous studies. On the other hand, households with a mortgage loan, geographical attributes (such as population density), and household composition (e.g., number of adults and children) are new factors identified in this study. We also present a future BEV ownership prediction model for regions of England which clearly suggests that improving public charging infrastructure, especially in the north, is required to achieve widespread growth in BEV ownership.
Keywords
The transport sector has been one of the largest contributors to greenhouse gas emissions worldwide. In the United Kingdom (UK), transport has accounted for more than 25% of total emissions with petrol and diesel combustion vehicles being one of the major sources of carbon emissions ( 1 ). Therefore, tackling the problems caused by road transport is one of the core actions to be taken to achieve a low-carbon system. Vehicles can be categorized by their fuel types into petrol, diesel, gas, hybrid electric vehicle (HEV), plug-in hybrid electric vehicle (PHEV), and battery electric vehicle (BEV). Internal combustion engine (ICE) vehicles are powered by combustion fuels that generate pollutant emissions from engines that contain greenhouse gases and particulate matter. The HEV involves a regenerative braking system that can convert momentum into electricity while braking. Unfortunately, the HEV is predominately a normal combustion fuel vehicle that cannot be charged by plug-in charging facilities. Only the PHEV and BEV can be powered by plug-in electricity, though the PHEV has the option to be powered by petrol and does not commit to fully EV characteristics. Therefore, only the BEV can be regarded as a zero-emission on-site vehicle. Apart from BEVs, all other vehicles mentioned above contribute to on-site tailpipe emissions from the engine combustion process. In this paper, we focus on plug-in EVs, to the exclusion of other alternative fuel vehicles such as fuel cell vehicles.
A report from the UK Department for Transport (DfT) in 2021 showed that ICE vehicles have 3.4 times more carbon dioxide emissions than BEVs even if the emissions from current electricity generation and distribution systems are considered ( 2 ). Furthermore, the UK is investing substantially in clean electricity generation, and the UK government has announced a target of achieving 100% energy supply from renewable sources by 2035 ( 3 ). So, the electrification of road vehicles that shifts from combustion vehicles to BEVs which are charged by clean electricity would help the UK decarbonize its transport sector. Accordingly, policies such as the target that 80% of new car and 70% of new van sales should be zero-emission by 2030, increasing to 100% by 2035, have been announced in the UK to encourage more BEVs on the road ( 4 ).
Although there are various adoption incentives such as BEV purchase grants and vehicle tax exemptions, the penetration rate of BEVs is still at a low level in the UK. According to a McKinsey study (2020), the UK has an EV index of 2.1 for BEV adoption (using a 5-point scale with 5 as the maximum), compared with 4.1 in Norway which has the highest rate of BEV ownership in the world ( 5 ). Furthermore, according to the statistics of registered license plates in the UK in 2020, the percentage of BEVs was around 0.6% ( 6 ), though rising. A detailed breakdown of the more recent 2023 data is shown in Figure 1 ( 7 ), with the level of BEV ownership at 2.3%. Moreover, although BEV ownership has seen an increasing trend in recent years ( 8 ), the United Nations (2021) points out that at least 20% of the road vehicle fleet should be electrified by 2030 to accomplish the Paris Agreement and net zero targets by 2050 ( 9 ). Current BEV adoption levels in the UK are far below that target. Therefore, analyzing the current BEV ownership in the UK can help to identify potentially willing drivers as well as barriers to the adoption of EVs helping to set suitable policies and ultimately speed up the increase of the BEV penetration rate as a means of achieving the committed emissions reduction objectives and combating climate change.
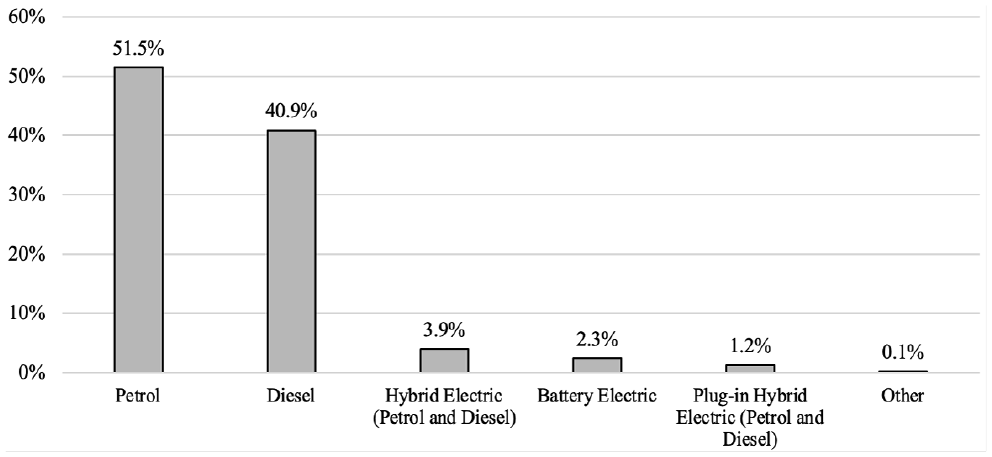
Percentage of vehicles in the UK, September 2023 by fuel type ( 7 ).
Aim and Objectives of the Present Paper
This study aims to assess the factors that more influence BEV ownership and validate these against findings in the literature. This was achieved by developing a BEV ownership model, using revealed preference (RP) household-level data from England (Figure 2).

Regions of England (blue) in the United Kingdom ( 10 ).
To this end, the paper makes three contributions. Firstly, it develops an econometric model of BEV adoption using observed (RP) rather than stated preference (SP) data, which has been the prevalent approach to date ( 11 ). This model provides a baseline empirical study for BEV ownership in England. Secondly, the findings in this paper validate and/or challenge existing knowledge about the factors associated with BEV ownership, while also exploring factors that have not been previously identified. Thirdly, the paper discusses policy implications related to BEV adoption and ownership in light of the modeling results, by taking sociodemographic, regional, and temporal factors into account.
Outline of the Paper
This paper is structured as follows. We first present the relevant literature background to the context of the present study, including empirical data used. We then describe the methodology, including data processing and model specification strategy. This is followed by the results and a discussion of the findings, before the conclusions.
Literature Review
Financial considerations, range anxiety, charging infrastructure availability, and household composition are the most common factors identified in the literature that influence BEV ownership decisions, while geographical and personal attributes are less often influential. For clarity, the EV ownership studies reviewed in this paper are classified into different categories as shown in Figure 3. Three layers of ordered hierarchy (in the vertical dimension) have been established based on the type of data used, the EV type, and the country of study. The literature review section is accordingly divided into similar subsections for discussion.
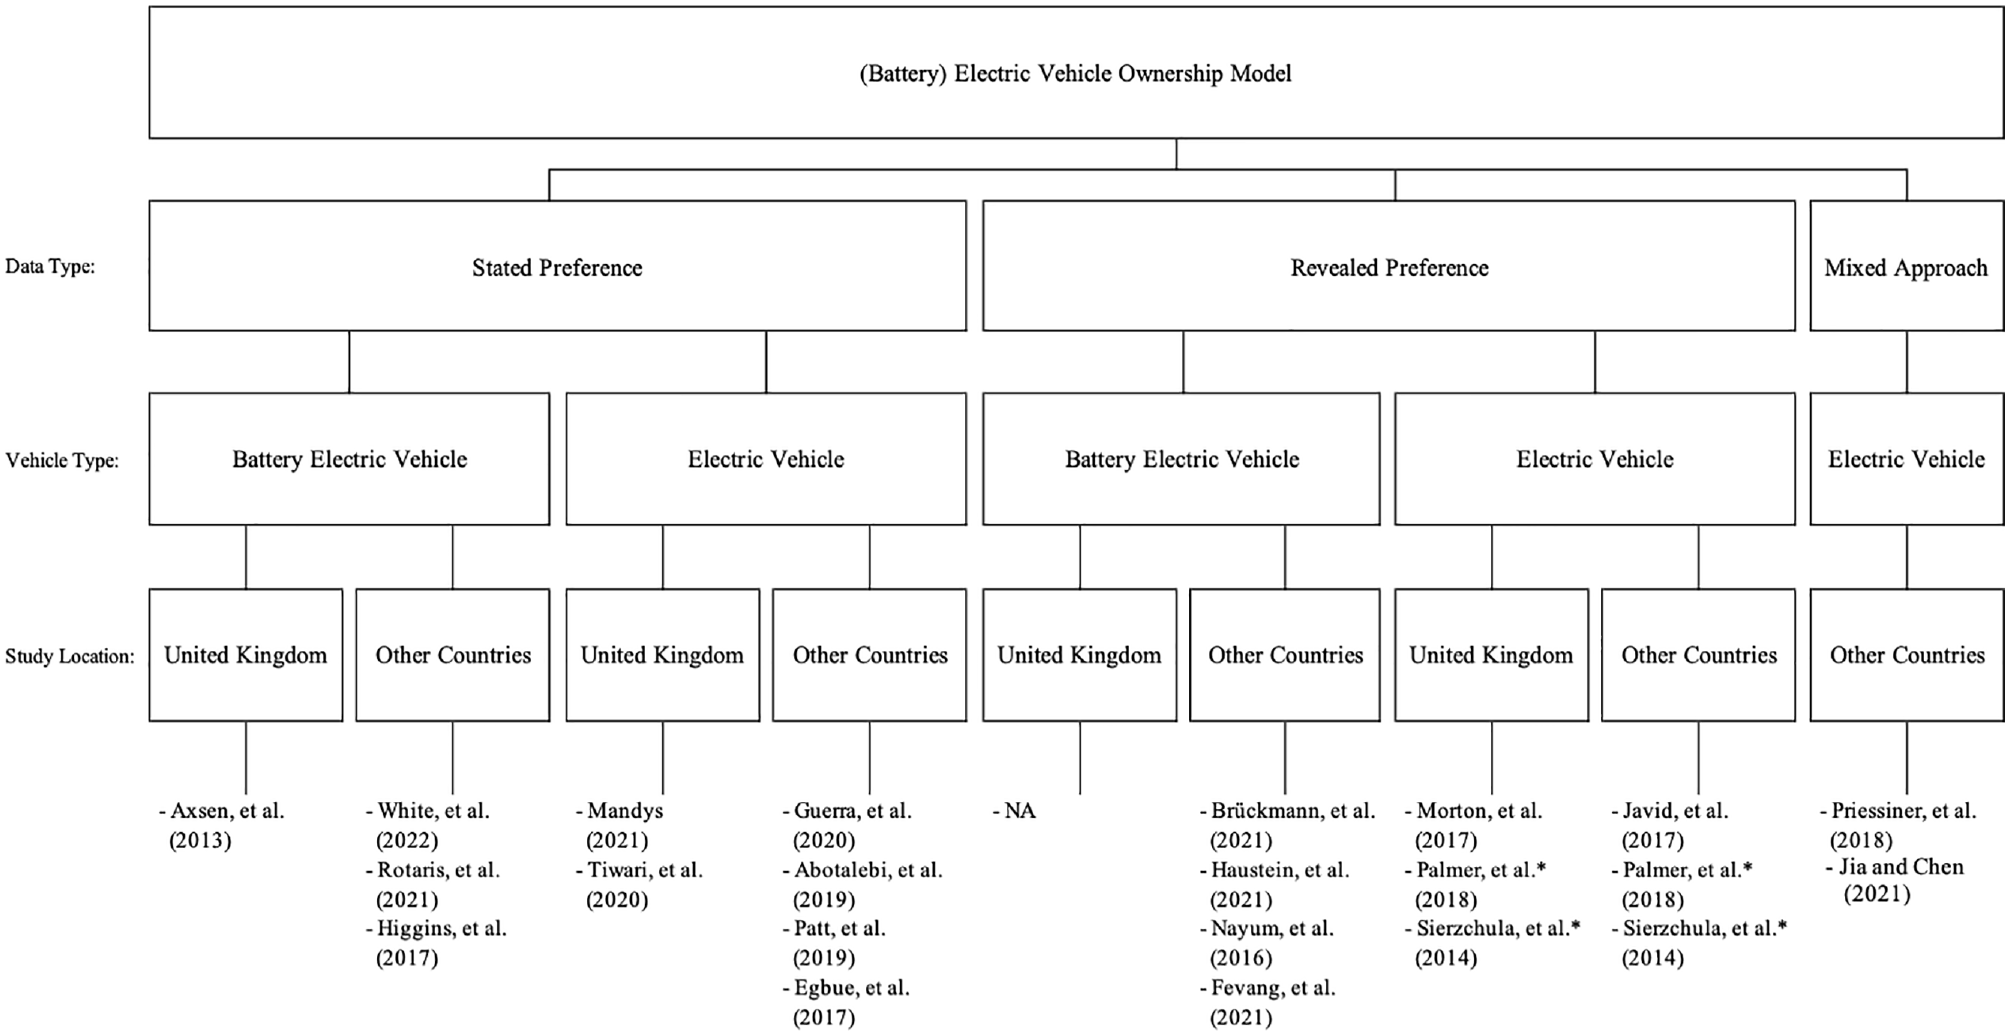
Classification framework for (battery) electric vehicle ownership.
Types of Data Used in EV Ownership Studies
In general, the data used in the EV ownership model can be classified into two main groups: revealed preference (RP) and stated preference (SP) data. Given the low penetration rate of BEVs, Brückmann et al. ( 22 ) pointed out that relatively few studies use the RP approach which is based on actual BEV ownership data ( 22 ). Instead, many researchers use SP data to provide a hypothetical study of BEV ownership. It is widely known that SP data might be susceptible to biases and may not reflect the real preferences of the respondents ( 31 ). In contrast, RP data can reflect the actual preferences of current BEV owners, especially if we use RP data at the household level rather than aggregate vehicle registration data. However, the sparsity of RP data on BEV ownership has imposed a challenge for researchers as BEVs are still a relatively new and niche market product. A few studies have looked at aggregated nationwide statistics such as the number of vehicle registrations and consumer price index ( 26 – 28 ). These RP data are nationwide or aggregated at the regional level and may therefore be subject to data aggregation bias ( 32 ). Further, the impact of sociodemographic characteristics of households, such as household composition, cannot be studied.
Priessner et al. ( 30 ) used a combination of RP and SP data, collected by asking the non-EV-owning respondents about their potential intention toward EV ownership in Austria ( 30 ). The respondents were classified into early EV adopters, potential EV adopters, and non-adopters, which allowed the researchers to study both hypothetical and real-life behaviors toward EV ownership. Jia and Chen ( 11 ) compared results from an SP survey and a county-level RP study in the US state of Virginia. While they reported consistent results on the effects of gender, education attainment, or availability of direct current (DC) charging infrastructure across the two approaches, they observed different and opposite results for age or availability of alternating current (AC) charging infrastructure ( 11 ). They also emphasized the need to account for differences in perceptions of and sensitivity to attributes in SP contexts, among current EV owners and non-owners. We note that mixed (RP-SP) survey data are not currently available for the UK market.
Types of Electric Vehicle
There are more studies investigating EVs in general rather than the BEV specifically. BEVs and PHEVs are usually merged into one category called EV mostly because of the low penetration rate of BEVs ( 16 ). This might incur some bias in the analysis of the impacts of EVs as PHEVs are more similar to ICE vehicles in their needs and also are not free from tailpipe emissions. As a result, from the user’s perspective, the concerns about range anxiety and access to charging infrastructure may diminish for PHEVs, while being exacerbated for BEV users ( 11 , 33 ).
The importance of differentiating between BEVs and PHEVs is more pronounced when investigating the impacts of range anxiety. Studies that focus only on BEVs have found that because of range anxiety BEV-owning households have a higher tendency to own multiple vehicles, as they might reserve additional vehicles for long-distance trips or for when their BEV is charging ( 15 , 22 , 24 ). However, studies that merged PHEVs and BEVs into one category did not find multivehicle ownership to be a significant factor ( 30 ). It is also important to consider that many countries will ban the sale of PHEVs a few years after the sale ban on ICE vehicles. Therefore, it is necessary to study BEVs independently if focusing on long-term policy settings.
Study Location
Given the differences in sociodemographics, cultural differences, and policy adaptability, EV ownership rates vary across countries ( 17 ). The reported results point toward geographical specificity in factors influencing EV ownership depending on the study location. For example, a study in the UK ( 26 ) found that households residing in areas of higher population density have a greater tendency to own an EV. But another study in California, US ( 29 ), did not find population density to be a significant factor. Also, Tiwari et al. ( 17 ) showed that EV penetration varies across households with different home ownership conditions in the UK, while the same study in California could not find any significant impact from the homeownership variable.
The studies in the UK have mainly focused on EVs and have not differentiated between PHEVs and BEVs ( 16 , 17 , 26–28) with one exception ( 12 ). Several recent studies have used RP data to model BEV ownership in recent years. These studies used data from Switzerland ( 22 ), Demark and Sweden ( 23 ), and Norway ( 24 ). Although the BEV penetration rate is still relatively low in the UK market, there has been an increasing trend over the years according to the vehicle registration license data (VLD) from the DfT (8). An early study of BEV ownership based on current owners of BEVs can fill the gap in the modeling of BEV ownership in the UK.
Methodology
Data Selection and Comparison
Data used in our analysis are from the UK National Travel Survey (NTS) ( 34 ). NTS is an annual RP survey that captures travel behavior and household attributes, including sociodemographic characteristics, from respondents from England and Wales. This study uses a special license version of NTS that characterizes household vehicles as BEVs separately from other non-ICE vehicles. Another source of vehicle data in the UK is the VLD from the DfT ( 8 ). However, the VLD do not include household characteristics and are therefore not suitable for investigating the vehicle ownership decision-making process. To ensure consistency in the population covered in both data sets, we restrict the analysis to respondents from England only, though as the most populous of the UK nations it includes 84% of the entire UK population ( 35 ). We compare the NTS data with VLD data to ensure that NTS vehicle ownership levels are representative of England. Figure 4 shows the penetration rate in the UK between NTS and VLD across the years analyzed in this paper. The penetration rates and trend from both NTS and VLD data are similar, low, and consistently growing.
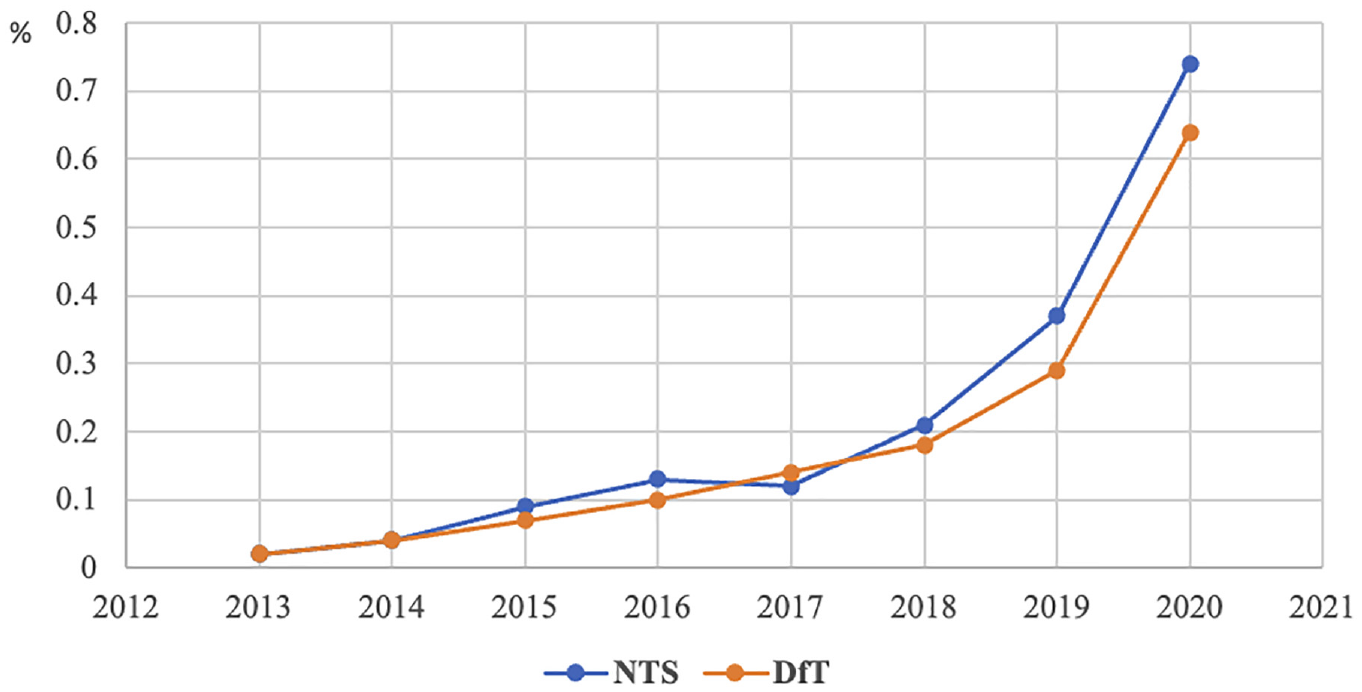
Percentage of BEV ownership from NTS and DfT across years.
Figure 5 shows the regional BEV ownership rate across the years. In general, the BEV adoption trends in different regions are similar, with London and the south of England exhibiting a higher penetration rate than the other regions. The non-linear growth in BEV ownership levels over the years warrants the inclusion of year-specific indicators in the BEV ownership model.
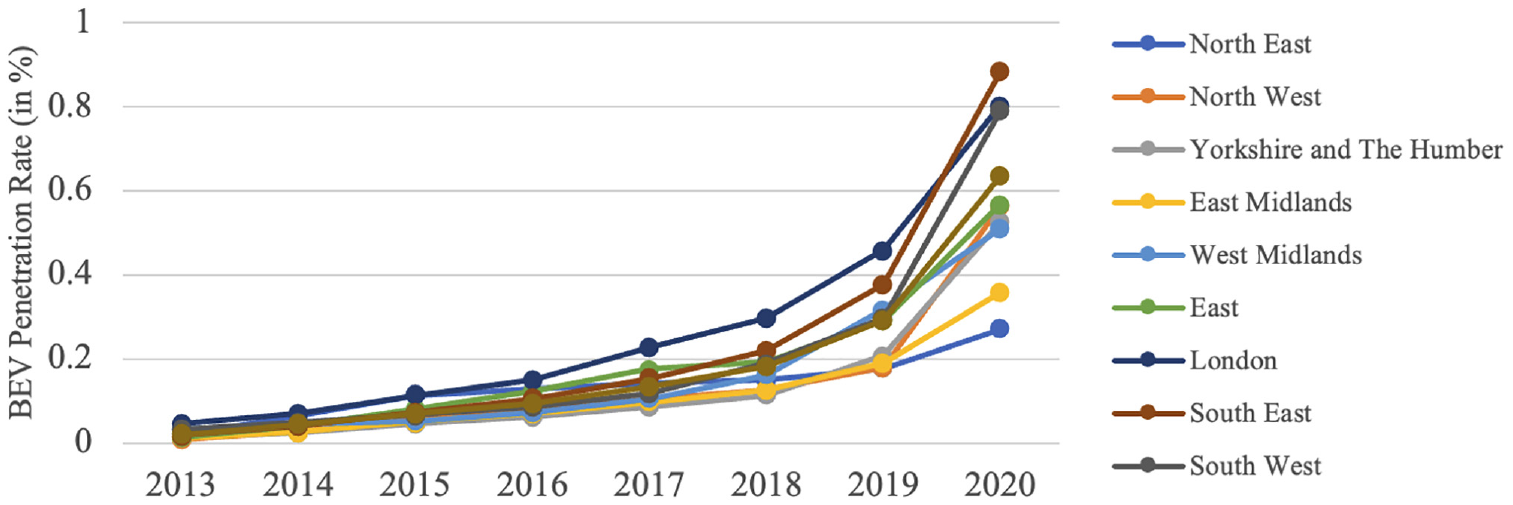
Regional BEV Penetration Rate in England, UK 2013–2020.
Model Application Toward Predicting Future BEV Ownership
Besides its inferential capabilities with regards to the factors affecting BEV ownership, the BEV ownership model based on the NTS data can be applied to simulate future BEV adoption trends. BEV is a relatively new technology to the market, with a low level of overall penetration (recall Figures 4 and 5). Assuming that the cumulative adoption follows the conventional sigmoid curve (S-curve), it would be expected to grow slowly in the beginning and then accelerate only to gradually flatten when it grows toward the maximum saturation point ( 36 ). Under this assumption, the UK BEV market is likely still in the first half of the sigmoid curve (Figure 6).
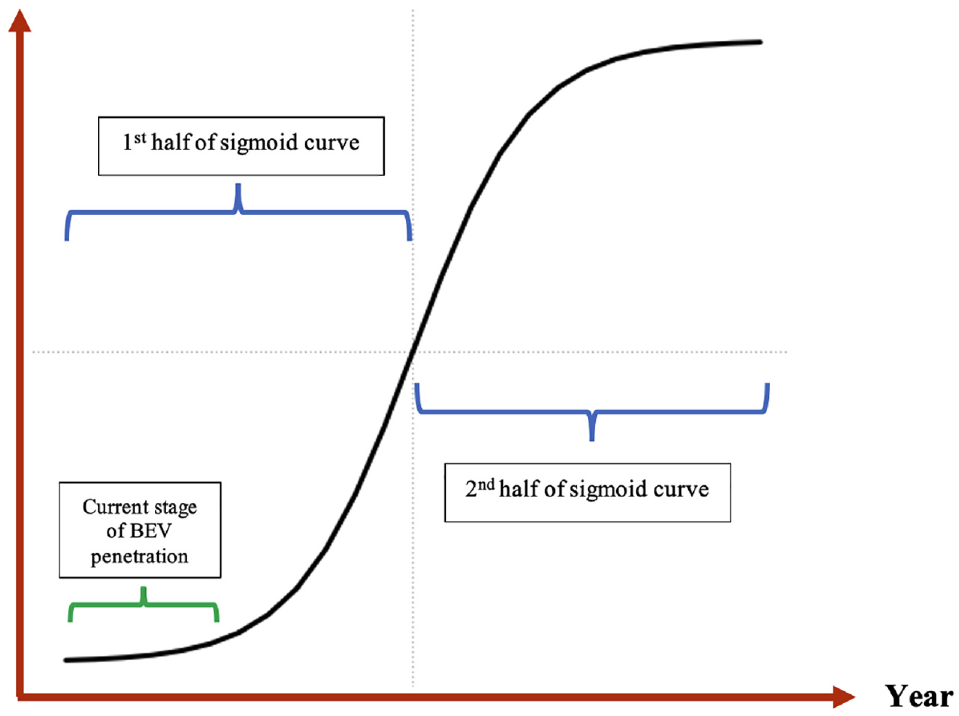
Conceptual model of the BEV ownership change over time: a sigmoid curve.
As BEVs gain in popularity, we expect an acceleration in BEV adoption before reaching the second half of the sigmoid curve and market saturation. For forecasting beyond the modeled years, we apply the year-on-year adoption effect for future years by introducing a year-specific variable to capture the temporal effect from the first (reference) year of the data. To model the temporal effect of the adoption trend, an increasing variable from 1 to 13 will therefore be used to represent the years 2013 to 2025 respectively.
Modeling Approach
In this paper, the household decision to own a BEV is modeled using a binary logit model. Therefore, the utility function

where
Note that the formulation permits incorporation of variables that are not reported every year. For example, in the NTS data the overnight parking location of the vehicle and the type of household properties are captured only every other year. By interacting such variables with year-specific indicator variables, it is possible to systematically account for this data design and obtain suitable estimates of the postulated effect.
Assuming that

Given that the binary logit model specified in this paper effectively categorizes the households into BEV-owning and non-BEV-owning households as a function of household characteristics, the binary logit model is in fact equivalent to a binary logistic regression. Estimation of the model parameters can be undertaken using the standard maximum likelihood approach; for the analysis presented in this paper, we used Python’s statsmodels package ( 37 ).
Explanatory Variables Tested
A set of variables characterizing the respondents was considered in search of the optimal model specification. The first set of variables includes households’ financial attributes. In particular, as household income has been shown to be a significant factor in earlier studies, we transform the 26 income categories recorded in NTS to a continuous variable using the mean value of each category considering the average household income data from the UK Office for National Statistics ( 35 ). Apart from income, having a mortgage loan is also considered as an independent variable in our model estimation, capturing the additional financial burden to households, not shown in the income variable. In addition, property type and ownership are included ( 16 , 24 ).
The second set of variables considered includes household composition. To shed light on the role of household composition, while dealing with a limited sample size, we explored different household composition variables in different model specifications. Based on the household size and composition (number of adults and children) as well as the previous literature ( 15 , 22 , 26 , 30 ), several different combinations of household attributes were investigated in separate models as shown in Figure 7.
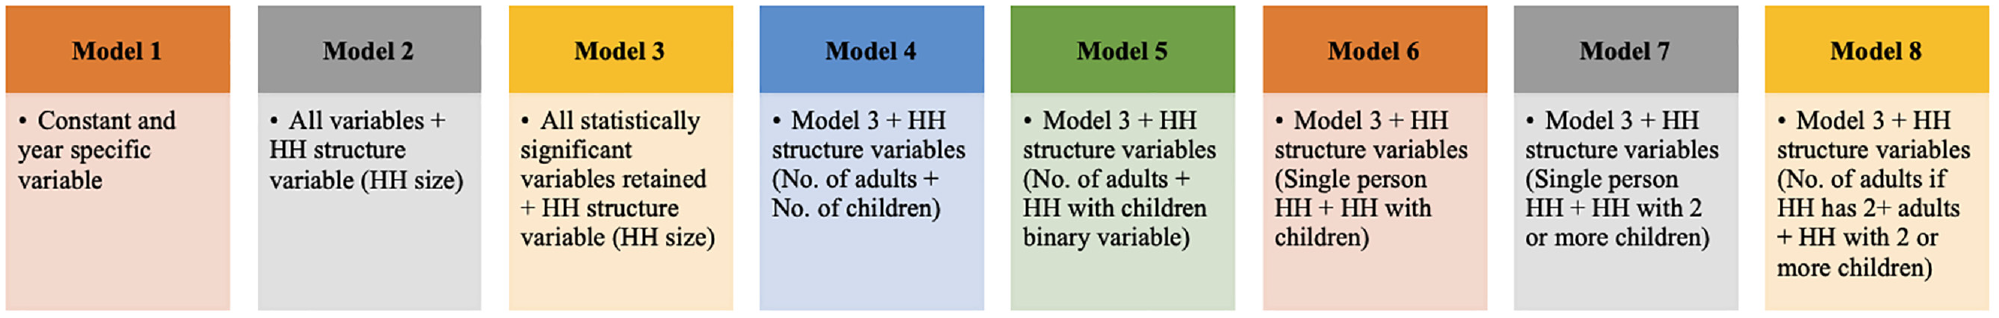
Model definitions and grouping of different household (HH) composition segments.
The third set of variables tested are related to vehicle ownership and associated infrastructure. Specifically, multivehicle ownership in households is explored, as BEV-owning households could have a higher tendency (as a result of range anxiety) to own additional vehicles as a backup for long-distance trips or when the BEV is under the charging state. We do not have data from the NTS for charging infrastructure availability. However, we consider the availability and type of parking at the home location as a proxy. Specifically, overnight on-street parking is tested as a potential indicator of charging infrastructure availability ( 20 , 38 ).
The fourth set of factors are related to the geography of the household and the sociodemographics of the main driver. In particular, the population density of home location is included as previous studies have found that people living in denser areas may have a higher tendency to own a BEV ( 18 , 26 ). Moreover, we include an indicator for London as it clearly has a higher BEV penetration rate shown in the VLD. Finally, the age and gender of the main driver (as indicated in the NTS data set) in the household are considered in the analysis as they have been found to be important factors in the literature ( 16 , 24 ). A descriptive summary of variables considered in our analysis is presented in Table 1.
Summary of Descriptive Statistics of Attributes in the Data Set
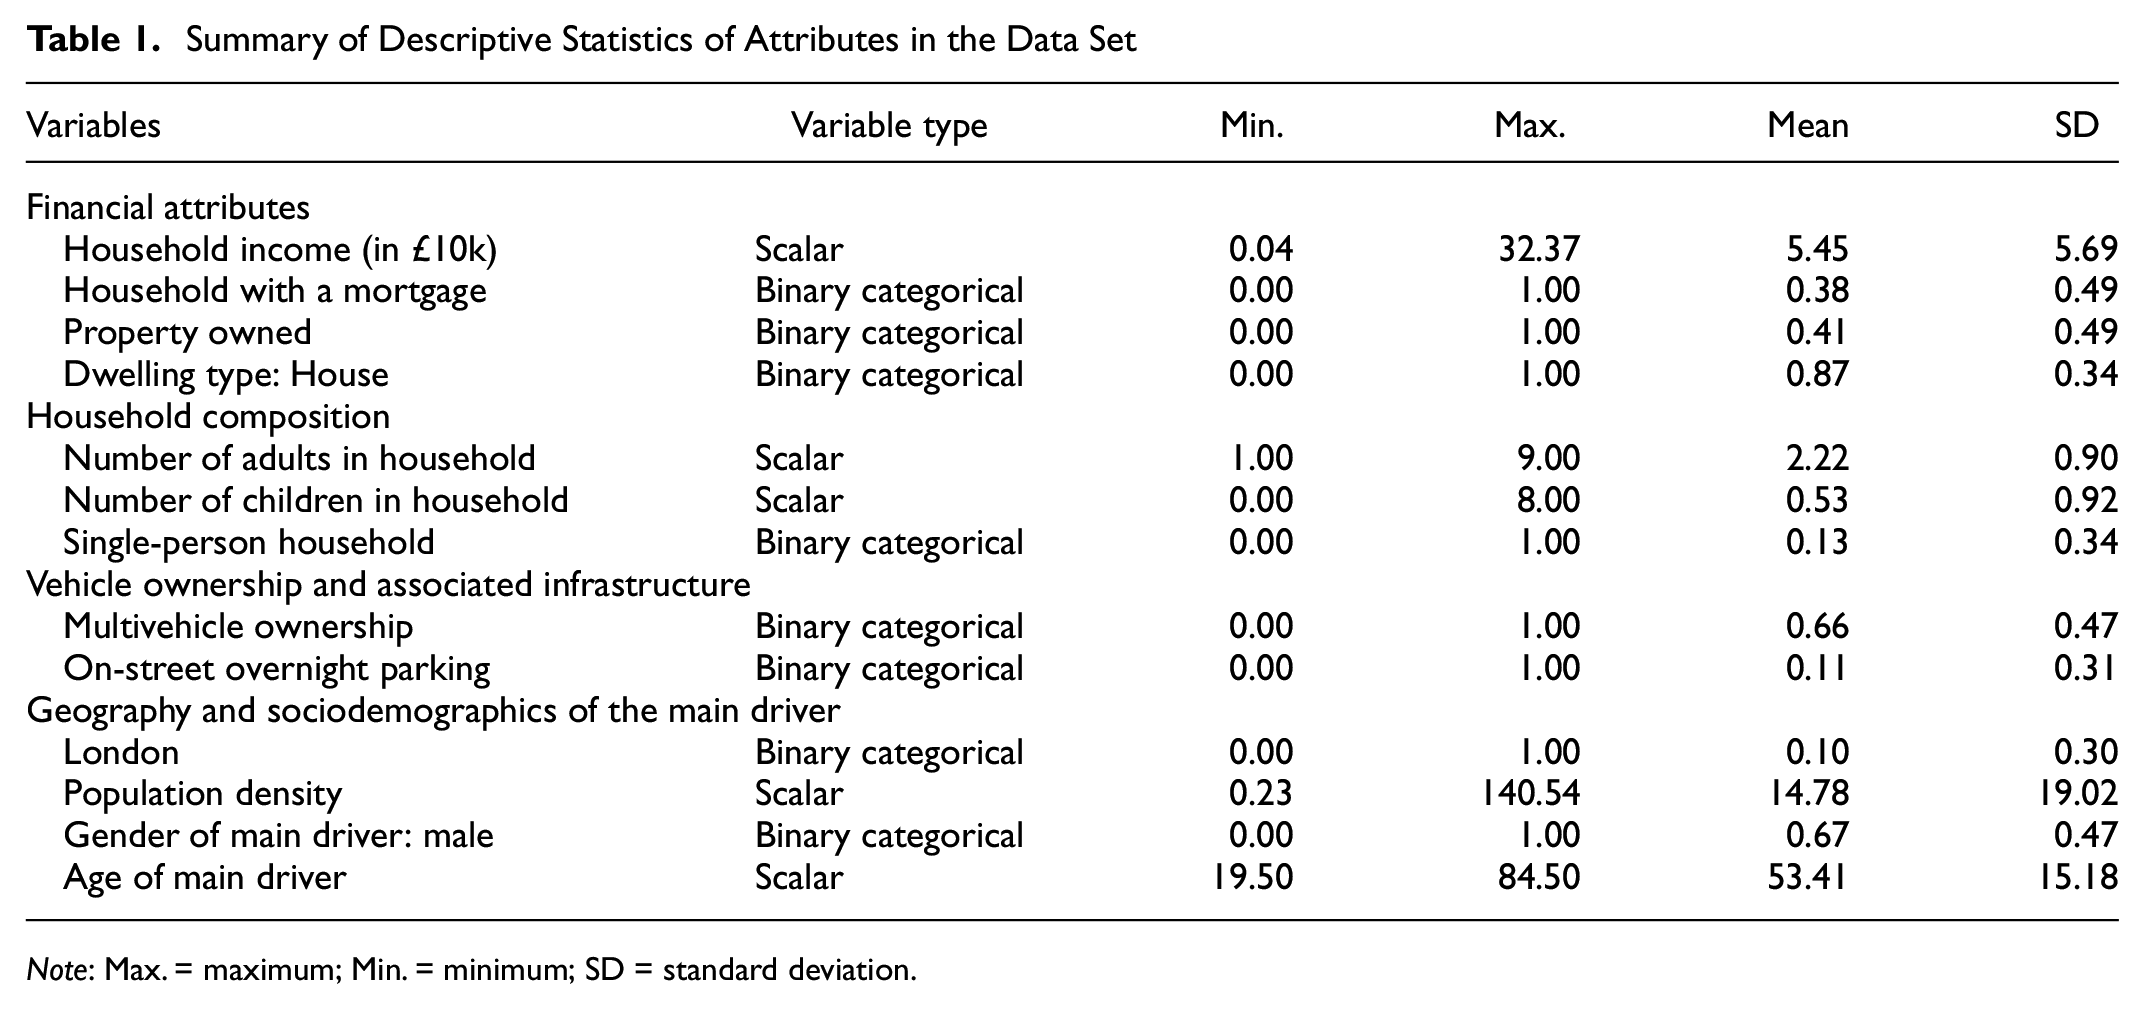
Note: Max. = maximum; Min. = minimum; SD = standard deviation.
Model Specification Search
While many model specifications were tested and considered, eight of these models are discussed and presented in this paper (Figure 6). The model specification search had two key tasks. First, to search for the most optimal specification given a limited sample size. Second, to assess possible misspecification in EV ownership models resulting from omitting certain (potentially important) variables from the models, such as household composition or availability of on-street parking. Model 1, with only constant and year-specific variables, captures the BEV adoption trend over the years and is used as the base specification. Model 2 considers all variables (from all the four sets described above), except for the more detailed household composition variables. Model 3 is a trimmed version of Model 2, obtained by dropping variables that are statistically insignificant and potentially irrelevant (as per the literature), Models 4 to 8 build on Model 3 by testing various household composition variables.
The final model specification was determined based on goodness of fit statistics, the statistical significance of estimated parameters and the interpretability of the explanatory variables. Overall, the biggest challenge in model estimation was the sparsity of the data given the low penetration of BEVs. This motivated the need for a conservative approach in the exclusion of variables to reduce the risk of Type II errors. In other words, several model specifications were tested iteratively and only variables with a 90% level of significance or more were retained.
Findings
Considering the data sparsity, several different model specifications were tested to verify the stability of the postulated effects. The results of the model estimations for the eight specifications described above are presented in Table 2.
Model Estimation Results (n = 66,542)
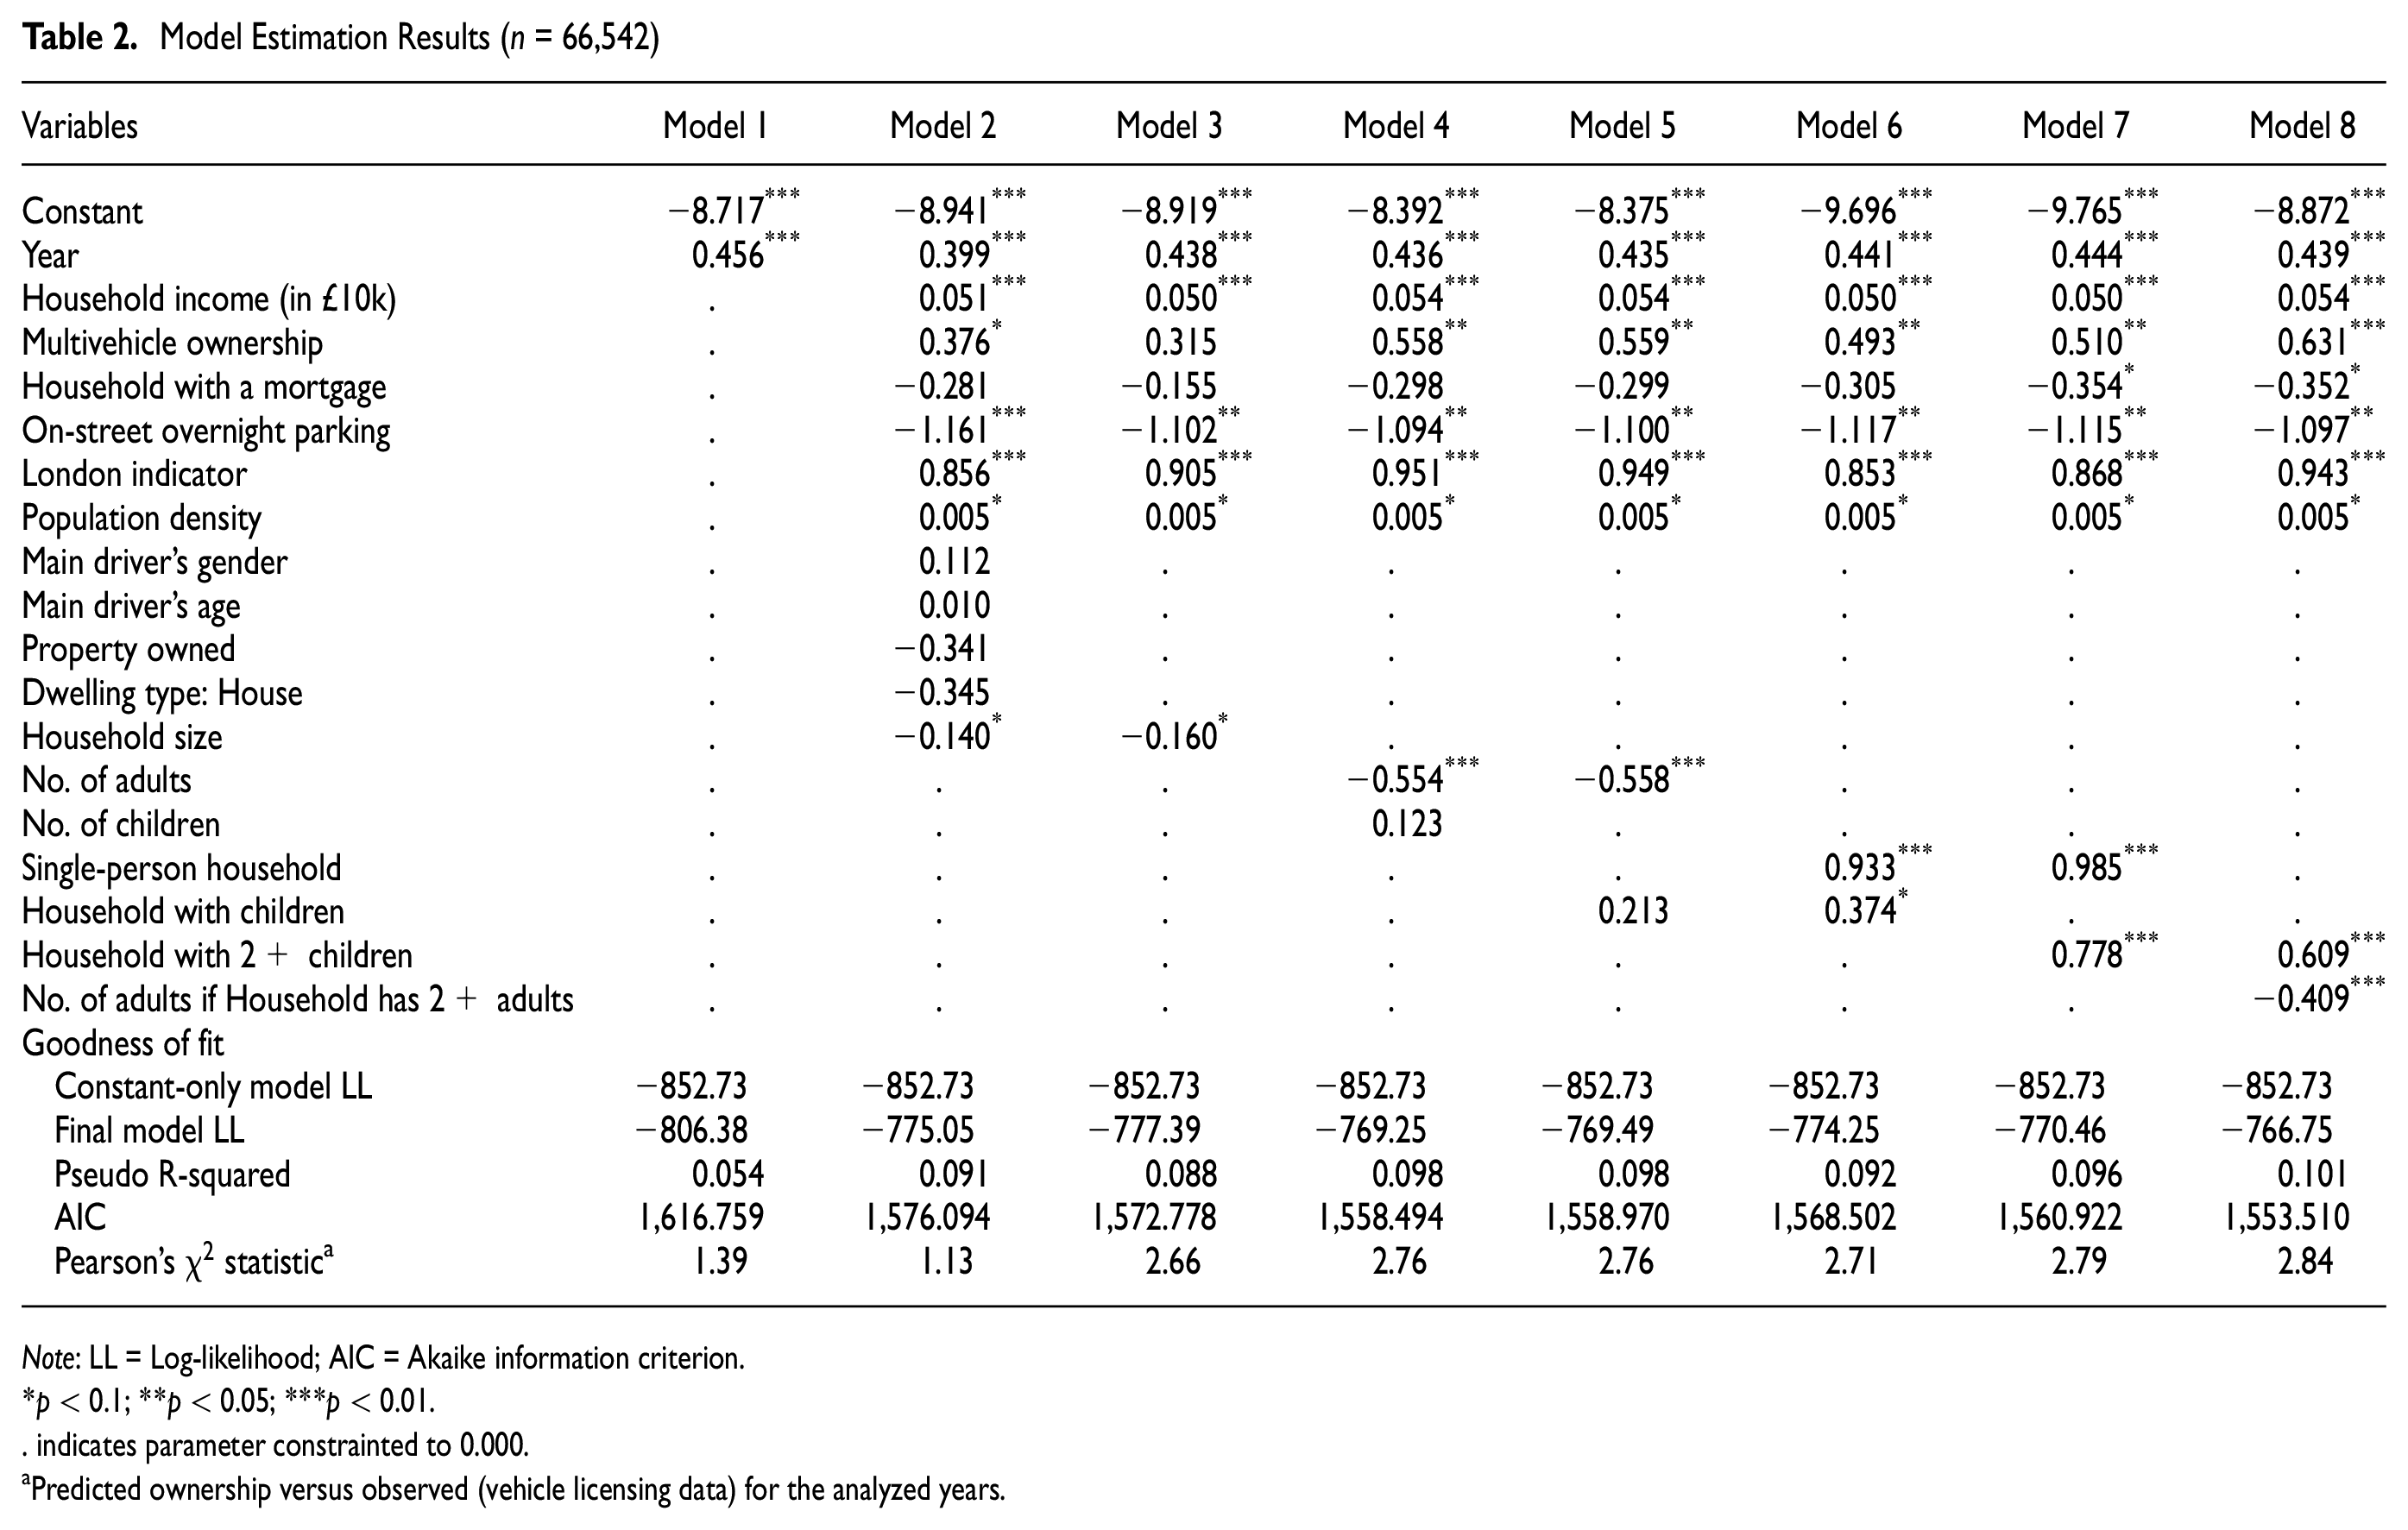
Note: LL = Log-likelihood; AIC = Akaike information criterion.
p < 0.1; **p < 0.05; ***p < 0.01.. indicates parameter constrainted to 0.000.
Predicted ownership versus observed (vehicle licensing data) for the analyzed years.
Overall Model Fit and Cross-Model Comparison
In the case of the overall goodness of fit, we can observe that the incorporation of more variables leads to its improvement, which is expected. In particular, different household structure variables can be specified to capture the effect of household composition, to shed more light on what its role is in shaping BEV ownership. At the same time, the gain in fit must be balanced against the additional complexity. Model 8 was found to have the best fit as well as the lowest Akaike information criterion (AIC). We also observe that the effects of the variables are consistent across the estimated models, providing reassurance with regard to their role and the overall robustness of the model.
Pearson’s chi-squared tests were also conducted to validate the models against the DfT (VLD) statistics by comparing the predicted and observed proportions of the BEV ownership for each year. The
Model Parameters
As discussed above, the overall level of BEV ownership has changed significantly over the years. Model estimation results indicate that the introduction of a year-specific variable can capture the BEV adoption trend. The chi-square test also showed that Model 1 (with only the year-specific variables) can capture the BEV ownership trend over time.
The estimated parameters for household income across all models indicate that high-income households have a higher propensity to own a BEV. This is reasonable as BEVs have been typically more expensive compared with ICE vehicles of similar performance or size. We also observe a lower propensity of BEV ownership among households with a mortgage, which confirms the hypothesis that overall affluence and household debt levels are key drivers of BEV ownership. This is consistent with, for example, the Jia and Chen (2021) study in Virginia, which also noted the role of affluence as a factor in increasing the likelihood of EV ownership ( 11 ). Interestingly, we did not observe any significant effects related to residential property ownership or property type, which is different from previous studies by Patt et al. ( 20 ), though that was from a different geographical context (Switzerland) where property ownership is not necessarily correlated with household income ( 20 ).
Beyond financial and dwelling considerations, multiple-vehicle ownership is also observed to be a significant covariate associated with an increased likelihood of BEV ownership. This observation follows findings in earlier studies ( 15 , 22 , 24 ). This confirms the hypothesis that for some households BEV ownership is in fact complementary to other vehicles, typically an ICE vehicle. Such a mix of vehicles owned would permit the use of a BEV for local trips, while also being able to make long-distance trips or trips to destinations with uncertain charging infrastructure, using the ICE vehicle. We also note that the use of overnight street parking tends to be associated with lower propensity of BEV ownership, which could be a reflection of the lack of public charging infrastructure (especially across the years represented in the data) to allow for overnight charging or concerns with regard to battery performance in cold weather.
As for the geographical factors, the results show that living in an area with higher population density is associated with a higher BEV ownership. This could be because denser areas typically require shorter trips, which is a favorable setting in light of possible range anxiety, especially among some of the early adopters. Furthermore, denser areas are likely to have more charging infrastructure available within easy access, which has been shown to play an important role in determining EV ownership levels ( 11 ). Even controlling for the population density and income, we observe that households located in London are more likely to own a BEV compared with the rest of the UK. This is an interesting finding (and is aligned with the vehicle registration statistics); this effect may be the result of a combination of factors, such as the higher density of public charging points in London compared with other regions in the UK ( 39 ), the density of the built-up area being significantly higher than other cities, as well as the effect of EV-oriented incentives, such as the congestion charge exemption.
Looking at the household structure variables, our results indicate that, in general, the larger the household, the less likely they are to own a BEV. However, further breakdown of household size into the number of adults and number of children provides a more nuanced picture of the household composition effect. On the one hand, Model 4 shows that the number of adults in the households has a negative association with BEV ownership, while the number of children has a positive association with BEV ownership. Models 5 to 8 further explore different household structure variables. While the overall results differ, potentially as a result of non-linearities in the effects of the number of adults and children in the household, there appears to be a general trend toward a negative association with the number of adults and a positive association with the number of children. In general, these effects appear to be the most pronounced when the number of adults or the number of children is two or more. The effect of the number of adults may reflect BEV-related constraints, such as shorter range and longer charging time, which may not support multi-adult usage. In contrast, households with two or more children are more likely to own a BEV. One of the possible explanations could be the use of such vehicles for school runs, clubs, and other errands, which typically involve shorter and more frequent trips with relatively less restriction of range anxiety. At the same time, safety perception could also be at play, for example, concerns over Lithium-Ion batteries catching fire ( 40 ), though it remains unclear how such effects interact with household composition, such as anxiety about traveling with children. While these household composition effects are novel and certainly require further research, they help explain contradictory results concerning the household size effects reported in the literature ( 15 , 18 , 22 , 26 , 30 ). In particular, such results may have been the result of not accounting separately for the number of adults and children or not taking into account potential non-linearities in the postulated associations, for example, becoming pronounced only at the level of two or more adults or children respectively.
Finally, we could not find a statistically significant association between gender or age of the main driver in the household with BEV ownership. While such effects were postulated in some previous studies ( 16 , 24 ), the role of such individual attributes may perhaps be smaller in household-level models, which are more appropriate for the vehicle acquisition decision.
Model Application to Forecast BEV Ownership
We use the estimated parameters in Model 8 to predict BEV ownership rates in the UK for the years 2021 to 2025, by extrapolating the impact of the year-specific trend. At the same time, we do not vary any other variables, so this could be considered a baseline scenario where no changes are observed in the other covariates (such as household incomes). As with any model-based forecasting exercise, we assume that the parameters of the model are temporally stable. Despite the limitations of these assumptions, the forecasts can be broadly used to assess the impacts of policies on BEV ownership; for example, if the issue of on-street parking is not addressed or if the regional disparity in BEV adoption (London as compared with other regions) continues. The BEV ownership prediction results are shown in Figure 8. The predicted trends are consistent with the expected initial part of the S-shaped adoption curve (cf. section 3.2), suggesting that it may be appropriate to use this model to study the impact of different policies or trends on BEV ownership.
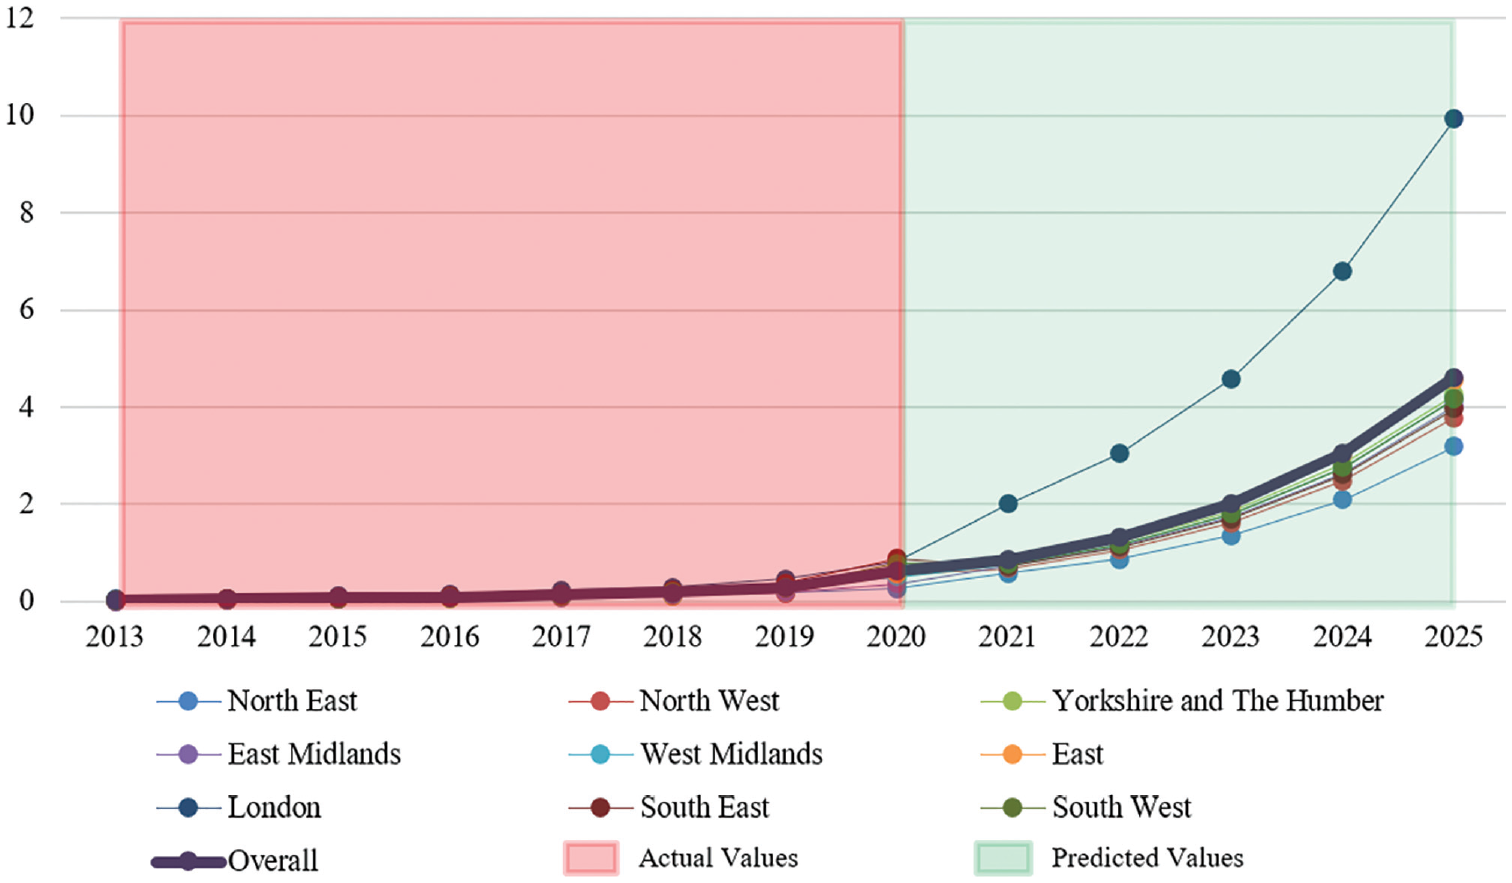
BEV penetration rates in the UK: actual and future year forecasts based on the estimated model.
To further validate the model, the prediction made for 2021 can be compared against the recently published DfT’s VLD for 2021. In particular, the model predicts the proportion of BEV ownership of 0.86% with a 95% confidence interval of 0.81%–0.91%. The published BEV penetration rate is 0.8995% which is within the predicted 95% confidence interval.
Conclusions
This paper contributes to the body of research focused on understanding the determinants of BEV ownership. In line with previous studies, household income, multiple-vehicle ownership (in response to range anxiety), and overnight on-street parking (with insufficient public charging infrastructure) are found to be influential factors. On the other hand, households with a mortgage loan, geographical attributes such as population density and the “metropolitan” or “London” effect, and household composition variables such as number of children (positive effect) and number of adults (negative effect) are new factors found in this study. This study is also the first to make regional-specific BEV ownership predictions for government office regions across England, based on a model calibrated with observed and disaggregate EV ownership data.
We find in our analysis that financial considerations are critical for BEV adoption. More rapid BEV uptake is therefore highly reliant on reduced BEV purchase price, or continued subsidy-based incentives that are means tested. Meanwhile, the rapid rise in energy prices in 2022 could also be a potential issue affecting BEV purchase. A study from 2022 found that the prevailing price of electricity would push yearly EV charging costs above the fuel cost of an ICE vehicle if owners must rely on rapid public charging infrastructure ( 41 ). This can significantly increase the barrier to EV adoption, indicating the criticality of more attractive public charging price schemes to incentivize BEV ownership in the long run.
In addition, despite major improvements in the BEV range in recent years, range (anxiety) appears to be another barrier for potential BEV owners. In the current analysis, we observe EV ownership to be greater in multivehicle households. This appears to be particularly the case for households in low population areas, which require longer travel distances. In this case, BEV is a complementary vehicle to ICE, not its substitute. A similar concern appears in multi-adult households (single-person households have a higher BEV adoption rate than multi-adult households, having accounted for household income), perhaps because of the concern that the BEV might not have sufficient range to support the travel needs of multiple adults. Therefore, unsurprisingly, there is a continued strong motivation to develop batteries supporting a longer range of BEVs with higher energy efficiency. At the same time, the consumer interest in heavier Sports Utility Vehicles (SUVs) can quickly offset the improved battery performance. Nonetheless, the synergy effect for households that have more children, for example, similar route for school trips for the two children restricting the impact of BEV range limitation, should be emphasized by encouraging such households to switch from ICE vehicles to BEVs. The promotion can be carried out jointly by local authorities and schools, including incentives such as charging points in the proximity of schools and designated EV parking. This has the added advantage of improved air quality near schools.
Based on the prediction model for future BEV adoption, we see that there would be a 4.6% BEV adoption rate in the UK in 2025. This is, however, far below the 20% of road vehicle electrification required to achieve the Paris Agreement ( 9 ) commitments. Moreover, the regional analysis shows that a large proportion of the adoption will be concentrated in London while regions such as the North East and North West will face lower BEV ownership levels.
This observation emphasizes the need for BEV policies and incentives, without which the aforementioned adoption target looks unachievable. Thus, policies enabling public charging infrastructure should be considered, especially in the low penetration regions. Similarly, income or mortgage considerations may motivate design of targeted incentives for medium- and lower-income households as well as those with mortgages.
Despite challenges resulting from the sparsity of BEV observations, this research has shown that analysis of RP data with regard to BEV uptake yields results consistent with the prior SP studies. Beyond the empirical findings, this research can facilitate future efforts in designing RP surveys toward a deeper understanding of the BEV purchase decision, such as understanding the motivations among households with different household compositions. In addition to the inferential capabilities of the model, its predictions can serve as a reference for assessing whether the proposed policies and incentives for BEV adoption are altering the do-nothing adoption trajectory.
Last but not least, the detailed household composition analysis highlights the need for a more comprehensive understanding of the household-related factors that are often represented only crudely in transport models. Understanding these factors better may highlight issues that are currently not well understood in the transition to e-mobility. While the analysis in this paper has shown evidence for non-linearities in BEV adoption, it is possible that similar effects are present elsewhere. For example, information concerning the nature of on-street parking (availability of infrastructure, proximity to the residence), typical activities for which vehicles are used, for example, in relation to children’s activities or the nature of the mortgage and credit rating, though difficult to collect, may provide some novel insights into why households choose to own a BEV (or not).
Footnotes
Author Contributions
The authors confirm contribution to the paper as follows: study conception and design: Justin Yiu, Jacek Pawlak, Ahmadreza Faghih Imani, Aruna Sivakumar; data collection: Justin Yiu, Jacek Pawlak, Aruna Sivakumar; analysis and interpretation of results: Justin Yiu, Jacek Pawlak, Ahmadreza Faghih Imani, Aruna Sivakumar; draft manuscript preparation: Justin Yiu, Jacek Pawlak. All authors reviewed the results and approved the final version of the manuscript.
Declaration of Conflicting Interests
The author(s) declared no potential conflicts of interest with respect to the research, authorship, and/or publication of this article.
Funding
The author(s) disclosed receipt of the following financial support for the research, authorship, and/or publication of this article: The authors acknowledge the support from the Integrated Development of Low-Carbon Energy Systems (IDLES) research programme at Imperial College London funded by the Engineering and Physical Sciences Research Council (EPSRC) Programme Grants (EPSRC Grant No. EP/R045518/1). In addition, the authors acknowledge the support from the Energy Demand Research Centre (EDRC) research programme funded by the Engineering and Physical Sciences Research Council and the Economic and Social Research Council (Grant No. EP/Y010078/1).