
Abstract
During the early phases of the COVID-19 pandemic, the temporary limitations to in-store shopping during the lockdown period generated a significant increase in online shopping. During that period, the total spending amount and the number of online purchases increased across the whole population, although with rather heterogeneous patterns among various groups of consumers. This research examines the factors that can help explain the differences between users and non-users of online shopping in the U.S.A. during April and May 2020 to help understand the barriers to home-based shopping accessibility. The study uses data collected in the first survey wave of a longitudinal mobility study to analyze individual commodities and delivery options chosen for goods purchased online. Binomial logistic regression and Poisson regression models reveal differences in adopting e-shopping across various delivery channels, the frequency of purchase, and shipping used across commodities. In addition, a latent class cluster analysis identifies three heterogeneous groups of shoppers whose members differ mainly in income, age, education, neighborhood type, and technology attitudes. The results also highlight several differences in usage across crowdshipping markets and novel delivery options, such as in-store or locker pickup. The results also show variation in home-based accessibility across numerous factors during the pandemic.
Keywords
Online shopping has experienced steady growth in both total spending and share of retail spending in the U.S.A. for 20 years ( 1 ). In response, logistics providers and shippers have built their infrastructure to handle increasing volumes and compete for and generate more demand. Increasingly, consumers expect fast and reliable shipping, logistics, and delivery to get their orders as quickly as possible, resulting in the emerging and growing market of same-day delivery (or faster), requiring products to be located very near to the consumer as well as a workforce capable of the cost-effective delivery of goods ( 2 , 3 ). This type of service has increased in the marketplace because many consumers are willing to pay a premium for fast delivery.
The three most common types of same-day delivery are those offered by the seller, third-party logistics providers, and crowdshipping platforms ( 4 ). For example, it is common to get pizza and dry cleaning delivered by the seller because these have long been time-sensitive services. Similarly, grocery stores developed online food delivery for shoppers with transportation challenges. For third-party logistics services, same-day delivery is a natural progression from the previous fastest overnight delivery option. This has been adopted by various traditional couriers, including DHL, FedEx, USPS, and UPS, on a limited basis, although these services often have very high costs.
In contrast, retailers and e-tailers offer many services at minimal cost when there is a large consumer base with access to membership plans or capabilities to offer free expedited deliveries included in a membership fee. Lastly, crowdshipping has emerged as a cost-effective option for same-day delivery by leveraging lower labor costs and hyper-local trips to build a service that suits drivers and consumers ( 4 ). In the U.S.A., the COVID-19 pandemic led to an explosion of growth and awareness of these services ( 5 ). Since then, crowdshipping companies have mostly not been profitable but continue seeking a niche as a business model across various commodities ( 4 ).
Surveys have been conducted in the U.S.A. over the last decade, providing insights into how shopping behaviors and the delivery channel market have historically grown and developed ( 6 – 12 ). While there is ample research on shopping behaviors and a growing literature uncovering the sustainability impacts of online versus traditional in-store shopping, behaviors related to delivery service choice and channel are less understood. Furthermore, recent evidence shows that these services can significantly affect home-based shopping accessibility, as demonstrated during the pandemic. However, this improved accessibility may not be universal and can have equity considerations ( 13 , 14 ). Consequently, there is a need for rigorous survey-based research on the intersection of commodity types and delivery choices during the pandemic. It is also essential to quantify the effects of these delivery choices resulting from significant changes in accessibility during the early stages of the COVID-19 pandemic because this period offers an opportunity to understand how behaviors might have changed while under a stressed delivery system (i.e., online shopping serving as a major accessibility channel). More importantly, they provide insights into the types of temporary and permanent behavioral changes.
Thus, this paper examines e-commerce shopping behaviors during the COVID-19 pandemic to help understand the market and consumer preferences. This paper seeks to answer the following research questions. (i) How did online shopping behaviors and delivery channel choices vary across different types of individuals? (ii) What factors account for the choice of delivery channels, and how are the types of commodities related to the choice of delivery services? (iii) What factors characterize those without access to online shopping during the height of COVID lockdowns? The study focuses on the differences in the type of commodities and delivery methods among online shoppers during the early stages of the COVID-19 pandemic through econometric and other statistical analyses on data collected in Spring 2020 as part of the COVID-19 Mobility Study at the University of California Davis ( 15 , 16 ). The survey considered eight types of commodities, namely (1) electronics, (2) books, CDs, and media, (3) medicine, (4) clothing, (5) restaurant delivery, (6) fresh food delivery, (7) local farm delivery, and (8) other household items. The six delivery methods are same-day delivery (e.g., Instacart), 1- or 2-day delivery (e.g., Amazon Prime), standard domestic delivery (3+ days), curbside pickup (e.g., Costco), locker pickup (e.g., Amazon Locker), and international shipments with longer delivery time.
Specifically, this paper (1) conducts a comparative analysis of online shopping behaviors related to the type of deliveries and commodities during the early stages of the COVID-19 pandemic; (2) employs binary logistic regression models to analyze the effect of different factors on shopping preferences of various commodities and delivery options, Poisson regression models to understand the frequency of such shopping preferences, and a latent class cluster analysis (LCCA) to investigate the characteristics of individuals by delivery option preferences; (3) analyzes the relationship between delivery service and commodity type; and (4) evaluates the equity implications of home-based shopping accessibility. The research identifies gaps and provides policy suggestions and future research recommendations to help understand online shoppers’ backgrounds and behaviors.
Literature Review
The U.S. retail e-commerce has increased steadily over the last decade (Figure 1), with the COVID-19 pandemic tripling growth in the second and fourth quarters of 2020 as stores and dine-in restaurants shut down ( 1 ). Even before the pandemic, several researchers have tried to understand the factors that have affected and will continue affecting consumer preferences toward online shopping ( 17 – 19 ).
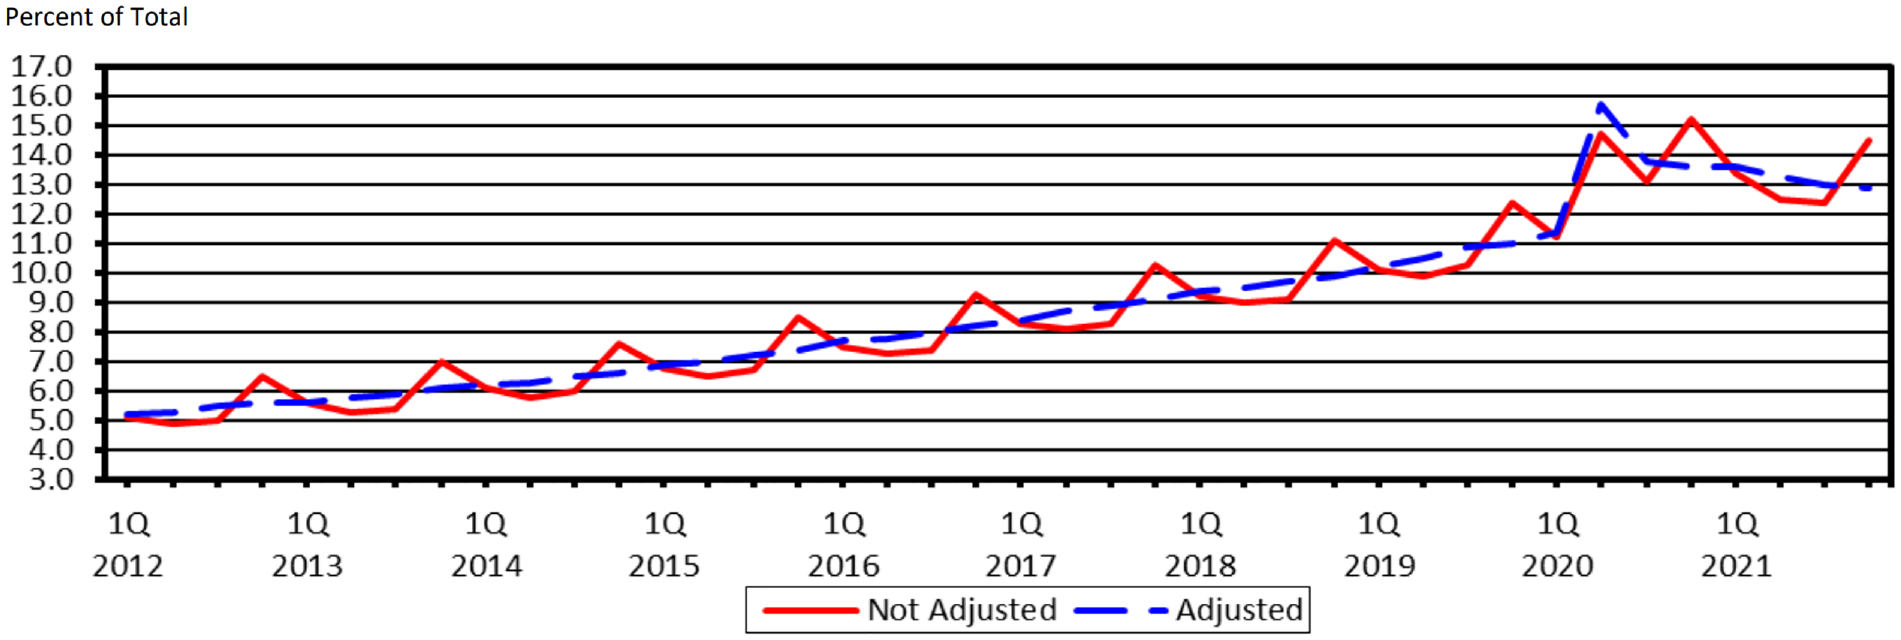
Estimated quarterly U.S. retail e-commerce sales as a percent of total quarterly retail sales: first quarter 2014–second quarter 2023 ( 1 ).
Generally, factors attributed to frequency and propensity of e-commerce use include early adoption of technology, Internet use skills, interest in the product category, and positive attitudes about online shopping; security and privacy concerns are less significant predictors ( 17 , 19–21). In marketing surveys, convenience is cited as the strongest motivator for shopping online, with pricing being a distant second factor ( 22 ). With respect to demographics, age is a significant factor in online shopping frequency, although reasons for this remain unclear ( 8 , 20 ). The effects of the neighborhood also remain ambiguous ( 23 ). Some studies have shown a correlation between low access to brick-and-mortar stores and online shopping, while others have shown a general increase in online shopping for people in more urbanized areas ( 24 , 25 ). Such discrepancies are lessening with time as smartphone adoption becomes nearly universal in the U.S.A. ( 24 ).
The role of the commodity and delivery service has also received attention, although the lack of data has limited the depth of analyses ( 13 , 14 ). Some commodities seem to be more appropriate for online shopping than others. Moreover, new delivery services such as crowdshipping have improved access and delivery times compared to traditional shipping methods ( 4 ). For groceries and prepared food, which are best enjoyed at a specific temperature and have a high risk of spoilage, crowdshipping and other faster delivery methods perform better ( 3 ). For other commodities, including heavy and bulky items such as furniture, which seem less suitable for online purchases, new market players (mostly e-retailers) have found their niche in offering these bulky goods at competitive prices, even when including shipping costs.
A handful of studies are looking at last-mile delivery services, such as alternate pickup locations (e.g., lockers), new modes of transport, and crowdshipping. For the latter, one study ( 3 ) proposed a general typology that helps understand the different services and operational modes considering delivery type, mode, and pricing. Other studies evaluated the factors influencing the willingness to pay for crowdshipping. They found that commodity type, shipping cost, service characteristics, prior performance, courier reputations, tracking info, and customized delivery time and location are all significant determinants of using crowdshipping over traditional third-party logistics ( 4 , 6 , 26 ). Additional studies have analyzed the attitudes and use of these services in the U.S.A. and the European Union (EU), highlighting the effect of urban area type and the possibilities to use different modes to conduct last-mile deliveries ( 10 , 27 , 28 ).
Moreover, recent research has provided insights into potential changes in consumer demand during the COVID-19 pandemic. One study ( 7 ) cited the convenience of online shopping and pricing as highly influential on online shopping, and another study ( 13 ) reported a shifting role of gender and neighborhood type, with women and suburbanites more likely to shop online during the pandemic. High income and educational attainment positively correlate with online shopping frequency ( 13 ). Other research showed that women shopped for groceries more than men online and in total, but more men shopped in person only during the early stages of the pandemic ( 29 , 30 ). The pandemic forced all age groups to shop online, shifting consumer preferences not only of younger groups (18–34 years old) but also of older consumers ( 30 ). In contrast, one study ( 12 ) argues that pleasure strongly influences the online shopping intentions of Generations Y (born 1982–1996) and Z (born 1997–2012).
Freight logistics and delivery systems also influence COVID-19 shopping behaviors. Online shopping has changed from a luxury to a comfortable option to a health-supporting solution that reduces the risk of COVID-19 exposure during the lockdown and restrictions across the U.S.A. ( 13 , 31 ). In this sense, researchers have analyzed online shopping and deliveries as a form of home-based accessibility ( 14 ). In summary, while many studies have focused on analyzing the online shopping frequencies and the characteristics of customers, few studies address delivery options and their association with the type of commodities. In addition, there is a gap in the availability of data that comprehensively capture the current landscape of delivery options and services in the U.S.A. This study uses rich survey data from the Spring 2020 COVID-19 Impacts on Activities and Mobility online panel to fill this gap and examine the frequency of purchases by commodity and delivery option ( 15 ).
Data
This study uses the three-revolution future mobility (3RFM) Spring 2020 COVID-19 Mobility study dataset ( 15 ) that contains information about participants, including impacts of COVID-19, socioeconomic background, vehicle ownership, travel behavior, attitudes and use of emerging transportation services, and shopping patterns. There are 10,817 observations from the survey used in the study (see Table 1), with respondents recruited using three approaches. Firstly, some respondents were recruited from previous surveys conducted by the same research team in 2018 and 2019 (N = 1274) ( 7 ). Secondly, a quota sampling technique was used to find participants using an online opinion panel vendor (N = 8353) with targets for specific groups of people based on their socioeconomic characteristics. The characteristics targeted included race, ethnicity, gender, age, income, employment status, and children in the household. Thirdly, listservs and social media were used to recruit additional respondents to improve the sample size (N = 1723). This sampling methodology aimed to mirror the characteristics of the residents in major regions of the U.S.A. as targeted through quota sampling, although the sample would by no means be perfectly representative because the sampling process was non-random. Thus, note that this survey sample may suffer from potential sampling biases associated with the use of quota sampling and the use of an online survey (although many of these limitations are common to many other studies carried out in particular during the pandemic, because of the limited ability to carry out other types of data collections).
Distribution of Relevant Socio-Demographic Variables (N = 10,817 Observations)
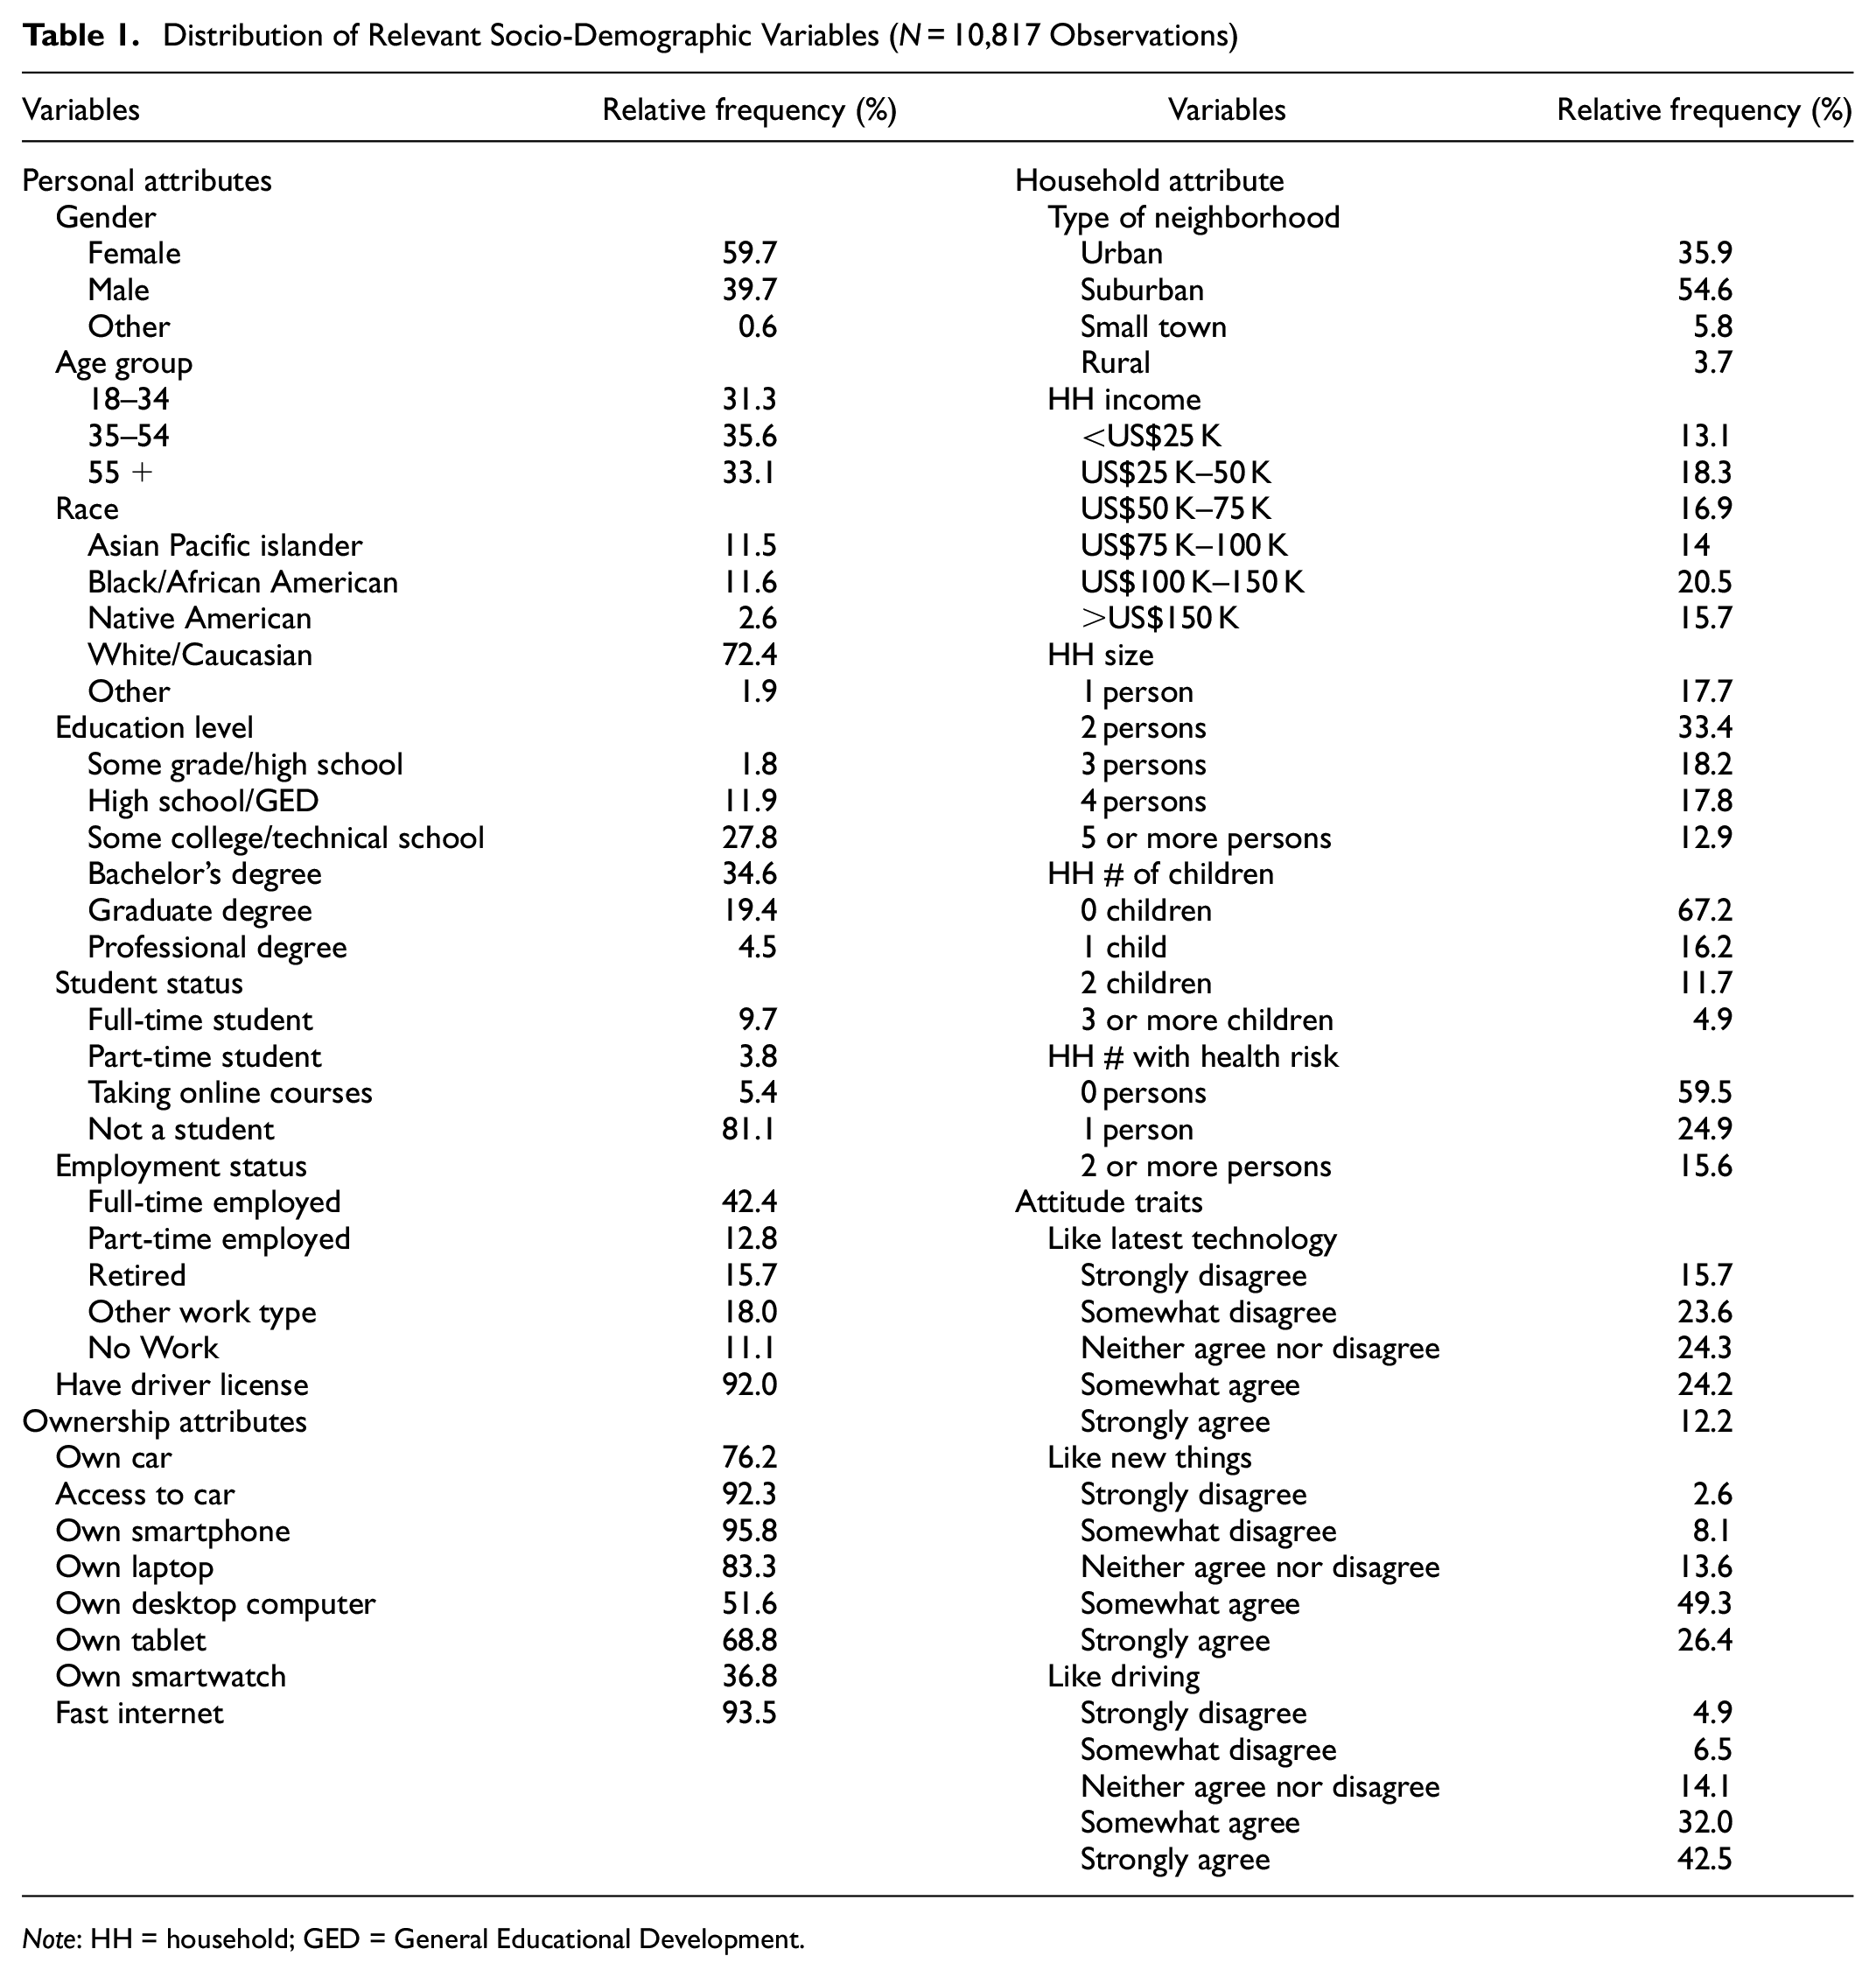
Note: HH = household; GED = General Educational Development.
The survey recorded the number of online purchases of eight commodities and six delivery options in the last 30 days in numeric values (e.g., the number of online purchases from April 1 to 30, 2020). Commodities include (1) electronics, (2) books, CDs, media, (3) medicine, (4) clothing, (5) restaurant delivery, (6) fresh food delivery, (7) local farm delivery, and (8) other household items. Meanwhile, the delivery options are same-day delivery (e.g., Instacart), 1- or 2-day delivery (e.g., Amazon Prime), standard domestic delivery (3+ days), curbside pickup (e.g., Costco), locker pickup (e.g., Amazon Locker), and international shipments with longer delivery time. This information explores the relationship between online shopping frequencies by commodities/delivery options and attributes of online shoppers, such as age, gender, employment, car access, income groups, and neighborhood type.
A data review shows that most responses are of high quality (consistent across similar questions, with other studies and media reports), with some responses not highly reliable (at least their face values). Therefore, the data might provide seemingly incorrect interpretations by respondents with respect to the online shopping purchase frequency questions.
For example, several respondents reported making more than 50 online shopping purchases per day during the survey period or having online groceries delivered multiple times daily. The authors attribute this to respondents thinking they need to report the value of purchases or the number of individual items of all purchases. Similarly, many respondents reported significantly different numbers of purchases by commodity than the purchase count from delivery options. It might be possible for purchases from different commodities to be shipped together, leading to slightly higher numbers of commodity purchases. Still, in many cases, the commodity purchase count was off the shipping option purchase count by more than 10. The authors removed all respondents with more than 60 total purchases to address this data issue. This resulted in less than 100 respondents (less than 1%) being removed, which only minimized the sample size.
Data analyses distinguished two attribute groups: (1) person attributes: age, gender, race, employment status, student status, educational background, car access, device ownership, and attitude toward technology; and (2) household attributes: type of neighborhood, household income, and household size. Household income, age, neighborhood type, device ownership, and technology attitudes strongly correlated with e-commerce shopping frequency. Figures 2 and 3 show the relationships among age, technology attitudes, and ordering frequency. The study used the average number of purchases instead of the median because many respondents did not purchase those commodities regularly, which makes the median (close to) zero. Commodity types with strong negative correlations with age include clothing, other, and restaurant delivery, and gender, race, driving attitudes, and car access did not show strong relationships with e-commerce frequency. Only medicine purchases positively correlate with age. Figure 4 shows that the most consistent indicator for purchase frequency was the extent to which the respondent liked new technology.
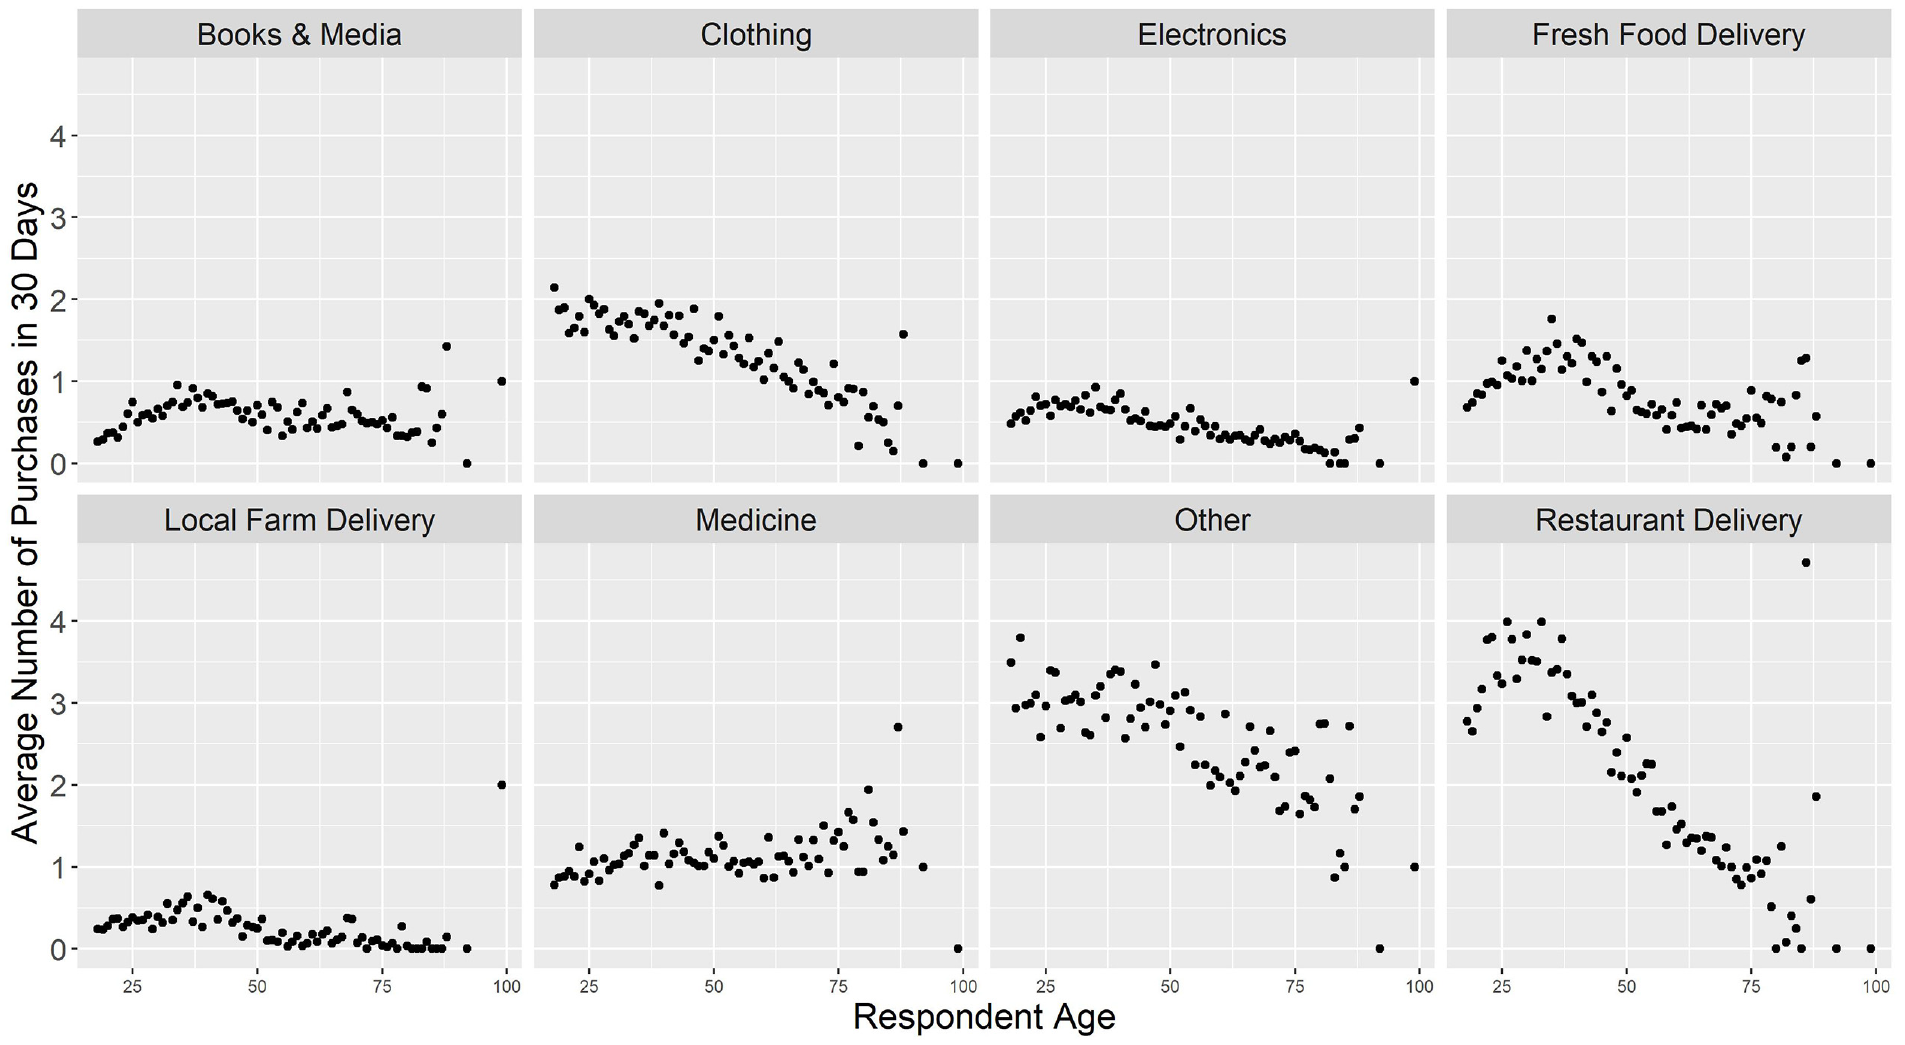
Online shopping frequency by type of commodities by age (N = 10,817 observations).
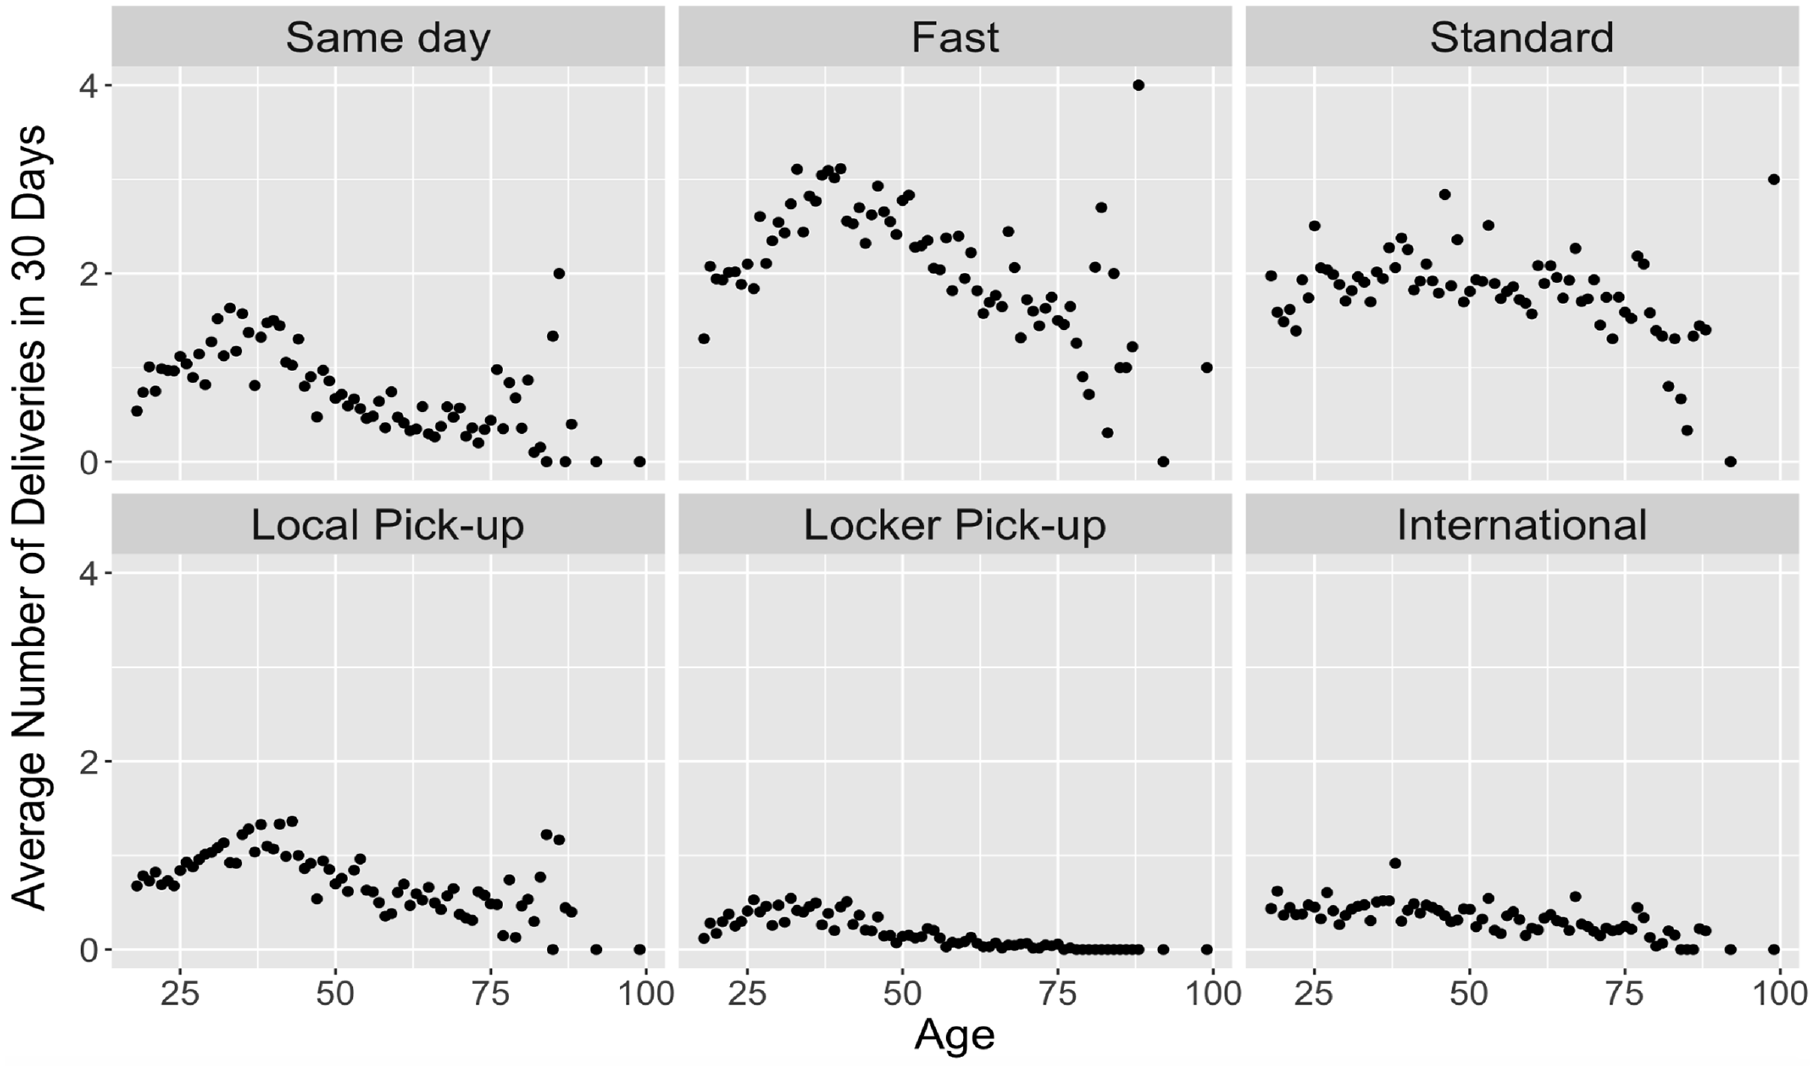
Online shopping frequency by type of deliveries by age (N = 10,817 observations).
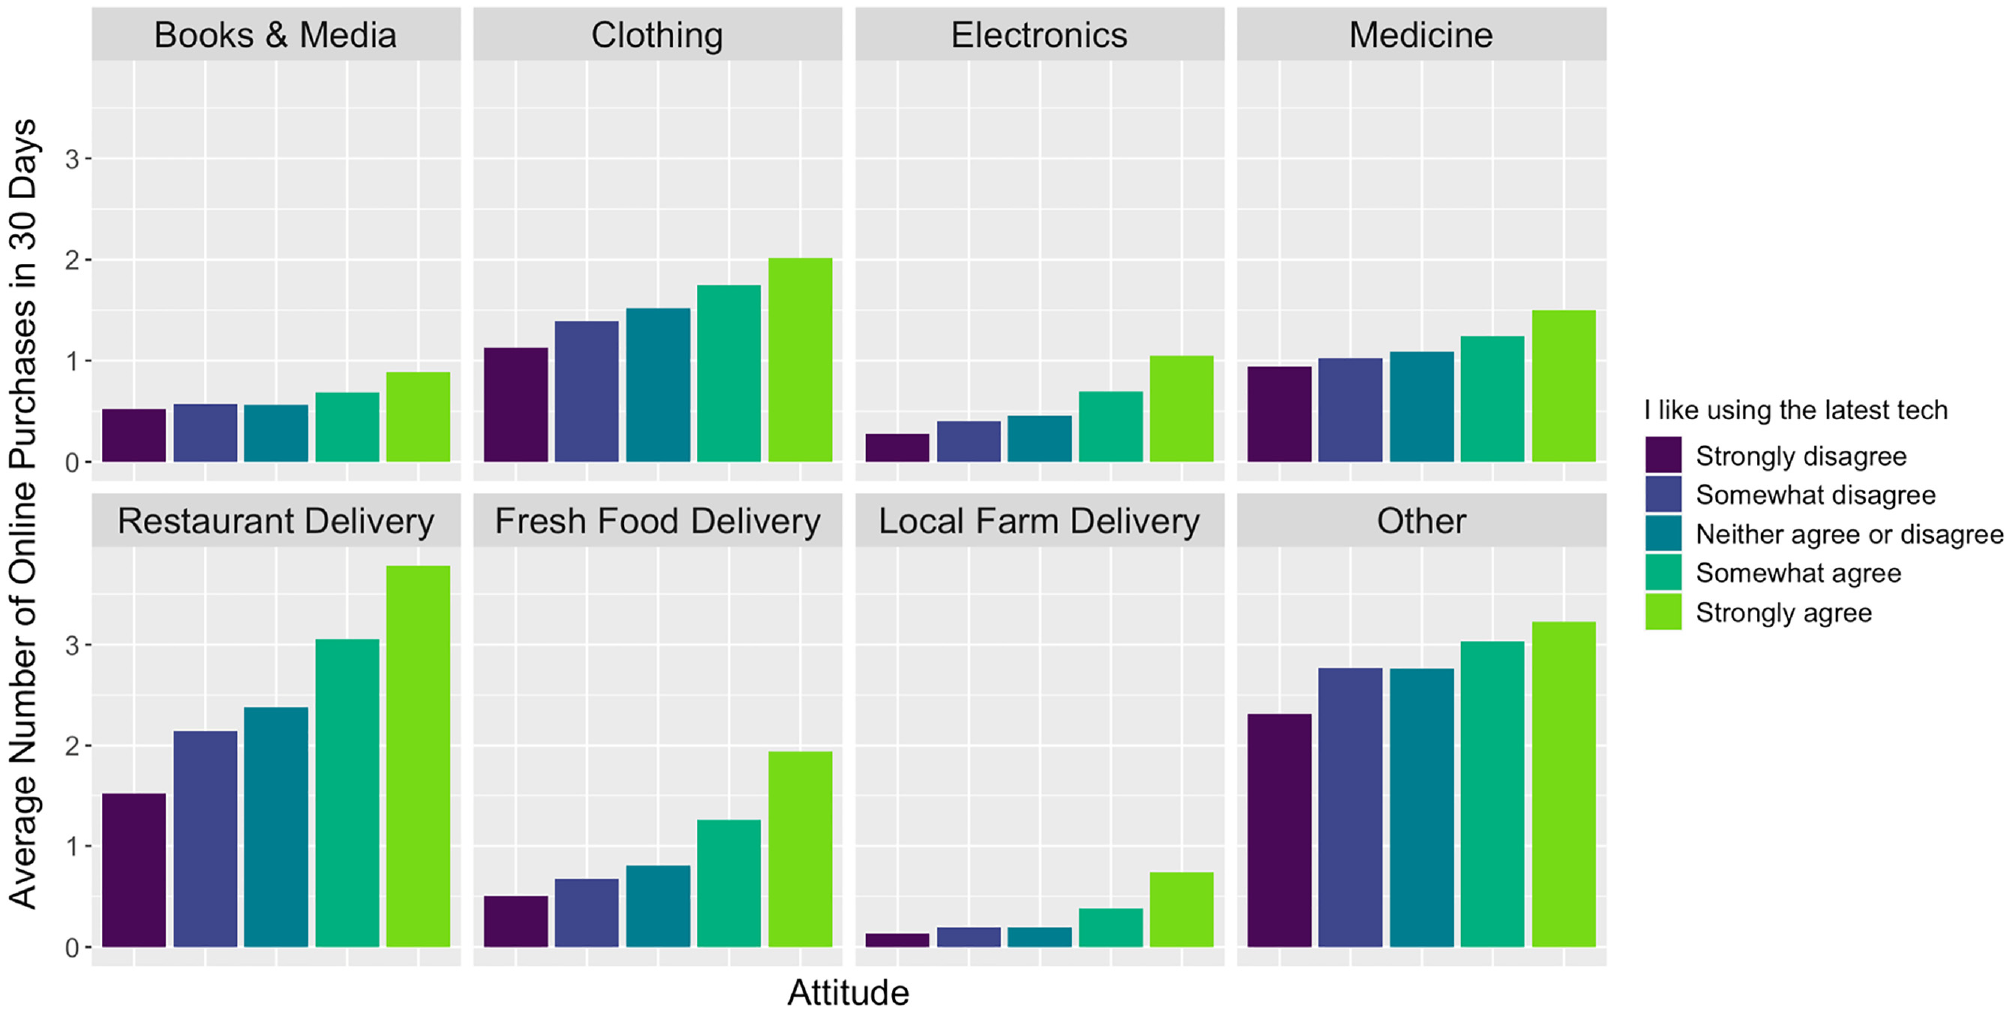
Online shopping frequency by technology attitude (N = 10,817 observations).
Methodology
This study implements a multipronged approach to analyze factors influencing commodity and delivery options. Binary logistics regression can help evaluate the effect of different factors on the preferences for commodities and delivery options. Specifically, the study aims to understand factors that explain the usage or non-usage of online shopping for a particular commodity or by a particular delivery option. Poisson regression provides a deeper insight into how personal characteristics influence the frequency of purchases across commodities and shipping options. The authors modeled five commodities using these two methods, excluding the local farm delivery because of very low respondent utilization. In addition, the study analyzed three delivery options—same-day, locker pickup, and local pickup—because these are the most associated with crowdshipping and providing new delivery forms during the pandemic.
Many characteristics that help predict binary usage or non-usage in the logistic model also predict frequency in the Poisson model. Still, notably, far fewer characteristics pass the muster of the p-test. The authors employed LCCA based on individuals’ shopping behavior and the chosen delivery options to better understand the various types of shoppers in the sample. LCCA helps identify unique characteristics of members of each group with similar behaviors and choices. In this study, the LCCA focuses on all six types of delivery options. In addition, weighted linear regression provides a mechanism to relate commodity types and delivery options chosen, as the data does not directly assign a delivery option to each item purchased. Thus, all possible delivery options are included for each model, except for one if it is not feasible (such as international shipping for grocery delivery). For each model, the variable inflation factor (VIF) test measured the effects of multicollinearity on the model and helped identify variables with a VIF greater than five for removal, one at a time. Generally, variables with a VIF > 5 exhibit high collinearity and may lead to confounding.
Binary Logistic Regression
These models explore the relationship between consumer characteristics and online shopping behavior by types of commodities and delivery options. Logistic regression predicts the probability that an observation falls into one of two categories of a dichotomous dependent variable based on one or more independent variables that can be continuous or categorical. Thus, this model aims to investigate and understand the people who purchased each commodity online or used each delivery option. This analysis used the Akaike information criterion (AIC) values and a p-value threshold of 0.1 or less to identify insignificant variables. When two models explain the same amount of variation, the authors selected the model with fewer variables as it has a lower AIC value and, thus, provides a better fit. Using forward and backward step-wise regression, each insignificant variable was removed one at a time by comparing the AIC values. This analysis provides preliminary information on online shopping behaviors based on various variables. It also gives a reasonable estimation of each delivery option’s level of access or utilization because those without access to a given option cannot inherently make any purchases. However, this analysis performs poorly in capturing a more complex or non-linear relationship. Further analyses are needed to support the results.
Poisson Regression
A Poisson regression leverages the frequency-based nature of the 3RFM data and helps explore relationships between consumers and the commodities they purchase. Poisson regression estimates the count of an integer based on one or more continuous or categorical independent variables. It assumes that the mean equals the variance across the survey population. Here, commodity and delivery options are the dependent variables. In summary, using predictor variables from Table 1 as xn, the Poisson model estimates the shopping frequency of online shopping λ, as follows:

A significant advantage of using this type of analysis over the binary model is that it shows nuances to attributes that affect the number of purchases rather than those that affect any purchases. Nonetheless, one of the significant challenges is that for some commodities and groups of people, people making zero purchases in a given category skewed the data. This generally worsens the fit of the Poisson model. A quasi-Poisson or negative binomial distribution model can help to deal with the presence of zero inflation in some of the commodities. Still, the authors used the Poisson model across all these commodity types and shipping option categories for consistency.
Latent Class Analysis
Latent class analysis (LCA) identifies samples’ latent (unobserved) class based on responses of observed variables that often share specific outward characteristics ( 32 ). Figure 5 shows the conceptual model of LCA as implemented in this study.
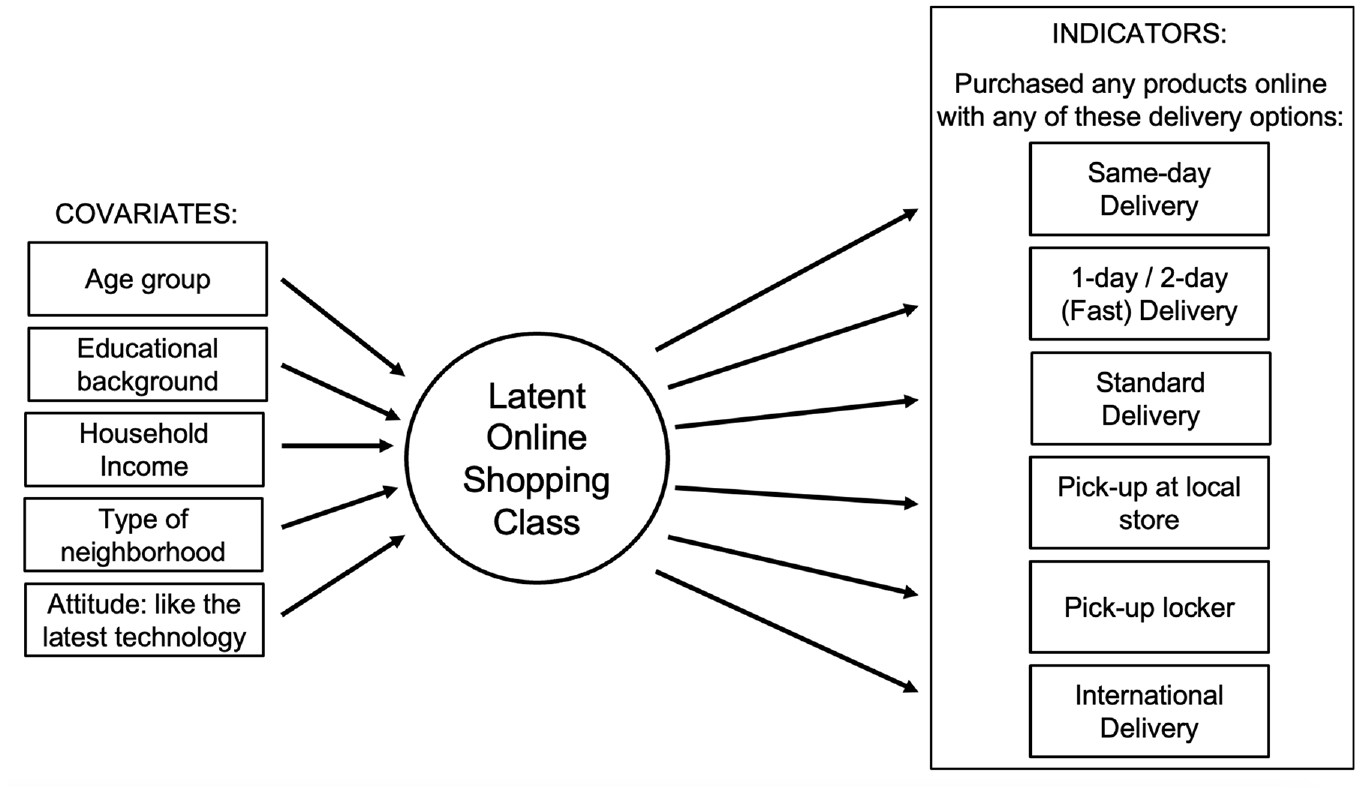
Conceptual model of latent class analysis.
The authors removed observations without complete information or answers to the list of covariates that might create issues with the LCA analysis. Thus, the LCA analysis considered 8490 observations. Indicators of this LCA model are survey respondents’ six delivery options when purchasing products online. Responses to each delivery option are classified as “zero” (i.e., for those with few or no purchases), “low” (i.e., for those conducting one to three purchases), and “high” purchases (i.e., for more than three monthly purchases). This classification considers the mean, median, and percentile values of each delivery option. The authors used the Bayesian information criterion (BIC) as the quality of fit measure. In addition, interpretability is also considered a factor along with statistical criteria.
The list of covariates is based on the result of the explanatory analysis (Figures 2 and 3). The five covariates used in the LCA model are age group, educational background, household income, type of neighborhood, and attitudes toward technology (e.g., if a respondent likes to be among the first people to have the latest technology). After finalizing the number of classes using fit statistics, these covariates are added to the model to identify the socio-demographic characteristics of each latent class.
Although LCA is a helpful statistical method, it has limitations as it highly depends on the probability of individuals being a part of a group based on the chosen indicator variables ( 32 ). Moreover, class names should be chosen carefully to reflect the class characters properly and avoid inaccurate or biased results.
Weighted Linear Regression
This study seeks to quantify the popularity of each shipping option across each category of goods purchased online to relate commodity to delivery choice. As mentioned, this issue cannot be directly addressed because in the survey design the respondents did not assign their purchase counts directly to shipping options. As an alternative, the relationships between these two sets of variables can be inferred using a linear model:

where Y represents the shipping option frequency, x represents the frequency of each commodity purchased, and β represents the fraction of the commodity purchases that are shipped with the given option Y. Using this framework, β coefficients effectively estimate the market share of each shipping option for the given commodity among survey respondents. A limitation of the simple linear model here is that each respondent has a different data quality for estimating the market share of shipping options. In most cases, the share of goods for each shipping option can only be estimated. Based on the Breush–Pagan test for heteroscedasticity, the unweighted linear model is heteroscedastic for each Y with a p-value of nearly zero. Thus, the authors chose a weighting vector for each Y value to proxy for how trustworthy each observation was in estimating market share. Because a person with a high proportion of goods coming from the given shipping option would undoubtedly be trustworthy, the weighting vector w was chosen as follows:

Using this weighting, the models for estimating each Y became homoscedastic, adjusted R2 values improved, and p-values decreased for all independent variables. This weighting excludes all observations for which Y was zero while weighting shoppers with higher proportions of their purchases shipped with a given delivery option. For the locker pickup and the international shipping models, acceptable Breush–Pagan test results were achieved while removing the squared term in Equation 3; for other models, the term was necessary to remove heteroscedasticity.
The most significant limitation of this model is that for an actual “market share” to be found, the number of purchases listed by a respondent must match the number of shipping options chosen. In practice, this is not the case. Some of this mismatch can result from bundling in a purchase spanning multiple categories sent in one shipment. Some of this may result from confusion about an online “purchase.” Either way, in practice, the beta coefficients from these models represent an estimate of the market share, which is likely closer to the mean than reality. Market shares above 50% are likely overestimated, and those close to zero are underestimated. Nonetheless, this analysis provides an understandable estimate of the market share based on a reasonable weighting with the data available. Future work surveys should directly ask for the shipping option of each purchase and establish survey designs to limit the respondent’s burden.
Empirical Results
Binary Logistic Regression Results
Table 2 shows the binary logistic regression models for each type of commodity and delivery option and provides p-values for various indicators, with green and red shading indicating a positive or negative effect, respectively. The influence of each statistically significant variable on the model for each commodity or delivery option is calculated. Variables are classified into five groups: household (HH), personal, ownership, attitudes, and revealed preference frequency. Here, “-” indicates that a variable is not statistically significant. For example, people with health risks also show a positive correlation with the probability of online shopping to buy electronics, books, and media.
Variables Influencing Commodity Purchases and Delivery Options (N = 10,817 Observations)
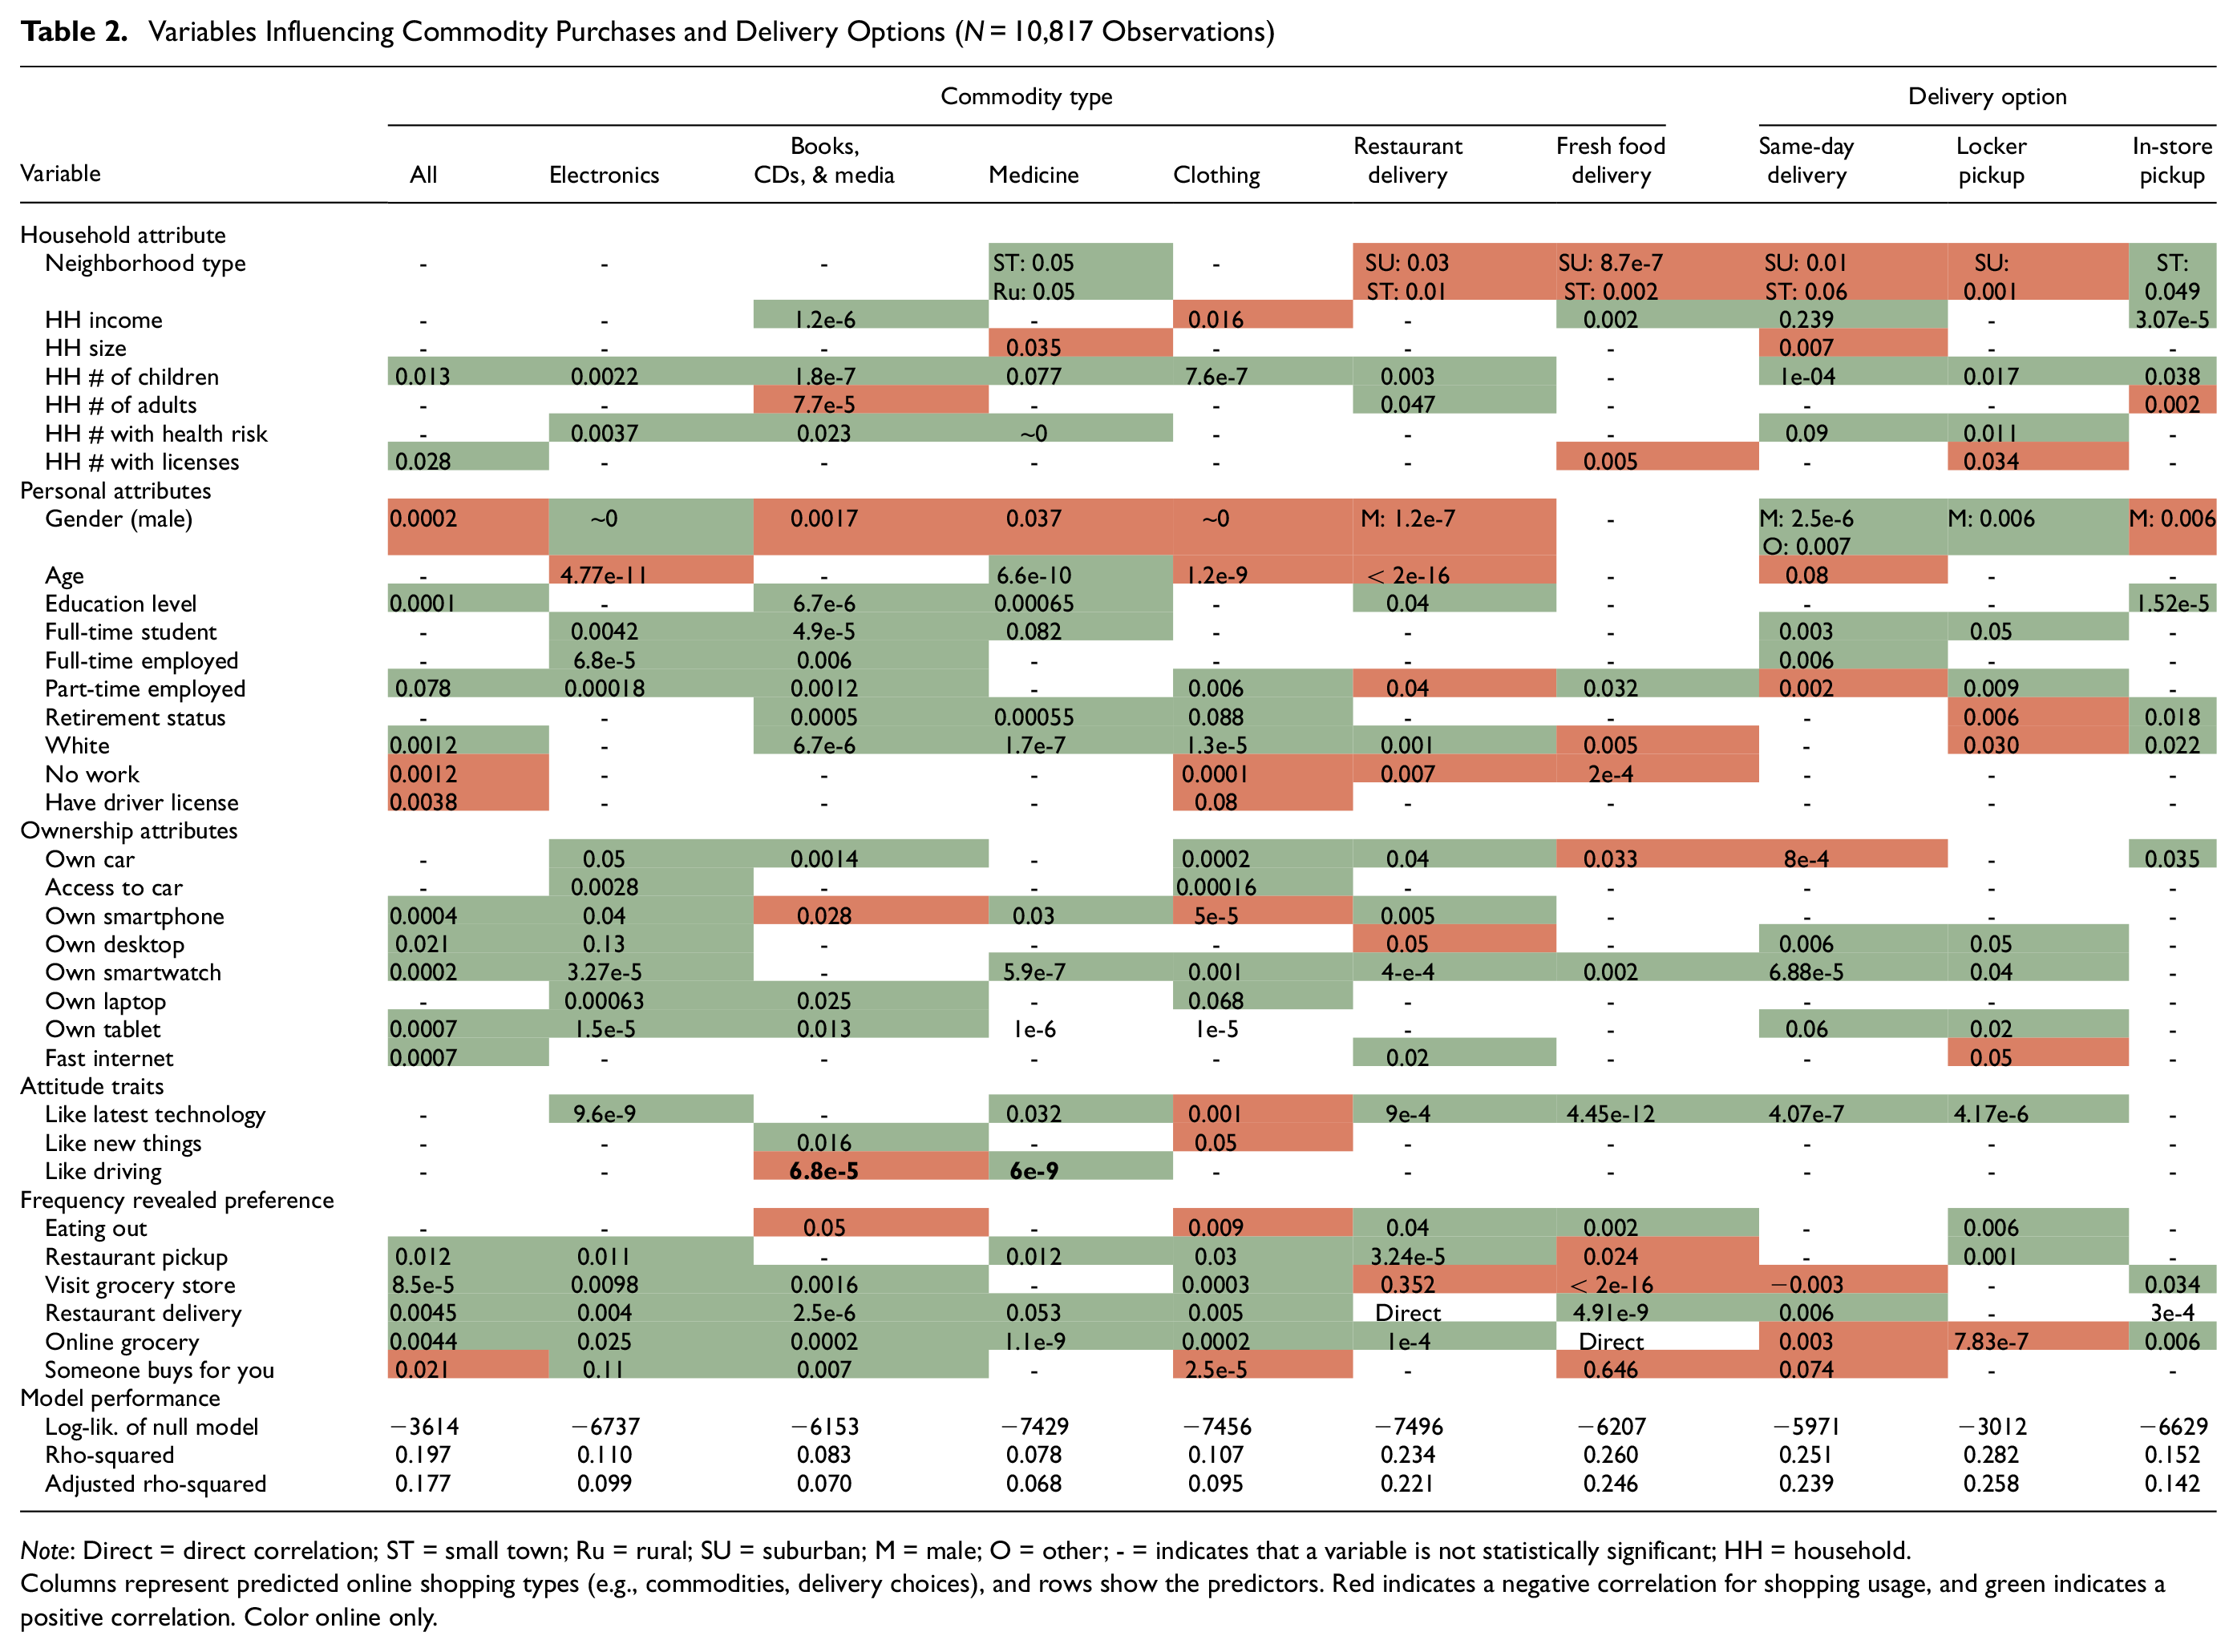
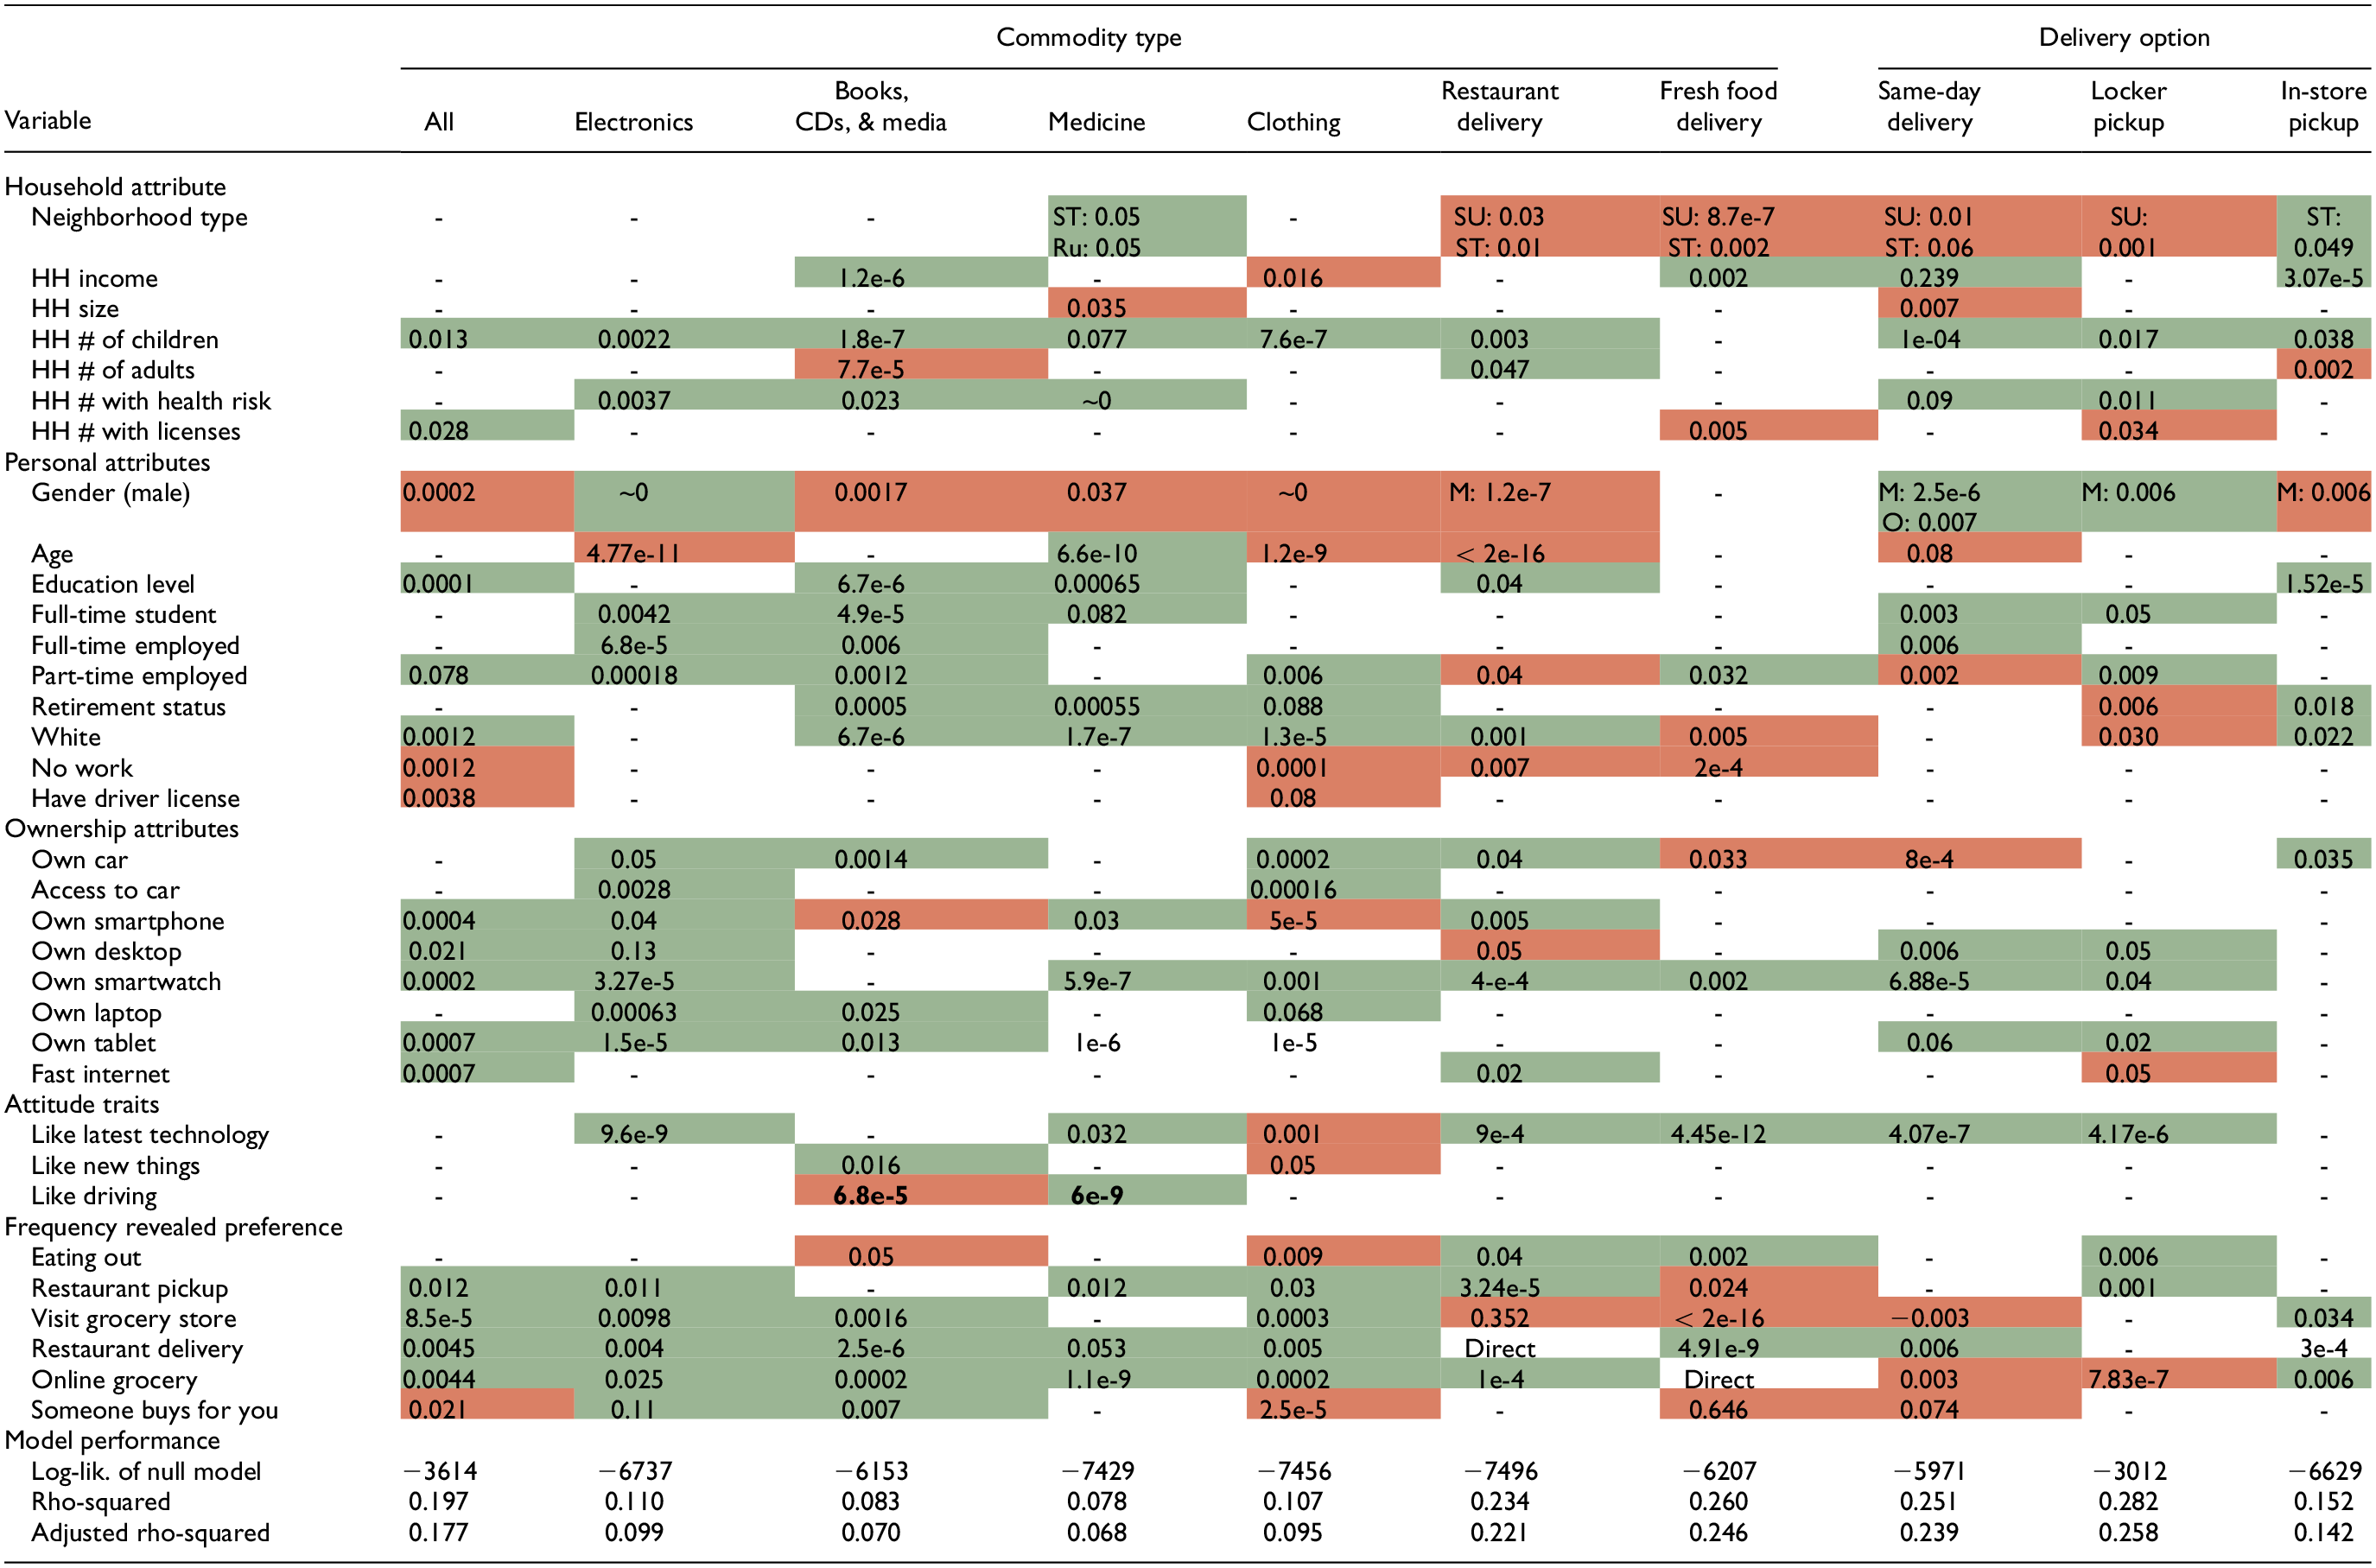
Note: Direct = direct correlation; ST = small town; Ru = rural; SU = suburban; M = male; O = other; - = indicates that a variable is not statistically significant; HH = household.
Columns represent predicted online shopping types (e.g., commodities, delivery choices), and rows show the predictors. Red indicates a negative correlation for shopping usage, and green indicates a positive correlation. Color online only.
Meanwhile, neighborhoods in suburban or small-town areas have a negative correlation with purchasing food/groceries online and using same-day delivery or locker pickup.
Full-time students and workers are likely to buy any commodity online or use any delivery option, while people without work show a negative correlation. Female respondents are more likely to shop online (buying books, medicine, clothing, and restaurant delivery) than males. Male respondents are positively correlated with and more likely to use same-day delivery and locker pickup services. The age variable is only positively associated with buying medicine online.
Results also show that owning vehicles and other technology increases the likelihood of shopping online. Owning a smartphone or tablet to shop online was found to be more predictive of using online shopping across categories than having fast internet access. On the other hand, liking the latest technology was the most predictive attitude variable; it positively correlates with almost all models, except purchasing clothing online. Additional variables considered the frequency of doing activities during the COVID-19 pandemic and were measured on a Likert-type scale (from never to five or more times a week). Interestingly, this group shows that all variables positively correlate with online shopping for most commodities except for eating out.
Poisson Regression Results
Poisson regression models the type of commodities and delivery choices based on the frequency of purchases within that category. Whereas the binary model measured the likelihood of a purchase, the Poisson model considered which characteristics were associated with greater or fewer purchases at all purchase levels. Table 3 shows the influence of each statistically significant variable on the model of each commodity or delivery option. Variables are classified into five groups: household (HH), personal, ownership, attitudes, and revealed preference frequency. Each box in a table gives the β coefficient of that variable (each row) over each model of commodity or delivery option (each column). Values that are emboldended are very significant, with P < 0.001. Values in italics have 0.001 < P < 0.01, whereas all others have 0.01 < P < 0.05. Here, “-” indicates that a variable is not statistically significant in our model.
Variables Affecting Commodity Purchase and Delivery Option Frequencies (N = 10,817 Observations)
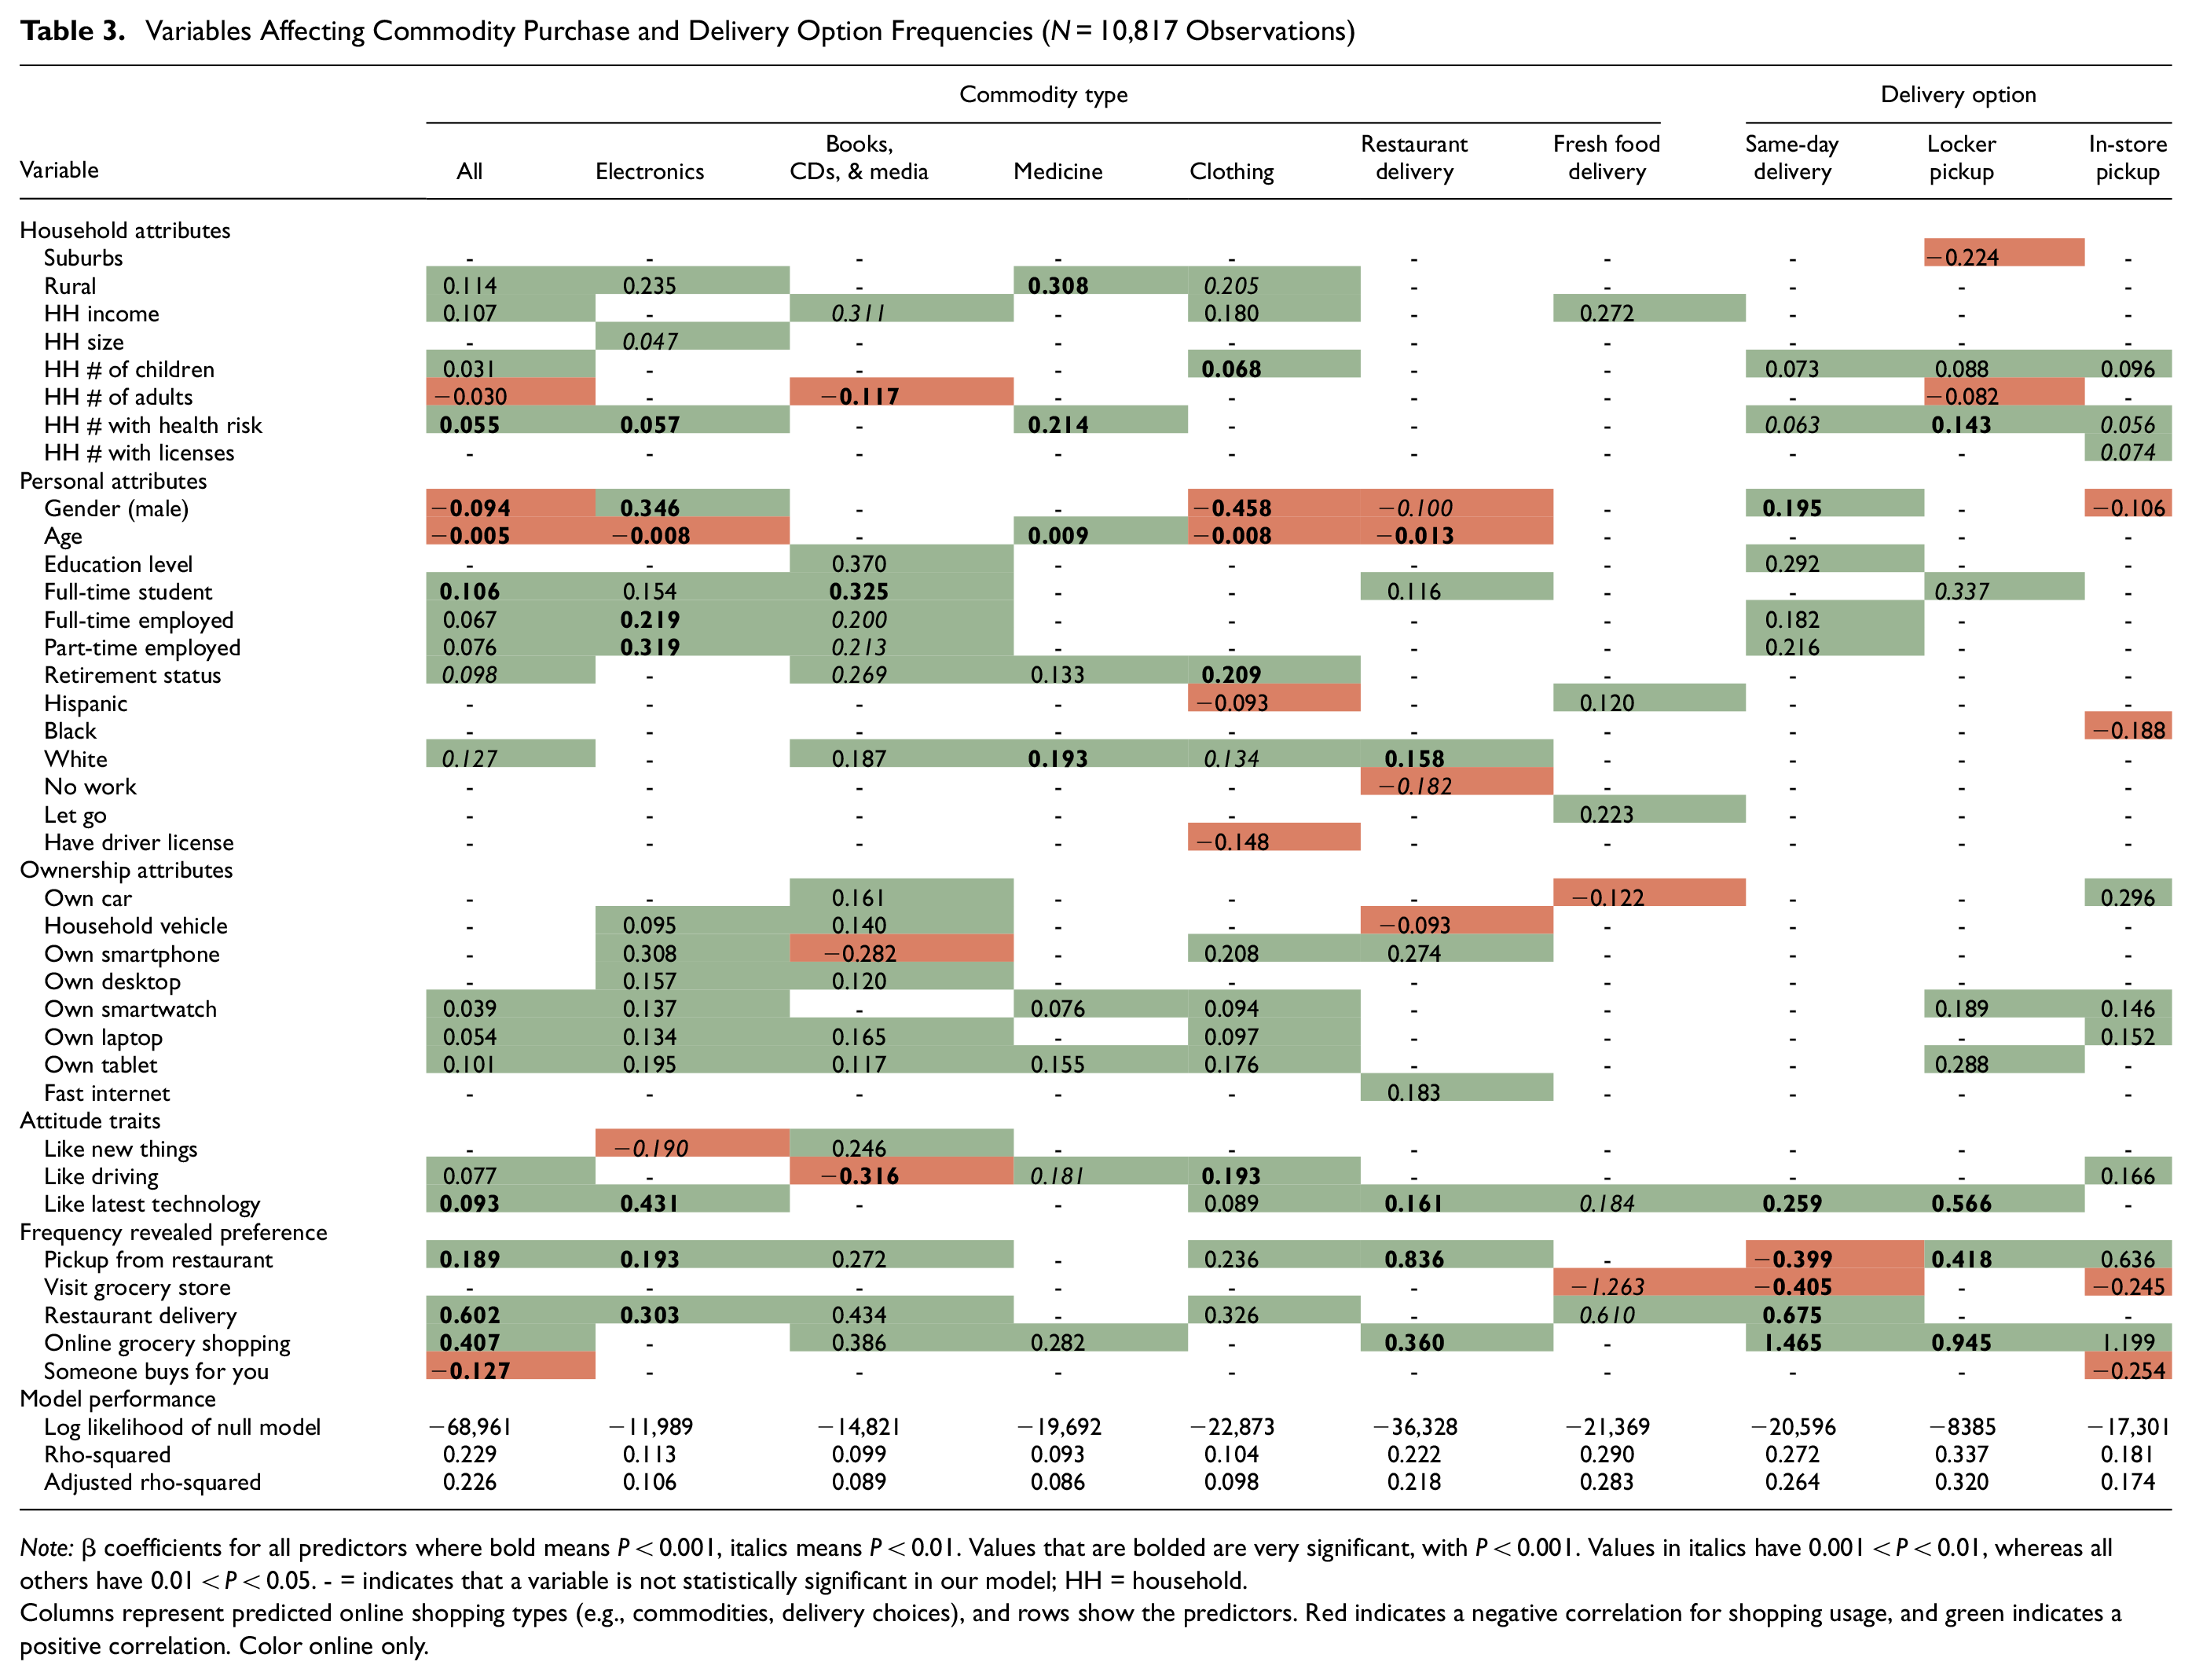
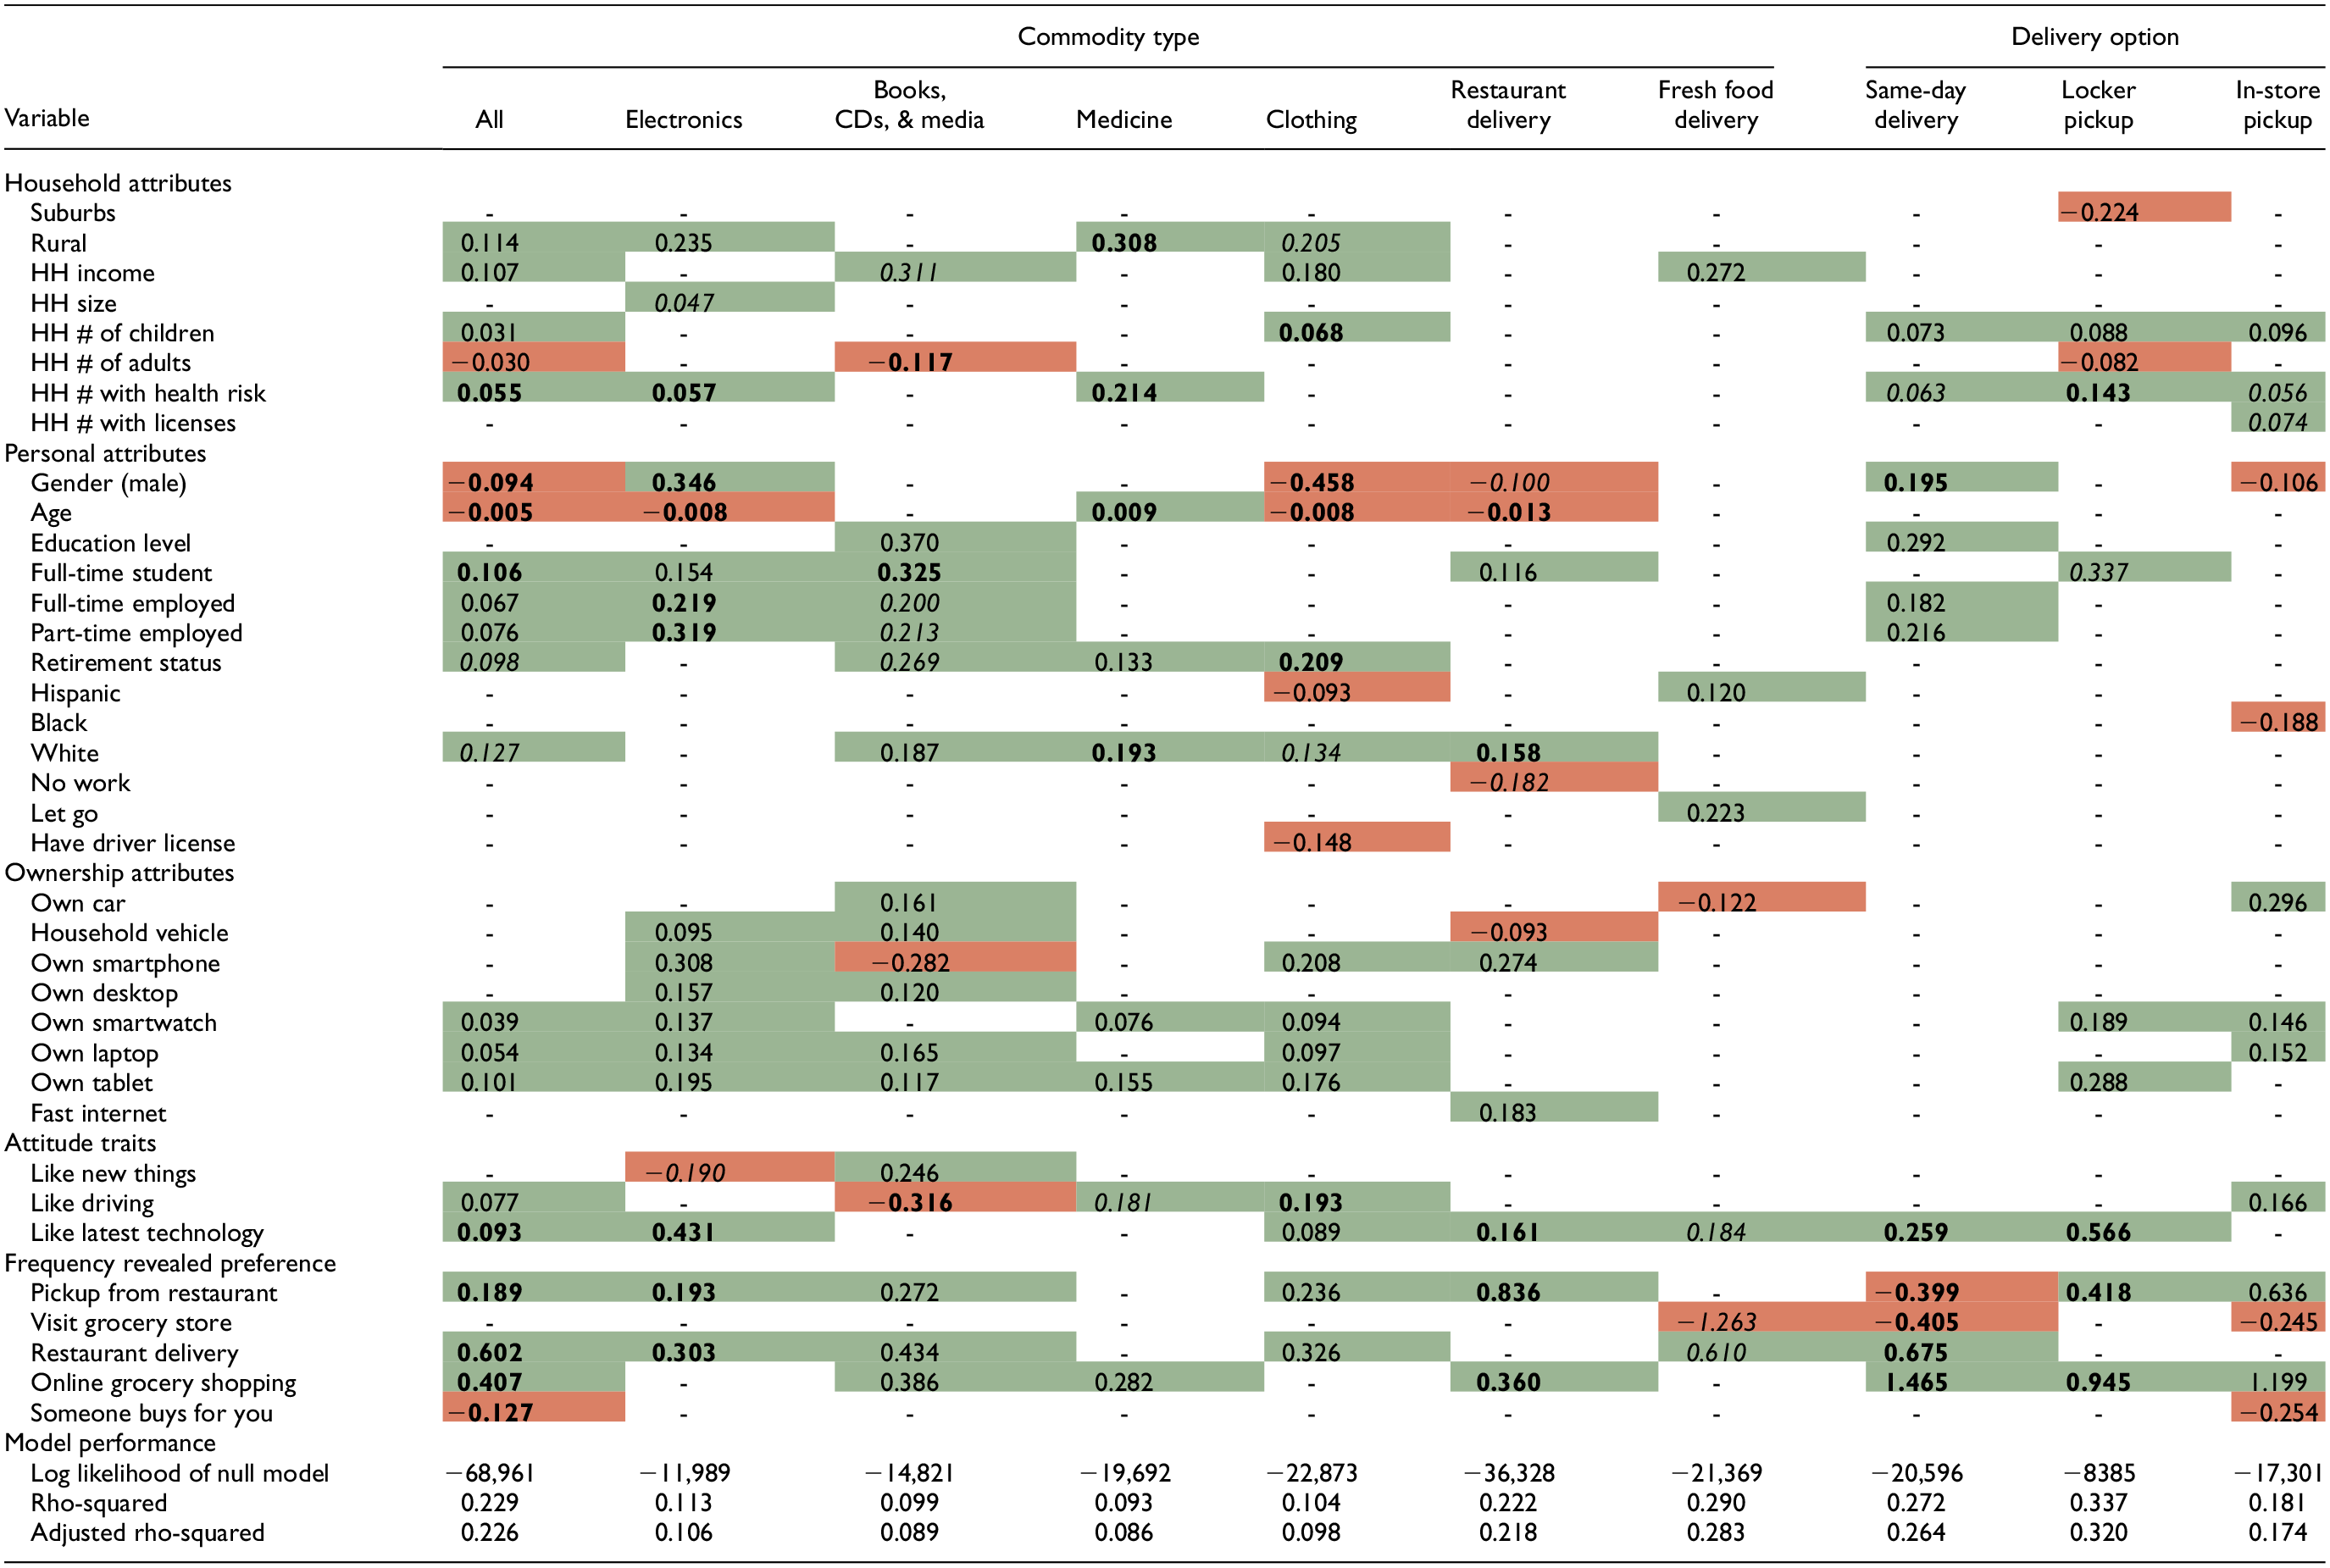
Note: β coefficients for all predictors where bold means P < 0.001, italics means P < 0.01. Values that are bolded are very significant, with P < 0.001. Values in italics have 0.001 < P < 0.01, whereas all others have 0.01 < P < 0.05. - = indicates that a variable is not statistically significant in our model; HH = household.
Columns represent predicted online shopping types (e.g., commodities, delivery choices), and rows show the predictors. Red indicates a negative correlation for shopping usage, and green indicates a positive correlation. Color online only.
Fewer household variables are statistically significant for purchase frequency than those in the logistic model. This indicates that these variables relate to online shopping access but are not as correlated with frequency. Notable findings include that the number of children is tied to higher numbers of clothing purchases, income is correlated with overall purchases, and the number of people in the household with health risk is the best predictor of the household variables.
An analysis of personal attributes shows age and gender as the most predictive factors of purchase frequency across all types. Age is negatively correlated with online purchase frequency, except for with medicine. Men generally buy less overall but make more electronics and same-day shipping purchases. Women were found to purchase more clothing, use restaurant delivery, and use in-store pickup. Student and employment status were both found to be connected to more overall online shopping but not very significant across other categories. As one would expect, students make more purchases of books. Most racial attributes were not predictive except for white status, which was associated with more purchases. This contrasts with the results of the binomial model, which found that race and ethnicity were both predictive of whether someone purchased certain commodities online or used each shipping option. The authors believe that this finding could be because many non-white racial identities were predictive of not using online shopping, which led to many zeros among the sample group. The Poisson model looks at the linear relationship between racial identity and predicted frequency of purchases, so among people in these groups who made one or more purchases, the effect of these racial identities was statistically insignificant.
Focusing on the ownership variables, having access to technology like a smartphone was generally connected to higher online purchase frequency. This makes sense because online shopping is not very accessible to those who cannot use the internet at home. The study did not ask which type of device was used when making online purchases, but this would be an interesting question for future surveys. Car ownership was found to be a significant factor for fewer areas than in the logistic model, except in the category of local pickup, which would be hard to do without a car. Surprisingly, fast internet access was only a significant predictor for restaurant delivery frequency. Liking new technology was the most significant predictor of the attitude variables, connected to higher purchase frequency for seven different purchase types. Liking driving correlated with the frequency of use for local pickup and purchases. However, one might expect people who enjoy driving to use a local pickup. The authors were intrigued to see that people who like driving also make more online purchases overall, and there is no clear explanation for this.
Finally, the last group of variables consists of the frequency of doing activities during the COVID-19 pandemic on a Likert-type scale. These variables had generally high P scores and positive correlations in the logistic model, and this trend continues with the Poisson model. Using restaurant or grocery delivery was generally connected with increased purchase frequencies across various commodities, indicating that the type of people using these services are likely more avid or experienced online shoppers. Unsurprisingly, shoppers who frequently purchased groceries in person used online shopping much less. They also used same-day shipping much less, suggesting that those types of shoppers were less interested in or able to pay for ultra-fast shipping options. Similarly, those who reported frequently having others shop for them generally made fewer online purchases overall.
This question has some cross-correlation with age, negatively affecting online shopping frequency. Still, it also may identify a specific group of people with less access to online shopping and rely on others to help them get goods that might otherwise be purchased online.
Latent Class Analysis Results
After comparing multiple trials and the iterative process of adjusting the number of classes for statistical fit and interpretability, a three-class latent solution was identified as the best LCA model. Even though the four-class solution has the lowest BIC value, two out of four classes look very similar in most delivery option patterns. Table 4 shows the model fit criteria for each option. Class 1 has 4279 members (50.4%), Class 2 has 3710 members (43.7%), and Class 3 has 492 members (5.8%).
Fit Criteria for Each Latent Class Analysis Class Option (N = 8490 Observations)
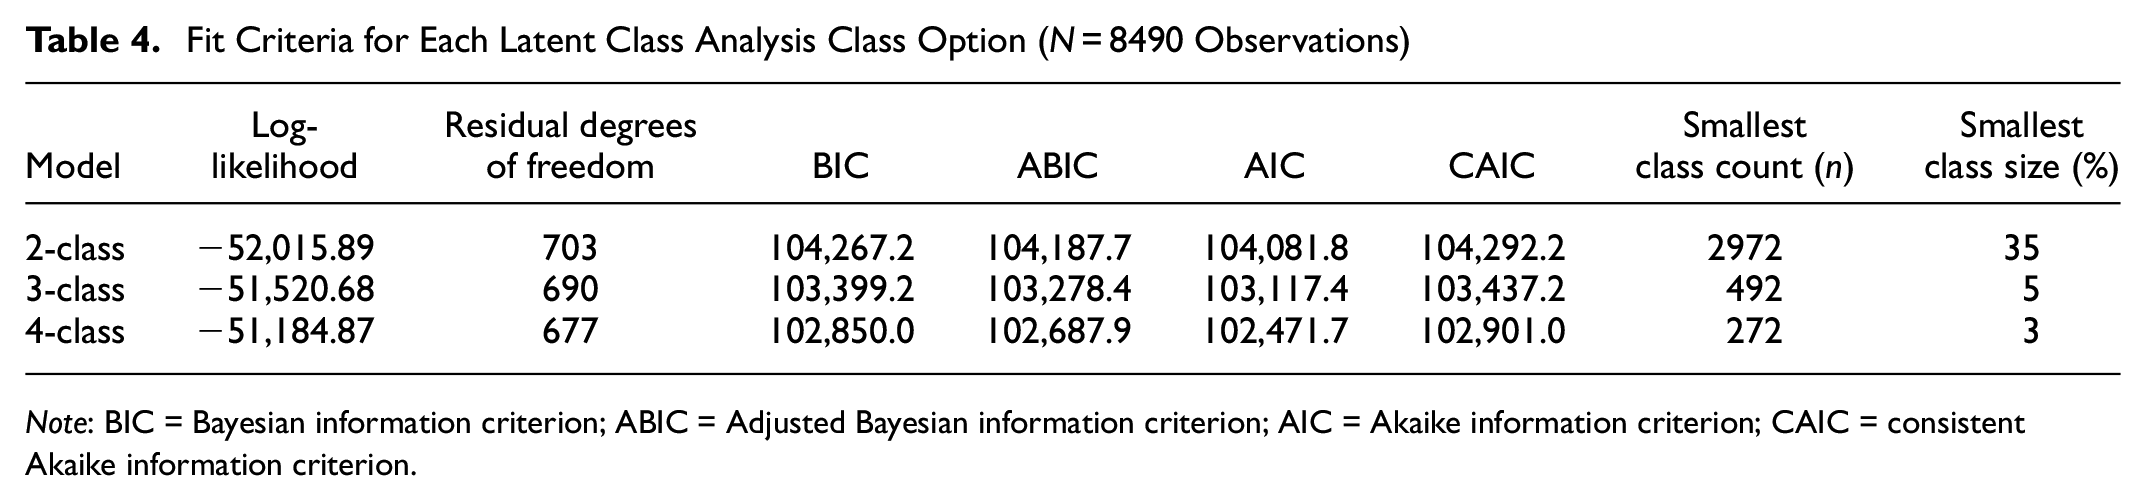
Note: BIC = Bayesian information criterion; ABIC = Adjusted Bayesian information criterion; AIC = Akaike information criterion; CAIC = consistent Akaike information criterion.
In the three-class latent solution by delivery option and response classification (Figure 6), Class 1 represents occasional shoppers with one to three or more than three online monthly purchases. In comparison, some others have zero online purchases. Class 2 represents infrequent online shoppers who mainly have zero online purchases. In contrast, Class 3 represents frequent shoppers with at least one online purchase in every delivery option.
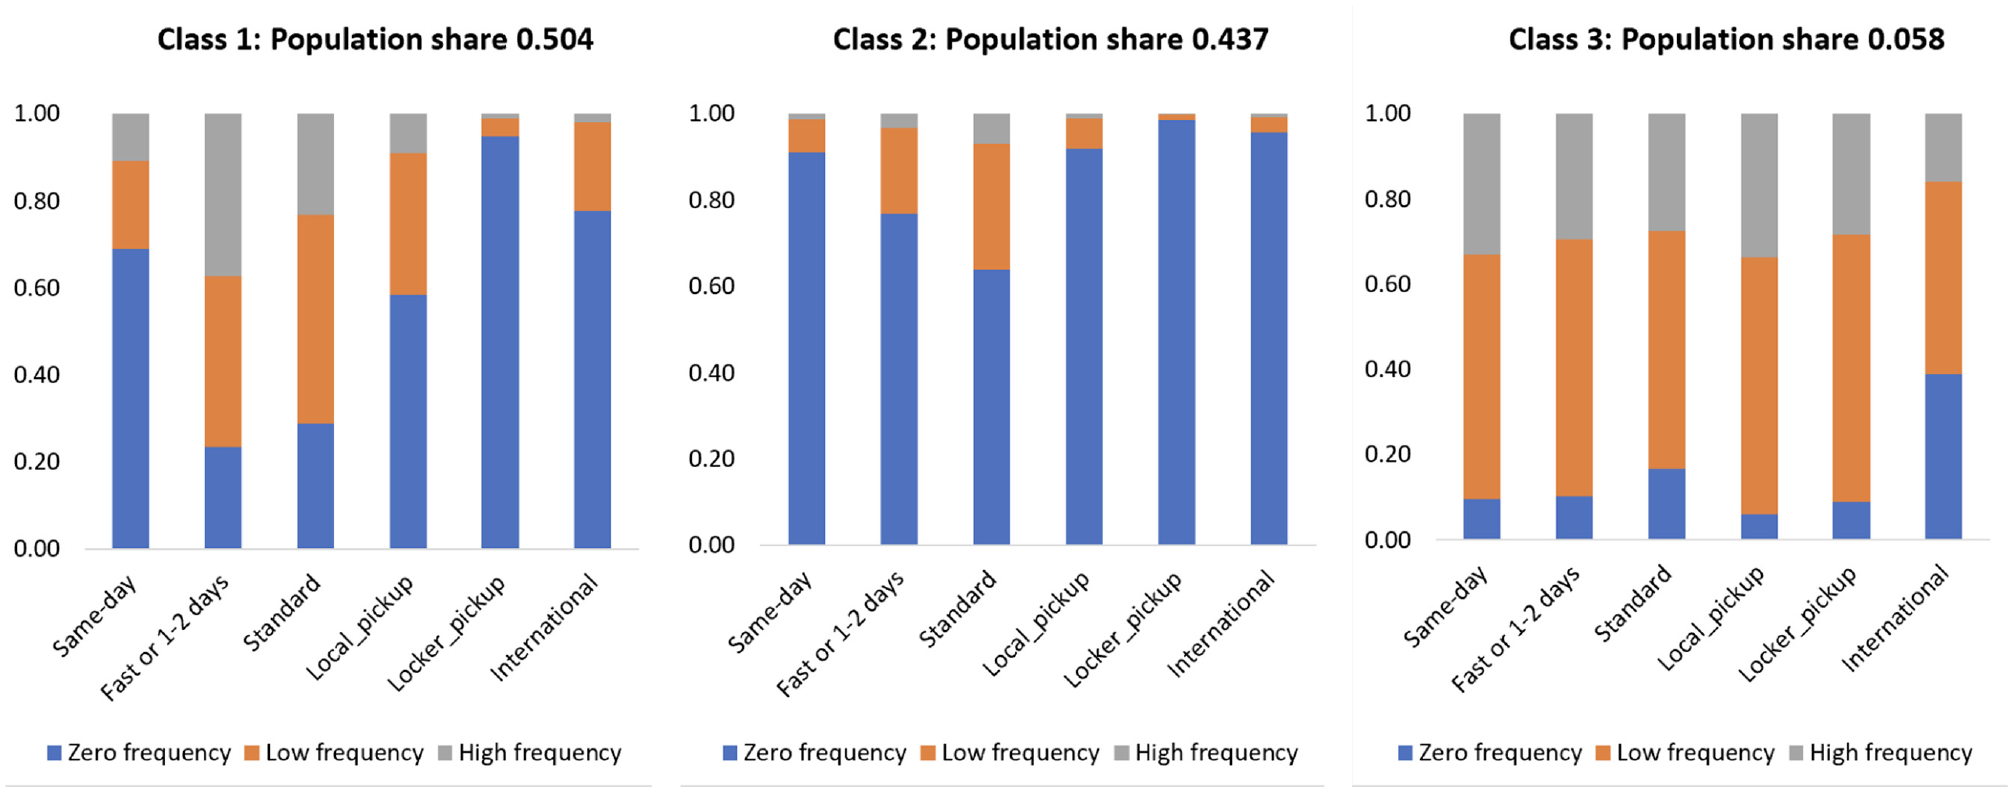
The output of the three-class latent solution by delivery option and response classification (N = 8490 observations).
With these defined classes, the demographic features of each class or from the listed covariates can be analyzed. Table 5 shows the relationship between covariate effects and the respondents’ tendency to belong to the latent classes, frequent or infrequent shoppers. Meanwhile, occasional shoppers or those in Class 1 were compared to the other two classes. People aged 18–34 are more likely to be frequent shoppers than occasional shoppers compared to the older age groups. Those 55 years or older are more likely to be infrequent shoppers than occasional shoppers. As income increases, people are less likely to be part of infrequent shoppers than occasional shoppers. However, this tendency is not found in the likelihood of becoming frequent shoppers compared to occasional shoppers. The type of neighborhood affects the likelihood of shopping online positively when people live in a more urbanized area and negatively in a more rural area.
Class Membership Model (N = 8490 Observations)
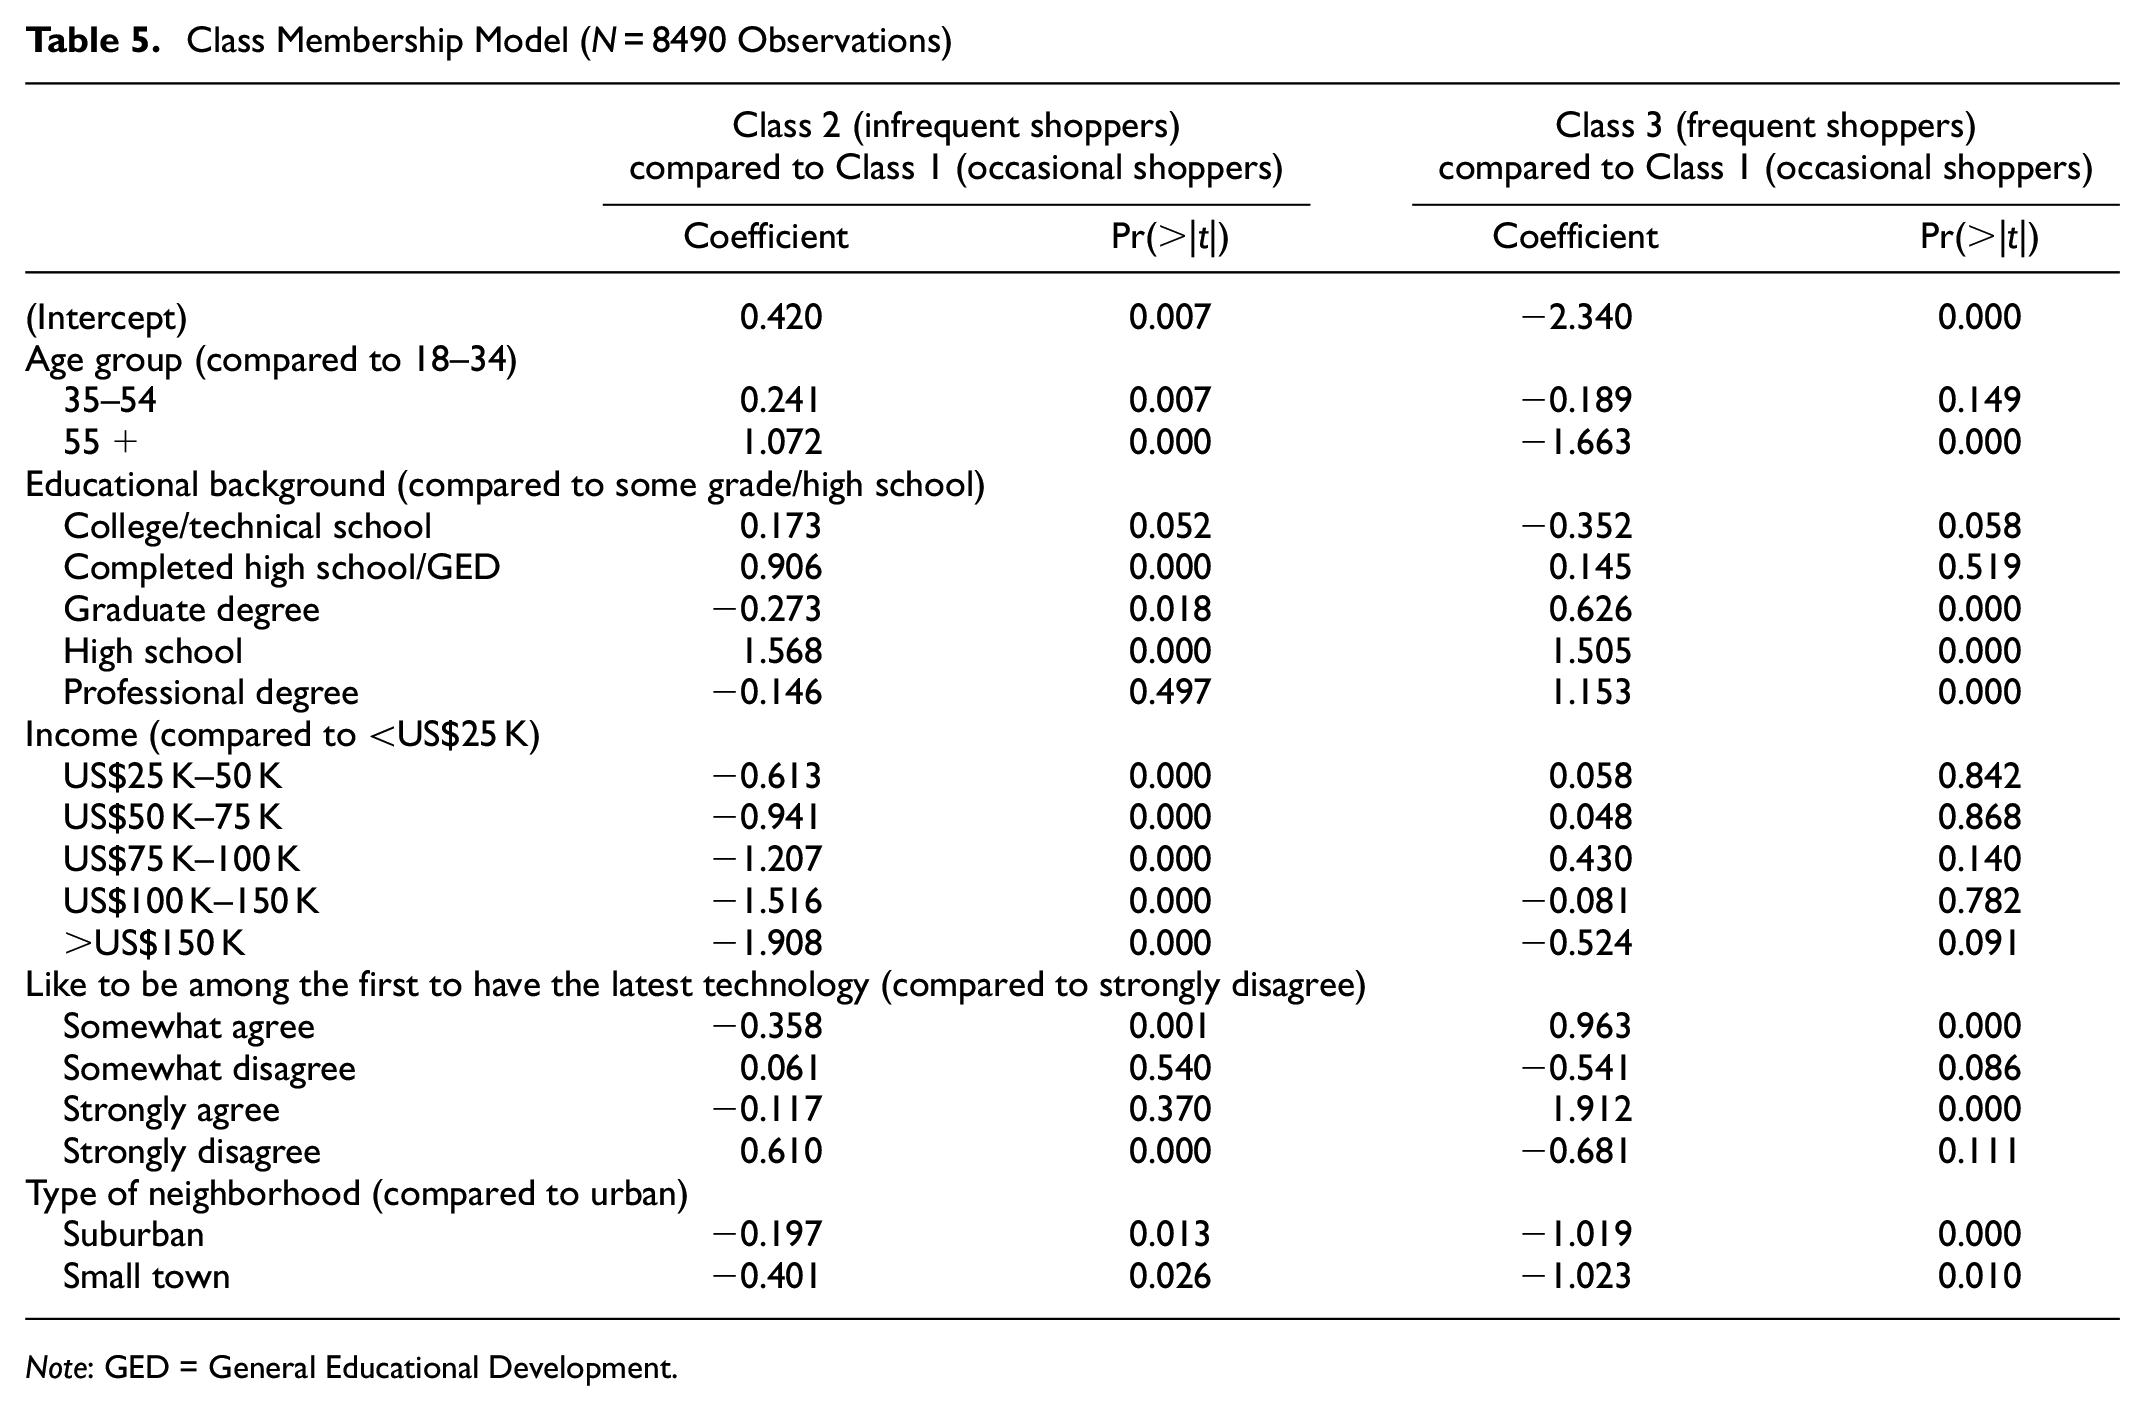
Note: GED = General Educational Development.
Moreover, Class 3 has higher coefficients than Class 2, showing a higher likelihood of Class 3 shopping online than Class 2. The percentage of people in the 55+ group is higher than others, showing that young people are more eager to use online shopping and various delivery options. Meanwhile, the household income pattern is entirely predictable, with the size of people with higher household income being larger in Class 1 and Class 3, and those with lower household income having a larger share in Class 2. The same pattern with attitude toward technology, where people who strongly agree that they are willing to be among the first to have the latest technology, have larger shares in Class 1 and Class 3, while those who strongly disagree have a larger share in Class 2.
Relationships between Commodities and Shipping Options
The weighted linear regression model results highlight patterns among the commodities purchased online and the delivery options chosen. Because the commodity and delivery option questions were asked separately, it is not directly possible to know with certainty which goods were shipped with which option. It is also impossible to dissociate the effects of goods often purchased by the same type of person. Similarly, estimating delivery options used less frequently is more challenging because they rarely represent a significant fraction of delivery options chosen for an individual shopper. Thus, it can be observed that coefficients of the model connecting commodities and delivery options most certainly overestimate option-share for infrequently used shipping options such as locker pickup and underestimate it for more familiar options such as standard shipping. Nonetheless, the nominal order of the most common shipping option chosen for all the commodities is still valid.
As shown in Table 6, the standard shipping option remains among the most popular for all commodities except for the crowdshipping commodities (restaurant, fresh food, and local farm delivery). For those three, same-day delivery was the most popular, and this makes sense because it is effectively only possible to have those things delivered on the same day. This result reveals one major issue with the survey design: many people may not consider crowdshipping purchases as “same-day shipping.” Interestingly, medicine has the highest estimated same-day share, which could be attributable to the prescription delivery services offered by the major U.S. pharmacies. The fast shipping option for electronics was estimated to be slightly more popular than standard shipping. Finally, correlations are less clear for international shipping, locker pickup, and local pickup. Of those shipping options, local pickup was most used by the “other” category of goods. Concerns about COVID-19 likely pushed many consumers out of stores, leading them to use local pickup to shop without going indoors.
Relationship Between Commodity and Delivery Choice (N = 10,817 observations)
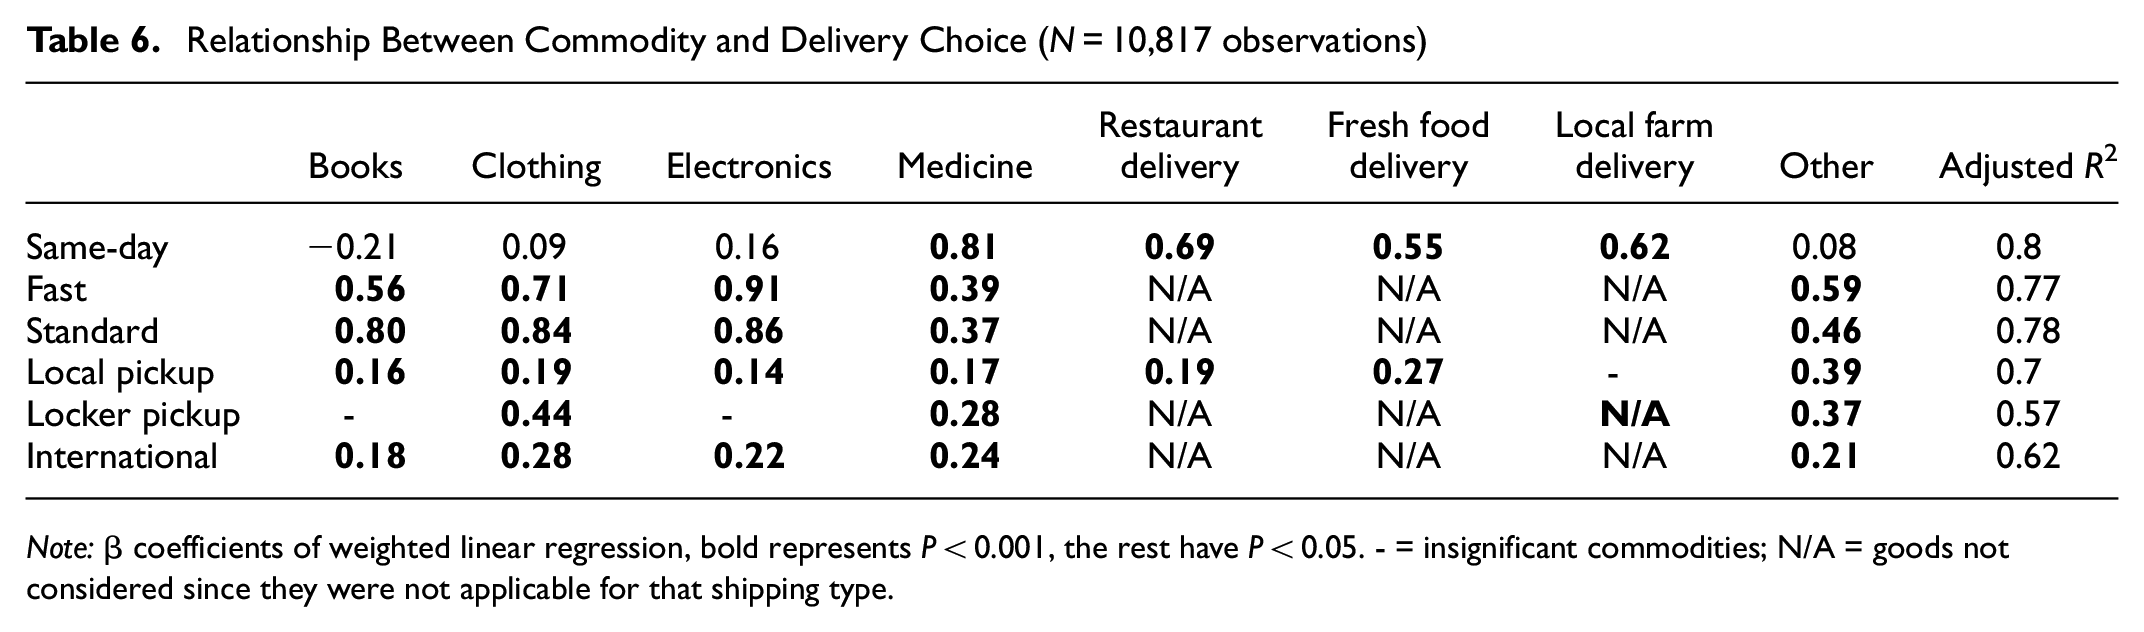
Note: β coefficients of weighted linear regression, bold represents P < 0.001, the rest have P < 0.05. - = insignificant commodities; N/A = goods not considered since they were not applicable for that shipping type.
Equitable Access and Benefits
Figliozzi and Unnikrishnan ( 13 , 14 ) introduce the concept of home-based accessibility as a critical metric in understanding those who do and do not have access to e-commerce. This concept can be applied to all types of shipping and commodities. Grocery and restaurant delivery, in-store, and locker pickup services have similar and unique barriers to access with differences that lead to disparities in access among the population. For example, some of these delivery services (e.g., crowdshipping) may have unique requirements, such as using an app and sign-up for an account using an email. This study helps understand the factors that influence home-based accessibility by identifying the key factors affecting purchases and how they are a barrier for some. Factors related to education and access to technology, such as fast internet or a cell phone, were the most critical determinants for those who did not shop online, confirming the connection between digital literacy and access to online shopping. Figures 7 and 8 illustrate the relationship between these access traits and standard socioeconomic variables, such as race and household income. Thus, one key policy for maximizing the benefits of online shopping is to subsidize access to broadband and cell phones for low-income and older people. This needs to be paired with digital finance and banking education to unlock the ability to access online services.
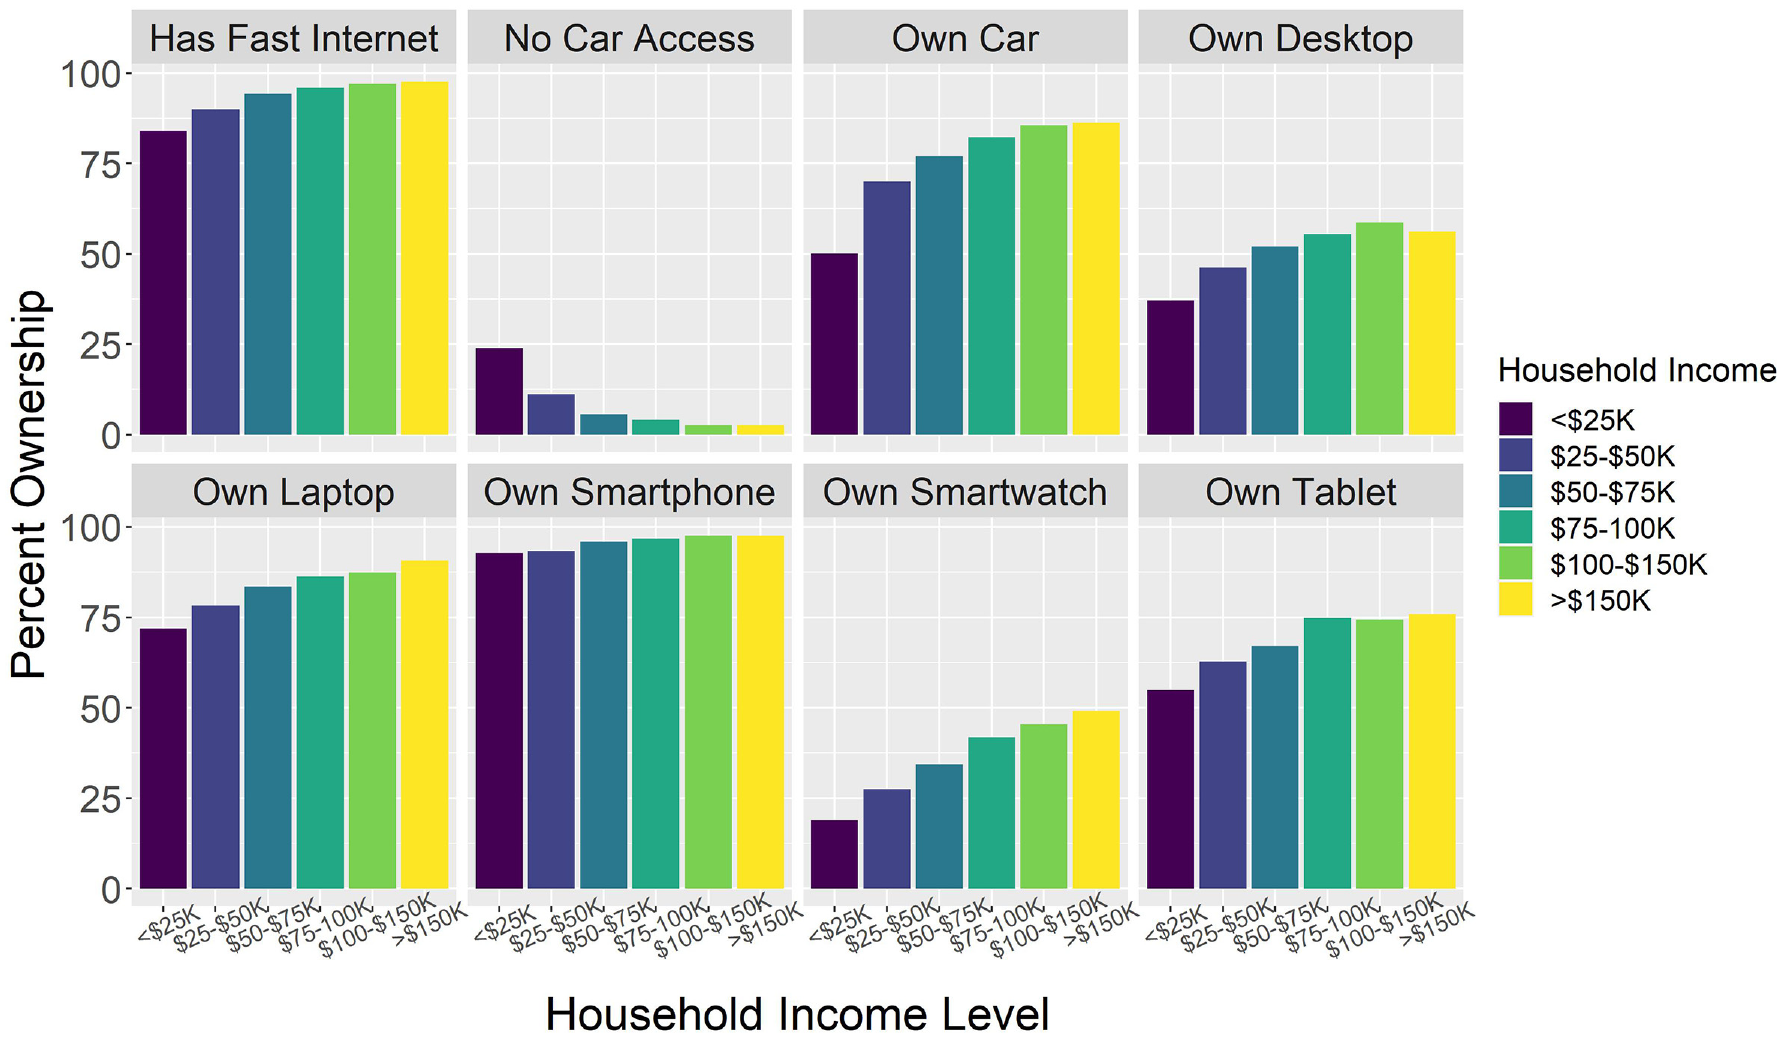
Relationship between household income and ownership traits in the survey population (N = 10,817 observations).
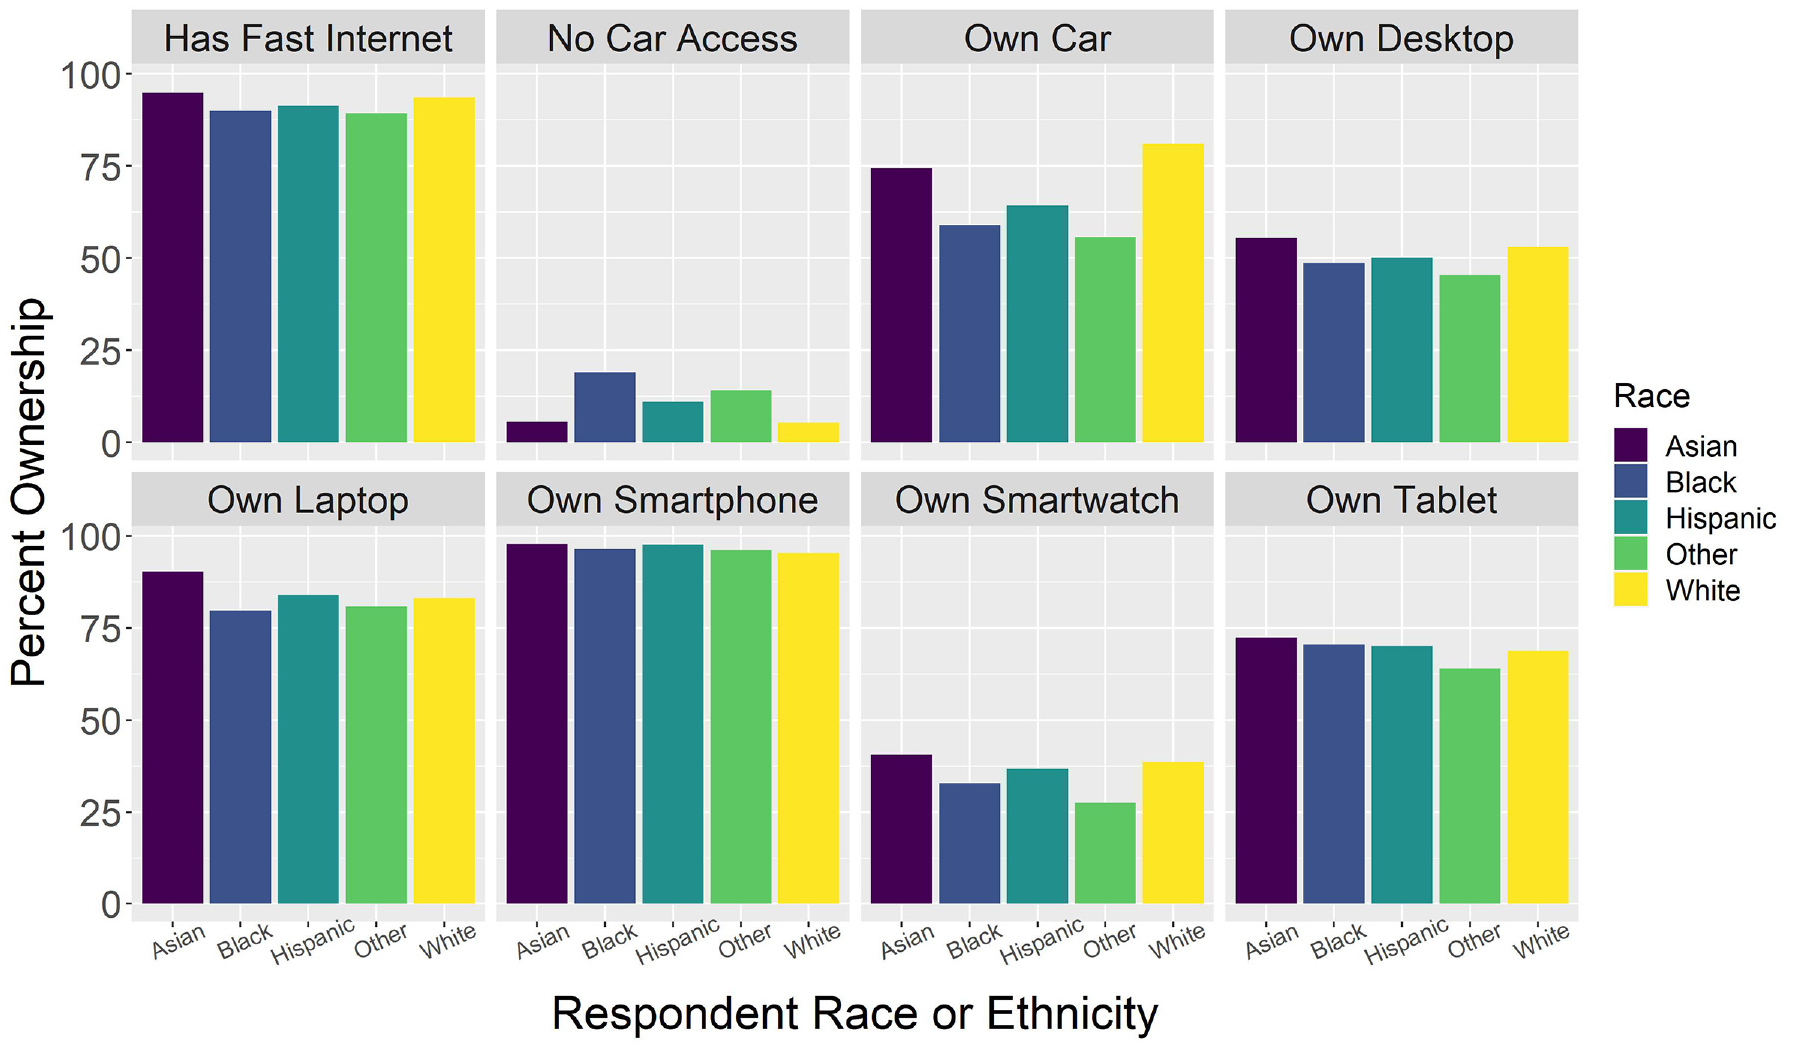
Relationship between race or ethnicity and ownership traits in the survey population; Hispanics of all racial identities represented together (N = 10,817 observations).
The results also show that most online shoppers are likely to come from a wealthier and younger population that lives in urbanized areas. In addition, infrequent online shoppers are most likely to come from rural areas. Moreover, because of the unique barriers posed by stay-at-home policies during the COVID-19 pandemic, the utility of e-commerce and delivery services was shown to be of significant value to the public. This poses the question of what can be done to ensure access to these services and their benefits to everyone while acknowledging that most of them are provided by private companies.
Data from the survey demonstrates that a broad cross-section of people shopped online for products during Spring 2020. However, roughly 10% did not shop online once in the 30 days before the survey.
In this paper, we surmise that those who did not use online shopping during the height of the COVID lockdowns likely did not have access to online shopping. This is further supported by the results of our binomial regression, which showed that owning a smartphone was a significant predictor for using online shopping at all. One challenge with using survey data is that the non-use of e-commerce does not directly indicate that someone could not shop online. For example, people with access to online grocery delivery may have chosen to shop in person because of personal preference. Thus, future survey research may benefit from specific questions about online shopping accessibility rather than relying on revealed preference as a proxy for accessibility.
In addition to promoting online shopping to new users, policies were also tested during the COVID-19 pandemic related to infrastructure for online shopping. Examples include opening curb space to outdoor pickup or installing lockers for secure storage and pickup deliveries for those who cannot have things delivered safely to their homes. Some stores added online ordering to brick-and-mortar locations and offered periods of operation specifically for vulnerable shoppers. Overall, governments should focus on maintaining fairness through access to these services and minimizing the externalities of noise, safety, and emissions imposed by e-commerce on underserved communities while working with the private sector to guarantee fair access.
Conclusions
Using binomial models to examine user and non-user groups for online shopping revealed notable differences between the groups by commodity and delivery option. Although these models are simple, they have been used by many other researchers in examining COVID-19-related shopping behavior on more general survey data ( 7 ). This work showed that shopping frequency, technology ownership, and household size were significant positive predictors of online shopping use. These match findings from exploratory data analysis. After modeling online shopping with logistic methods, a Poisson model was employed to model the frequency of online purchases among the surveyed population. The models identified fewer significant predictors for purchase frequency than in the case of usage or non-usage. Key variables such as technology attitudes, age, income, and gender remained strong predictors for purchase frequency.
Similarly, access to technology such as a smartphone or laptop was highly correlated with online shopping in the Poisson model. Moreover, the LCA results also support the influence of age, income, type of neighborhood, educational background, and attitude toward technology on online shopping behavior. Frequent online shoppers are most likely to come from urbanized areas, with younger age, higher income, higher education background, and likeliness among the first people to have the latest technology. Our study is novel in that this dataset provided detailed frequency counts for purchases by commodity and the delivery option chosen instead of just the propensity of shopping and delivery choice. This allowed us to improve the understanding of the relationships between purchase frequency (counts of e-shopping events) and the type of commodities and delivery services, compared to previous studies, which relied on purchase ranges or less detailed purchase breakdowns (not considering the commodity types or purchase and delivery options).
Socioeconomic variables such as race and income significantly affect purchase frequency and likelihood to use online shopping for white, younger, and wealthier respondents. This was especially true for delivery choices such as restaurant delivery, grocery delivery, locker pickup, and same-day delivery. These results are consistent with earlier findings from Figliozzi and Unnikrishnan ( 13 , 14 ) about home-based accessibility. Not all groups have equal access to online shopping, and those with access use it at disparate rates.
In addition, this study finds new relationships between the choice of commodity and the most likely shipping option chosen. The authors find that standard shipping is most popular for many commodities, but fast shipping (1–2 days) is close behind in usage share. High usage for same-day shipping for medicine purchases is an unexpected result. In addition, local pickup was much more popular than same-day shipping for purchases in the “other” category, which helps to demonstrate the fast take-up of local pickup options from retailers in the early months of the COVID-19 pandemic.
In closing, this paper highlights American shoppers’ differing usage of online shopping during the height of pandemic lockdowns in 2020. The models showed significant relationships between access to technology and usage of online shopping, illustrating the importance of subsidized internet and phone plans in providing access to the online shopping marketplace. Similarly, age was a significant factor in online shopping frequency, with older users consistently making fewer purchases (outside of medicine). This indicates less access to online shopping among older people, and there is room for policy and private businesses to make online shopping easier and more accessible. This is especially true for more novel shopping methods, such as app-based crowdshipping, which were essential during the pandemic and inaccessible to many who may have needed them the most. Since the main focus of this survey was understanding travel behavior, future work in this field should center the questions around shopping frequencies across a broader range of categories and shipping types. The golden standard would assign percentages to how often each shipping option was chosen for each online commodity.
Footnotes
Author Contributions
The authors confirm contribution to the paper as follows: study conception and design: D. Crowley, M.M. Silaen, Y. Lee, M.A. Jaller, G. Circella; data collection: G. Circella, Y. Lee; analysis and interpretation of results: M.M. Silaen, D. Crowley, Y. Lee, M.A. Jaller, G. Circella; draft manuscript preparation: M.M. Silaen, D. Crowley, M.A. Jaller, G. Circella. All authors reviewed the results and approved the final version of the manuscript.
Declaration of Conflicting Interests
The author(s) declared no potential conflicts of interest with respect to the research, authorship, and/or publication of this article.
Funding
The author(s) received no financial support for the research, authorship, and/or publication of this article.
Data Accessibility Statement
Survey data used in this paper is from the Panel Study of Emerging Transportation Technologies and Trends in California and is available on request.