
Abstract
The driving behaviors of connected and automated vehicles (CAVs) will differ from those of human-driven vehicles (HDVs) because the CAVs’ driving decisions are controlled by computers. Because of the limited amount of crash data for CAVs, researchers have relied on surrogate measures of safety to assess their safety impacts. However, they often use the same safety indicators for CAVs that were used for HDVs, raising questions about the adequacy of the safety indicators for CAVs. This study aims to investigate the suitability of using conventional safety indicators for CAVs. To achieve this, we evaluated eight safety indicators used for CAVs in the literature: time-to-collision (TTC), post-encroachment time (PET), time-exposed TTC, time-integrated TTC, deceleration rate to avoid a crash (DRAC), crash-potential index, rear-end-collision risk index, and potential index for collision with urgent deceleration (PICUD). For the evaluation, we first simulate CAVs on an approaching lane of signalized intersections using the acceleration-control algorithm. The algorithm replaces the HDV trajectories with CAVs for mixed simulations where HDVs and CAVs coexist. Analyzing the simulation output, we examined the safety indicators for the various car-following scenarios and the CAV proportions. The findings suggest that PET and PICUD can yield different safety implications for CAVs because of their small-gap car-following characteristics. Ignoring such characteristics may lead to interpreting the small-gap car-following situations as simply dangerous traffic interactions for CAVs. The car-following experiments indicate that TTC, PET, and DRAC are insufficient in measuring the safety implications when successive vehicles operate at similar speeds for CAVs.
Keywords
Connected and automated vehicles (CAVs) stand out as a technological advancement for future transportation. In contrast to human-driven vehicles (HDVs), it is reasonable to anticipate distinct driving behavior in CAVs with respect to HDVs, given that their operational decisions are computer-controlled rather than reliant on a human driver ( 1 , 2 ). Recognizing the uncertainties in the safety impacts of CAVs, particularly in mixed-traffic scenarios in which CAVs and HDVs coexist ( 3 , 4 ), becomes imperative to evaluate the CAVs’ safety implications before widespread deployment on a large-scale network.
A substantial body of literature has evaluated the safety impacts of CAVs through a combination of field experiments and simulations. The significance of simulation-based studies in evaluating the safety impact of CAVs has grown, in particular, in the absence of real-world CAV crash data ( 5 – 7 ). Given the challenges in testing and reproducing actual crashes in simulations, numerous studies have investigated the safety impact of CAVs using surrogate measures derived from simulation results ( 4 , 8–10). However, a prevalent issue in most simulation-based studies is the utilization of the same safety indicators developed to evaluate HDVs without considering the unique driving characteristics and failure mechanisms of CAVs.
Virdi et al. ( 11 ) proposed the network-wide safety assessment method for CAV mixed-traffic situations, employing the surrogate safety assessment module (SSAM) with time-to-collision (TTC) and post-encroachment time (PET). Deluka Tibljaš et al. ( 8 ) estimated the safety impact of CAVs on roundabouts using TTC, PET, and the maximum speed of vehicles during conflict events. Papadoulis et al. ( 3 ) developed a decision-making CAV control algorithm in VISSIM simulation software. They used the SSAM with TTC and PET to estimate the reduction of conflicts with various CAV market penetration rates (MPRs). Li et al. ( 12 ) investigated the longitudinal safety impacts from cyber-attacks on CAVs using the rear-end-collision risk index (RCRI). Rahman et al. ( 9 ) examined the safety impacts of connected vehicles (CVs) and low-level automated vehicles at the segment level, utilizing time-exposed TTC (TET) and time-integrated TTC (TIT).
The conventional safety indicators and their limitations concerning CAVs are thoroughly discussed by Wang et al. ( 13 ). The study reviewed the safety indicators classified as time-, deceleration-, and energy-based measures. This work also highlights the application of many conventional safety indicators to assess the safety impacts of CAVs as if they were HDVs. It argues that the current safety indicators may be inadequate for CAVs because of various factors, including (i) the limitations of safety indicators to consider the powerful sensing of CAVs, path prediction, and planning capabilities in crash risk evaluations, (ii) the shorter reaction time of CAVs (approaching zero depending on CAV system design) compared to HDVs, and their communication technologies to share precise and complex information through vehicle-to-infrastructure (V2I) or vehicle-to-vehicle (V2V) communications, (iii) CAV platooning with HDVs at different connectivity and automation levels, and (iv) a small headway between CAVs when all vehicles are fully connected and aware of other vehicles’ next moves. While the study provides a comprehensive literature review and discussions on applying conventional safety indicators in CAVs, it underscores the need for experimental demonstrations considering CAVs’ driving characteristics to support the discussions and findings.
This study aims to investigate the performance of current safety indicators for evaluating CAVs’ safety impacts considering the longitudinal driving characteristics of CAVs. To facilitate the comparative performance of indicators, HDV trajectories collected by the U.S. Department of Transportation (DOT) ( 14 ) and CAV trajectories generated by an acceleration-control algorithm were used. The impact of CAVs during simulations is recorded in the output trajectory data, and safety indicators are derived from the output for comparison. This study presents the overall safety implications identified by each indicator as well as the various car-following situations between CAVs and HDVs. Eight safety indicators, namely TTC, PET, TIT, TET, deceleration rate to avoid a crash (DRAC), crash-potential index (CPI), RCRI, and potential index for collision with urgent deceleration (PICUD), were tested. The contribution of this study is twofold. Firstly, we demonstrate that the conventional safety indicators might result in contrary safety implications in traffic situations involving CAVs. Secondly, this study identifies the reasons why some conventional safety indicators might not be adequate for CAVs’ small-gap car-following features.
Driving Characteristics of Connected and Automated Vehicles
Detailed driving characteristics of CAVs in a large network are not yet available, primarily because of the current limitation of automation level for commercial vehicles, which remains at conditional automation (level 4) ( 15 ). Furthermore, there is a lack of sufficient empirical data collected from public roads under mixed-traffic situations. In this section, we review the general driving characteristics of CAVs defined in the current literature. These characteristics can be represented by several key parameters, including reaction time, desired vehicle speeds, minimum headway, communication capabilities and range, and acceleration capabilities. These parameters play a crucial role in simulating CAV car-following models and computing safety indicators. The literature shows that the headway, reaction time, and communications (e.g., to get information in advance) of CAVs outperform those of HDVs. However, the CAV speeds and accelerations may align with those of HDVs because of the various restrictions of other factors, such as vehicle acceleration capabilities, speed limits, or acceleration range for human comfort. The main driving characteristics of CAVs are as follows.
Reaction times: CAVs are expected to exhibit a shorter reaction time than humans ( 16 , 17 ).
Vehicle speeds: The speed of CAVs will be constrained by the road section speed limit, vehicle capabilities, and safety, while some literature assumes that CAVs can operate at a higher speed than HDVs ( 18 , 19 ).
Headways: CAVs can maintain shorter headways than HDVs since they communicate with other vehicles or infrastructures with a neglectable delay ( 20 – 22 ).
Communication ranges: The communication range of CAVs is anticipated to be longer than that of HDVs because human drivers perceive information mostly within sight distances ( 23 – 25 ).
Accelerations: The acceleration of CAVs is expected to be similar to HDVs because of the comfort range for human acceleration ( 26 , 27 ).
Safety Indicators for Connected and Automated Vehicles
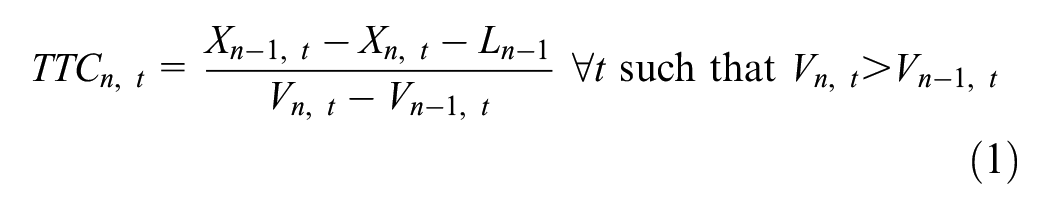
Different proximal road safety indicators can be used in estimating the risk of rear-end collisions. In this section, we introduce commonly used safety indicators for CAVs found in the current literature. Among these safety indicators, TTC, PET (in the case of rear-end interactions with slower leaders), DRAC, and PICUD are continuous indicators calculated at any instant. In contrast, TIT, TET, RCRI, and CPI produce a single value for each interaction (pair of following road users). The equations are explained briefly here, as they have been thoroughly discussed in the literature.
Notations
The notations used for the safety indicators for interactions between two consecutive vehicles, denoted n–1 and n, are as follows.
Proximity-Based Safety Indicators
Time-to-Collision
As one of the primary safety indicators, TTC has been extensively applied to evaluate the safety impact of CAVs (
3
,
8
,
12
). TTC measures the expected time for the current vehicle
Post-Encroachment Time
Another often-used proximity-based safety indicator for HDVs and CAVs is PET, defined as the duration between the instant t1 when the preceding vehicle’s rear-end leaves the conflict area and the instant t2 when the front bumper of the current vehicle arrives at the conflict area ( 8 , 11 , 28 , 29 ). Note that PET is generally a unique measure for a given interaction, but in a car-following traffic situation, PET is continuous. PET is defined in Equation 2:

Time-Exposed Time-to-Collision
Because the minimum TTC indicator is generally used to capture the most dangerous instant in an interaction, TET is suggested to estimate the time spent in dangerous traffic situations that are below a TTC threshold. TET is given in Equations 3 and 4:
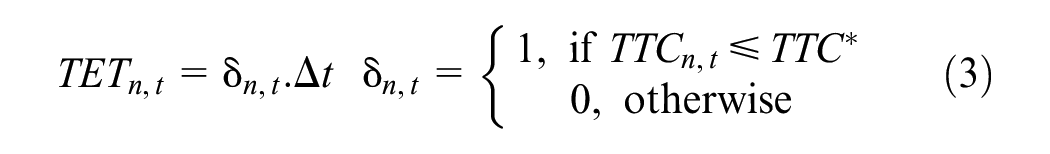

Time-Integrated Time-to-Collision
While TET simply counts the time during which TTC is below the threshold, TIT uses the inverse to consider the magnitude of TTC values so that the severity or proximity to a collision is considered in the equation. The higher the TIT values, the more dangerous the traffic situations. The definition of TIT is given in Equations 5 and 6:
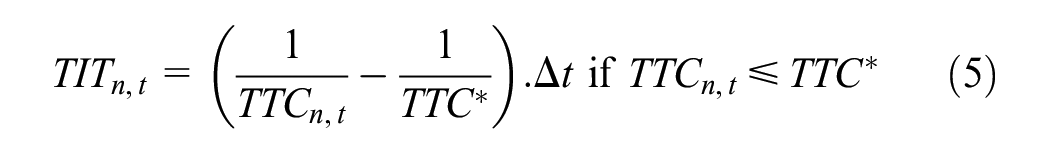

Deceleration-Based Safety Indicators
Deceleration Rate to Avoid a Crash
The DRAC value represents the current vehicle’s required deceleration to avoid a crash with the preceding vehicle. The definition is the speed difference between the current and preceding vehicles divided by their closing time. DRAC is given in Equation 7 for the current vehicle n and the preceding vehicle n–1:
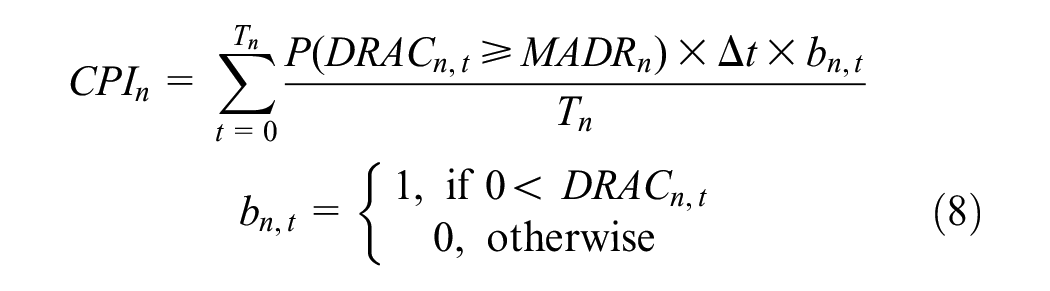
Crash-Potential Index
The CPI estimates the probability that the current required DRAC exceeds the vehicle’s MADR. The MADR is the braking capability of each vehicle and depends on factors such as pavement conditions, vehicle weight, tires, and braking conditions. In this study, MADR is set to follow a truncated normal distribution with a mean value of 8.45
Rear-End-Collision Risk Index
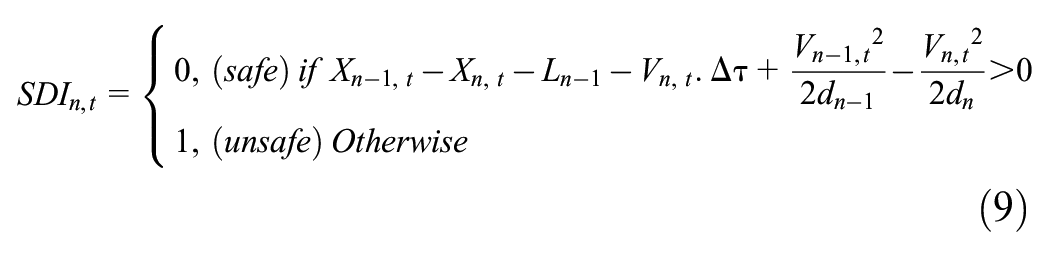
Oh et al. ( 32 ) proposed the RCRI to estimate the safety of road users’ interactions using the stopping distance of the preceding and current vehicles. To avoid a rear-end collision, it is required that the stopping distance of the preceding vehicle n–1 at any time should be longer than the stopping distance of the current vehicle n. The equations for RCRI are given in Equations 9 and 10:

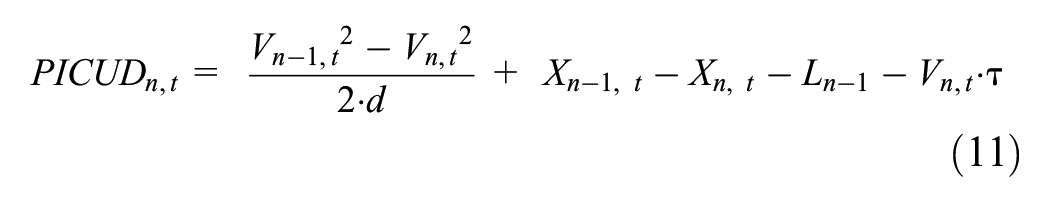
Potential Index for Collision with Urgent Deceleration
PICUD, developed by Uno et al. ( 33 ), estimates the risk margin of the preceding and current vehicles in emergency braking situations. The function is defined as the distance between two successive vehicles n–1 and n when they stop with emergency braking. PICUD is given in Equation 11:
Model Calibrations and Simulations
Simulation Algorithm
The acceleration-control algorithm for vehicles equipped with speed advisory systems (SASs) has been extensively studied in the literature ( 34 – 36 ). However, most models rely on the default parameters of car-following models in simulation software. Therefore, their vehicle dispatching and car-following logic are homogeneous for HDV and CAV simulations. On the other hand, field-based studies are limited in applying various scenarios, such as changing parameters for driving behaviors or applying various MPRs. This paper employs the SAS simulation framework depicted in Figure 1, which was developed in the literature ( 37 ). We calibrate the simulation framework for the used case study area, and the data are expanded in this study compared to the original simulation framework. The simulation framework provides the optimum speeds to CAVs, enabling them to pass signalized intersections while minimizing stopping time at the red light. The main advantage of this simulation framework is to consider the empirical trajectory data within CAV simulations. Specifically, the heterogeneity of HDVs is ensured for realistic simulations to analyze conflicts between vehicles.
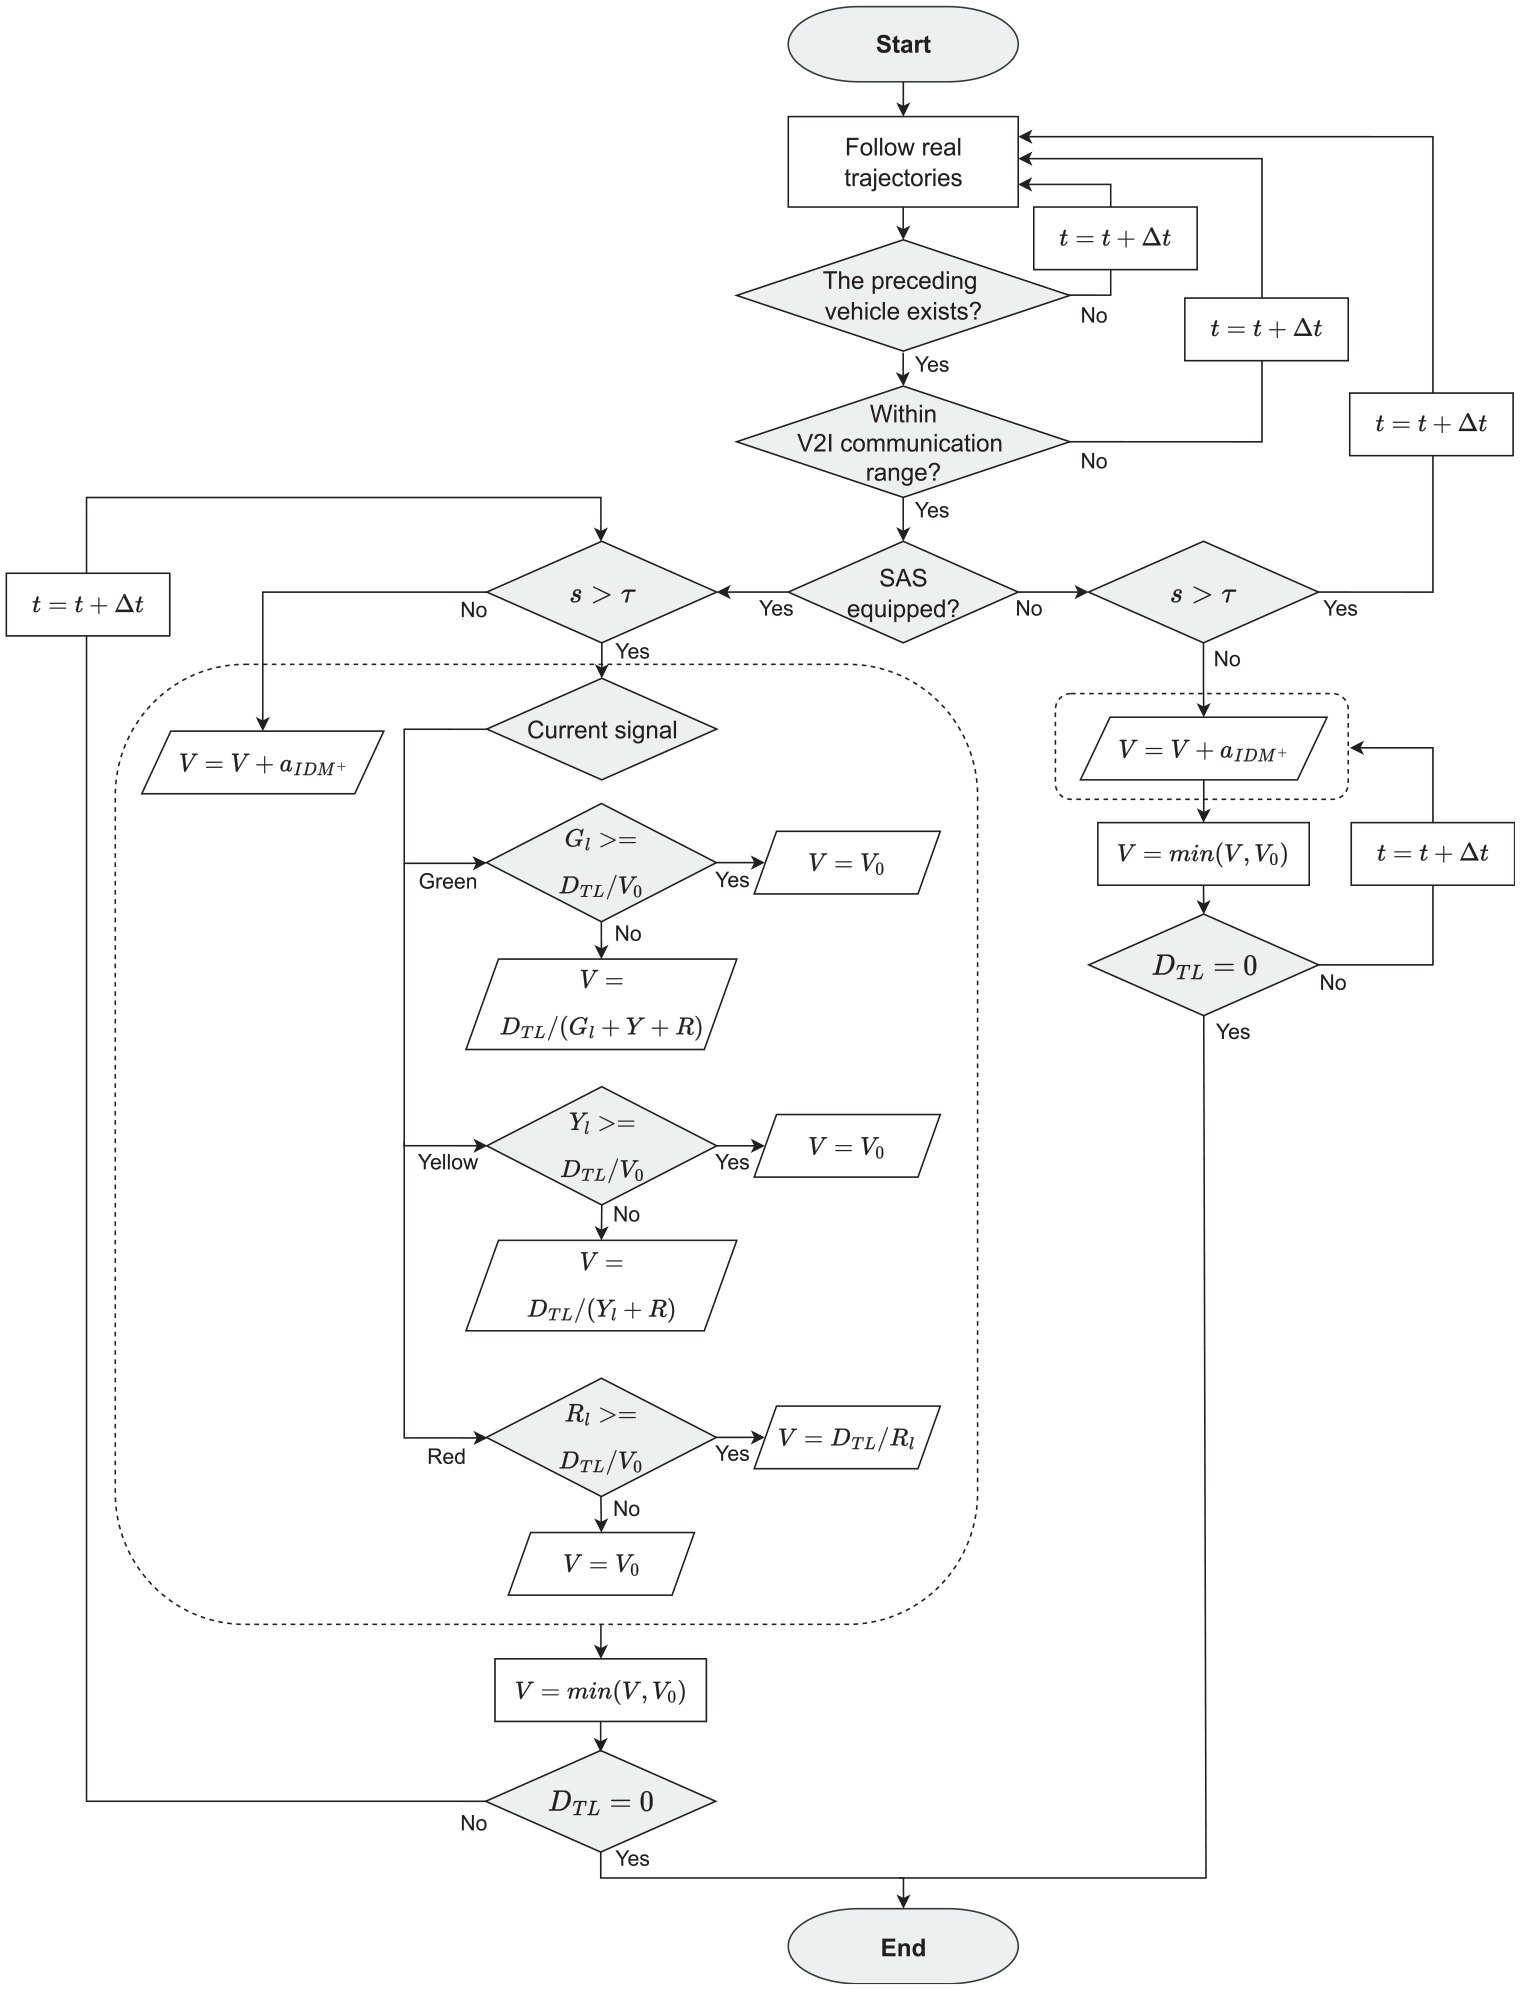
Integrated acceleration-control algorithm ( 37 ).
Figure 1 shows how the CAV algorithm is utilized in empirical HDV trajectories. Initially, all vehicles follow the observed HDV trajectories. When the algorithm generates vehicles, it randomly replaces HDVs with CAVs based on a predefined MPR. The assigned CAVs change their speed to the optimum speed once entering the V2I communication range to pass a signalized intersection without stopping at the red light. The HDVs, with no conflict with other vehicles during simulations, follow the real vehicle trajectories until the end of the simulations. To ensure collision-free simulations, the vehicles follow the modified intelligent driver model (IDM; see
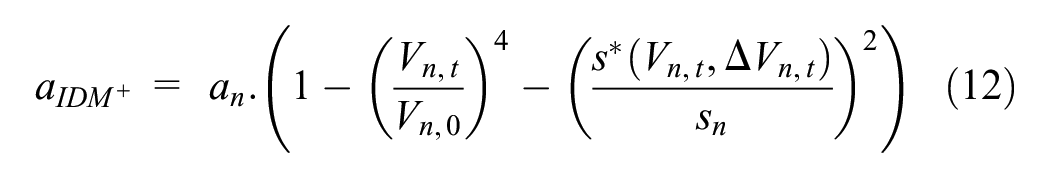
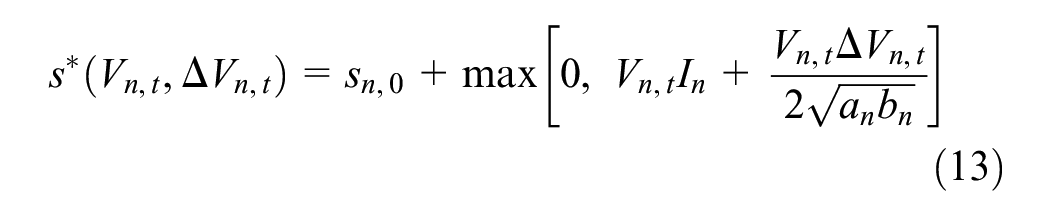
where
Case Study Area
For HDVs, we utilized the Next-Generation Simulation (NGSIM) data obtained from Peachtree Street, Atlanta, GA, U.S.A. ( 14 ). Therefore, the 0% MPR scenario represents the real vehicle trajectories in the case study area. We opted for the NGSIM data primarily because (i) the vehicle trajectory data include all required input variables to run the algorithm and (ii) the case study intersection has a longer approach lane than that of other microscopic datasets. The data include detailed vehicle trajectories with vehicle ID, time, x–y coordinates, distance gap, speed, acceleration, vehicle type, and vehicle length. The recorded arterial segment is about 600 m long and consists of two or three lanes in each direction. This study specifically focused on the northbound vehicles in the upper 230 m on Peachtree Street depicted in the red box in Figure 2.
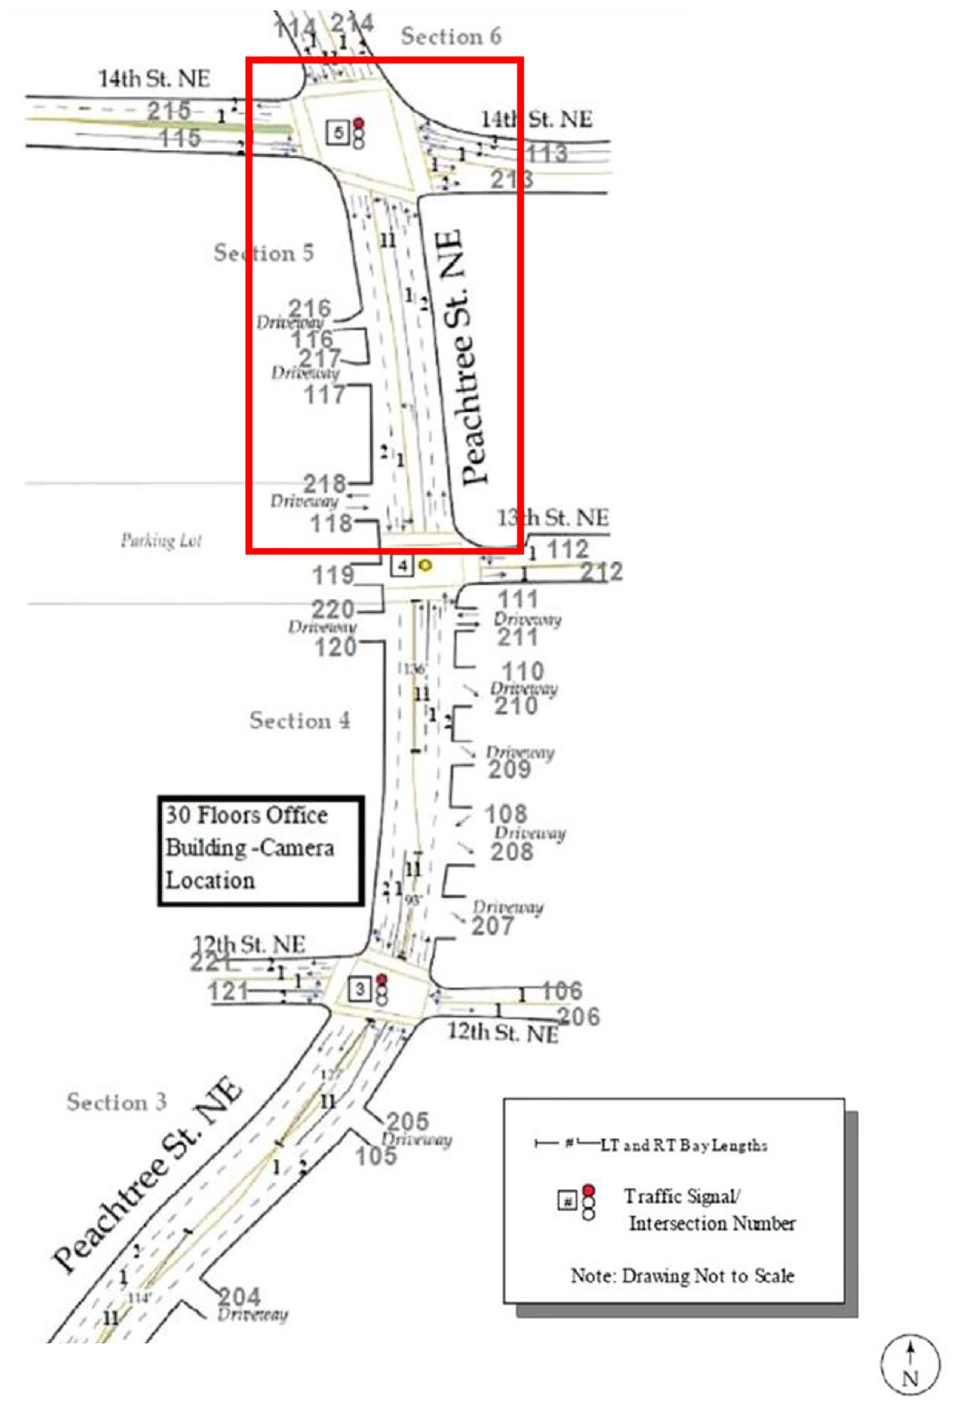
The north segment of the Peachtree Street geometry ( 14 ).
Model Calibration
Before calculating the safety indicators, it is necessary to test if the vehicle trajectories generated by IDM+ well represent the car-following behavior of real vehicles. Figure 3 shows the simulation results comparing the real vehicle trajectories and the IDM+ generated trajectories. The black-solid line shows the preceding HDV (i.e., real vehicle trajectories) and the black-dashed line shows the following HDV. The red-dashed line shows the IDM+ generated trajectories based on the same leading HDV. We ran simulations with all possible values of parameters in a reasonable range and estimated a corresponding root-mean-square deviation (RMSE) to find the parameters that result in the minimum RMSE values. The RMSE values are calculated based on the location of the actual vehicles and simulated vehicles at each time instant. Sixteen car-following trajectories from the case study were used for calibration and samples are shown in Figure 3. The calibration result indicates that the average RMSE value of 0.82 is the lowest, demonstrating that the calibrated IDM+ reproduces similar following vehicle trajectories relative to the real following vehicles. It is worth noting that achieving high accuracy in calibrating human drivers’ trajectories is challenging because of the diverse driving characteristics exhibited by different drivers.
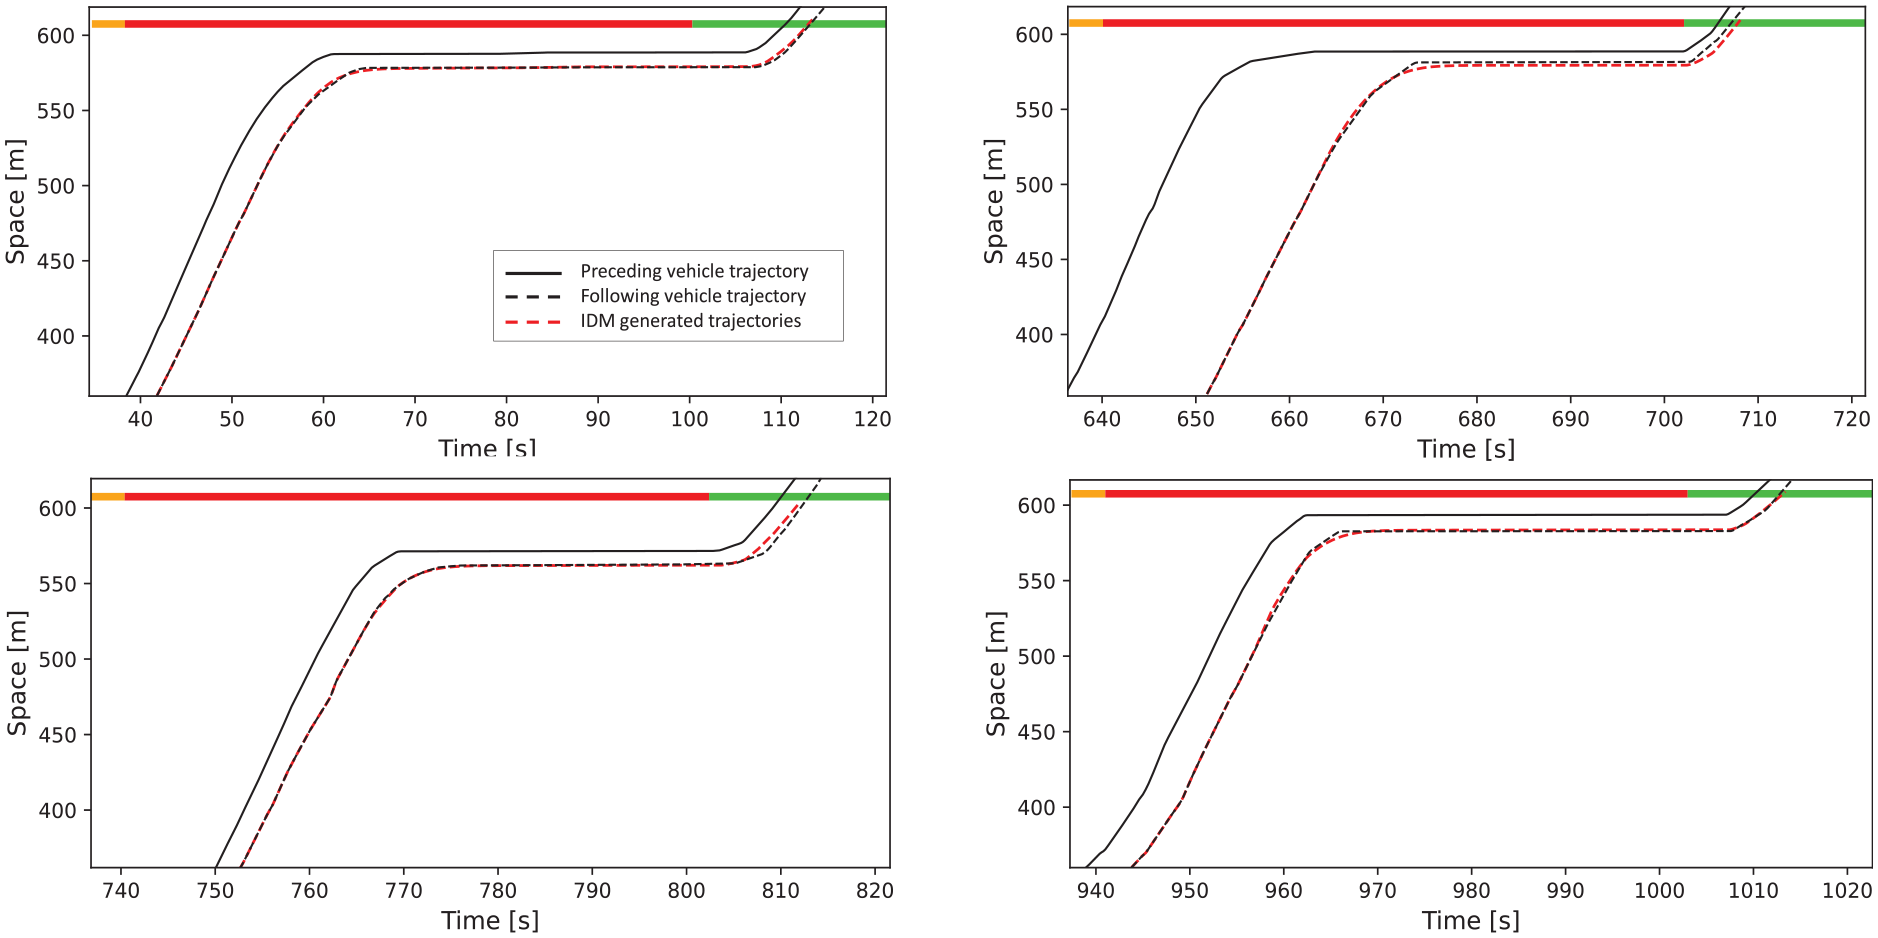
The calibration of the IDM+ car-following model.
Table 1 shows the calibrated parameters used in the simulation which represent similar car-following trajectories compared to the real vehicle trajectories. Desired speed (
Calibrated IDM+ Parameters for Simulation Vehicles
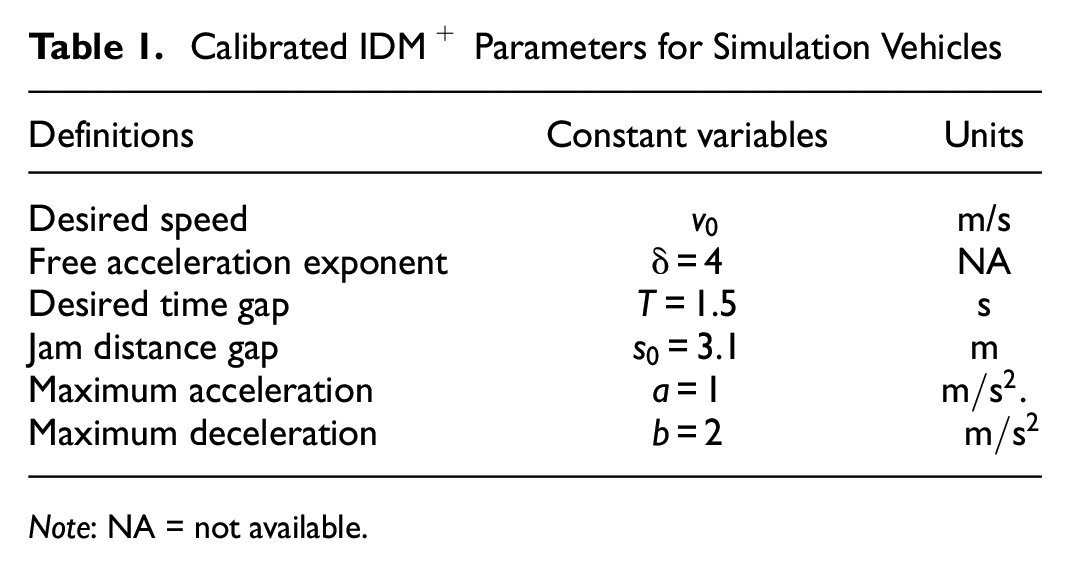
Note: NA = not available.
Vehicle Trajectories from Simulation Results
Figure 4 illustrates the vehicle trajectory results generated by the simulations using the algorithm with respect to the MPR scenarios. The red-dashed lines represent CAVs and the black-solid lines are HDVs. The green-, yellow-, and red-colored bars on the upper side indicate the traffic signal in the case study area. From 25% MPR, we randomly replace HDVs with CAVs using the algorithm. Because a different rank of CAVs in the HDV group can affect the safety evaluation results, we conducted five iterative simulations by randomly changing the rank of CAVs. Figure 4 shows one of five iterations of the CAV position in the vehicle group. As the algorithm is designed, the trajectory results show that CAVs perform an early deceleration at 100 m from the stop line (communication range) to avoid stopping at the intersection. The traffic impact of CAVs is recorded in the output trajectory data, which are used as an input to calculate the safety indicators.
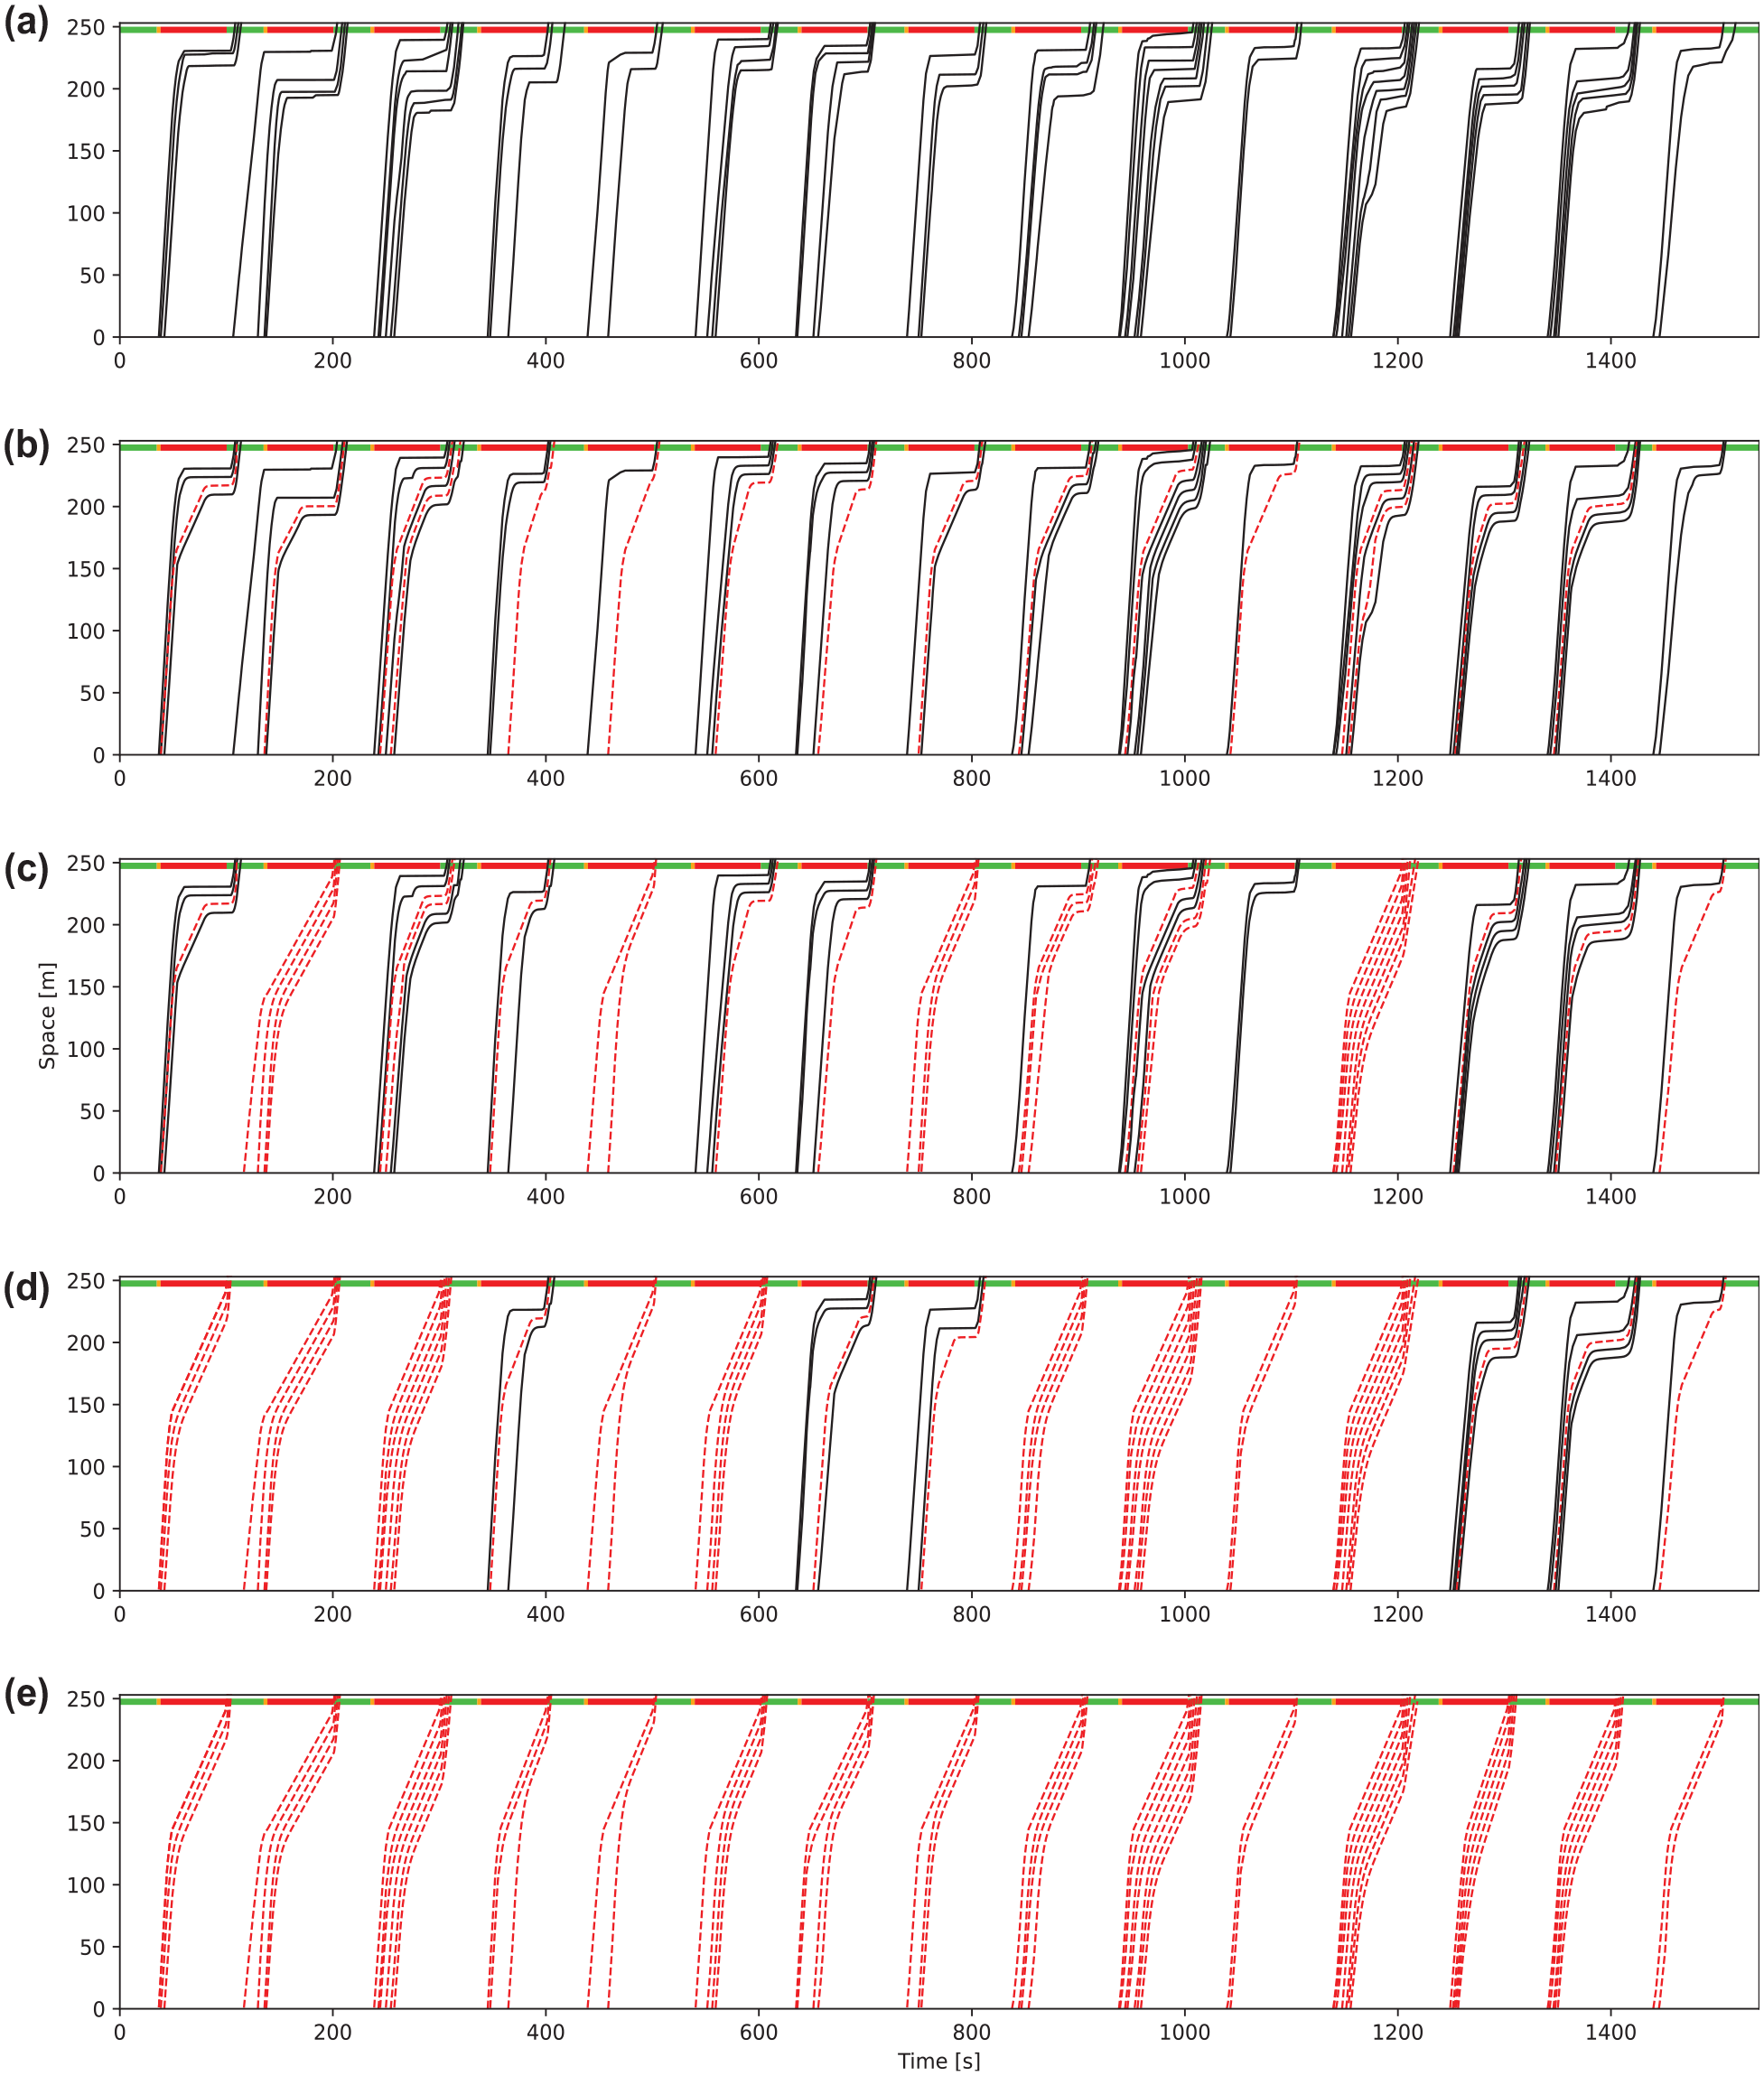
Sample simulation results in mixed-traffic situations at connected and automated vehicle market penetration rates (MPRs): (a)–(e) the MPRs range from 0% to 100% in 25% increments.
Comparison of the Safety Indicators
This section illustrates how safety indicators reflect various driving behaviors of HDVs and CAVs, utilizing real vehicle trajectories and the simulation-generated CAV trajectories at various MPRs. Firstly, we compare the overall safety implications estimated by the safety indicators for driving behaviors of HDVs and CAVs. Secondly, we analyze potential car-following scenarios between HDVs and CAVs to investigate the safety indicators associated with different vehicle pairs during car-following situations.
Experimental Assumptions
The CAV simulated trajectories represent the best-case scenario for CAV operations at signalized intersections assuming the following: (i) the acceleration-control algorithm has no communication or automation error; (ii) the algorithm has no communication delays; and (iii) the CAV movements are homogeneous and follow the same algorithm without system failure. On the other hand, HDV maneuvering is the same as real vehicles, which has some perturbations between vehicles.
Proximity-Based Safety Indicators
Overall Safety Implications from the Proximity-Based Safety Indicators
Figure 5 shows violin plots of the risk estimation results for the proximity-based safety indicators with respect to the MPRs of CAVs. Each safety indicator is measured for a pair of the preceding and current vehicles according to the MPRs. The TTC and PET results are plotted in two ways with minimum and overall values. The minimum TTC and PET values indicate the most severe instant for a pair of preceding and current vehicles during their simulation period. The violin plots indicate the frequence of the resulting indicators. In addition, we also investigated the overall TTC and PET values since the minimum values only represent one simulation instance during the simulations. The overall TTC and PET values indicate the degree of safety of the analyzed lane during the simulation period. Lower values of TTC and PET reflect more dangerous traffic situations. The minimum and overall TTC values show that the increasing proportion of CAVs improves traffic safety. The minimum TTC values from the real vehicle trajectories move toward higher values from 75% MPR. In addition, overall TTC values show a gradual increase as more HDVs become CAVs.
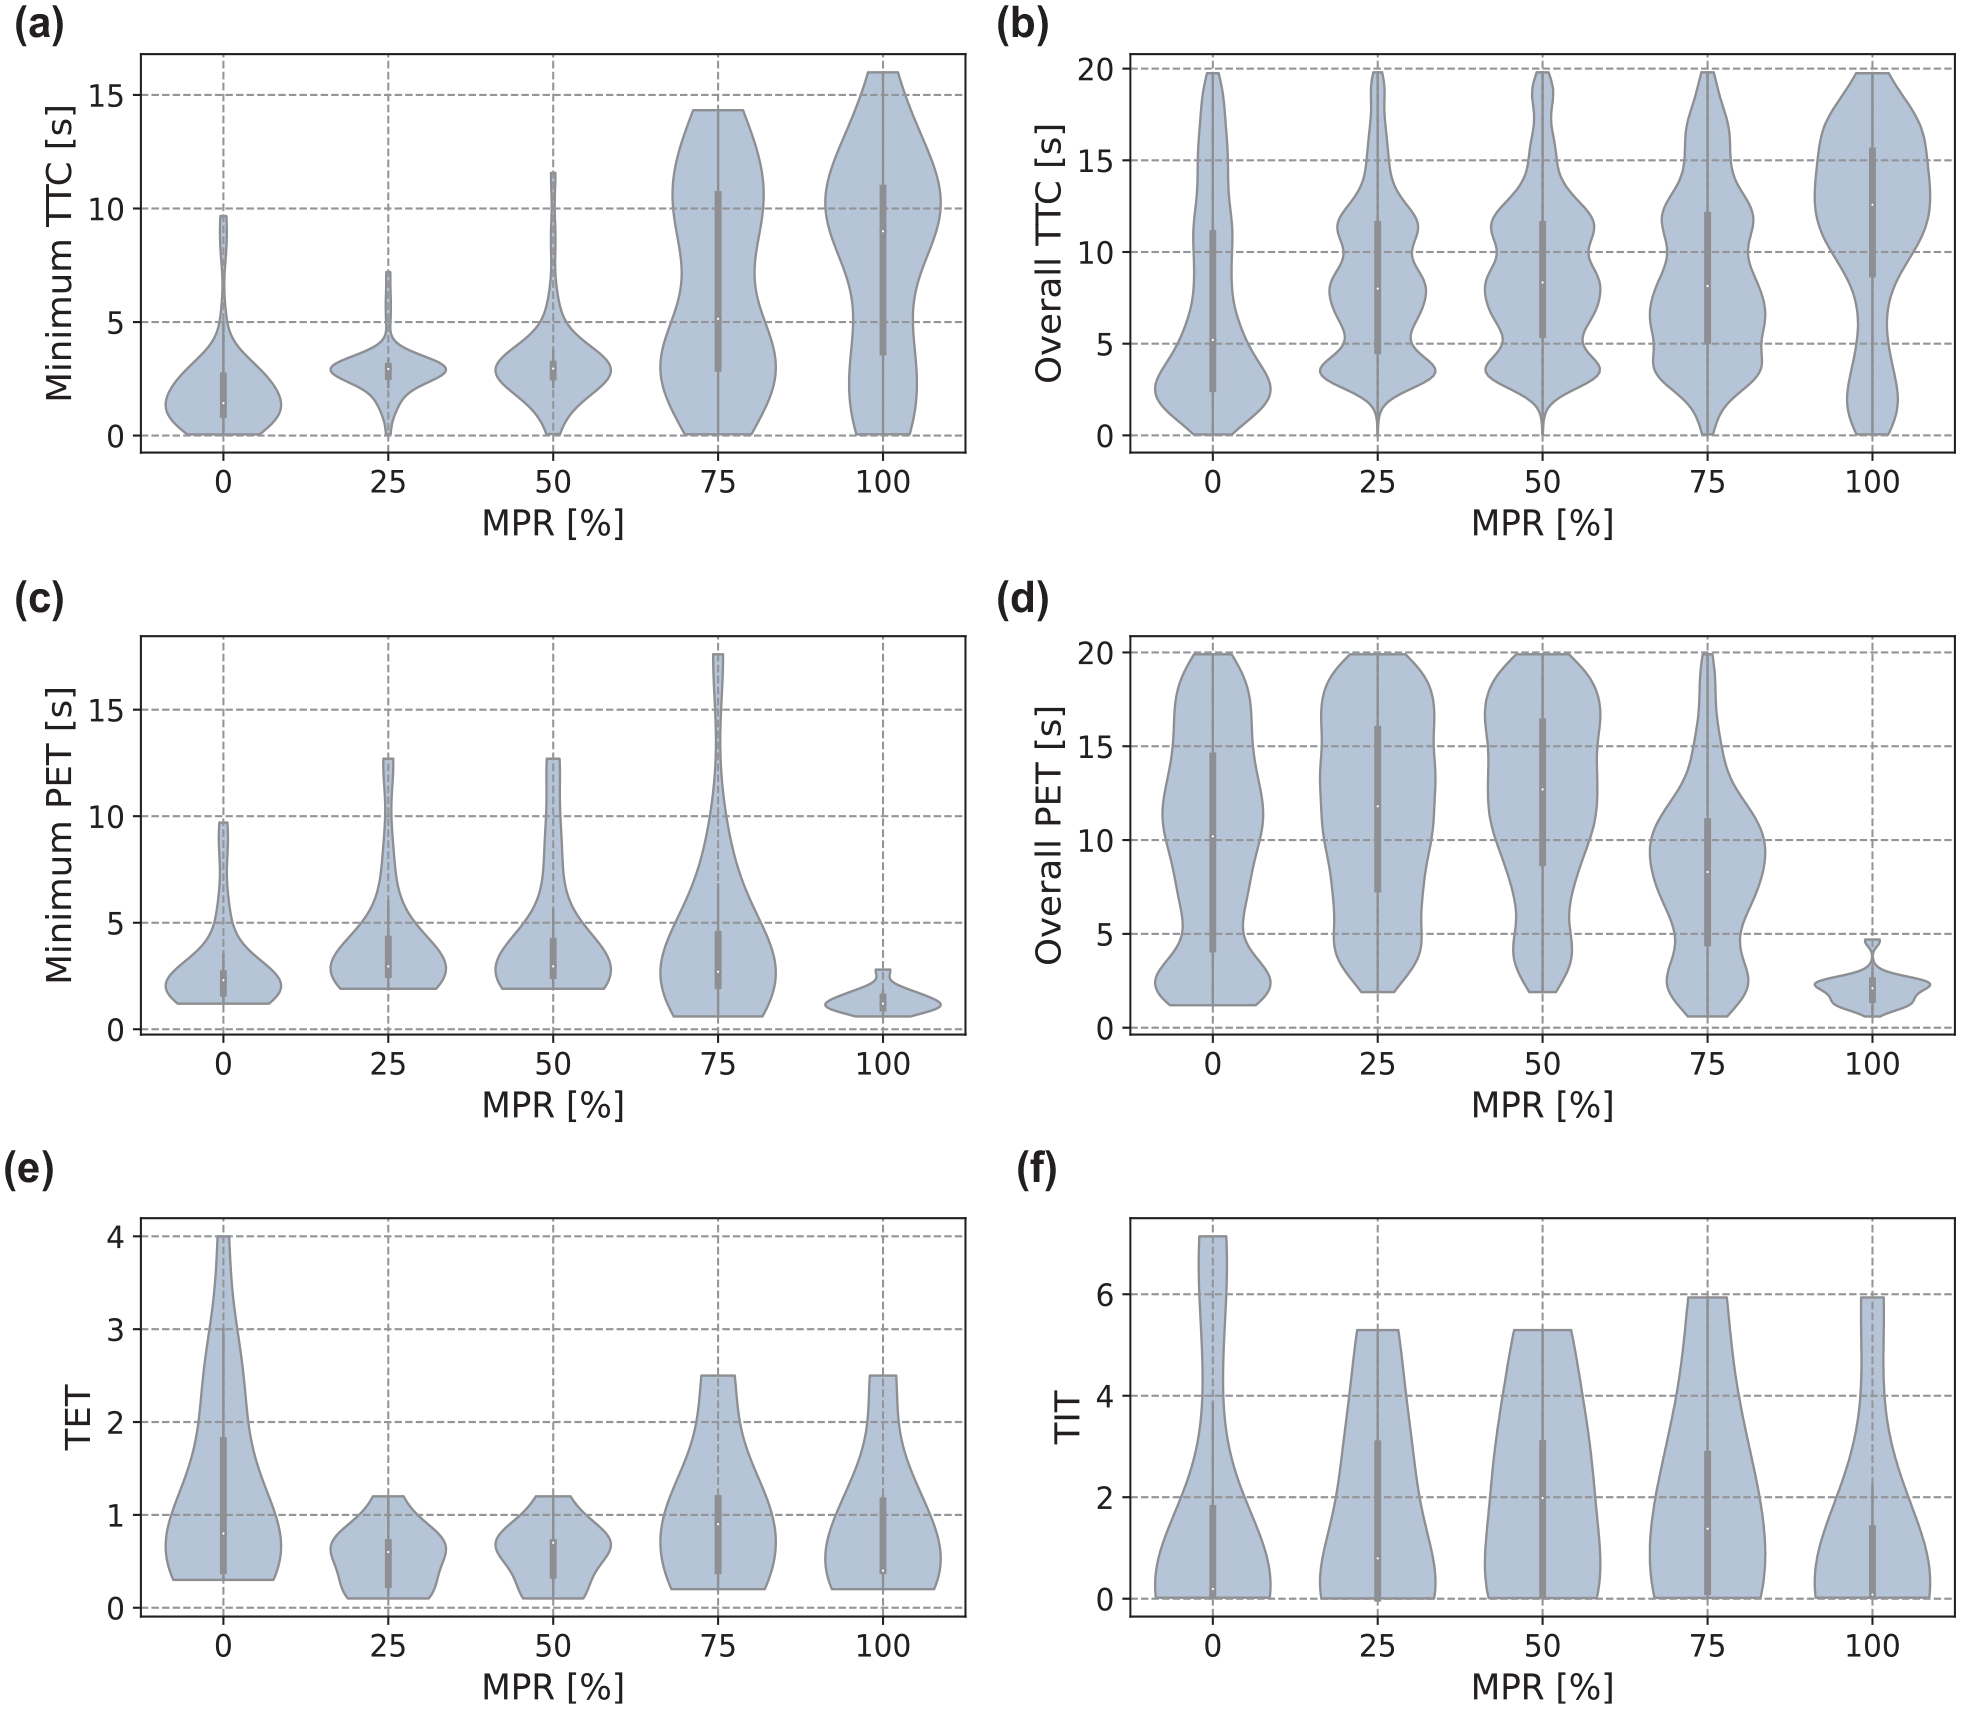
Violin plots of the proximity-based safety indicators from the simulation results at connected and automated vehicle market penetration rates (MPRs) from 0% to 100% in 25% increments: (a) minimum time-to-collision (TTC), (b) overall TTC, (c) minimum post-encroachment time (PET), (d) overall PET, (e) time-exposed TTC (TET), and (f) time-integrated TTC (TIT).
One interesting observation is that TTC and PET values indicate the opposite safety trends as MPR increases, despite yielding the same simulation results. TTC results suggest that safety improves with an increase in CAV MPR, while PET results show the opposite safety evolution. This contradiction arises from the vehicle speed consideration. The PET equation does not account for the velocity of the preceding or current vehicles in the car-following situation. Consequently, small gaps in the 100% CAV scenario are simply interpreted as dangerous traffic situations. On the other hand, TTC values consider the speed of the preceding and current vehicles. Even when the time gap between the preceding and current vehicle is small, the denominator of the TTC equation (
The TET values count the severe traffic conflicts during the simulation by counting instances with TTC below the TTC threshold. The outcome indicates intuitively how long severe traffic situations lasted between each pair of successive vehicles during the simulations. The result shows that the TET values significantly decrease from a small portion of CAVs (e.g., 25% MPR). The TIT result shows similar results to TET because they are both estimated based on the TTC values with a threshold.
Detailed Comparisons of the Safety Indicators in CAV-Involved Car-Following Situations
The previous section compared the proximity-based safety indicators based on the results of all trajectories. In this section, we extracted a pair of real vehicles from the trajectory data to demonstrate how the safety indicators interpret different car-following situations between HDVs and CAVs. The first two vehicles in the red-dotted line box in Figure 6a are extracted for the analysis. Note that we investigate TTC and PET in this section because TET and TIT are basically calculated based on the TTC values with a threshold.
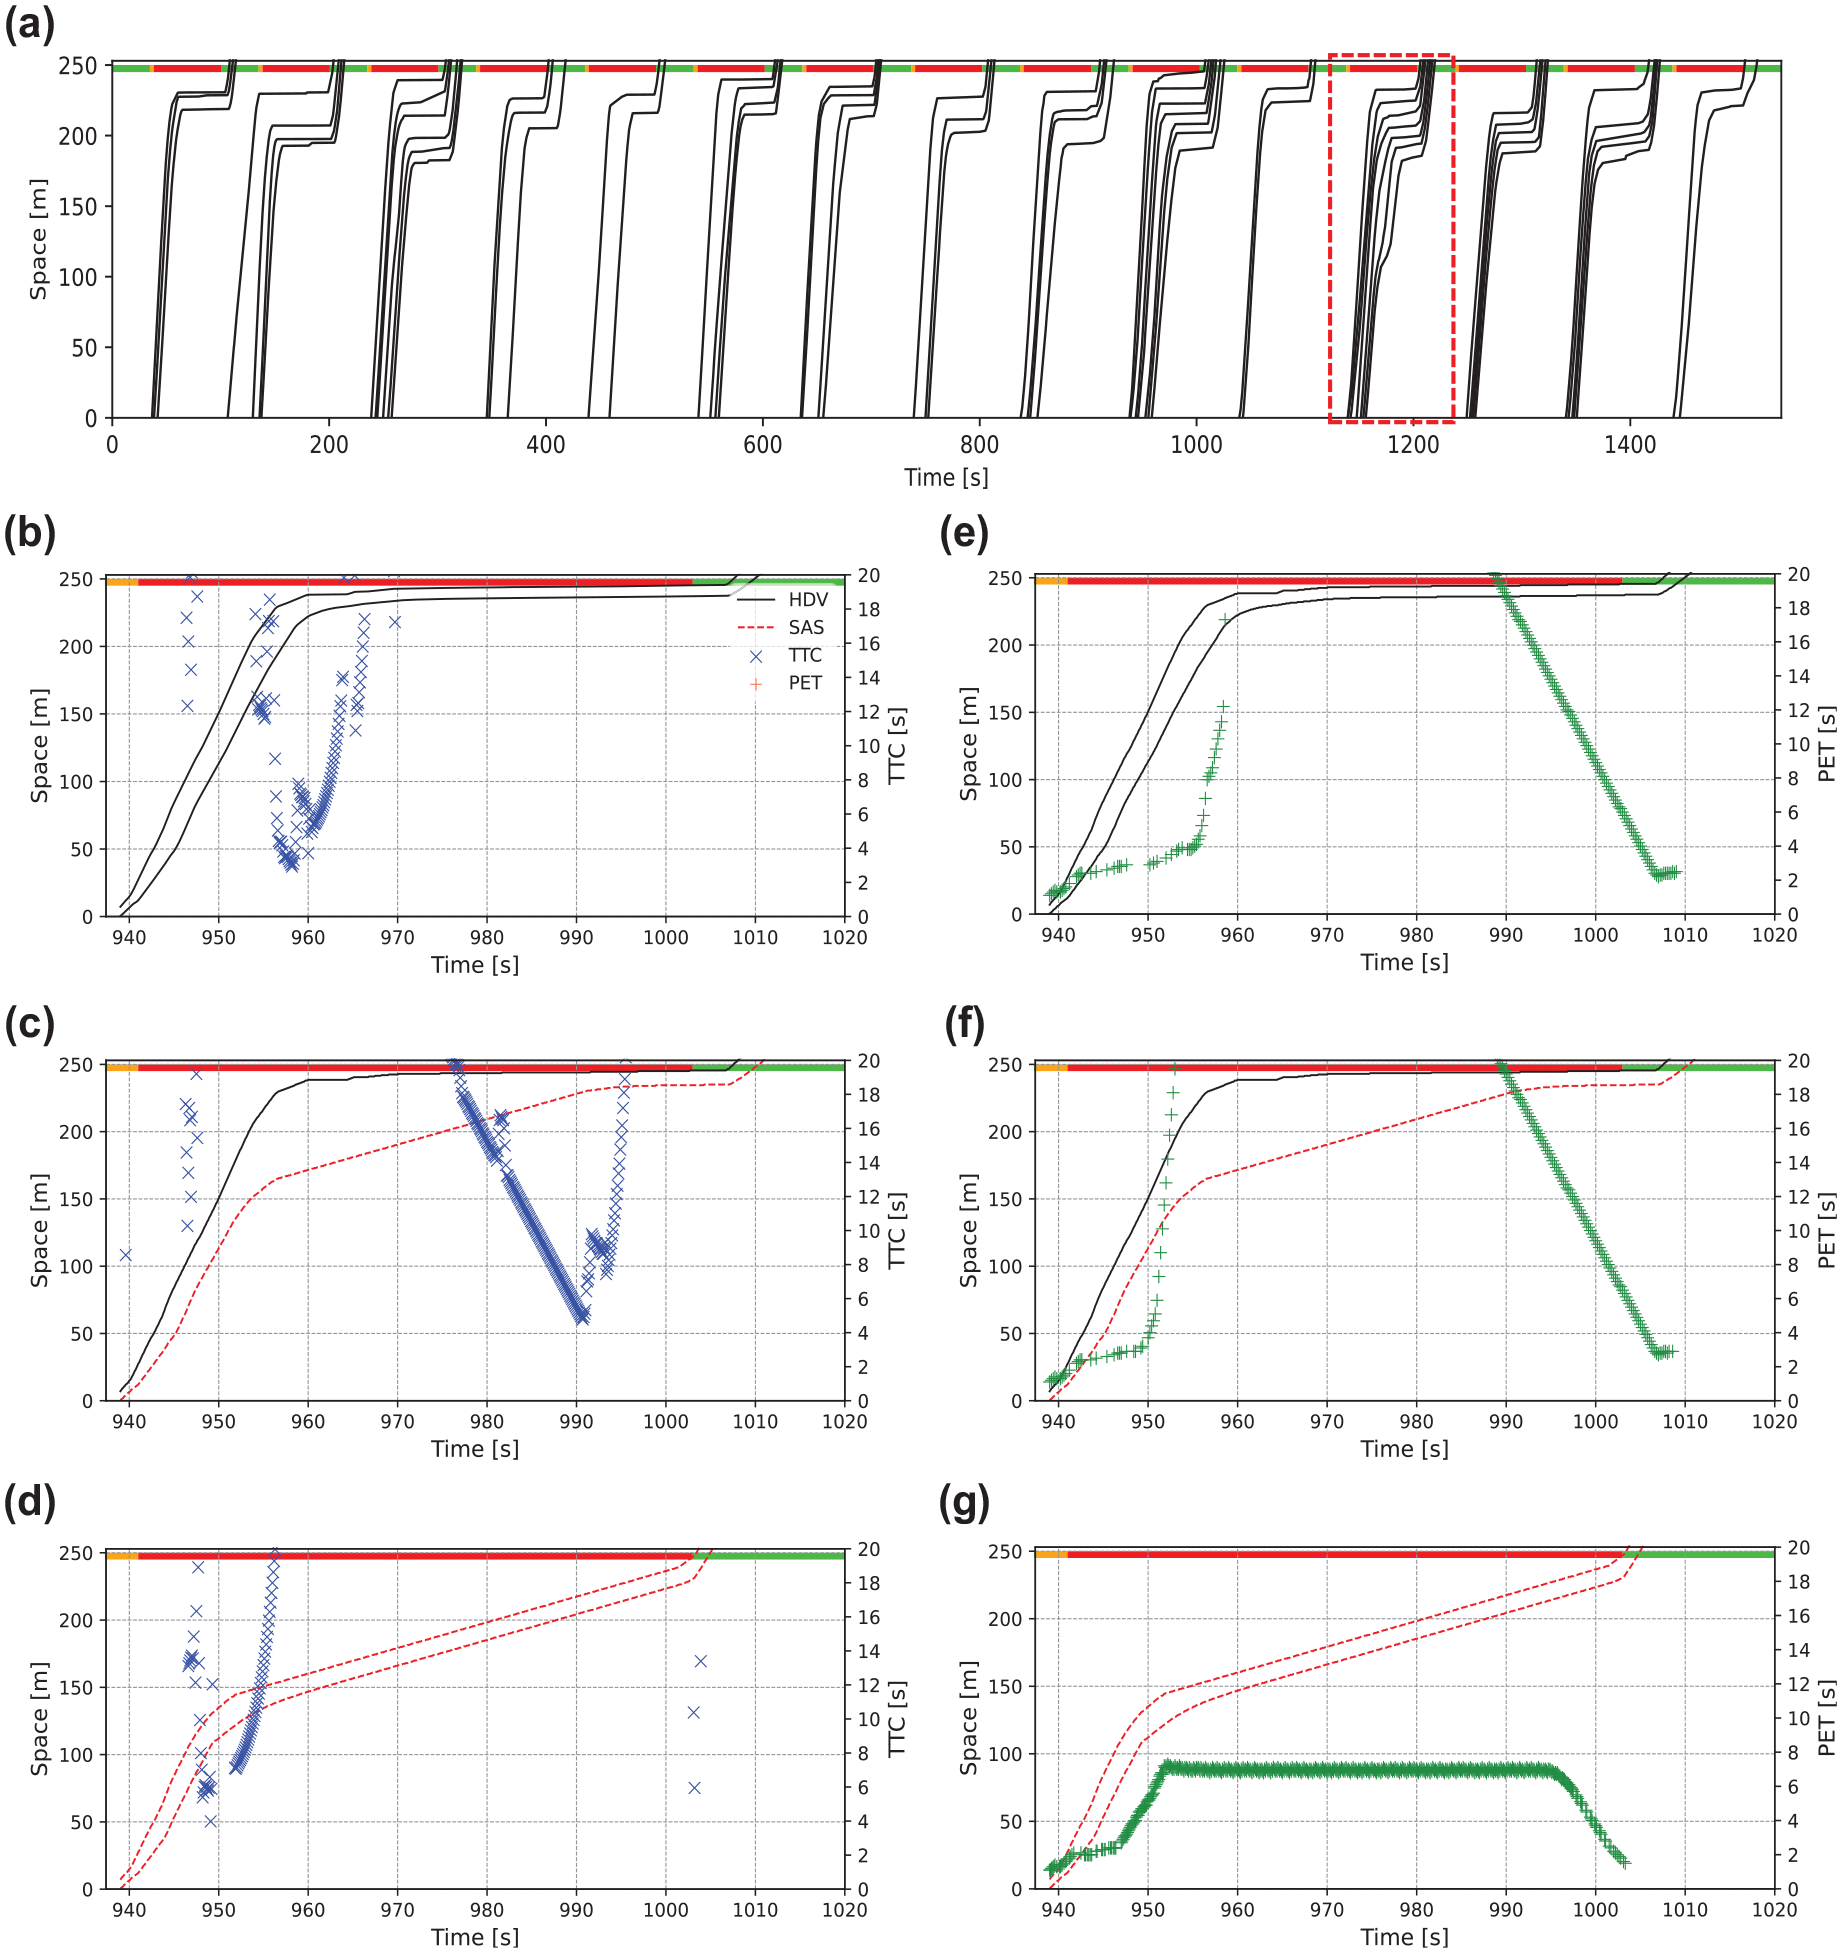
Detailed safety indicator results with respect to car-following situations: (a) the real vehicle trajectory data, (b) the time-to-collision (TTC) results for two human-driven vehicles (HDVs), (c) the TTC results for a connected and automated vehicle (CAV) following a HDV, (d) the TTC results for two CAVs, and (e)–(g) the post-encroachment time (PET) results in the same car-following situations as (b)–(d), respectively (TTC in blue and PET in green).
There are four different car-following situations when operating two types of vehicles as follows.
A CAV followed by a HDV. Note that this car-following situation is not included since it is analogous to the car-following situation (iii) in the simulation.
Figure 6 shows different car-following situations in vehicle trajectories as well as the safety indicator estimation results based on the simulation time. With respect to the car-following situations, we estimated the TTC values in Figures 6, b–d, and the PET values in Figures 6, e–g. Note that there are two y-axes for space (m) on the left-hand side and the safety indicators (TTC or PET) on the right-hand side y-axis. When both vehicles are HDVs, the results show that the minimum TTC occurs (most severe instance) when the preceding vehicle is stopped at an intersection while the following vehicle is approaching at relatively high speed, and the location of the minimum TTC is near an intersection. On the other hand, the minimum TTC occurs where the communication range starts when both vehicles are CAVs since they start reducing speeds from this location (i.e., around 100 m before the stop line). When the preceding vehicle is a HDV followed by a CAV, the conflict situations occur at a later simulation time than other car-following situations, which is close to the green light onset since the following CAV is approaching an intersection at a lower speed to minimize idling time while the preceding HDV arrives to the intersection at an earlier simulation time. The result shows that the minimum TTC is increased when there is a CAV in car-following relative to both HDVs. One interesting observation is that the TTC indicator is not able to estimate the safety impact when the preceding and following vehicles have similar speeds, for example, the car-following situations between HDVs in Figure 6b and CAVs in Figure 6d. Note that this is a limitation of the simple motion prediction method at constant speed and direction, not of the TTC indicator. On the other hand, PET shows different tendencies compared to TTC. Because CAVs operate with a small gap with optimum speeds in Figure 6g, the PET values are smaller compared to Figures 6, e and f . However, the PET results are similar between Figures 6, e and f , because the time the following vehicle reaches the preceding vehicle’s location is similar regardless of the approaching speed control.
Deceleration-Based Safety Indicators
Overall Safety Implications from the Deceleration-Based Safety Indicators
The limitation of proximity-based safety indicators is that they do not consider the deceleration capability and, more generally, the evasive maneuver capabilities of the analyzed vehicles. Figure 7 illustrates the results from the deceleration-based safety indicators that consider the vehicle MADR. These indicators can be more responsive to the simulated vehicles’ capabilities. Figure 7a shows the required DRAC between the preceding and current vehicles in each simulation time step. The higher value of DRAC represents the more dangerous situation since the vehicle needs high decelerations to avoid a collision. The DRAC results show that the growing MPRs of CAVs can reduce the magnitude of the required deceleration. The CPI values in Figure 7b indicate that the higher MPR of CAVs improves traffic safety from the small number of CAVs. The RCRI values in Figure 7c indicate similar tendencies to the CPI results. On the other hand, the PICUD results show the opposite safety implications compared to other deceleration-based safety indicators, in that the increasing number of CAVs deteriorates traffic safety. The PICUD values fundamentally represent the distance gap after both the preceding and following vehicles perform sudden stops. The PICUD leads to different safety implications since operating CAVs at similar speeds between the preceding and following vehicles results in the
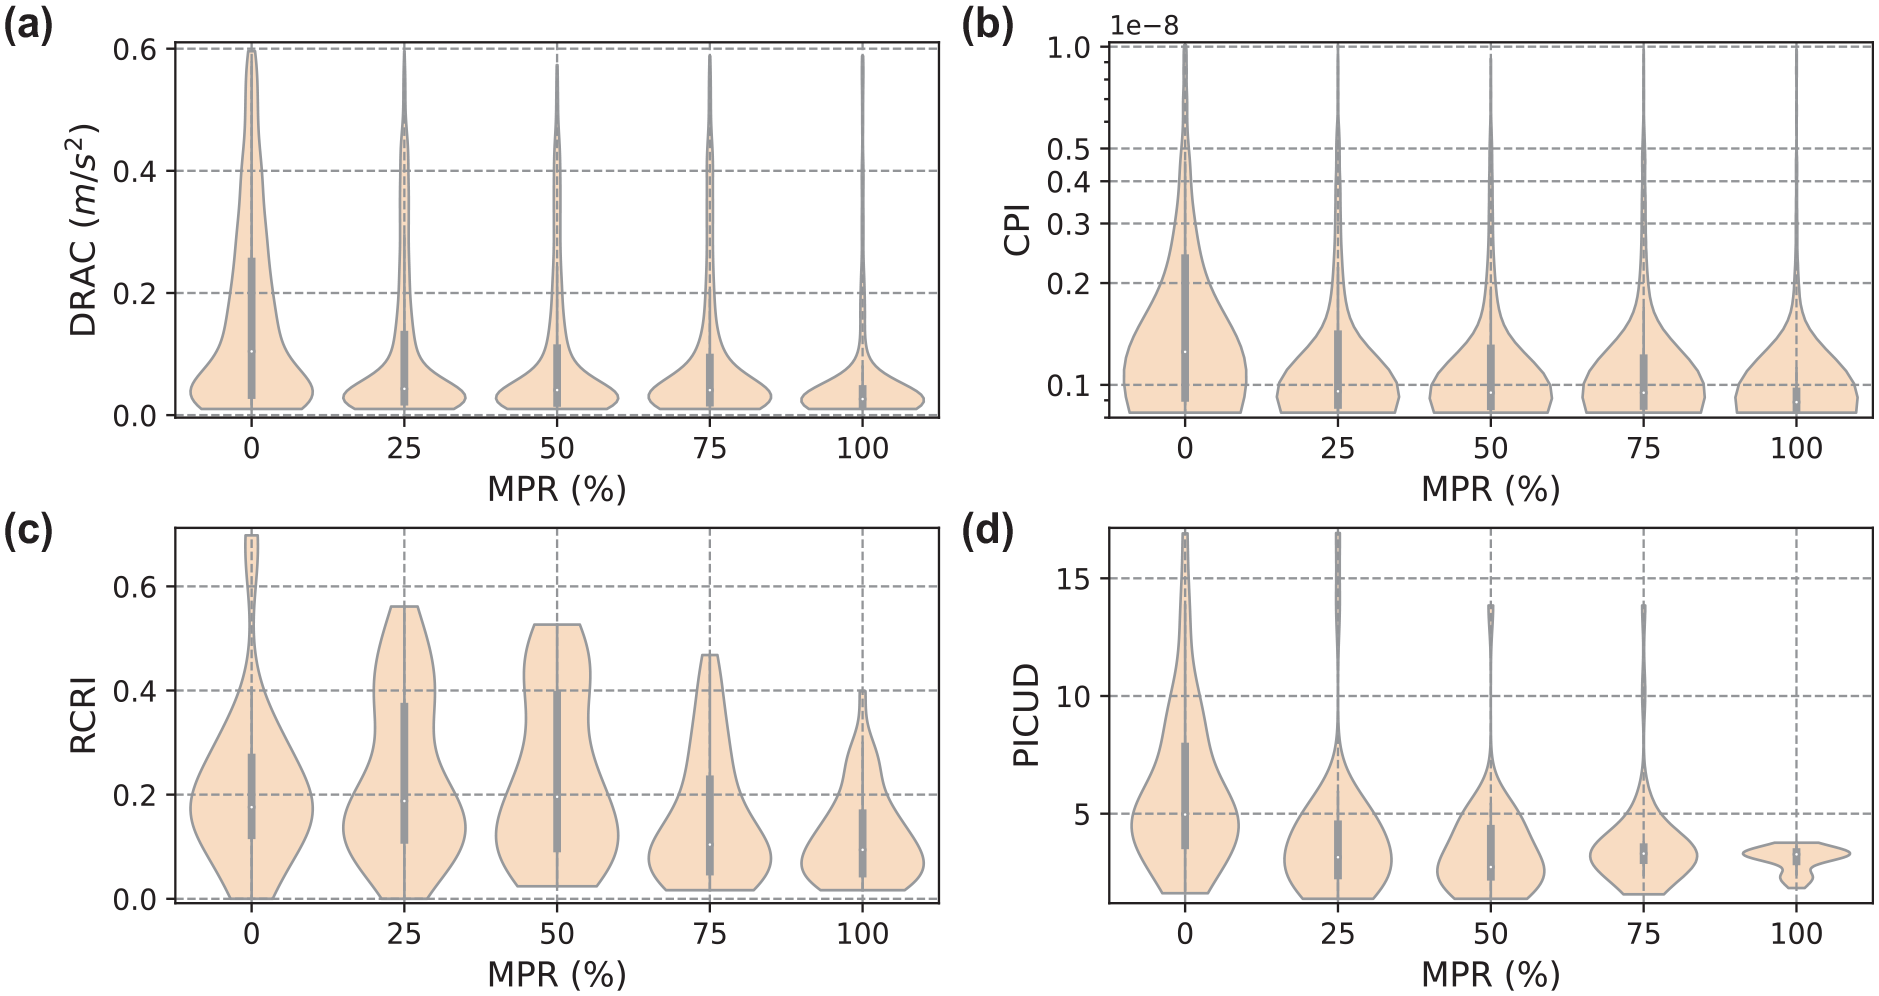
Deceleration-based safety indicators from the simulation results at connected and automated vehicle market penetration rates (MPRs) from 0% to 100% in 25% increments: (a) deceleration rate to avoid a crash (DRAC), (b) crash-potential index (CPI), (c) rear-end-collision risk index (RCRI), and (d) potential index for collision with urgent deceleration (PICUD).
Detailed Comparisons of the Safety Indicators in CAV-Involved Car-Following Situations
Figure 8 shows the results estimated by the deceleration-based safety indicators (DRAC and PICUD) in different car-following situations between HDVs and CAVs. Note that we exclude the CPI and RCRI since their results are discrete; the CPI is dependent on the DRAC values and the RCRI has a similar equation to the PICUD. Also, note that there are two y-axes in Figure 8, space (m) on the left-hand side and the safety indicators on the right-hand side y-axis. The results show that the DRAC values are calculated mainly when vehicles are approaching an intersection and when vehicles accelerate after the green light onset in Figures 8, a and c, as the preceding and following vehicle speeds are almost the same. In addition, DRAC is not calculated when the speed of the following vehicle is lower than the preceding one, as with TTC. On the other hand, with a HDV followed by a CAV, the DRAC values are calculated almost continuously during a red light in Figure 8b. The result shows that DRAC is relatively higher for real vehicle trajectories than the CAV-involved car-following situations. However, the PICUD shows lower values in both CAV car-following situations in Figure 8f relative to real vehicle trajectories in Figure 8d, indicating different safety implications compared to other safety indicators. Since CAVs operate in a small gap with relatively higher speeds than real vehicles when approaching intersections, the distance remaining after an emergency stop is higher for vehicles operating at optimum speed in a small gap.
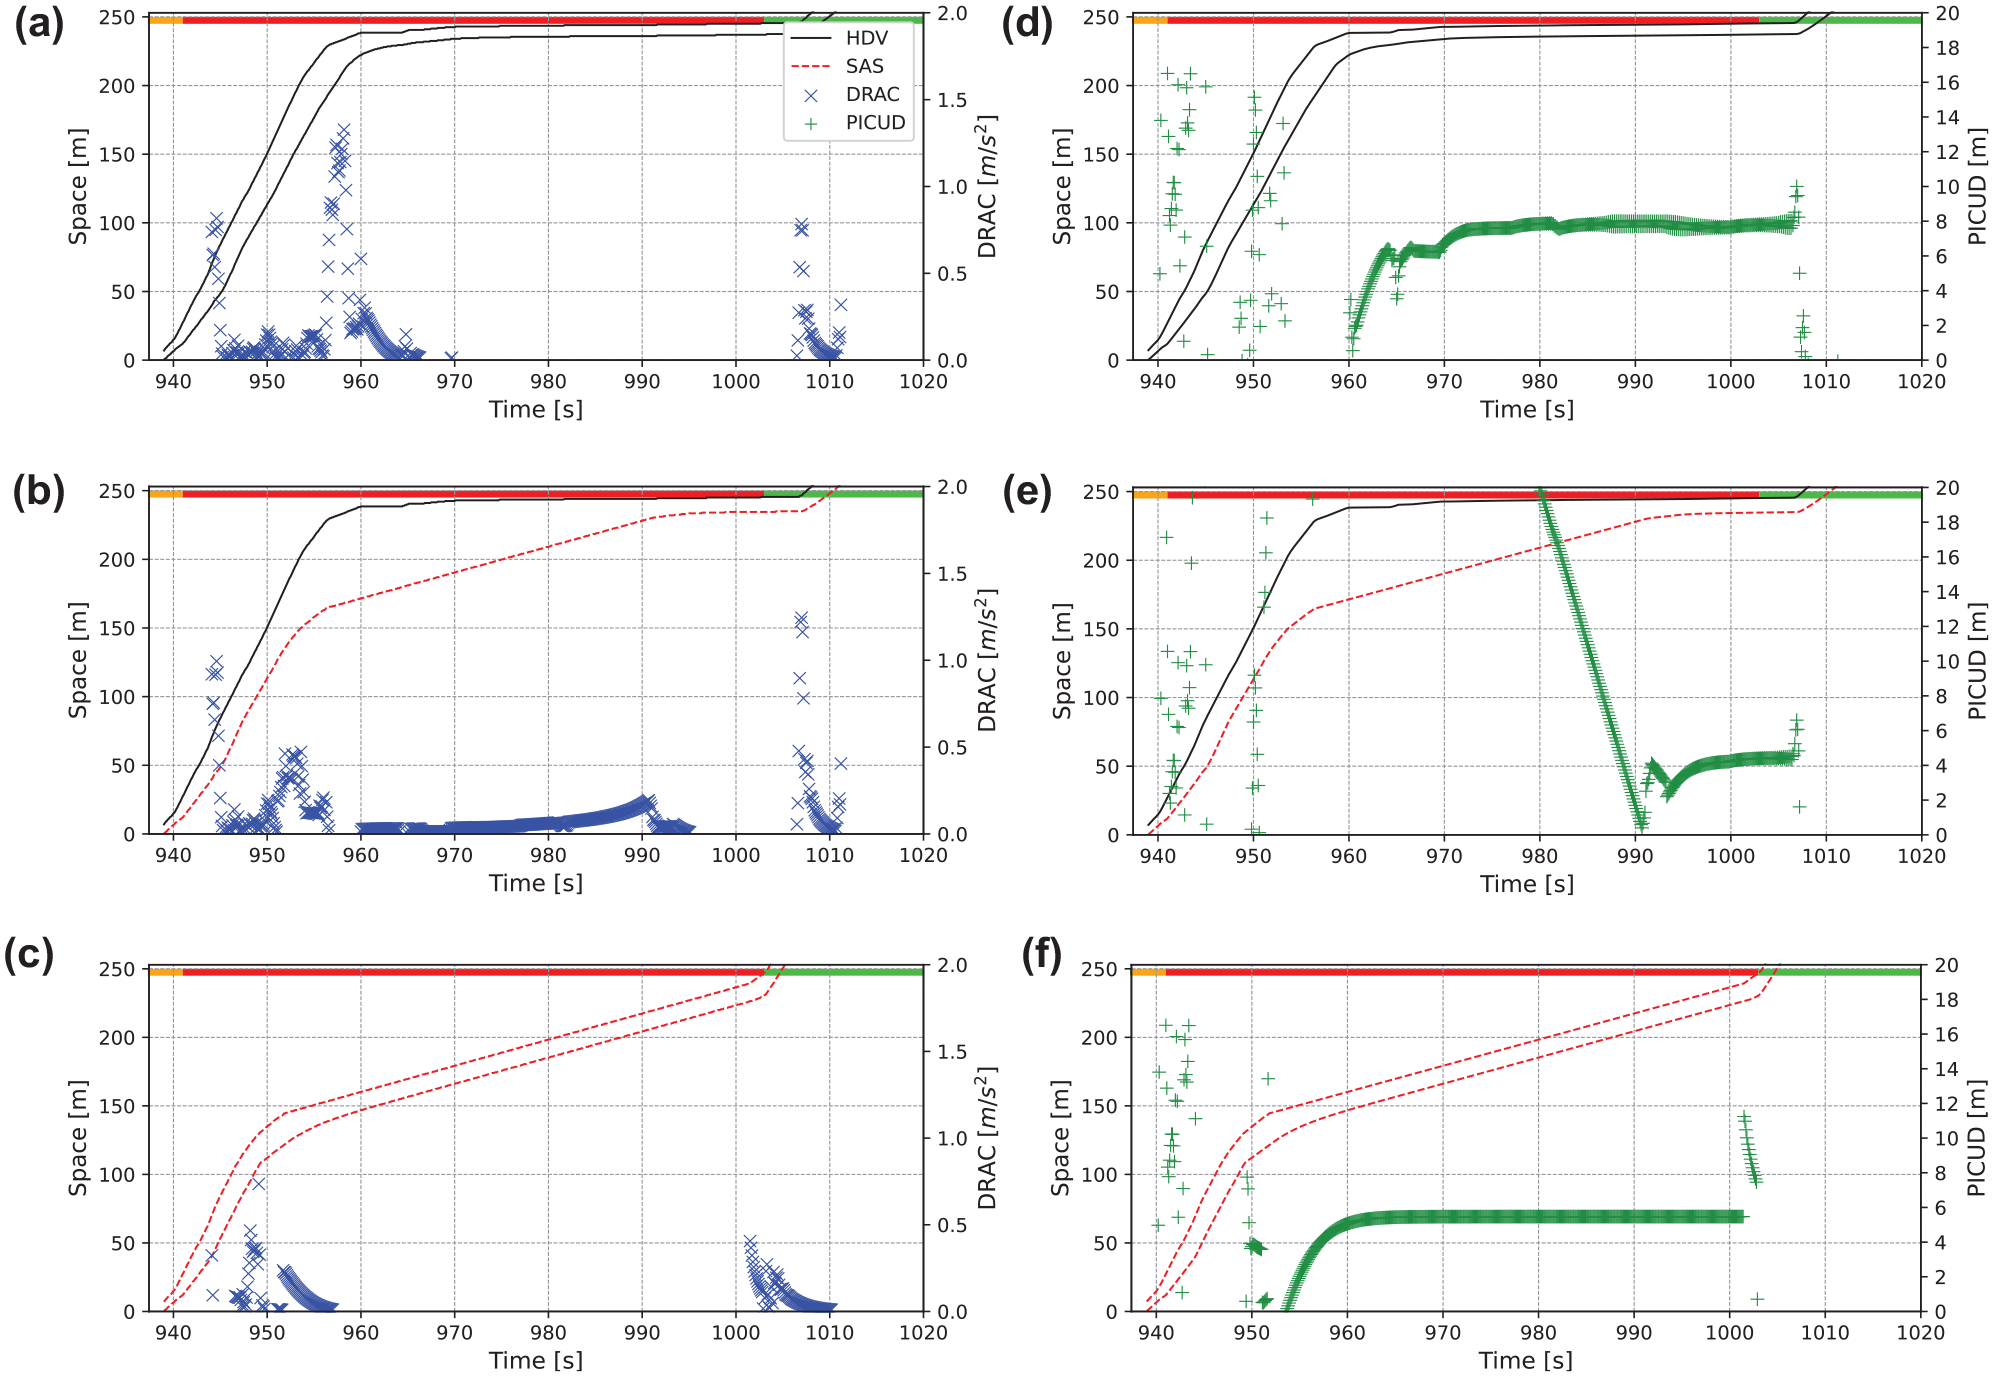
Detailed safety indicator results with respect to car-following situations: (a) the deceleration rate to avoid a crash (DRAC) results for two human-driven vehicles (HDVs), (b) the DRAC results for a HDV followed by a connected and automated vehicle (CAV), (c) the DRAC results for two CAVs, and (d)–(f) the potential index for collision with urgent deceleration (PICUD) results in the same car-following situations as (a)–(c) (DRAC in blue, PICUD in green).
Correlations Between the Safety Indicators and Parameters
Figure 9 illustrates the correlations between the safety indicators and the parameters estimated from the real vehicle trajectories (i.e., 0% CAV MPR) and the CAV simulation results (i.e., 100% CAV MPR). The Pearson correlation coefficient is used to estimate the linear correlation between sets of data. Safety indicators and parameters are estimated considering the simulation time instance. Note that the correlation matrices exclude the safety indicators with discrete values, including TET, CPI, and RCRI. Five indicators and four key parameters are compared pairwise to explore their correlations.
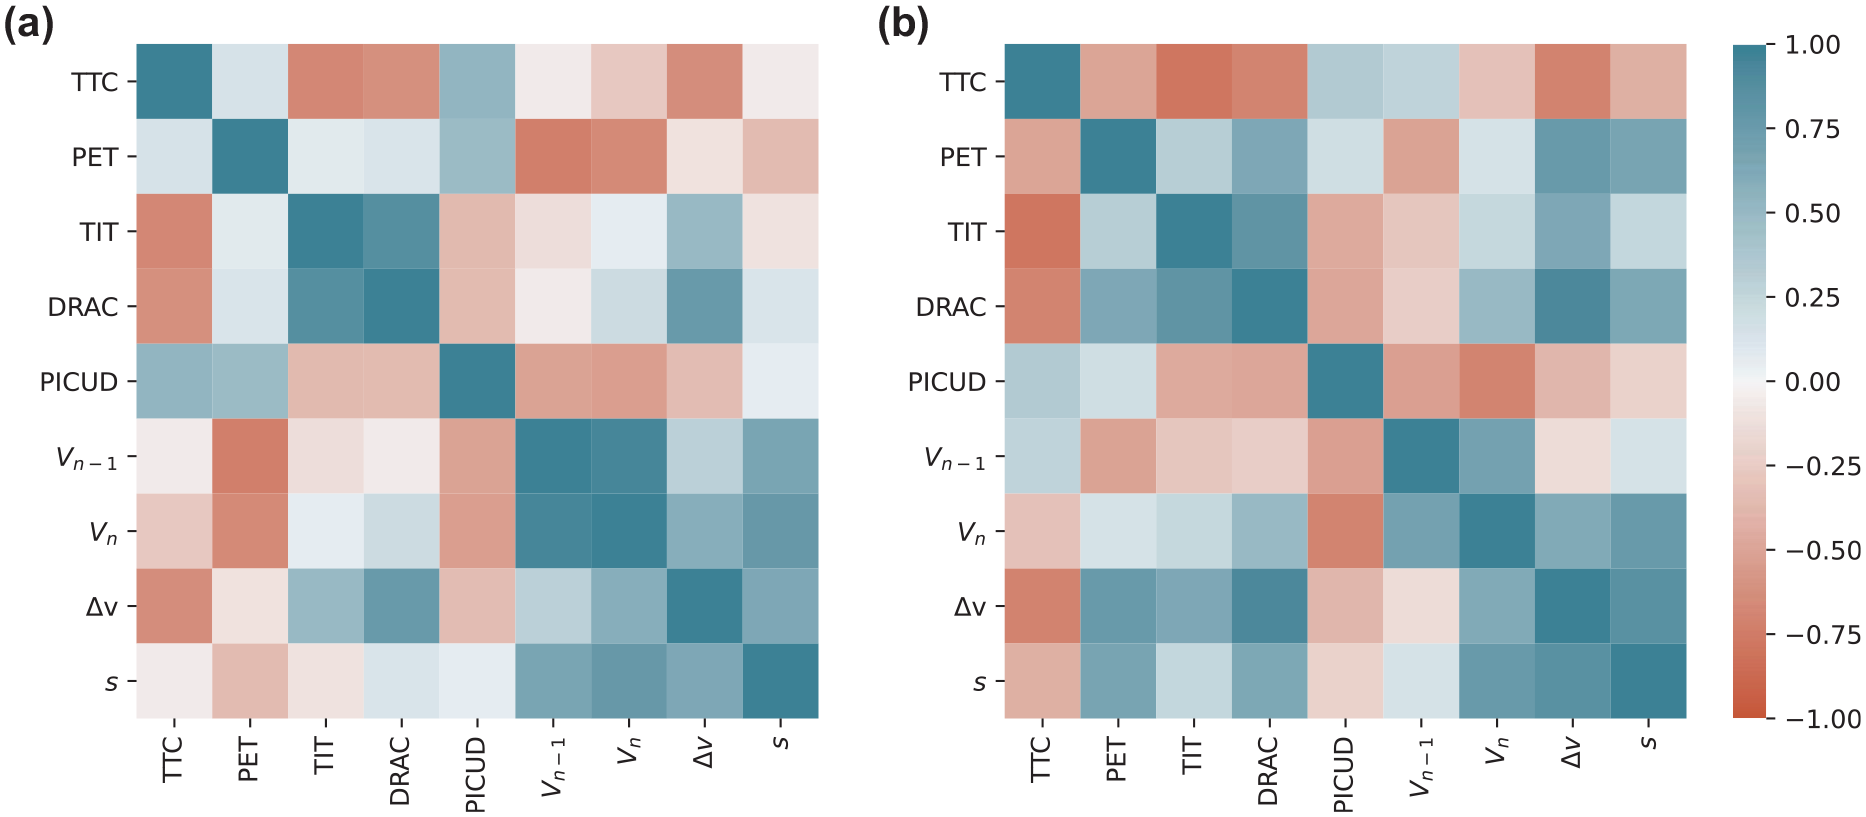
Correlation matrices of the safety indicators and parameters for the real vehicle trajectories (0% connected and automated vehicle [CAV] market penetration rate [MPR]) and the CAV simulation (100% CAV MPR) results.
One interesting observation is that TTC has no correlation with PET in the real vehicle trajectories, while they are negatively correlated in the CAV simulated trajectories. This discrepancy can be explained by the small gap and similar speed car-following situations for the consecutive CAVs. In this car-following situation, TTC can have high values since the consecutive vehicles have similar speeds (i.e., a small denominator in the TTC equation) despite their small gaps and relatively high speeds. However, the short gaps in this car-following situation lead to small PET values.
Similarly, the distance gap (
Another notable difference is that the correlation between the PICUD and the following vehicle speed (
The high correlation between the preceding and current vehicle speeds (Vn–1 and Vn, respectively) for both HDV and CAV trajectories is intuitively understandable because the preceding vehicle’s speed substantially affects the follower. However, CAVs have a slightly lower correlation compared to HDVs, although CAVs are operated by the same algorithm. This difference is because of the stopped HDVs at signalized intersections, where the speeds of both the preceding and following vehicles stay zero during the similar timing of the red signal interval.
In addition, the correlation matrices show TTC values are negatively correlated with TIT and DRAC values as their equations are inverse to each other for both CAVs and HDVs. Similarly, the correlation matrices show a high positive correlation between TIT and DRAC as their equations are fundamentally related to the inverse of TTC.
Conclusion
This paper presents experimental demonstrations of conventional safety indicators using field-collected HDV data and simulated CAV data. The study also assesses the performance of safety indicators in different car-following scenarios involving both CAVs and HDVs, illustrating how these indicators interpret traffic situations involving CAVs. In our simulations, we support the discussions proposed by Wang et al. ( 13 ), showing that the car-following situations in a small gap between CAVs are one of the reasons why the conventional safety indicators might be inadequate for CAVs.
Furthermore, our investigation reveals that the outcomes of safety indicators can vary based on the variables considered in the equations. In particular, PET and PICUD may suggest conflicting overall safety implications compared to other indicators. The results of car-following experiments indicate that TTC with motion prediction at constant velocity, PET, and DRAC are insufficient to measure the safety implications when successive vehicles, both HDVs and CAVs, operate at similar or identical speeds. Since this also occurs for HDVs, the development of safety indicators continuously measuring risks in similar speed situations is needed. For instance, a generalized TTC considering various possible collision paths should be employed in such situations ( 38 ).
However, it is essential to acknowledge several limitations in this study. Firstly, the safety evaluation is limited to the longitudinal movement of vehicles at signalized intersections. Comprehensive conclusions require expanding the current work to various road situations, including lateral movement. In addition, CAV trajectories were simulated, and to draw robust conclusions about the adequacy of the safety indicators for CAVs, a substantial amount of field data in mixed-traffic situations is necessary. Finally, this work focused solely on existing safety indicators that do not account for potential crash mechanisms specific to CAVs, such as those related to communication and sensor errors.
Footnotes
Author Contributions
The authors confirm contribution to the paper as follows: study conception and design: W. Do, L. Miranda-Moreno; data collection: W. Do; analysis and interpretation of results: W. Do, N. Saunier, L. Miranda-Moreno; draft manuscript preparation: W. Do; review and editing: N. Saunier, L. Miranda-Moreno. All authors reviewed the results and approved the final version of the manuscript.
Declaration of Conflicting Interests
The author(s) declared no potential conflicts of interest with respect to the research, authorship, and/or publication of this article.
Funding
The author(s) disclosed receipt of the following financial support for the research, authorship, and/or publication of this article: This work was funded by Centre interuniversitaire de recherche sur les réseaux d’entreprise, la logistique et le transport (CIRRELT).