
Abstract
Human-driving behavior at signalized intersections may lack efficiency because drivers try to reach their desired speed without the upcoming traffic-signal information. This causes idling time, sharp accelerations, hard braking, traffic congestion, emissions, and energy consumption. Connected vehicles, for example those equipped with a speed advisory system (SAS), can provide prior information to drivers for optimizing their driving behavior while approaching signalized intersections. However, the current literature focuses only on the fuel consumption, emissions, and travel-delay reduction impacts of SASs. This paper evaluates the safety impact of SAS vehicles using the proposed approach that simulates mixed-traffic situations between SAS and human-driven vehicles (HDVs). HDVs in the model follow real vehicle trajectories based on car-following conditions. The study investigates various scenarios including the impact of the different ranks of SAS vehicles in the vehicle group, the lane-changing possibility, and market penetration rates (MPRs). The results suggest that SAS vehicles can reduce rear-end collision risks from 25% MPR. The minimum time to collision increases by 1.2 s and the deceleration rate to avoid crash declines by 0.3
Keywords
The temporal separation of traffic flow movements allowed by traffic signals is one of the most essential elements for traffic safety in urban networks. In contrast, vehicles passing through signalized intersections experience delay and idling time with stop-and-go traffic situations. Idling vehicles at signalized intersections are one of the leading causes of wasted gas, consuming billions of gallons of fuel and generating tons of toxic emissions annually ( 1 ). The Texas Transportation Institute estimated that annually 12–67 h of travel time delay per person is related to congestion in urban areas ( 2 ).
Recent advances in the connected vehicle (CV) technology can provide prior signal information to drivers for optimizing their behavior when approaching signalized intersections (
3
). Speed advisory systems (SASs) are one of the early applications of the CV technology. A SAS provides the optimum speed to the vehicles approaching signalized intersections to minimize stopped time at red lights. There are two types of SAS, whether the information is provided for drivers to take action (manual SAS), or the SAS has control over the vehicle acceleration to implement the optimum speed (automated SAS) (
4
,
5
). This paper considers only the second kind and SAS refers to an automated SAS unless noted otherwise. The primary benefits of the SAS in the current literature are summarized as follows. (i) Reduced fuel consumption and carbon dioxide: both simulation and field experiments have shown that a SAS saves 14% of fuel consumption and
There exists a large body of literature on SAS modeling and its impact analysis. However, the primary focus of the literature is placed only on traffic delay, fuel consumption, and emission savings ( 1 , 7–10). For practical applications, several field-based experiments have been conducted in restricted road environments, yet their focus is also limited to energy and emission savings ( 6 , 11 , 12 ). A first and critical step for implementing SAS vehicles is to estimate their safety impacts with consideration of the various possible scenarios. To the best of our knowledge, there is a paucity of research on estimating the safety impact of SAS vehicles, particularly evaluation with empirical data under mixed-traffic scenarios between SAS vehicles and HDVs.
In this study, we propose an approach to explain the safety impacts of SAS vehicles using real vehicle trajectories. In detail, the acceleration control algorithm randomly replaces the real vehicle trajectories with SAS vehicles. While SAS vehicles follow the optimum speed, the acceleration control of HDVs is the same as the real vehicles in the trajectory data based on the car-following conditions: if doing so would generate a collision with a preceding SAS vehicle, HDVs obey the acceleration control of a modified intelligent driver model (IDM+). The proposed approach records the traffic flow disturbance caused by SAS vehicles in the output trajectories. The output trajectories include velocity, acceleration, x–y coordinates, and vehicle length collected with a 0.1-s resolution. To quantify the safety impacts of SAS vehicles, we calculate surrogate measures of safety (SMoSs) with the output trajectories from the simulation results. The proposed model can simulate the mixed-traffic situations of SAS vehicles and HDVs and the model allows one to investigate various scenarios, including the impact of the different ranks of SAS vehicles in the approaching vehicle group, the lane-changing possibility, and various market penetration rates (MPRs).
The remainder of this paper is organized as follows. The following section presents a literature review on the SAS and field experiments, as well as SMoSs at signalized intersections. The third section describes the acceleration control method and the applied SMoSs. The fourth section presents the experimental results and safety implications based on multiple scenarios. The last section summarizes the study results and suggests future research directions.
Literature Review
Drivers generally try to reach their desired speed regardless of the traffic signals because they have no access to the upcoming traffic-signal information ( 8 ). This may cause sharp accelerations or hard braking, and unnecessary idling time, which, in turn, cause additional fuel consumption and emissions ( 12 , 13 ). Therefore, a great deal of research efforts have focused on optimizing such driving behavior using CV technology (8–10, 12 , 14 , 15 ).
Speed Advisory System
The current literature has demonstrated the efficiency of SAS vehicles using various algorithms. Coppola et al. (
10
) developed a method to test the green light optimal speed advisory (i.e., GLOSA) system in an integrated simulation environment. The method enables one to test multiple factors in the GLOSA system, including the traffic signal and phase, communication distance, minimum speed, and electric engines. Guardiola et al. (
16
) estimated the impact of traffic-signal information from the perspectives of energy consumption and emissions for a Euro-5 diesel vehicle. The results from three traffic information scenarios reported that traffic light information can decrease fuel consumption in urban conditions by 7.5%–12% and NOx emission by 13%–32% in a 1 km length of the case study road segment. Simchon and Rabinovici (
17
) developed a real-time speed advisory algorithm to calculate the optimal vehicle speed for the traffic-signal information. The optimization problem considered the road section length, slope, and signal information. The proposed model reduced the time to calculate the optimum speed relative to the conventional GLOSA model, which enables the implementation of a real-time GLOSA. Mandava et al. (
18
) developed arterial velocity planning algorithms that maximize the probability of having a green light at signalized intersections. The simulation results indicated that savings of 1.1% in travel time, 12% in fuel, and 14% in
Field Experiments of Manual SASs
Few studies have investigated the impact of manual SASs in field experiments. Zhang et al. (
9
) developed a hierarchical GLOSA system to improve the energy-saving performance considering the queuing effect and actual tracking error of drivers. The developed GLOSA model is tested in both simulation and field experiments. The result shows that the proposed model can save energy consumption by 11.8% and 4.9% in simulation and field experiments, respectively. While providing the optimum speed to the drivers, Xia et al. (
6
) collected the speed profile and applied the comprehensive modal emissions model (CMEM) to estimate fuel consumption and emissions. The study reported that manual SASs can reduce fuel consumption and
Surrogate Measures of Safety at Signalized Intersections
Historically, predicting the safety of new and innovative traffic measures has been challenging ( 25 ). There have been significant efforts in estimating the safety impacts of CV applications. SMoSs are frequently used for such applications, primarily because new technologies have little to no accident history ( 26 ). SMoSs provide tools that can quantitatively evaluate traffic events without a collision between road users before any harm is caused ( 27 , 28 ). They are based on the observation of traffic in particular events with a link to potential crashes, such as near misses and conflicts. Methods such as traffic conflict techniques provide tools to collect such data using objective and quantitative safety indicators for each event.
Wang and Stamatiadis ( 29 ) proposed the aggregated crash propensity metric (ACPM) as a safety indicator for their simulation-based conflict studies. The model generates the ACPM for three accident categories: rear-end, crossing, and lane change. Saccomanno et al. ( 30 ) used the time to collision (TTC), deceleration rate to avoid crash (DRAC), and crash potential index (CPI) to assess the safety impact of signalized intersections and roundabouts using micro-simulation models. For dilemma zones at signalized intersections, a safety surrogate histogram (SSH) was developed by Machiani and Abbas ( 31 ) to capture the degree and frequency of dilemma zone related conflicts at each intersection approach. Zhou and Huang ( 32 ) simulated one signalized intersection in VISSIM software to extract vehicle trajectories. The surrogate safety assessment model analyzed the output trajectories to identify traffic conflicts before and after the speed-limit reduction.
SASs have been widely evaluated through simulations and a few field experiments. Meanwhile, substantial efforts on evaluating the safety of signalized intersections are carried out using SMoSs. The findings from the previous studies have demonstrated that operating SASs at signalized intersections is beneficial for fuel consumption, emissions, and travel time. However, none of the above-mentioned studies has focused on the safety impacts of SAS vehicles despite the importance of the safety impact of this technology. A research gap exists in the development of the SAS simulation frameworks for the safety impact analysis because the current models are developed to evaluate the efficiency of SAS vehicles but not their safety. In addition, the current simulation frameworks often use a default car-following model in simulation software without considering real vehicle data. This paper provides a novel simulation-based approach to evaluate the safety impact of SAS vehicles at traffic light corridors using real vehicle trajectories.
Methodology
In this section, we first present the simulation preliminaries to define the required assumptions for modeling and simulations. We next introduce the developed acceleration control algorithm. The algorithm simulates mixed-traffic situations including HDVs and SAS vehicles under different MPRs. We used real vehicle trajectories for HDVs in simulations, and SAS vehicles are controlled by the algorithm. Various simulation scenarios are tested, including lane-changing conditions, the first vehicle equipped with a SAS in a group of approaching vehicles, and different ranks of SAS vehicles. Lastly, we present the employed SMoSs to estimate the safety impact of SASs.
Simulation Preliminaries
Simulating realistic traffic conditions including SAS vehicles requires complex car-following situations between HDVs and SAS vehicles. The following preliminaries make the simulations feasible while simplifying several less relevant variables:
• the communication has no error or delay;
• the real vehicles are randomly replaced by SAS vehicles;
• the simulation model is collision free;
• the signal timing plan in the case study area is used;
• the study uses the real vehicle length observed from the case study area.
A gradual increase in MPR is expected because the MPR of SAS vehicles will be affected by exogenous variables, such as public acceptance, policy, legislation, and/or V2I communication technology capability ( 33 ). The simulation uses five MPRs (i.e., from 0% to 100% in 25% increments) to consider different levels of SAS penetration. For each MPR, we randomly assign SAS vehicles in the real vehicle trajectories during the simulation. The essential input of the proposed model is real vehicle trajectories, vehicle lengths, and signal timing. The simulation time step is set to 0.1 s as a trade-off between computing time and accurate and detailed simulation of the traffic phenomena.
Acceleration Control Algorithm
Figure 1 shows the developed acceleration control algorithm. The algorithm indicates how the simulated vehicles change the control regimes between the human-driven, SAS, and car-following models at any time step during simulations. Initially, all the vehicles follow the observed trajectories. When generated, each vehicle is randomly assigned a type, whether it is a HDV or a SAS vehicle based on the MPR scenario. After the vehicle type assignment, once vehicles enter the communication range, SAS vehicles start following the optimum acceleration control by the algorithm to avoid stopping at the intersection. The simulation of SAS vehicles ends when the vehicle arrives at the intersection. HDVs follow their real trajectory as long as they do not become too close to a preceding vehicle that departed from its real trajectory because of a downstream SAS vehicle. If there is a preceding vehicle and the distance gap (
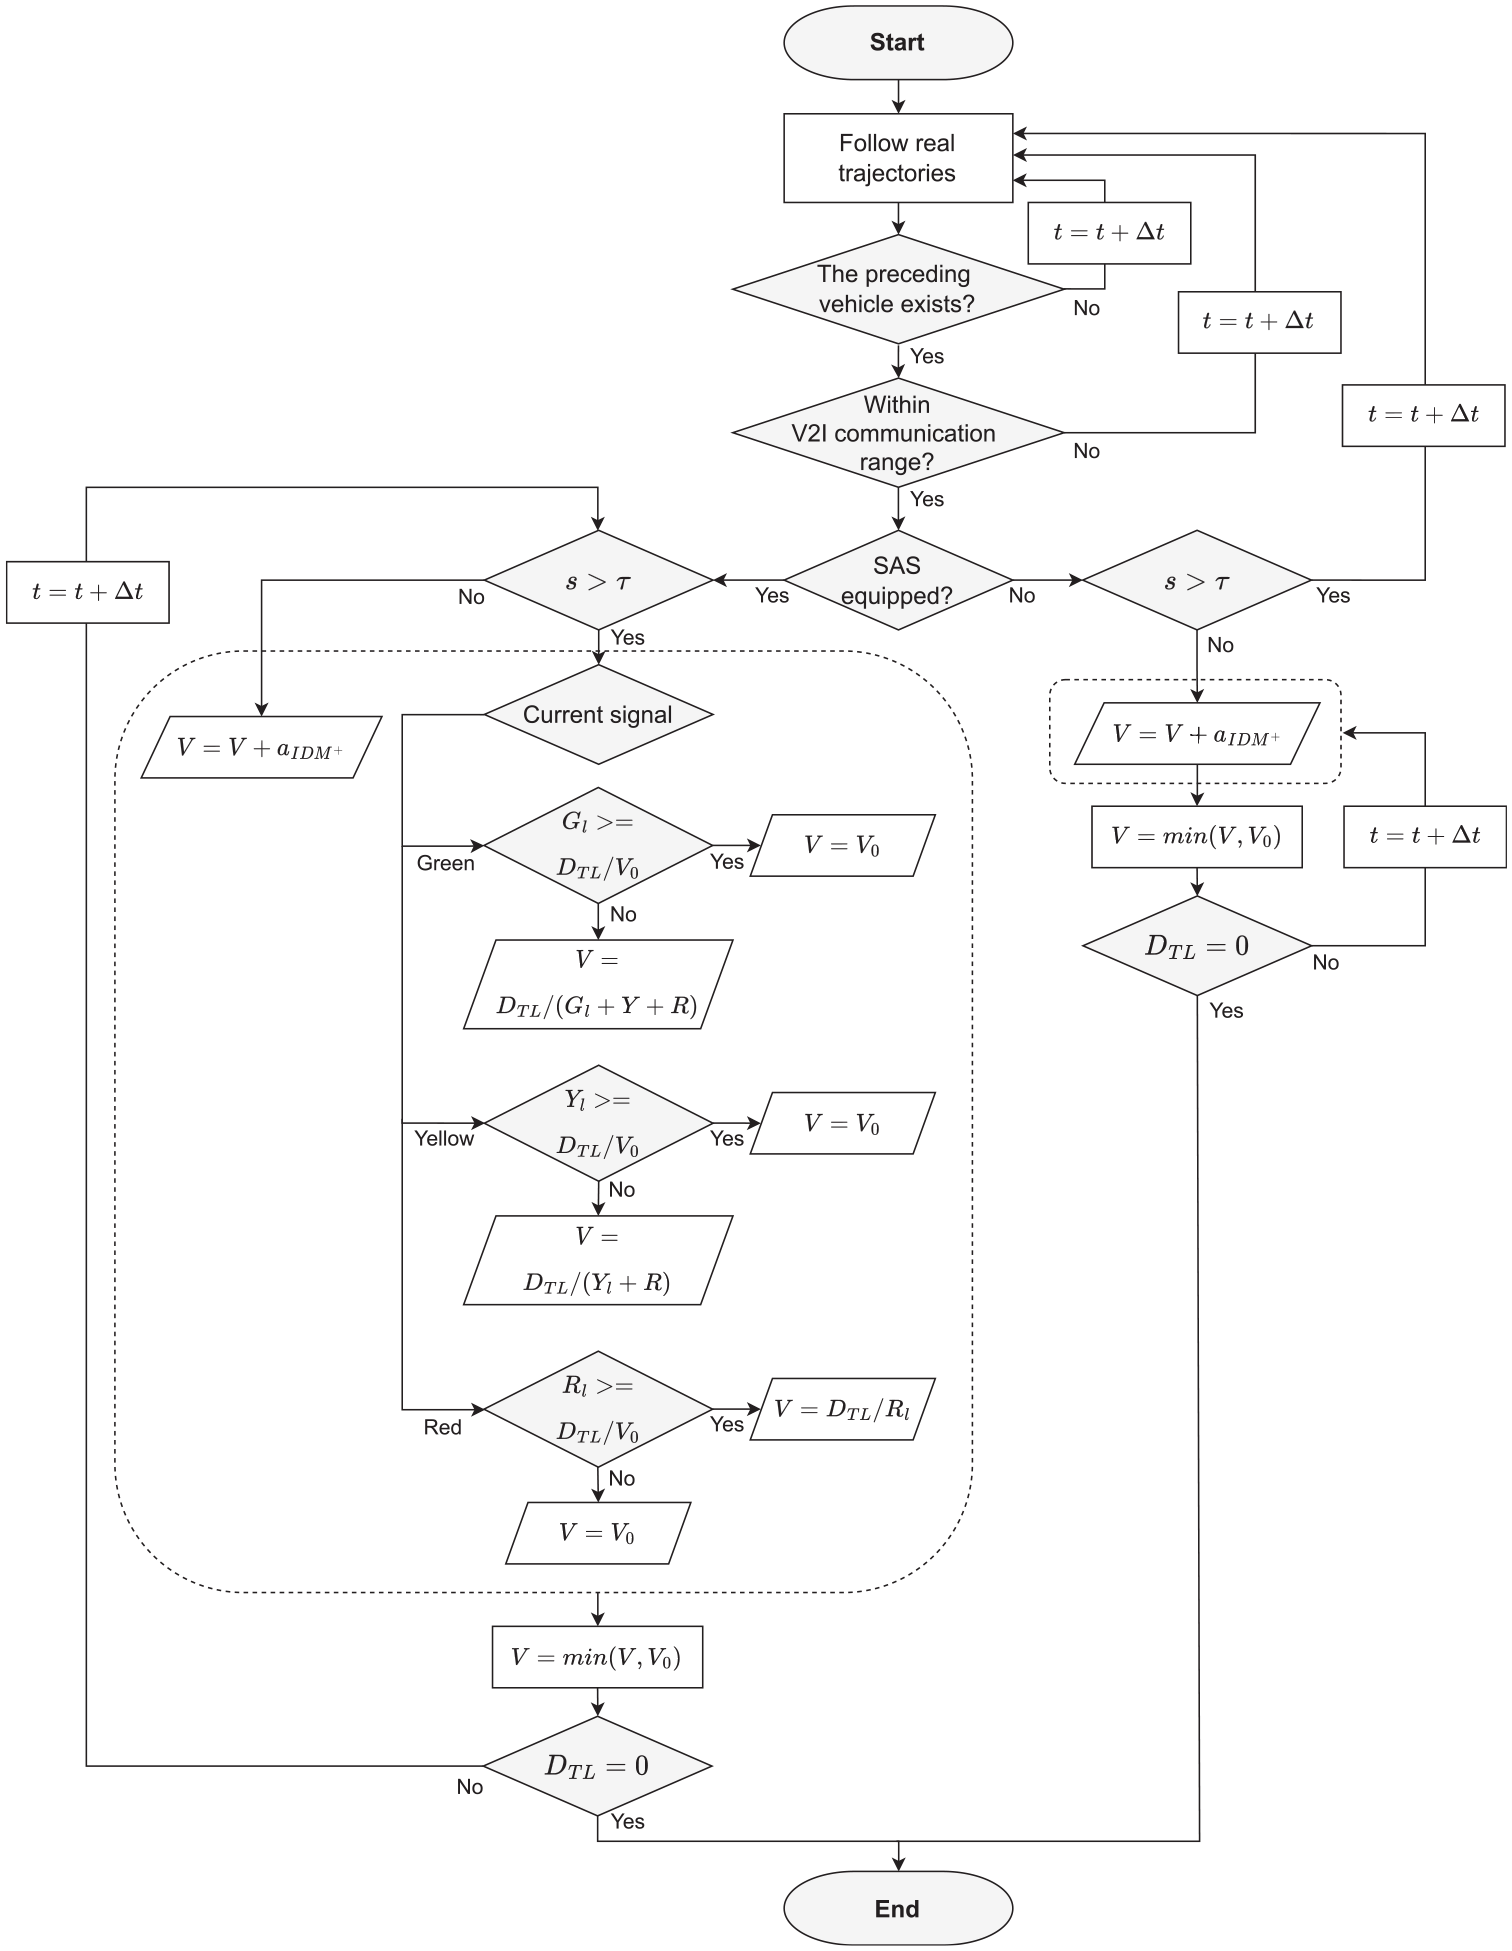
Integrated acceleration control algorithm.
The optimum acceleration is calculated using the desired speed (
Figure 2 illustrates how the algorithm operates in the case of four vehicles approaching a signalized intersection with the different vehicle control regimes. The two HDVs in black-solid lines follow real vehicle trajectories without modifications in the case study area. The following SAS vehicle in the red-dotted line follows the optimum accelerations calculated by the speed control algorithm. The last HDV vehicle in the blue-dotted line obeys the car-following model to avoid a collision.
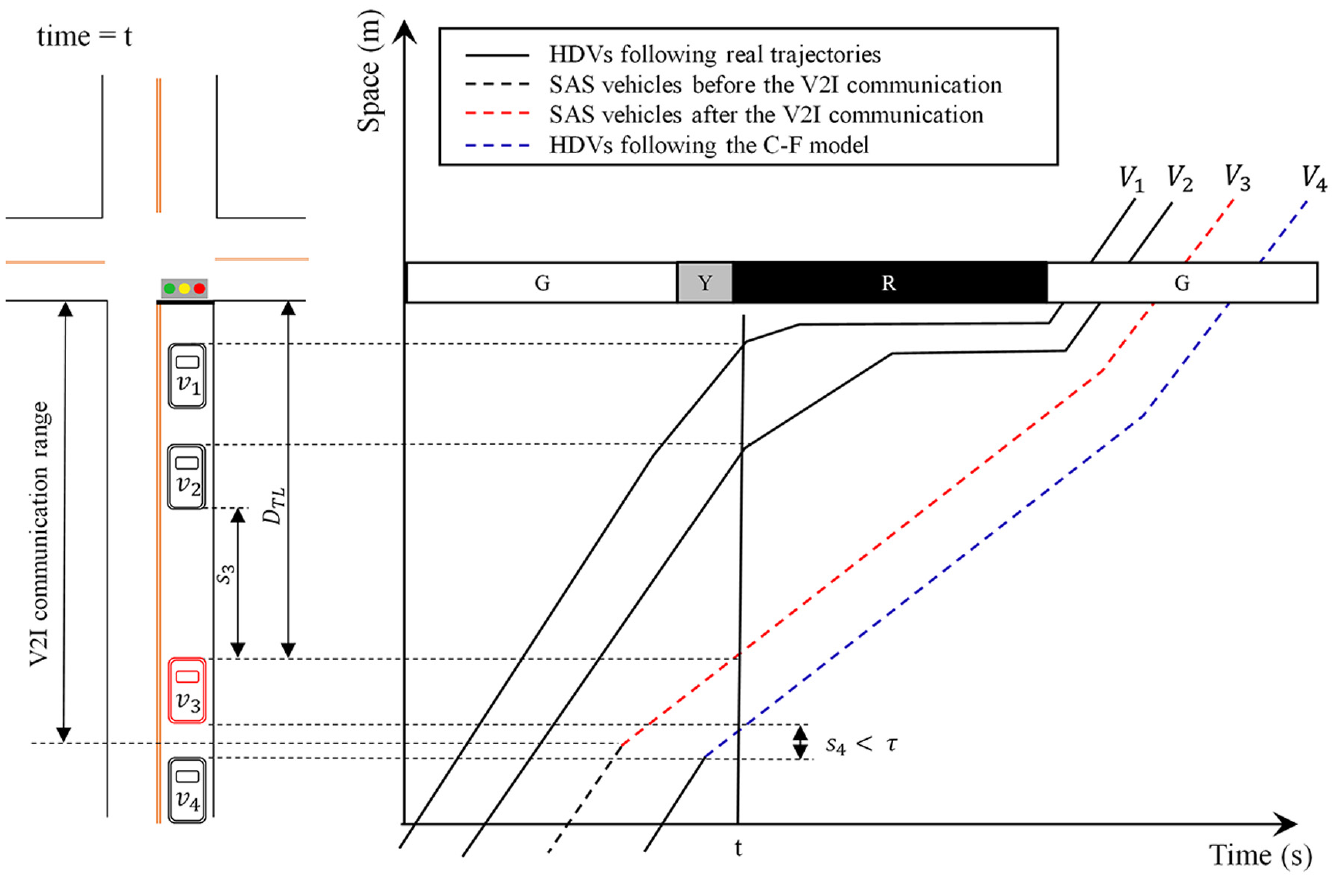
An illustration for simulated trajectories under the various car-following situations.
Car-following Model for Collision Avoidance
When the acceleration control algorithm assigns a SAS vehicle within a HDV group, different speed controls between HDVs and SAS vehicles may cause collisions. For example, when the preceding SAS vehicle decelerates to follow the suggested optimum speed, the following HDV might accelerate to pursue the real trajectories. While the algorithm ensures the individual HDV’s heterogeneity for following real trajectories, a car-following model is needed when the simulated vehicles would collide otherwise. In this paper, we employ the IDM+, which has been validated in field experiments ( 34 ). The IDM is a widely used car-following model to simulate adaptive cruise control, while some studies use it for automated vehicles ( 35 , 36 ). The acceleration of the original IDM is computed by following Equations 1 and 2:
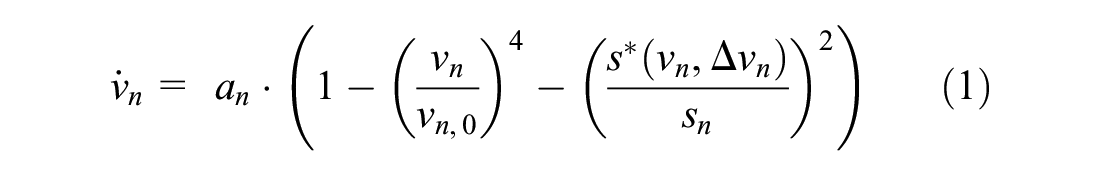

where
However, the original IDM shows an inconsistent acceleration control in the field experiments ( 34 ). Therefore, the IDM needs to be modified to constrain the last term in Equation 2 to prevent it from becoming negative. The desired gap is redefined as Equation 3, which defines the IDM+:
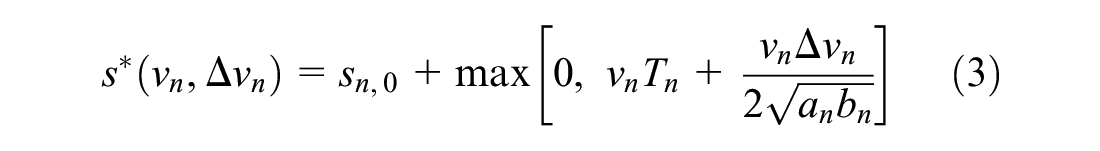
Table 1 shows the used IDM+ parameters for the car-following model in the algorithm. The parameters are tested before simulations to assure that the IDM+ reproduces car-following behaviors adequately for the case study area. Similar parameters are also applied in previous simulation studies (
34
,
37
). Desired speed (
Modified Intelligent Driver Model Parameters for the Simulation Vehicles
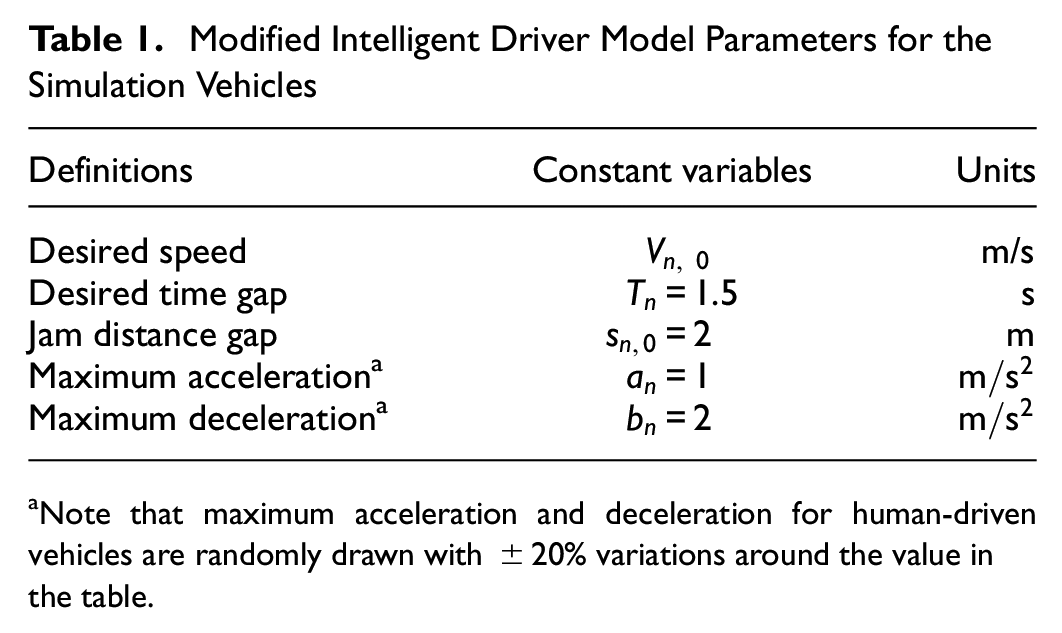
Note that maximum acceleration and deceleration for human-driven vehicles are randomly drawn with ±20% variations around the value in the table.
Lane-changing Rules
This section introduces the simplified discretionary lane-changing model to estimate the safety impact of SAS vehicles with possibilities of lane changing ( 38 , 39 ). Discretionary lane changing is generally modeled by utility-based approaches that drivers change a lane to gain better utility after comparing the current and target lanes. In the proposed algorithm, the early deceleration from SAS vehicles deteriorates the utility of the current lane relative to other lanes. Under the discretionary lane-changing rules, this results in all following HDVs changing their lane to others that have higher attractiveness. To this end, we embed the lane-changing probability into a discretionary lane-changing model. We applied the average lane-changing rate (i.e., 20%) of the case study area to reproduce a similar lane-changing behavior.
We set the vehicle speed as the utility that determines the driver’s lane-changing decision. When the speed of the current lane is significantly lower than that of other lanes, the following vehicles decide to change their lane. For example, if a deceleration of the preceding vehicle causes a speed drop that is higher than a threshold
Surrogate Measures of Safety
The most frequent category of collisions on approaching lanes at signalized intersections is rear-end collisions caused by stop-and-go situations ( 40 ). For this study, we focus on rear-end collision risks as a primary safety criterion. The rear-end collision risks are measured by three safety indicators.
Time to Collision
As one of the primary safety indicators, TTC has been extensively applied in the literature to estimate rear-end collision risks (
30
, 41–43). TTC was first introduced by Hayward (
44
) to measure the expected time for the current vehicle
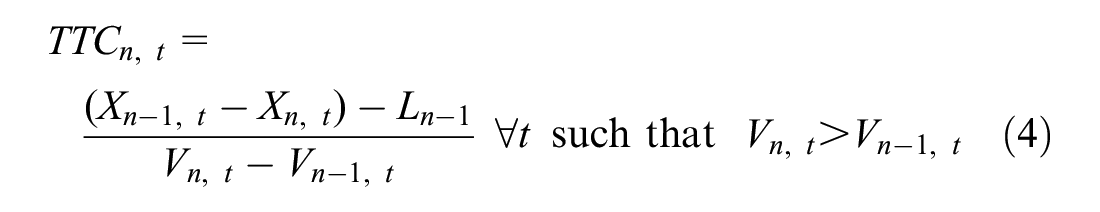
where
Deceleration Rate to Avoid a Crash
For rear-end collision risks, DRAC is a safety indicator frequently used with TTC. The DRAC is the current vehicle’s deceleration rate required to avoid a crash with the preceding vehicle. Higher values of the required deceleration rate indicate more dangerous traffic situations. The definition is the speed difference between the current and preceding vehicle divided by their closing time. DRAC is given as Equation 5:
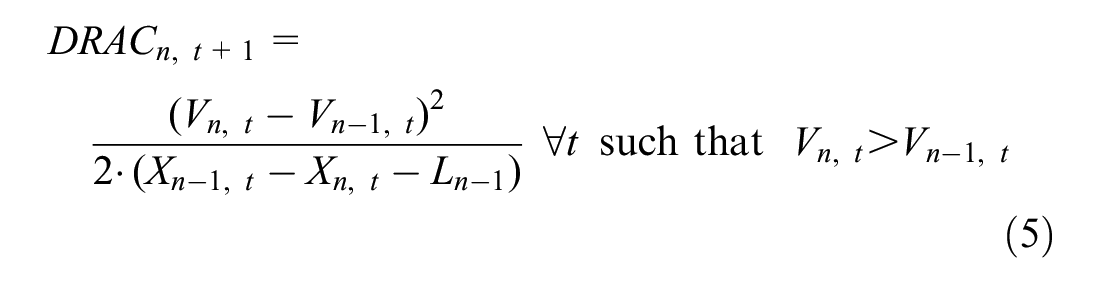
where
Crash Potential Index
Because TTC and DRAC do not consider the deceleration capability of current vehicles, Cunto and Saccomanno (
45
) defined the CPI to reflect the probability that the current vehicle’s DRAC exceeds its maximum available deceleration rate (MADR). There are two elements to calculate the CPI: (i) the DRAC of the current vehicle in each time step and (ii) the MADR of the current vehicle. The MADR is the braking capability of each vehicle and depends on factors such as pavement conditions, vehicle weight, tires, and braking conditions. In this study, the MADR is set to follow a truncated normal distribution with a mean value of 8.45

where
Experimental Results
Case Study Area—Peachtree Street, Atlanta, Georgia
The safety impact of SAS vehicles is evaluated with the use of real trajectory data collected by the next generation simulation (NGSIM) project, which is an empirical microscopic dataset ( 47 ). We applied the developed algorithm to the NGSIM data primarily because (i) the case study intersection has a longer approach lane than other microscopic datasets, and (ii) the data includes all required input for the algorithm. The data was collected at four signalized intersections on Peachtree Street, Atlanta, Georgia, on 8 November 2006. The data include detailed vehicle trajectories with the vehicle ID, time, x–y coordinates, distance gap, speed, acceleration, vehicle type, and vehicle length. The recorded arterial segment is about 600 m long and consists of two or three lanes in each direction. This study used the northbound vehicles in the upper 230 m of the segment. The variables given from the case study area are the signal timing and a speed limit of 15.3 m/s. Note that the signal phase and timing are dynamic in the case study area, and the signal information is extracted by the recorded video using video processing by the NGSIM project. The trajectory data was recorded at 0.1 s time resolution. The V2I communication range is set to be 100 m.
Vehicle Trajectories and Speed Profile in Mixed Traffic
Figure 3 visualizes the simulation results generated by the acceleration control algorithm applied to the case study area with the different MPR scenarios. Because the position of SAS vehicles in the approaching vehicle group might affect the simulation results and the IDM+ parameters are also randomized, we conduct five iterations of randomly assigned SAS vehicles for the mixed-traffic situations, including 25%, 50%, and 75% MPRs. Figure 3 shows one of the five iterations. Note that the 0% and 100% MPR scenarios do not require iterations because there is no change in the order of SAS vehicles and the other parameters are fixed. One can see that the first HDVs in a platoon simply follow the real vehicle trajectories without modifications in Figure 3c, and all vehicles in Figure 3a (with 0% MPR). On the other hand, HDVs follow the IDM+ to avoid a collision with a preceding SAS vehicle, for example, the second vehicles in the second and third signal cycle in Figure 3g. The trajectory results in the mixed-traffic situations show that one SAS vehicle can affect the speed of the following HDVs, such as the last vehicles in the second and third cycles in Figure 3c. This causes HDVs to follow the optimal speeds of the preceding SAS vehicle, which leads to similar benefits to SAS vehicles. Speed profiles indicate that stopped time (i.e., when the speed reaches 0 m/s at the intersection) disappears at 100% MPR in contrast to mixed-traffic situations (MPRs 25%, 50%, and 75%).
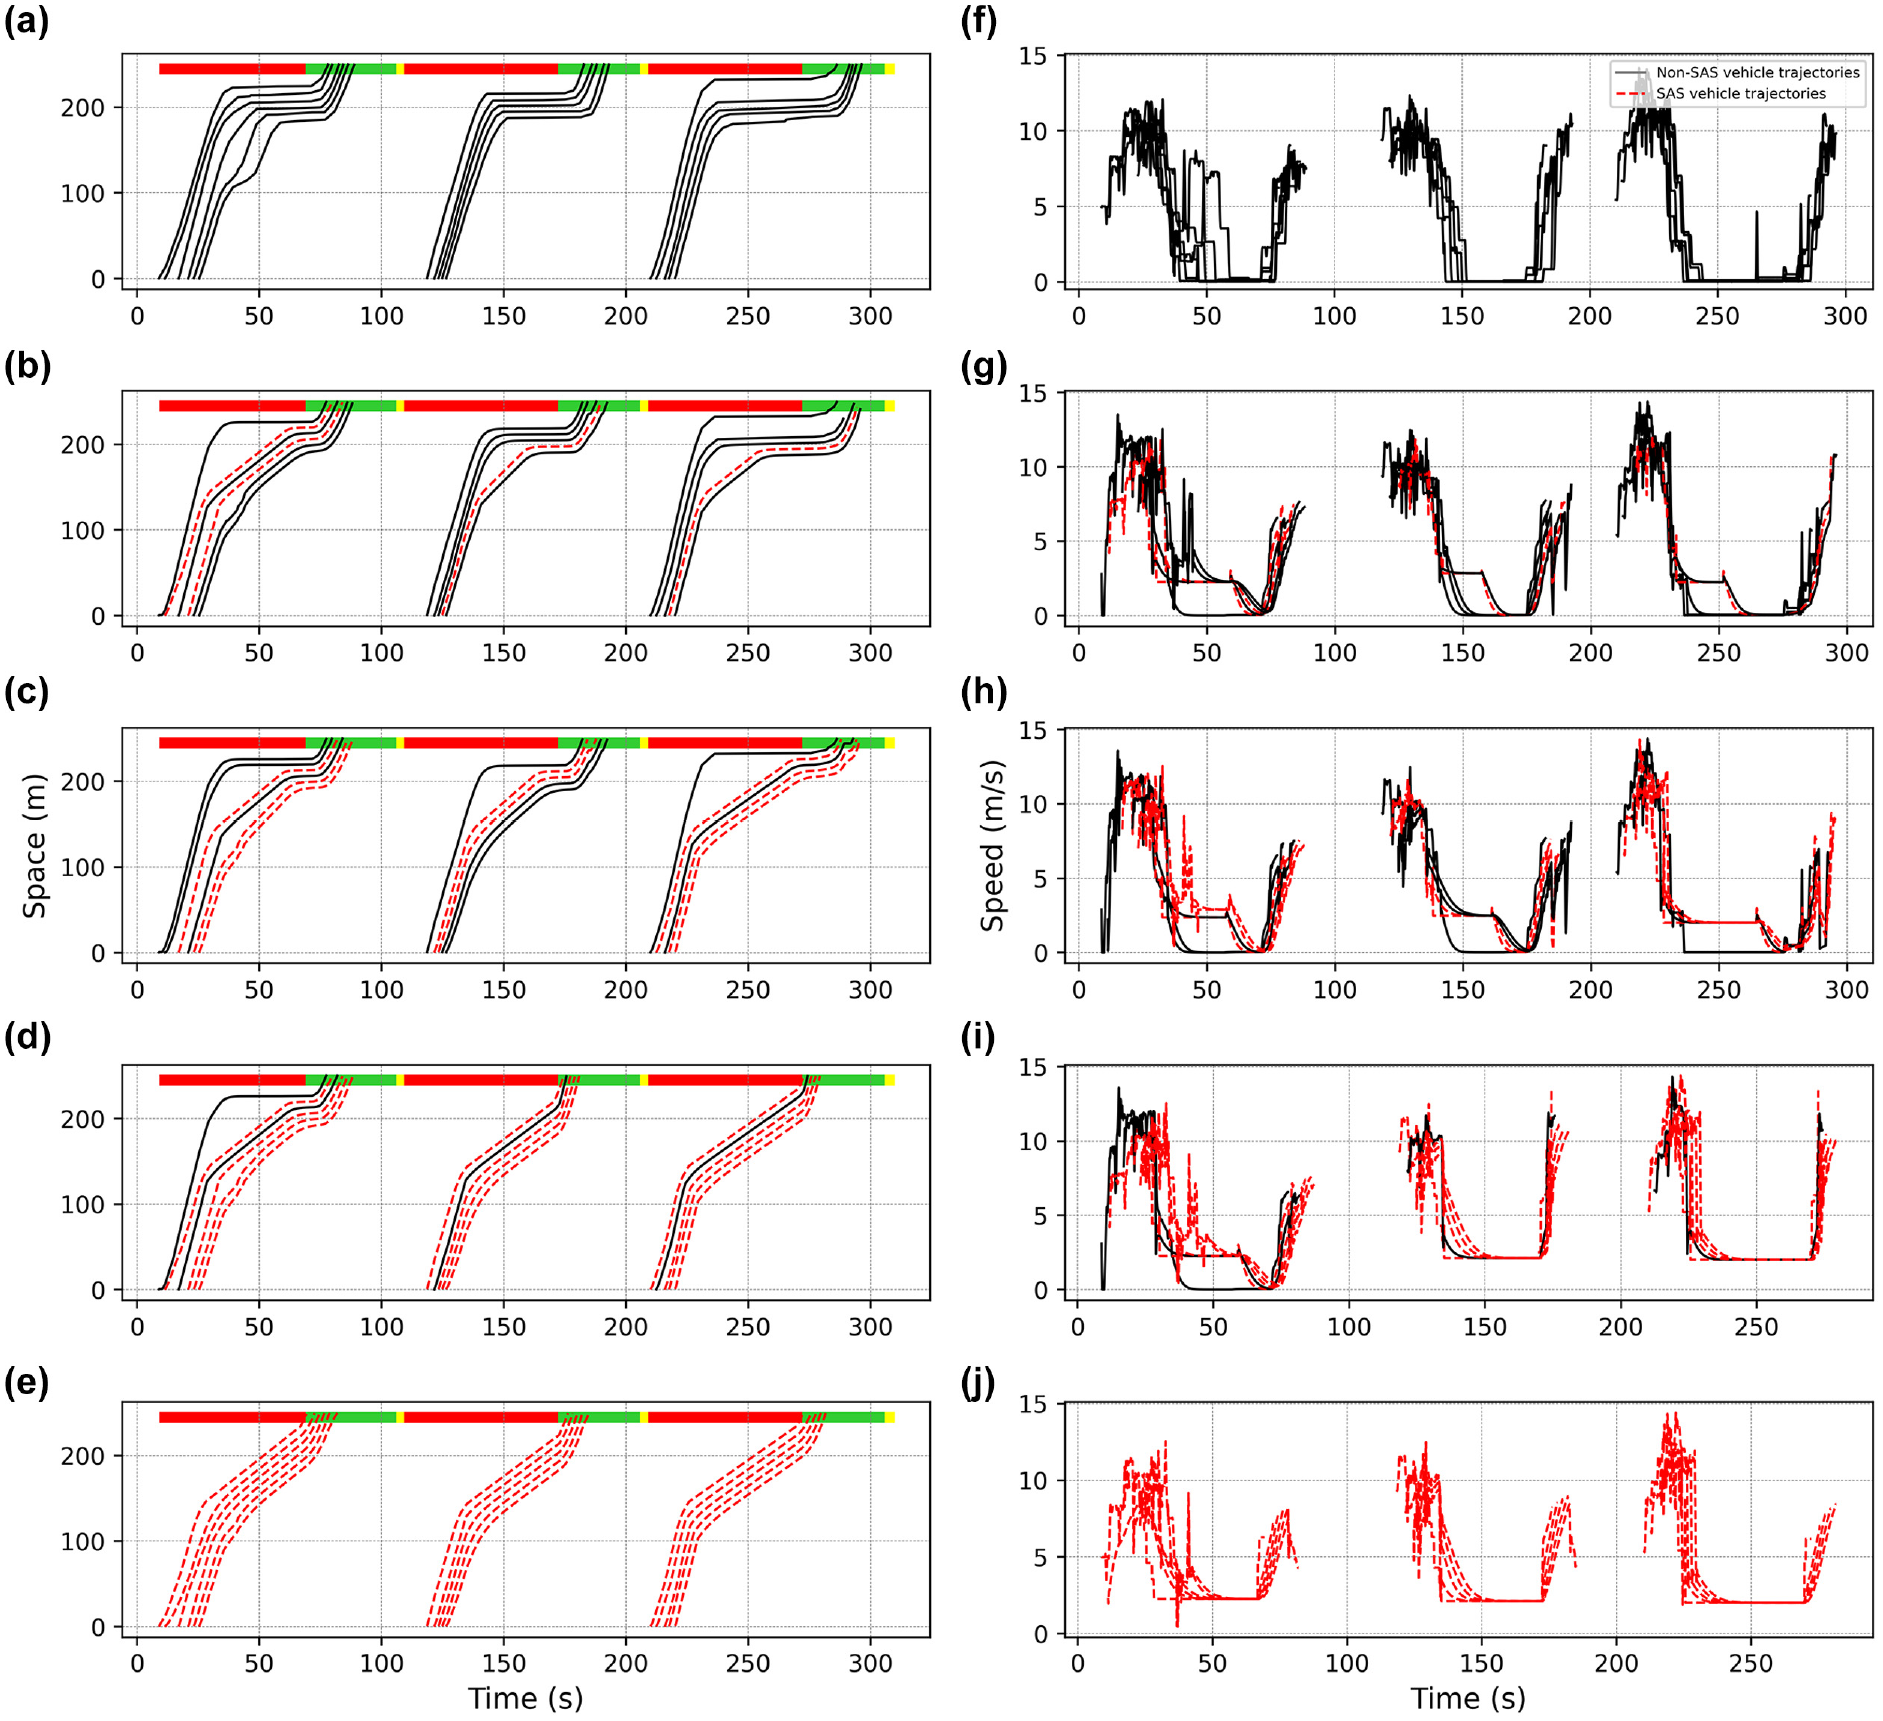
Vehicle trajectories and speeds at different speed advisory system (SAS) market penetration rates (MPRs): (a)–(e) vehicle trajectories at MPRs from 0% to 100% in 25% increments; (f)–(j) speed distributions at MPRs from 0% to 100% in 25% increments, respectively.
Safety Impacts of SAS Vehicles
Figure 4 shows the safety impacts of SAS vehicles estimated from the simulation results. The lower TTC, higher DRAC, and higher CPI values represent more dangerous traffic situations. The TTC values are plotted in two ways: a violin plot for the minimum TTC and box plots for the overall TTC values (i.e., all the instantaneous TTC measurements). The minimum TTC reflects the most severe instant of an interaction, while the overall TTC values include all the measures but may not represent each vehicle interaction in equal terms. The overall TTC values are calculated for all pairs of the preceding and the following vehicles within a 10 m gap to avoid including many large TTC values in the distributions.
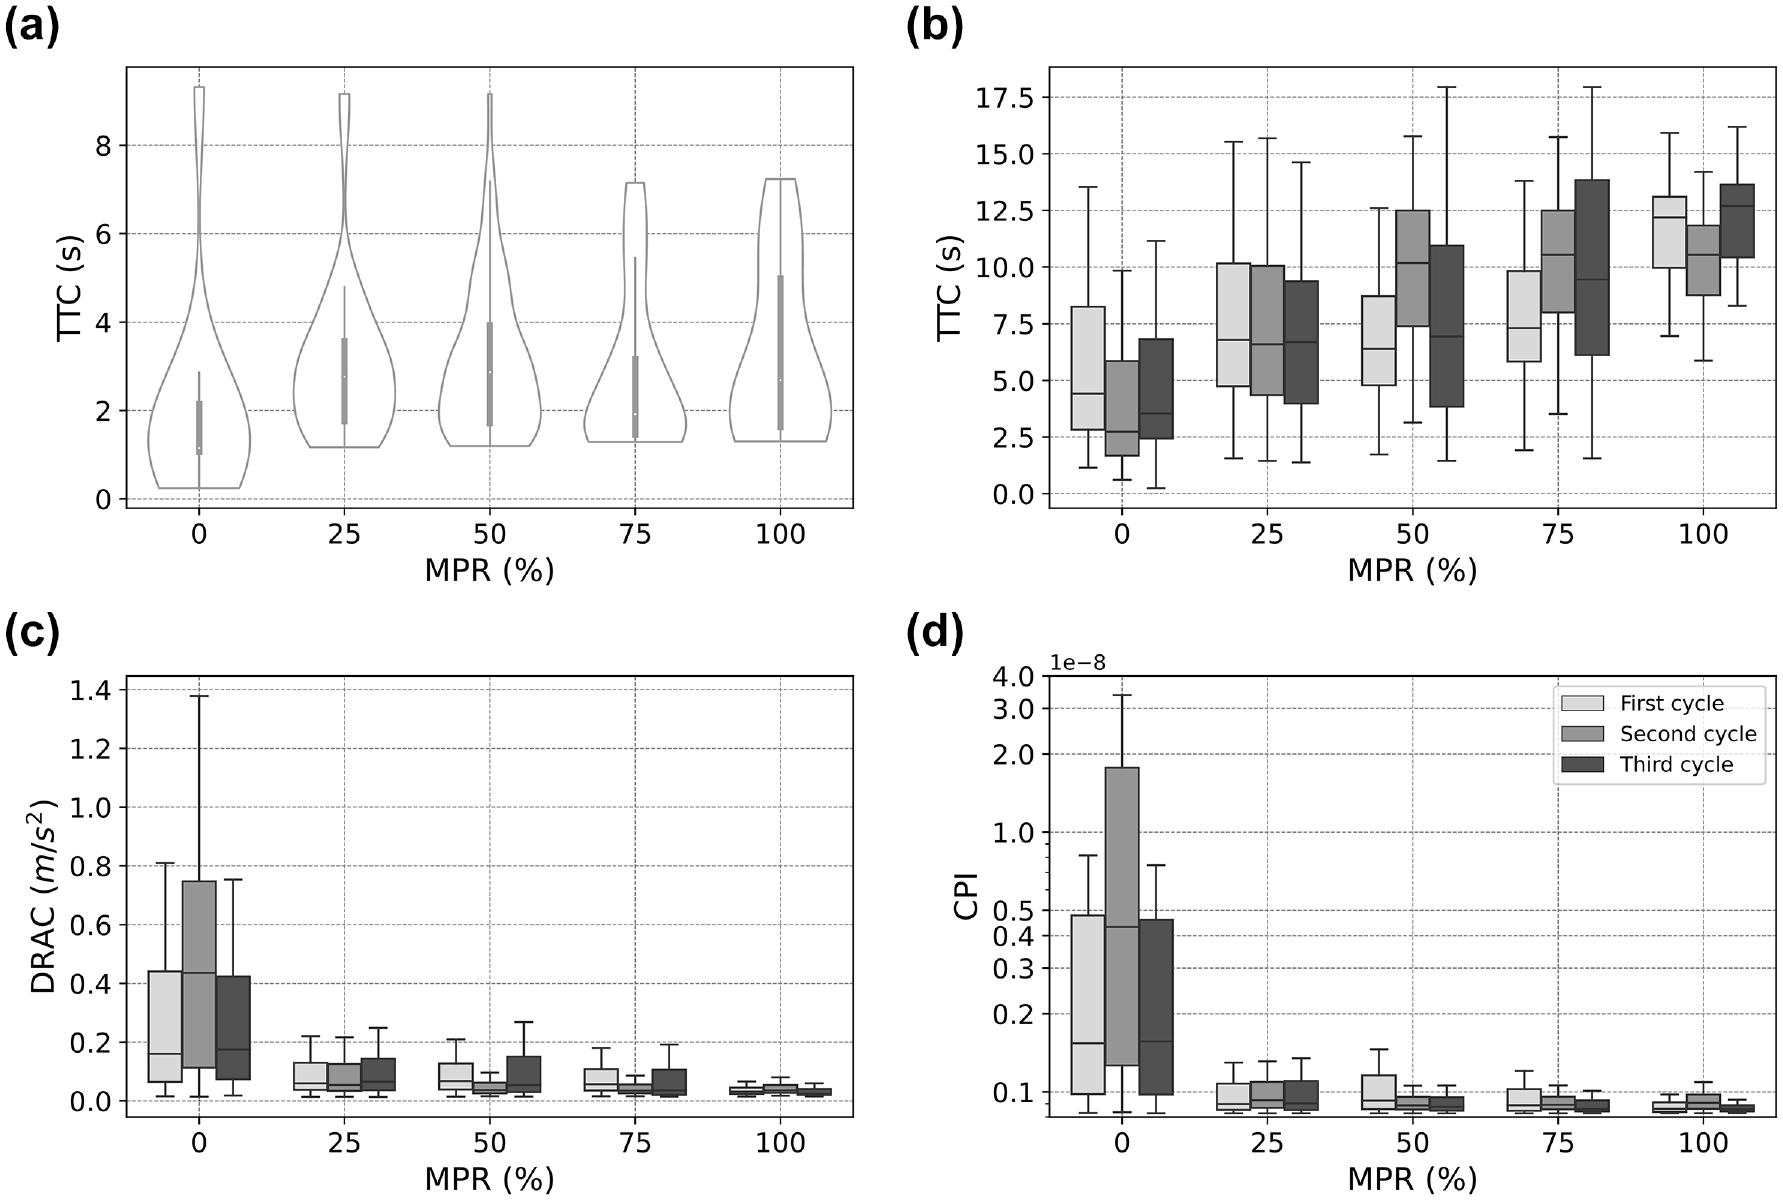
The safety impacts of speed advisory system vehicles: (a) minimum time to collision (TTC); (b) overall TTC; (c) deceleration rate to avoid crash (DRAC); (d) crash potential index (on a logarithm scale) based on market penetration rates (MPRs).
The minimum TTC values in Figure 4a show that the newly assigned SAS vehicles increase the minimum TTC values from 25% MPR, and similar tendencies were observed from 25% to 100% MPRs. Similarly, the overall TTC in Figure 4b shows that the TTC values gradually increase as the MPR of SAS vehicles rises. The overall TTC result indicates that not only the median but also the quartile increases with higher MPRs. This observation implies that the increasing number of SAS vehicles can benefit traffic safety. However, the impact on the most severe instant of each conflict can be relatively marginal. Figure 4c shows that the inter-quantile range of DRAC values dramatically declines as the MPR increases, which indicates that the vehicles require lower DRAC in the higher SAS MPRs. These benefits are achieved by the consistent speed changes caused by SAS vehicles.
After estimating the DRAC in each simulation time step, we obtained the CPI using the probability density function of the MADR. Figure 4d shows that SAS vehicles also reduce CPI, like the DRAC results. We can observe a significant reduction in CPI values with 25% MPR, and gradual reductions as MPR increases. The primary reason is that even a small number of SAS vehicles, such as 25%, can affect the following vehicles’ acceleration control.
Impacts of SAS Vehicles on the Conflict Area
Figure 5 illustrates the location of low TTC (less than 6 s) situations in a two-dimensional histogram. The histogram represents the conflict locations in the approaching lane for each MPR. We can observe that the conflict locations change from a small portion of SAS vehicles (e.g., 25% MPR). The major conflict area at 0% MPR is near the traffic-signal location (see the red solid line in Figure 5); however, the area moves toward the location where the V2I communication range starts (i.e., 100 m) from MPR 25% because of the early decelerations from SAS vehicles. The conflict area of mixed-traffic situations (25%, 50%, and 75%) is similarly located, while we can observe a gradual reallocation of the conflict area from 25% to 75%. For 100% MPR, the major conflict area is completely moved to the location where the V2I communication starts, since all the vehicles decelerate at the beginning of the V2I communication range.
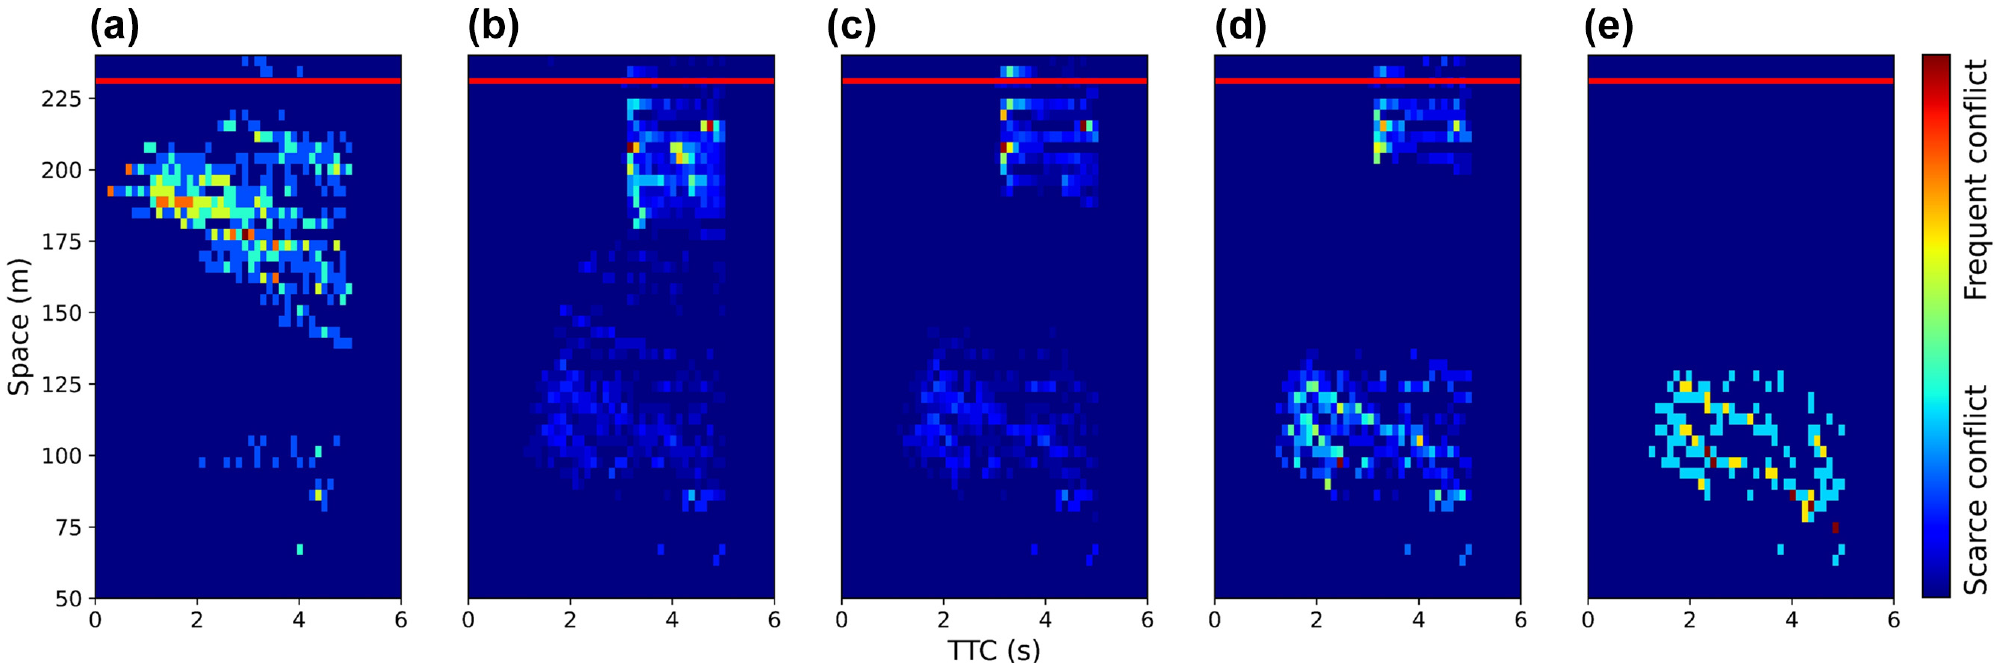
Conflict locations at speed advisory system market penetration rates (MPRs): (a)–(e) the conflict locations of the MPRs from 0% to 100% in 25% increments, respectively.
Impacts of the First SAS Vehicle in an Approaching Vehicle Group
When lane changing is not allowed, the following vehicles must comply with the acceleration control of the preceding vehicle to avoid a collision. Thus, the preceding SAS vehicles’ early deceleration can lead to the following HDVs’ decelerations. In this section, we investigate the first SAS vehicle’s impact by assigning a SAS to the first vehicle in the approaching vehicle group and compare it to the 100% MPR scenario. Figure 6 shows the trajectories and speed profile of the first positioned SAS vehicle and 100% MPR scenarios. The trajectories of the following HDVs (see the solid black line in Figure 6a) are similar to the first positioned SAS vehicle (see red dotted line in Figure 6a). A similar result is shown in the speed profiles.
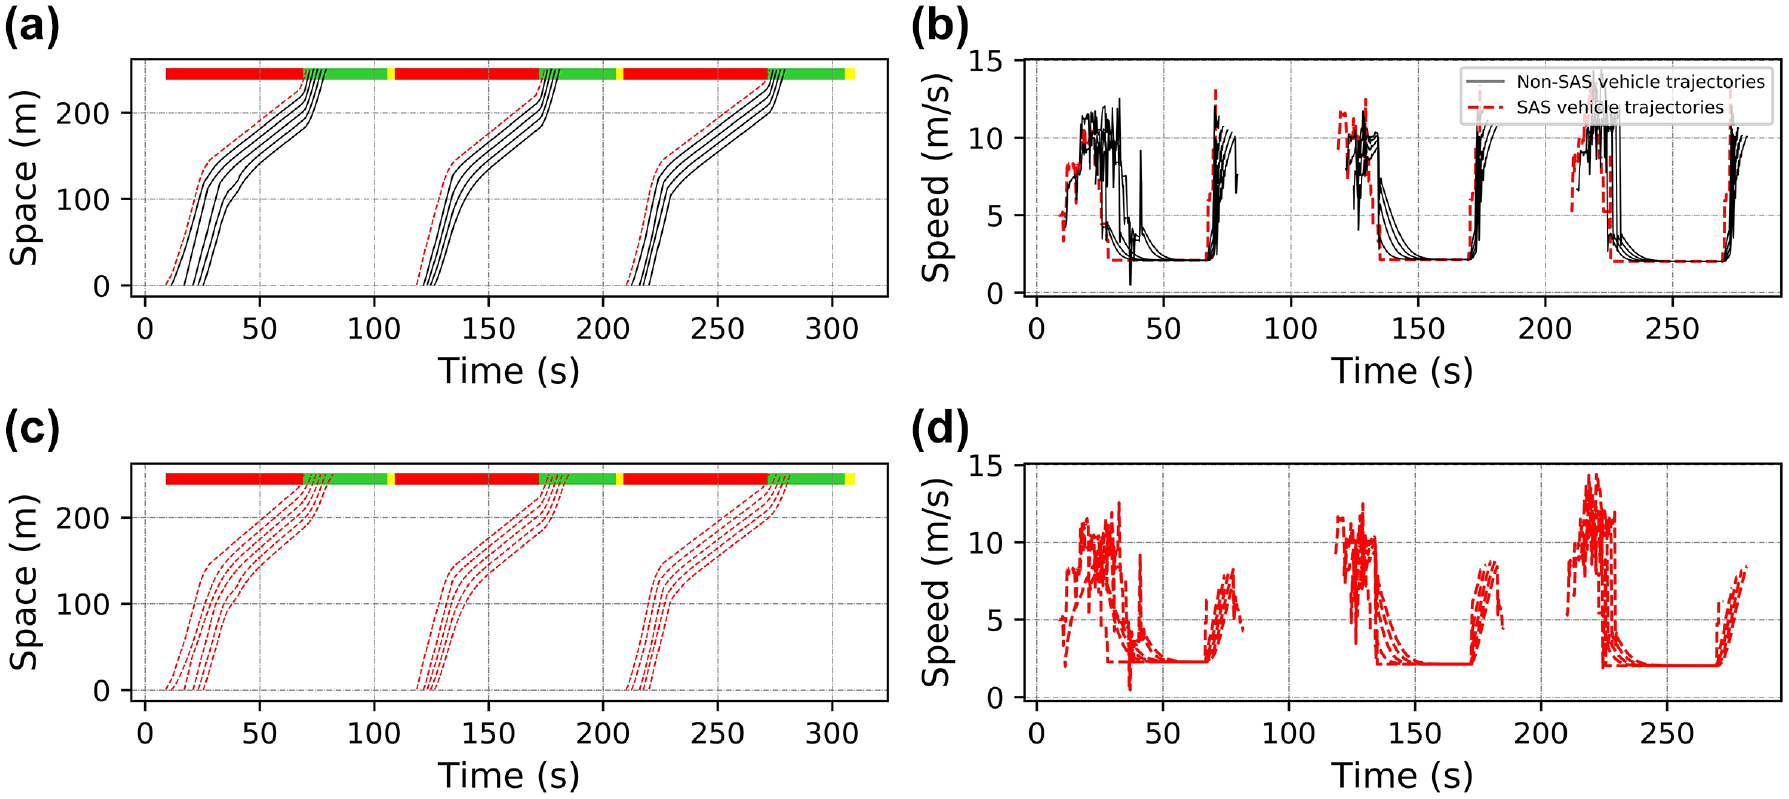
Trajectories and speed distributions for the first positioned speed advisory system (SAS) vehicle and 100% market penetration rate (MPR): (a), (b) trajectories and speed distributions of the first positioned SAS vehicle, respectively, and (c), (d) trajectories and speed distributions at 100% MPR, respectively. (Color online only.)
Figure 7 shows the comparison of the safety indicators between the first positioned SAS vehicle and 100% MPR scenarios. We can observe that having a first vehicle equipped with a SAS results in a significant reduction in rear-end collision risks, similar to the 100% MPR scenario. The observed result implies that the safety of the entire approaching vehicle group can benefit as much as the 100% MPR case when the first vehicle is equipped with a SAS and lane changes are impossible or rare.
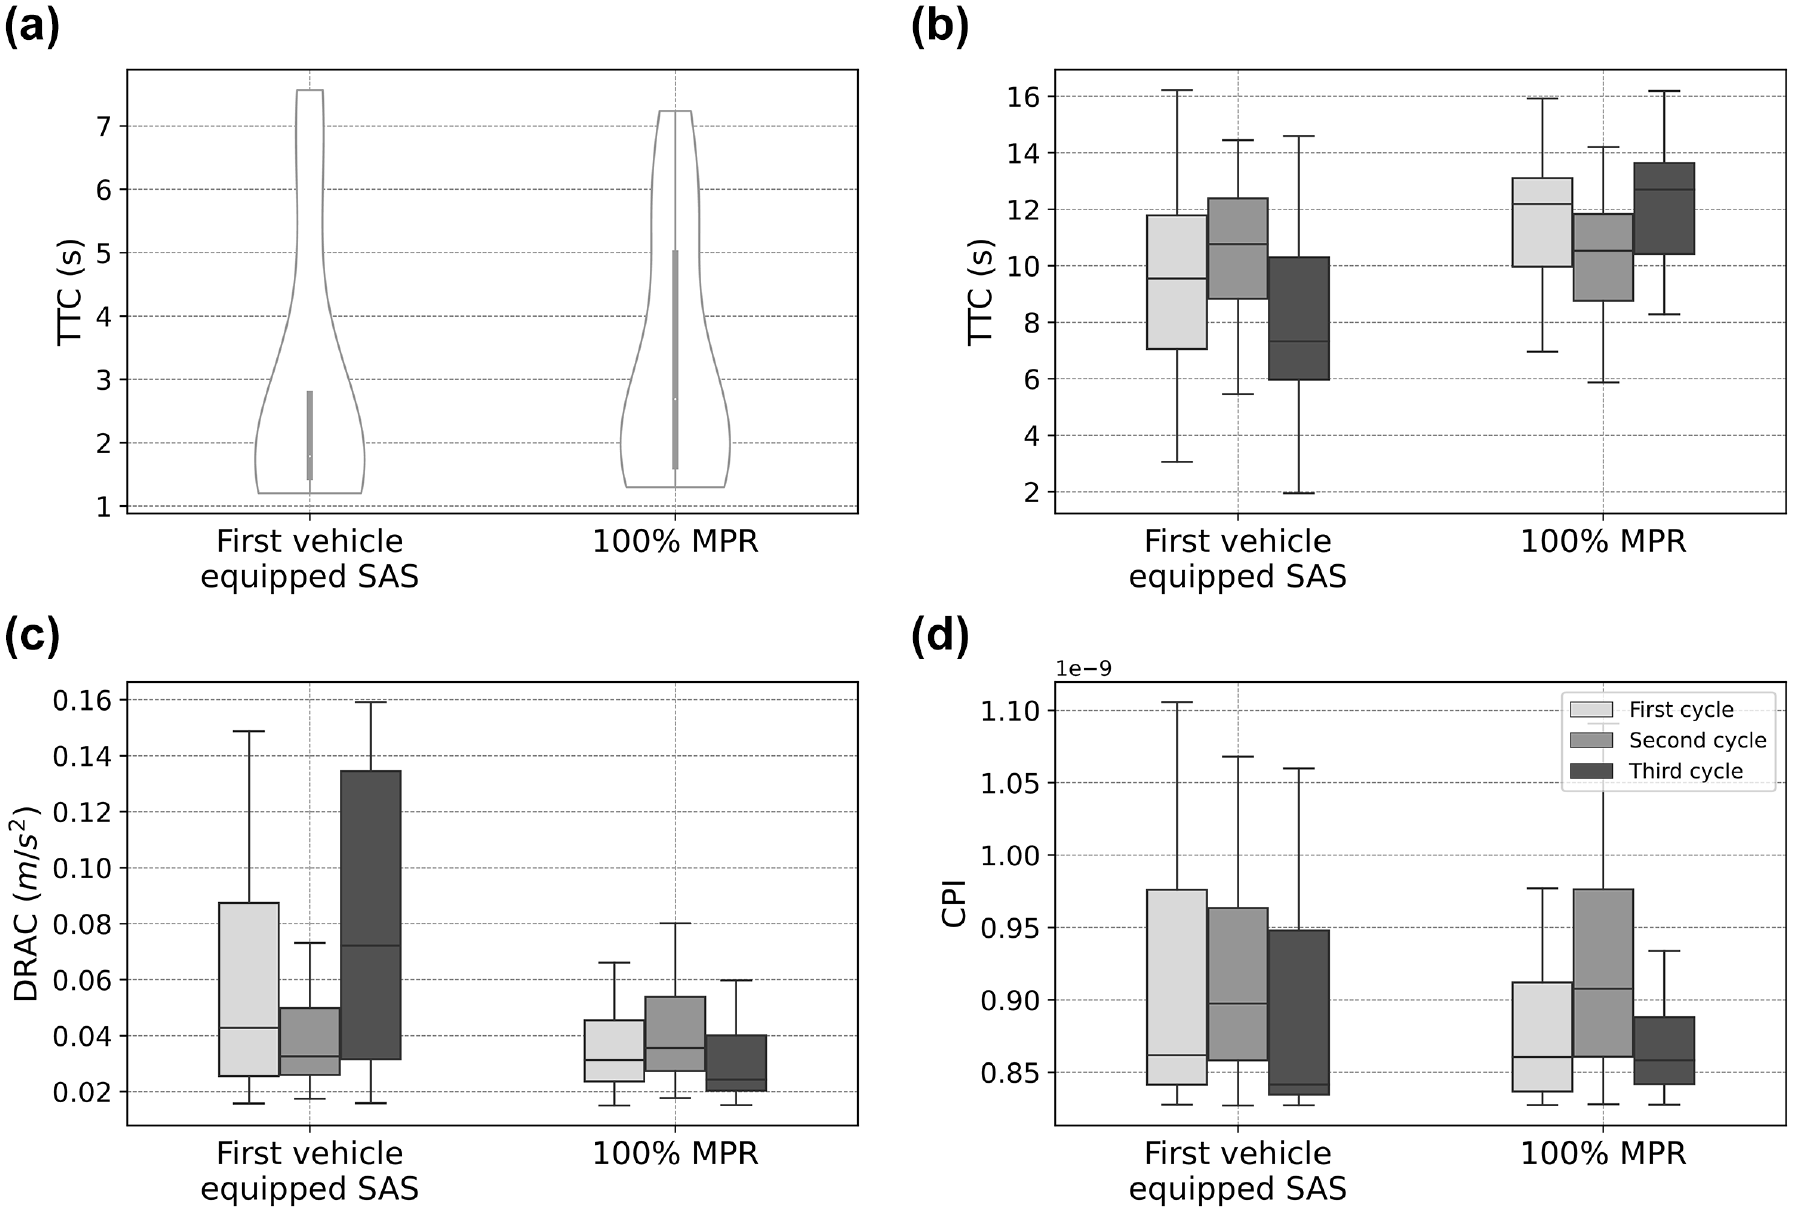
Safety comparisons between the first vehicle equipped with a speed advisory system (SAS) and 100% market penetration rate (MPR): (a) minimum time to collision (TTC), (b) overall TTC, (c) deceleration rate to avoid crash (DRAC), and (d) crash potential index (CPI) (on a logarithm scale) based on MPRs.
Impacts of Lane Changing
The proposed algorithm regulates the SAS vehicles to initiate an early deceleration to avoid unnecessary stops at signalized intersections. The following HDVs will decide whether to change lane or to comply with the preceding SAS vehicle’s deceleration. In this section, we apply the proposed lane-changing rule in the case study area to estimate the safety impact of SAS vehicles in the lane-changing allowed situation.
The 25% MPR scenario is chosen as a benchmark to compare the two scenarios with and without lane-changing possibilities. The minimum and overall TTC values in Figure 8, a and b , show that lane changing entails a slightly higher rear-end collision risk than lane-changing restricted roads. Similar tendencies are observed in the DRAC and CPI values, which show a slightly higher collision risk when lane changing is possible. This observation can be explained by the large gap generated after the preceding vehicle’s lane change (i.e., leaving the current lane), which creates higher speed variations because the following vehicle accelerates to catch up with the new preceding vehicle.
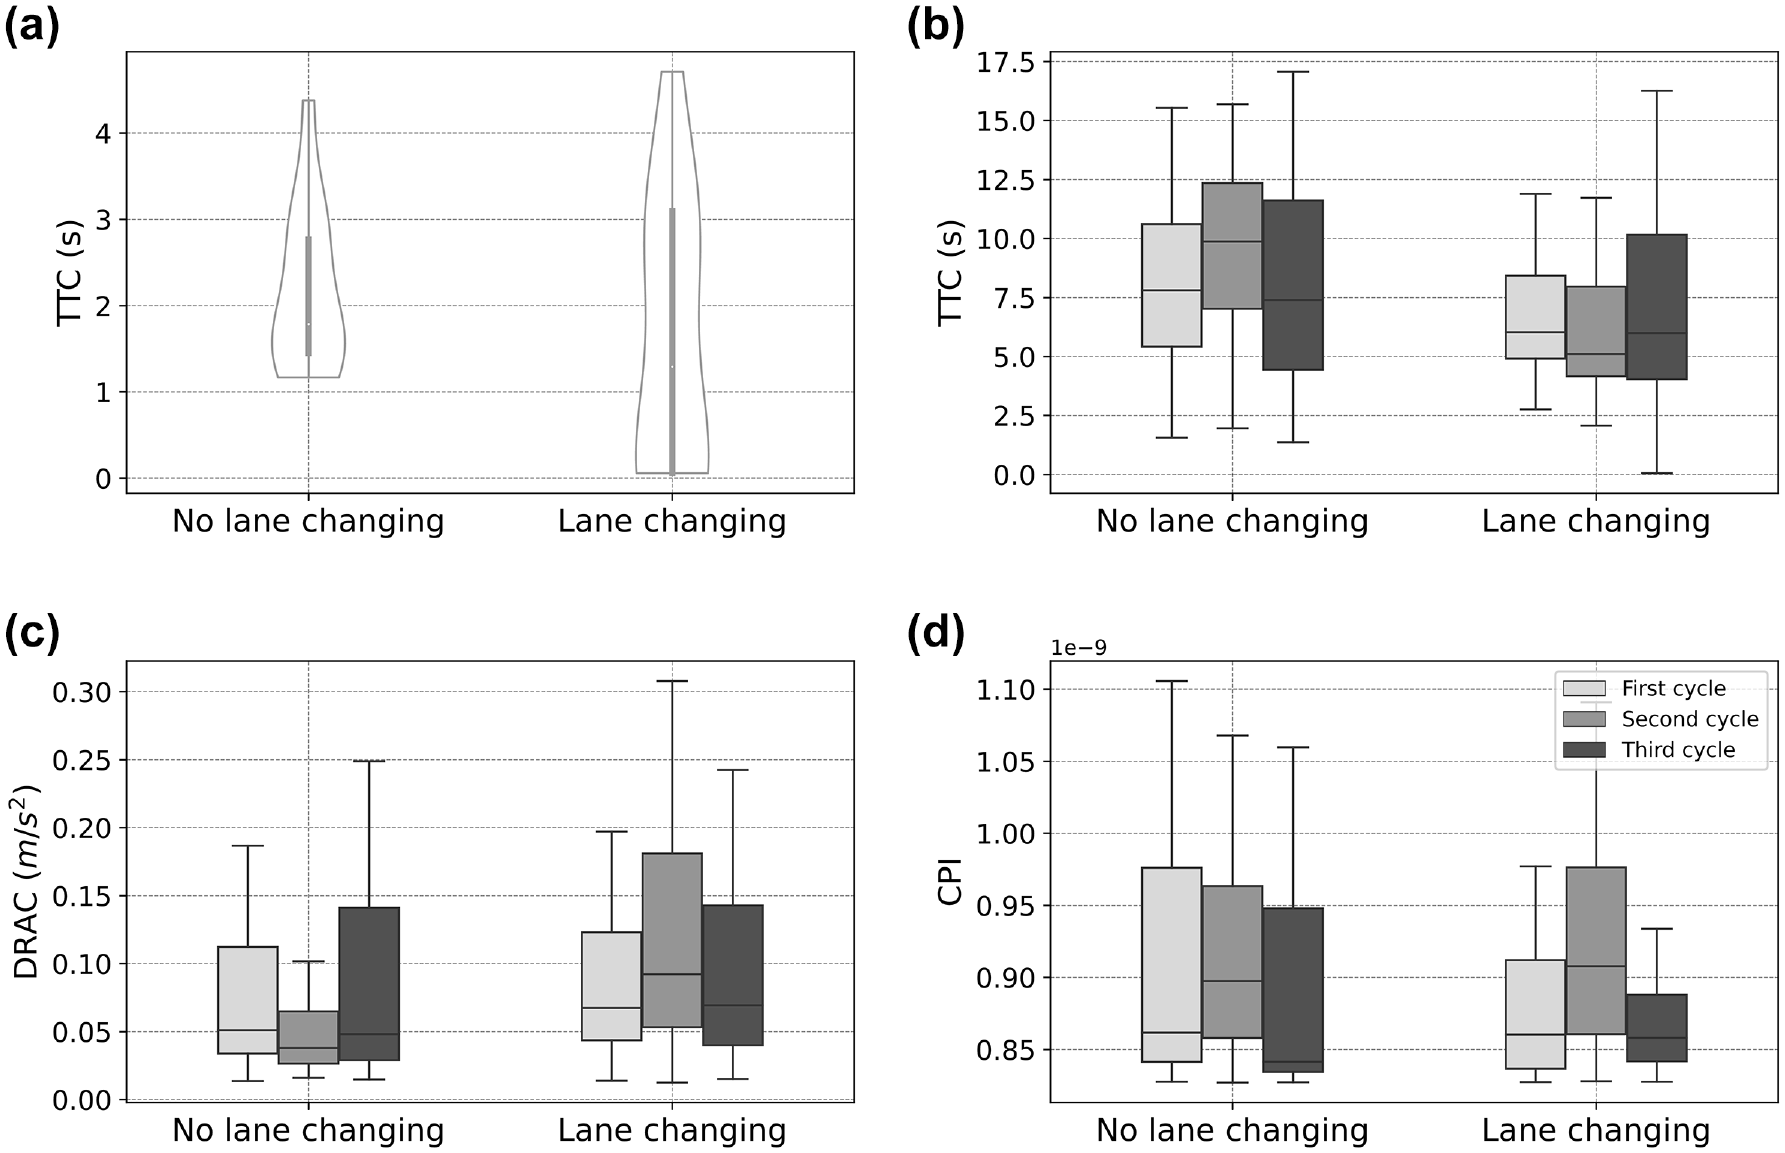
Safety impacts in the lane changing allowed corridor: (a) minimum time to collision (TTC), (b) overall TTC, (c) deceleration rate to avoid crash (DRAC), and (d) crash potential index (CPI) (on a logarithm scale) based on market penetration rates.
Conclusion
This paper estimated the safety impacts of SAS vehicles at signalized intersections using a hybrid method between a simulation and field observations that makes the results more realistic than a simulation study, but more general than a field experiment in a limited road environment. The proposed approach enables one to test the impact of various MPRs, a lane-changing possibility, and ordering of vehicle types. The method is applicable to other signalized intersections to evaluate the safety impact of SAS vehicles before implementation. In addition, this paper provides the first insight into the safety impact of SAS vehicles considering various scenarios that were not investigated in the previous literature.
The findings of this paper are summarized as follows. Firstly, the safety benefit of approaching vehicles is strongly related to the position of SAS vehicles within the group. In particular, HDVs following a SAS vehicle can reduce the collision risks by using similar accelerations as the SAS vehicles. If the first vehicle is a SAS vehicle and lane changing is not possible, the crash risks decrease as in the 100% MPR traffic situation. Secondly, the minimum TTCs increase 1.2 s on average for 100% MPR relative to 0%, and the average DRAC for 100% MPR declined for 0.3
The proposed approach has some limitations. (i) HDVs following SAS vehicles are simulated based on the IDM+ car-following model when interrupted. Although the IDM+ is a state-of-the-art microscopic driver model validated in previous work, it requires data about real drivers following SAS vehicles to calibrate the model. (ii) The safety implications of this study are limited to the specific case study, including the driver behavior, road environment (e.g., geometry and traffic control), and vehicle characteristics. Other trajectory datasets are needed to address this issue. (iii) This paper estimates the safety impact of SAS vehicles for one signalized intersection, while further safety investigations are required considering multiple signalized intersection cases.
Possible future research includes evaluating the safety implication of the manual SAS in which drivers have a choice to follow the optimum speed provided by the system or not. When a SAS provides the optimum speed to drivers with driver choices, we could observe the compliance probability of drivers with the optimum speed. We are also interested in further estimating the lane-changing impacts of SAS vehicles. Although we developed the lane-changing model, which estimates the current lane’s safety impact, future works can encompass the impacts of other lanes. Different types of safety indicators should be used to consider the angles of collisions.
Footnotes
Author Contributions
The authors confirm contribution to the paper as follows: study conception and design: W. Do; data collection: W. Do, N. Saunier, L. Miranda-Moreno; analysis and interpretation of results: W. Do, N. Saunier, L. Miranda-Moreno; draft manuscript preparation: W. Do. All authors reviewed the results and approved the final version of the manuscript.
Declaration of Conflicting Interests
The author(s) declared no potential conflicts of interest with respect to the research, authorship, and/or publication of this article.
Funding
The author(s) disclosed receipt of the following financial support for the research, authorship, and/or publication of this article: This work was supported by the MITACS program (grant numbers MITACS IT12149).