
Abstract
Electric vehicle (EV) adoption is a key action toward reducing global greenhouse gas emissions from the transport sector, enabling a shift from a fossil fuel intensive on-road sector to a material intensive one, especially for critical minerals used in lithium-ion batteries: lithium, cobalt, and nickel. Recent literature has manly focused on forecasting future EV demand and subsequent global battery and critical mineral requirements without modeling which countries will produce the EVs. The Model for International Electric Vehicle Trade (MONET) is a policy-scenario model that combines up-to-date EV demand forecasts, light-duty vehicle global trade flows under different scenarios, and battery characterization to estimate future EV production and battery requirements per country. Results indicate that future EV global trade will be characterized by trade within regional blocks, with contrasting results: North America will be a big producer that will still require imports to meet their demand, Europe will be a big trade region within itself, Japan and South Korea will be big exporters of EVs, and China’s production could go almost entirely to satisfy their domestic supply. Different scenarios show variability according to changes in global trade flows, which are affected by economic and geopolitical events. A major insight reflected in MONET is that an increase in demand for EVs in one country does not translate to a proportional increase in production in the same country. MONET helps to inform which countries will be major producers of EVs by vehicle size, and the amount of battery capacity they will need to secure. Future expansion of MONET includes critical materials estimations based on future battery chemistry development.
Keywords
Globally, the transportation sector accounts for 16.2% of greenhouse gas (GHG) emissions, and passenger light-duty vehicles (LDVs) for 73.5% of them (11.9% of the global total) ( 1 ). To mitigate climate change, society is aiming to decarbonize the transport sector, while maintaining (or improving) the same level of service. Passenger transport provide multiple benefits, such as access to opportunities and services, and is a key aspect of modern society. In recent years, the sector has seen a significant growth driven mostly by developing countries ( 2 ). The adoption of light-duty electric vehicles (EVs) arises as one of the main actions to reduce GHG emissions from the passenger transport sector, while keeping the benefits of transport to society. Many regions are pursuing electrification of their vehicle fleet with ambitious targets ( 3 ). For example, the state of California in the U.S. established a roadmap to achieve 100% new all EV sales by 2035 ( 4 ). According to the international energy agency (IEA), EV sales increased from 0.7 million in 2016 to over 10 million in 2022, with a forecast that sales will surpass 40 million units by 2030 ( 2 ).
As EVs consume six times more critical minerals than internal combustion engine vehicles (ICEVs), the global adoption of EVs will shift the transport sector from being fossil fuel intensive to being material intensive, especially for critical materials contained in batteries such as lithium, cobalt, and nickel, among others ( 5 – 8 ). Multiple studies have predicted that in the next decade the demand for these materials will scale many times, and that circularity will not play a big role in the next 15 years ( 6 , 8 , 9 ). A recent IEA report states that automakers are getting involved in the critical mineral value chain to secure an adequate supply ( 8 ). As countries prepare for the upcoming upscale of battery and mineral demand, it is imperative to have accurate estimates of which countries will likely produce the bulk share of EVs.
The expected demand for EVs in the next decades, and the derived demand for lithium-ion batteries, will require a major shift in the global automobile and critical mineral supply chains. An increase in demand for EV in one country does not translate to a proportional increase in production in the same country, as vehicles are produced and assembled globally. The present study is an effort to connect future spatial demand of EV with supply, and to study different trade scenarios that influence allocation of production among different countries. The results can be used to better inform trade policies and to move forward in co-locating battery production with final EV assembly.
Future EV Modeling Efforts
Recent literature has been mostly focused on modeling the past, current, and future sales, and in-use stocks of EVs and their associated mineral requirement, rather than on explicitly modeling the supply chains that produce them. In this regard, there is a gap in understanding which countries will likely be involved in the supply chain for EVs and how different policies and regional trade agreement are likely to affect the supply chain.
Table 1 summarizes recent global models with available EV projections found in the literature. Most models consider a time horizon up to 2050 and have a global coverage with different levels of regional detail. The most detailed models focus on the whole energy sector, with a dedicated transport section. For models that include EVs, the focus has been concentrated on battery requirements and their associated raw materials, rather than EVs or LDVs units.
Summary of Recent Models/Tools Related to Electric Vehicles (EVs) or Critical Minerals
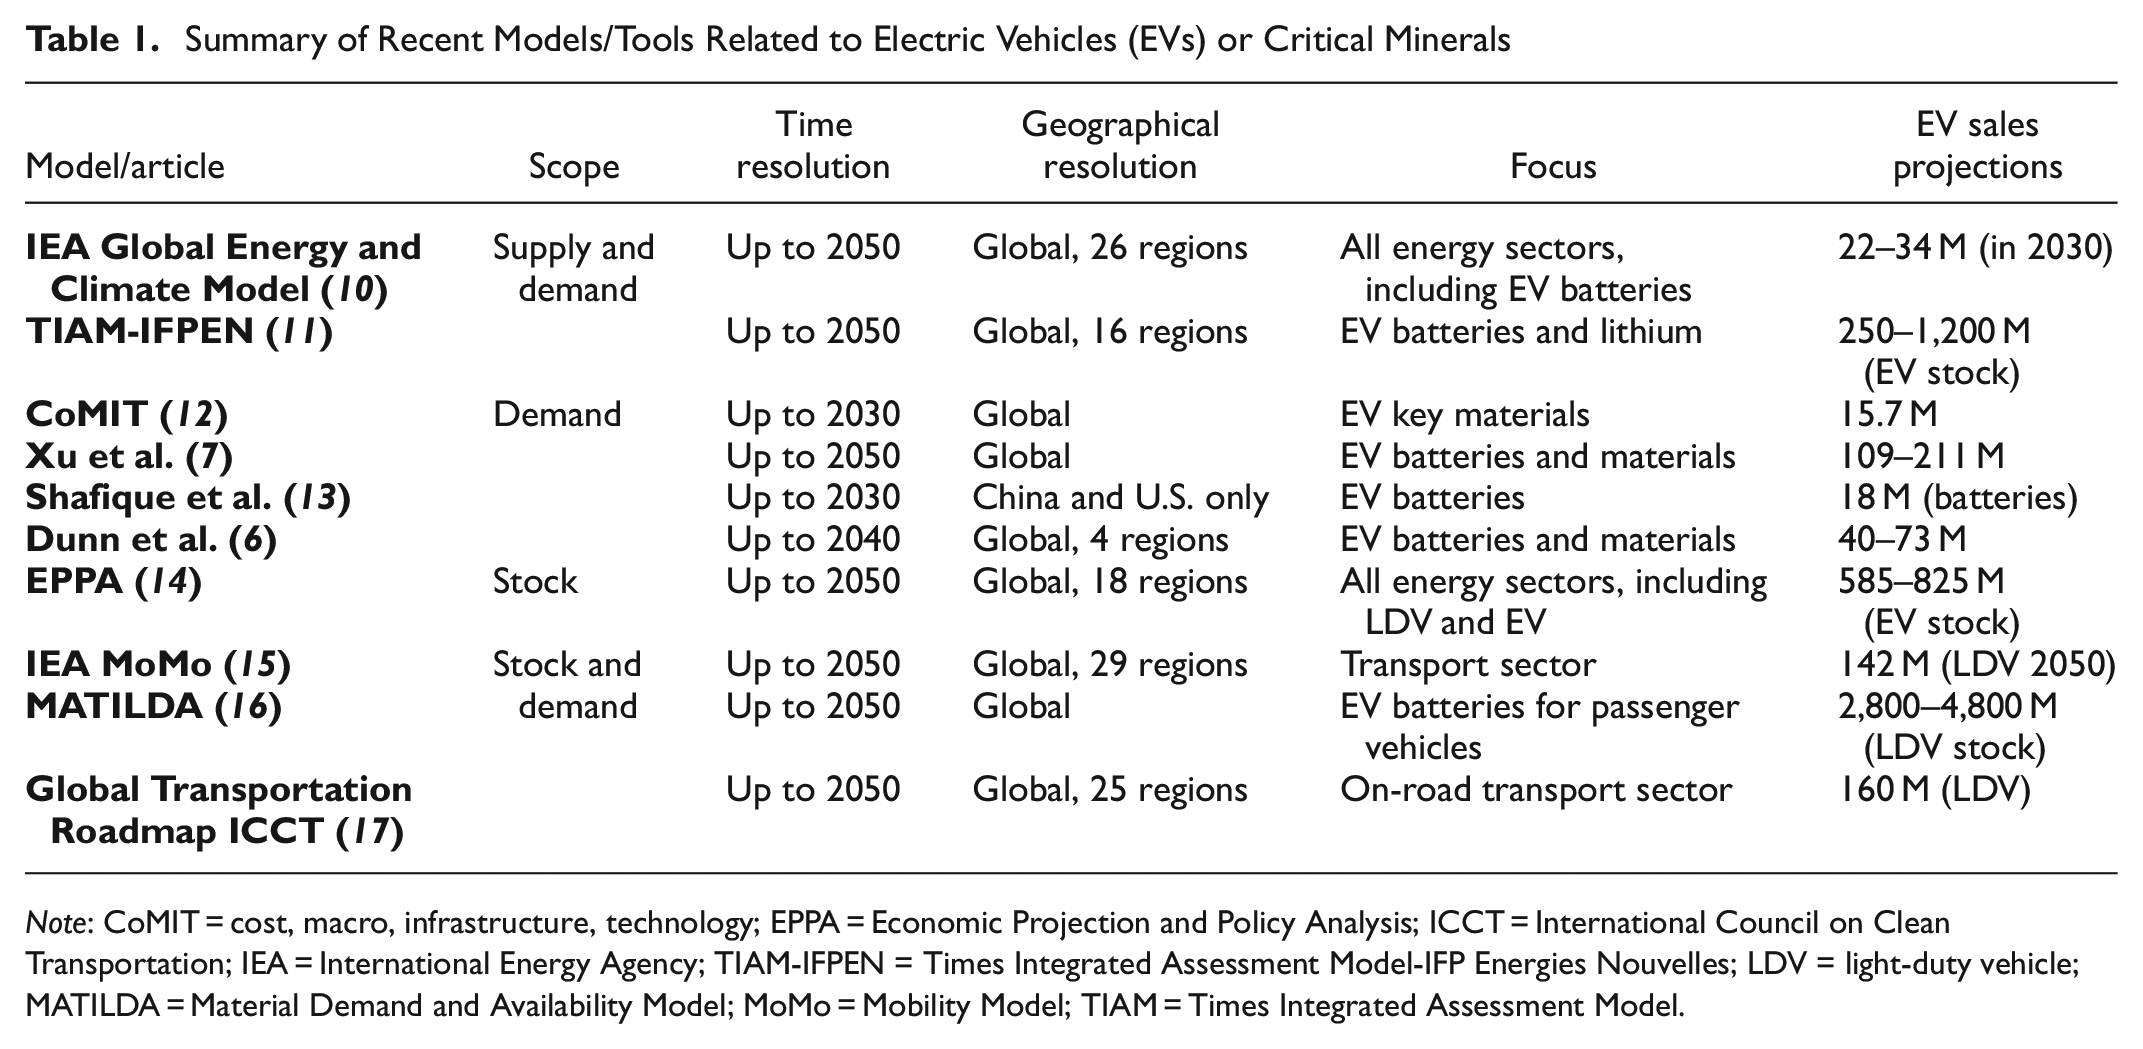
Note: CoMIT = cost, macro, infrastructure, technology; EPPA = Economic Projection and Policy Analysis; ICCT = International Council on Clean Transportation; IEA = International Energy Agency; TIAM-IFPEN = Times Integrated Assessment Model-IFP Energies Nouvelles; LDV = light-duty vehicle; MATILDA = Material Demand and Availability Model; MoMo = Mobility Model; TIAM = Times Integrated Assessment Model.
Key highlights from the recent modeling efforts described in Table 1 are that, with regard to value, batteries account for 30%–40% in an EV, and China completely dominates the production of lithium-ion batteries (~75%), as well as the production of the main components: cathodes and anodes ( 9 ). IEA recommends accelerating EV global uptake by ensuring secure, resilient, and sustainable supply chains ( 9 ). Major worries identified for the supply chain are the exponential growth of demand for EVs, uneven spatial distribution in the required raw materials, and market barriers that slow down the market response to the demand increase ( 12 ). Other identified challenges in the supply chain for EV batteries, besides the exponential growth of demand, are the high volume of the supply chain concentrated in East Asia, difficulty in accessing raw materials, and environmental and health concerns associated with the extraction of key minerals ( 18 ).
Efforts have been made to model demand and supply of EV jointly, but only at a national scale ( 19 – 21 ). The automaker-consumer model was developed to simulate the national consumer and producer interaction, using a profit maximization optimization setting to characterize the behavior of the whole automaker sector in Canada, with no consideration of international trade ( 19 – 21 ).
Trade Models
Other studies have analyzed the dynamics of vehicle international trade flows. A recent study analyzed automotive trade networks over 1993–2013, using trade data at country level of automobile components (electric, engine, rubber, and metal parts) using methods from the social theory of networks ( 22 ). It was found that, in the last 2 decades, trade in major automotive components has changed significantly: the number of sellers for minor components has increased, while the supply of engines has become concentrated in fewer players ( 22 ). This highlights the importance of modeling trade at country level, as many trade relationships and patterns are obscured at higher aggregated levels. A similar study analyzed international trade data on 30 vehicle components using cluster analysis over time, from 1993 to 2018, considering 42 countries (98% of the trade share) ( 23 ). Over the 25-year period studied it found a transition toward denser networks within each cluster, with significant changes in the relative size between clusters. Future research directions point toward modeling the potential change that an increased share of EV at the expense of ICEVs will cause, as the new production for EV components may not necessarily occur in the countries that are currently producing components for ICEVs ( 23 ). Other sets of models assess global trade, analyzing the impact of trade policies and agreements on the global economy by considering various factors such as tariffs, exchange rates, and economic and demographic trends. These models are used to evaluate the potential effects of trade policies on various economic outcomes, such as economic growth, employment, and trade flows. Some examples of widely used global trade models include the World Trade Organization Global Trade Model, the Global Trade Analysis Project Model, and the Trade and Environment Model ( 24 – 26 ). These models incorporate data on trade flows, production processes, and environmental impacts to estimate the impacts of trade policies and environmental regulations on the economy and the environment. Although these global trade models provide valuable insights into the potential future of the mobility sector, there are some limitations and potential shortcomings associated with them, such as dependence on multiple assumptions about economic and technological development.
The biggest limitation of all these models is the scope: focusing mostly on the demand side of transportation while providing no insights into the supply side. No study or model was found with a focus on the supply side of the EV market with a country-level global resolution. There is a modeling research gap in the EV supply side and on the impact of LDV international trade relationships.
MONET
The Model for International Electric Vehicle Trade (MONET) is global in scope and uses up-to-date demand forecasts for light-duty EVs in combination with historical global trade statistics of LDV flows to allocate future production of EVs ( 27 ). MONET is able to identify which countries will likely produce the biggest share of EVs and provides policy recommendations on securing a supply of the required batteries. A detailed review of MONET’s scope, goal, and methods can be found in Tal et al. 2023 and Pares et al. 2023 ( 27 , 28 ).
The present study further expands the capabilities of MONET, adding a new dimension of market segments by vehicle size and a detailed characterization of battery requirements by country and segment ( 27 , 28 ). These new developments would allow MONET to estimate accurately the required battery capacity for producing light-duty battery electric vehicles (BEVs) and plug-in hybrid electric vehicles (PHEVs) in the country of final assembly. MONET results should help vehicle-producing countries in pursuing trade policies to secure battery and mineral supply to meet the future global EV demand. MONET is used in this research to answer the following research questions: How would the light-duty EV supply trade look in 2035 considering market segments? How might global trade policies affect the global EV supply in 2035? Which countries should focus on securing battery supply for EV production?
Methods
MONET Data Sources and Model Structure
MONET allocates future production of EVs and battery requirements, based on EV sales forecasts, LDV trade ratios among countries, and battery chemistry technology. MONET only considers light-duty EVs—both BEVs and PHEVs. Figure 1 shows the overall diagram for MONET, showing the main data inputs, model processing, and final production scenarios input. MONET uses global LDV sales and production data from 2017–2019, along with reported LDV trade flows from the United Nations (UN) Comtrade database to construct a balanced supply chain flow matrix ( 29 , 30 ). The period 2017–2019 was selected to avoid the major disruption in global supply chains caused by COVID-19, and a 3-year period should give a more accurate representation of global LDV flows. MONET spatial resolution consists of 65 countries and aggregated regions worldwide. MONET also uses complementary data from the Mexican Automotive Industry Association, Mexico’s National Institute for Geography and Statistics, United States International Trade Commission, and Canadian International Merchandise Trade ( 31 – 34 ). To generate a reliable forecast for 2035, we combine different demand projection data sources: International Council on Clean Transportation (ICCT) Roadmap, IEA mobility model (MoMo), and IEA Global Policy Explorer for EV policy commitments ( 3 , 15 , 17 ). Data to characterize current battery size and chemistry by country are derived from EV Volumes ( 35 ).
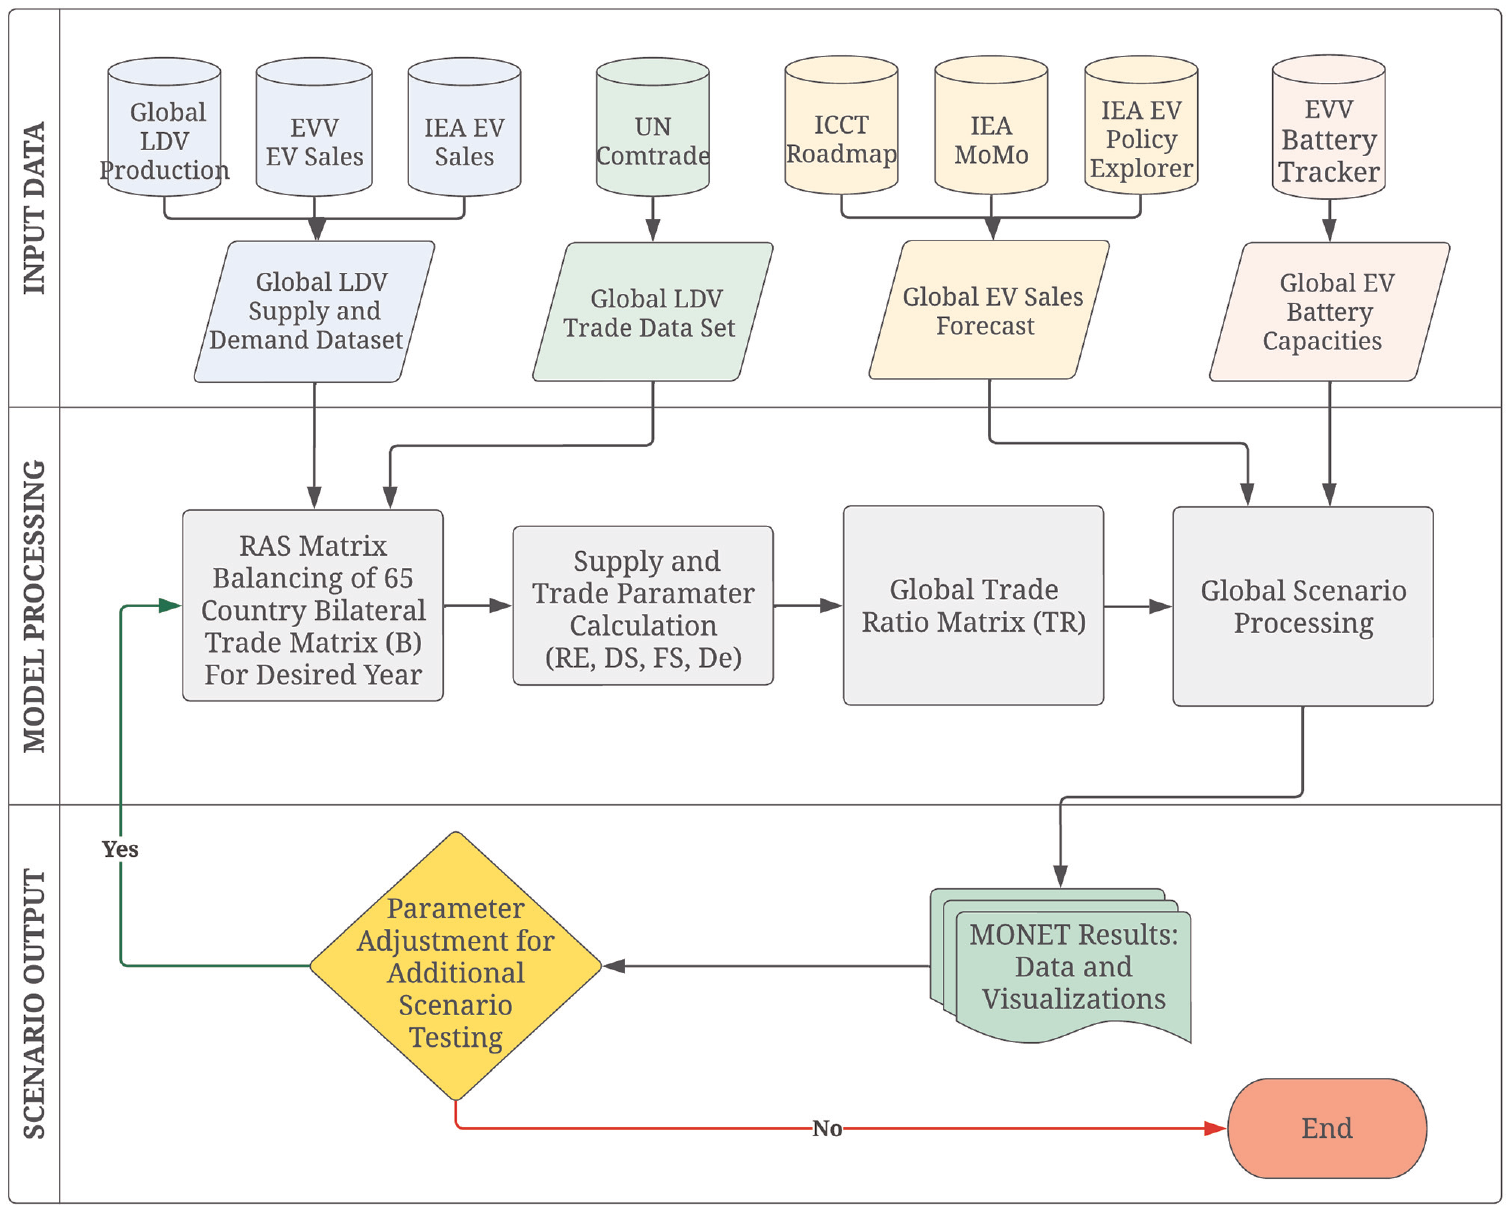
Model for international electric vehicle trade (MONET) structure.
Next, we present the general method for MONET development. For a more detailed explanation, please refer to previous publications ( 27 , 28 ).
Sales Forecast
The first input for MONET is the future demand for light-duty EVs by country and powertrain. The main data sources to construct the forecast were the ICCT Roadmap and the IEA MoMo which provide sales projections for LDV by country up to the year 2050 ( 15 , 17 ). MONET includes current EV policy commitments and targets stated in the IEA Global EV Policy Explorer ( 3 ). To disaggregate demand for EV into BEVs and PHEVs we use the stock model of IEA of the pledges scenario for 2030 ( 2 ). The sales are estimated as the difference between stocks in consecutive years along with the replacement of the fleet that will retire, assuming a lifetime of 14 years for each vehicle. We also consider the commitment of Europe to have 100% BEVs by 2035 ( 36 ).
Balanced Trade Flows
The second and major input for MONET is constructing the trade flows, which simply represents exports and imports of vehicles among countries. The first step in MONET is balancing the conflicting trade data from UN Comtrade and the total reported production and sales of LDVs ( 30 ). As the data come from different sources, total exports or imports by country do not match total sales and production reported by other sources. The basic principle in balancing is to maintain the fundamental trade principle for each country (Equation 1):

where
P = production,
I = imports,
S = sales, and
E = exports.
Production plus imports are equal to sales plus exports in each country. Taking the reported sales and production by country as accurate, the trade flow matrix is balanced using the RAS balancing method, using production data (by country) as row totals and sales (by country) as column totals ( 37 , 38 ). Another challenge was to account for re-exporting, a normal practice in international trade where a country acts as an intermediary from a certain good, obscuring the “true” trade relationship among origin and destination countries ( 39 ). Re-exporting creates anomalies in the data, as artificial trade flows are created among intermediary countries. To account for that, we use a common correction based on the principle of proportionality ( 40 ). The basic principle is correcting by the ratio of exports over total inputs (production and imports).
The resulting matrix represents a data-driven estimate of the 2017–2019 LDV trade flows, and contains valuable information of country of origin and destination for vehicles. To better characterize the trade flows relationships and battery requirements, the trade flows matrix was divided into four market segments. The selected market segments, based on vehicle size and the categories of EV Volumes, are: S1 for vehicles with an overall length (OAL) below 4.1 m (small and minis), S2 for vehicles with an OAL between 4.1 m and 4.6 m (compact), S3 between 4.6 m and 4.8 m (mid) and S4 for vehicles larger than 4.8 m (large and x-large) ( 35 ). Figure 2 shows the distribution among segments of production and sales of LDVs (2017–2019) for the top 14 buying countries. The heterogeneity among different countries in production and market preferences (sales) shows evidence supporting the need to differentiate trade flows according to market segments. For example, the U.S. produces almost 80% in the bigger vehicle segments (S3 and S4), but has a considerable demand for smaller vehicles as well. Another good example is Japan, which produces in every segment, but largely buys smaller cars. Differentiating by market segment allows MONET to have a more accurate estimation of LDV global trade relationships.
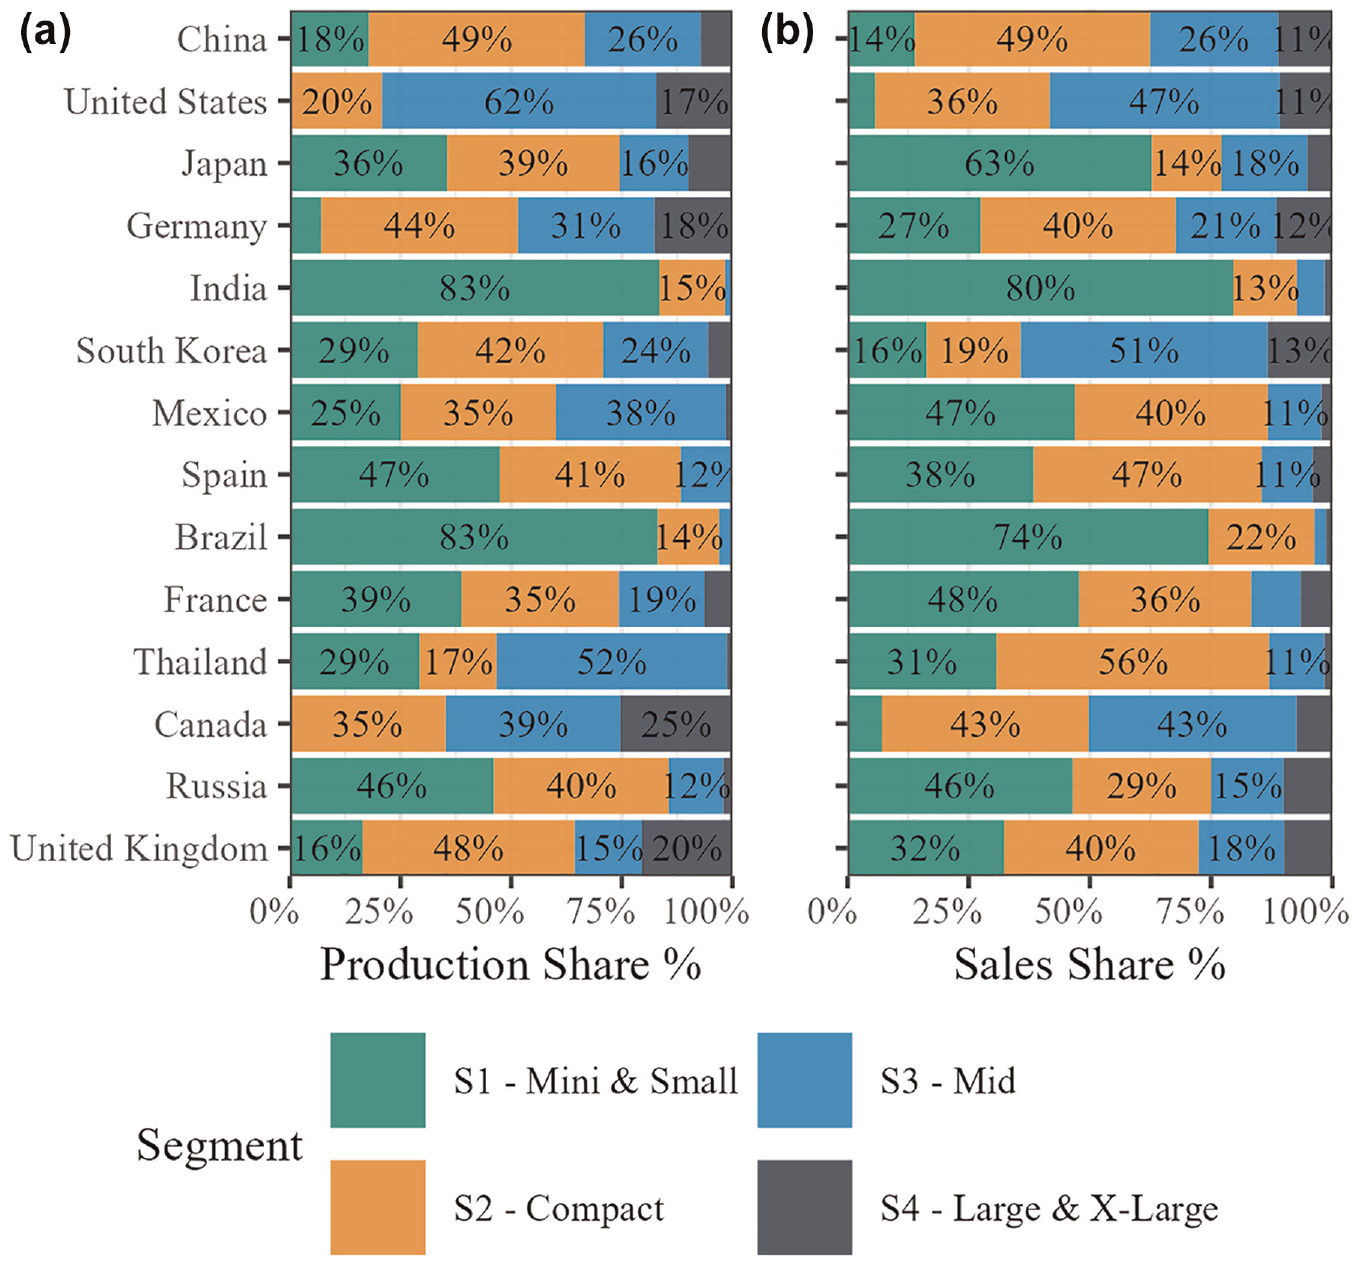
Bar charts showing: (a) production and (b) sales share of light-duty vehicles by segment for the top 14 buying countries 2017–2019.
Total sales and production data are available by market segment for each country ( 29 ). The UN Comtrade flow data do not present information on the vehicle type, so we had to construct the four segment matrices based on the total LDV balanced flows, and on country-level data of sales and production by segment. The algorithm follows a “filling-buckets” principle and sequential allocation of segment flows. We started with the balanced LDV flow matrix and the biggest trade flows relationship (e.g., Japan to United States), and then assigned S4 vehicles produced in the origin country (e.g., Japan) using their production shares (Figure 2), subtracting from the production “bucket” of the country (e.g., Japan), and allocating it toward the sales “bucket” of the destination country (e.g., United States). The algorithm then moves to the next segment: S3, S2, and S1. In the case that the sales or production for that segment are already met either by the producing or buying country in the trade relationship, we allocated the remaining LDV flows to other segments proportionally to their remaining production/sales share, to maintain the total LDV flow balance. The above algorithm has the main goal of disaggregating the total LDV flows into market segments, with the principle of correctly allocating the bigger LDV flows first, and to minimize the loss of information when merging incomplete and conflicting data sources.
Trade Scenarios
The resulting balanced trade flows represent historical data from the 2017–2019 LDV market. To better account for the constantly changing nature of trade relationships, and because we are forecasting trade of EVs rather than LDVs, we constructed several trade ratio scenarios to forecast how the global supply chain of EVs may look in 2035. The proposed scenarios, rationale, and assumptions are:
Battery Requirements
MONET is a model with detailed region resolution (65 regions) that considers different powertrains (BEV and PHEV), along with LDVs market segmentation (S1 to S4). Market segmentation is a key determinant of battery requirement per vehicle, but some variability remains between countries. To characterize battery requirements in each country of production we calculate current statistics per vehicle segment and country of destination, based on EV Volumes data (see Figure 3 for BEV) ( 35 ). A similar battery size characterization was done for PHEV.
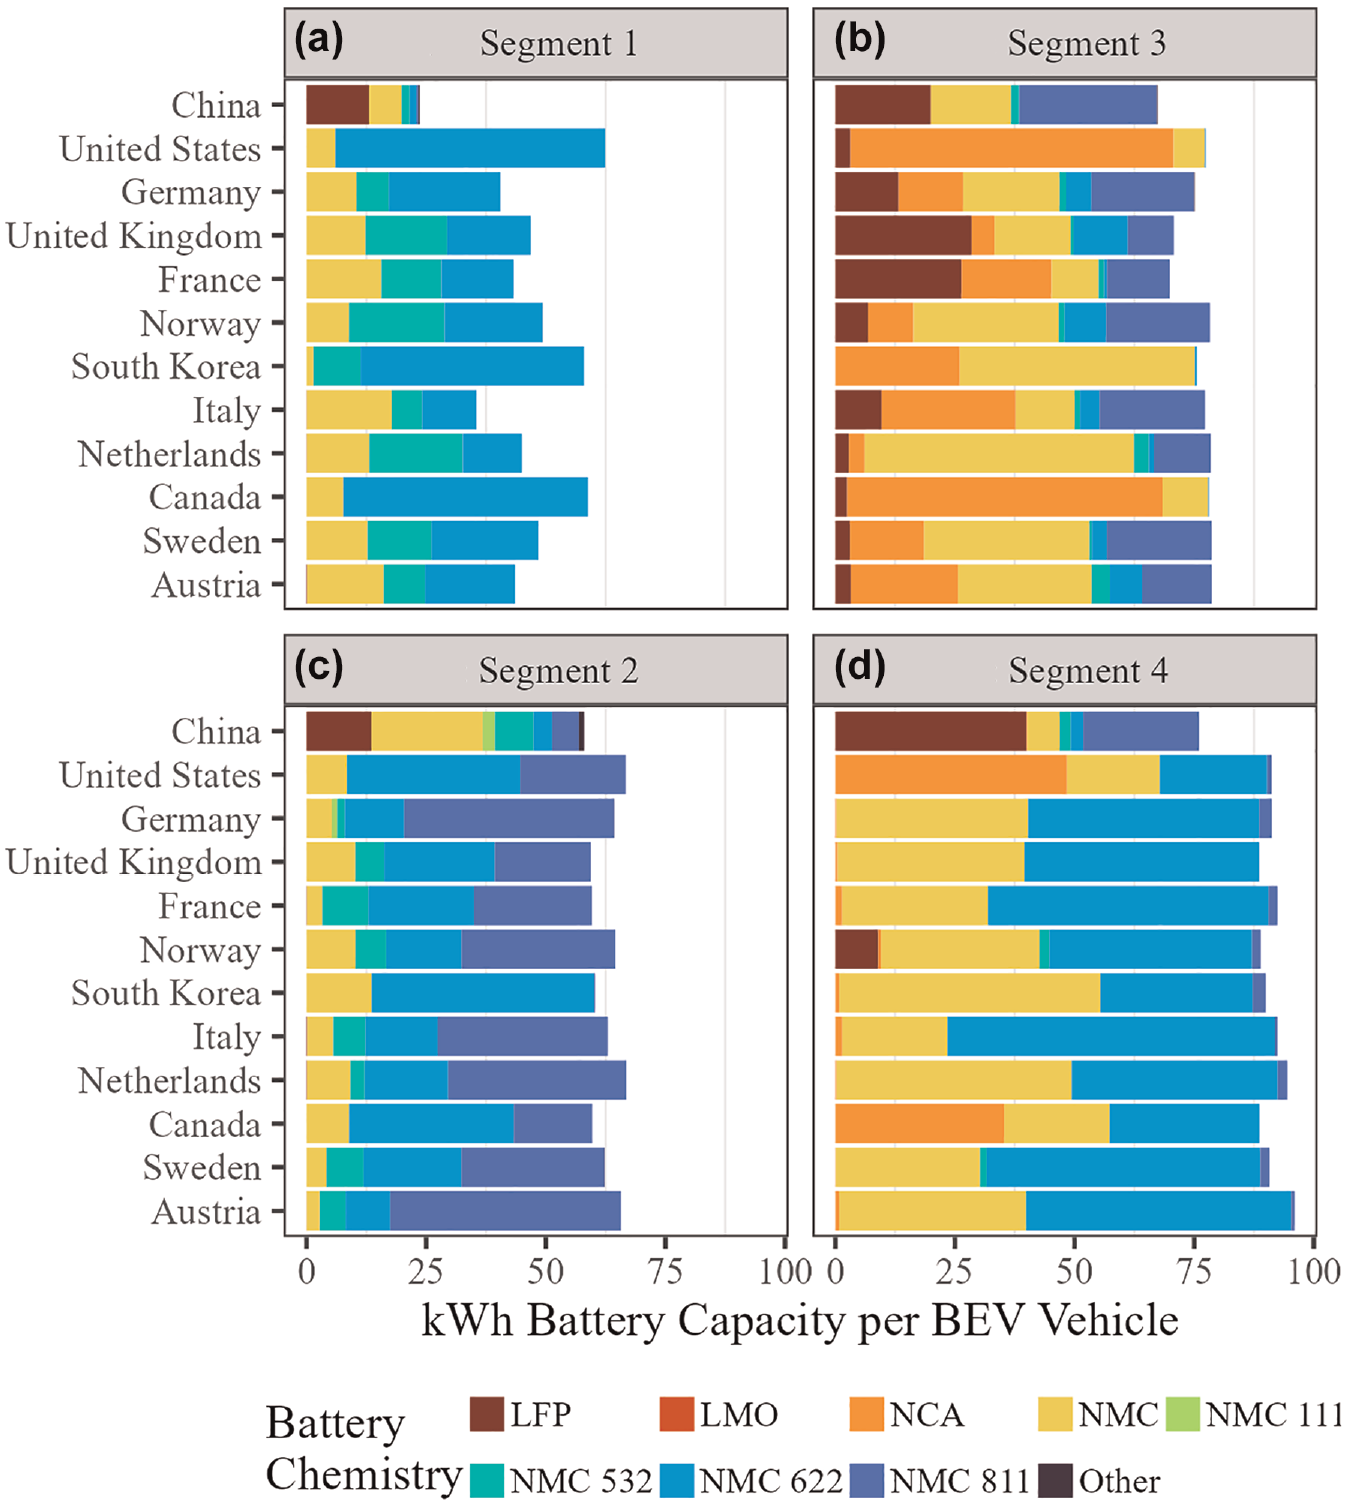
Battery requirements (kWh) per battery electric vehicle (BEV) by segment (vehicle size) and country of demand: (a) Segment 1, (b) Segment 2, (c) Segment 3, and (d) Segment 4 ( 35 ).
Production Allocation
The final step in MONET is combining the sales forecast and the trade balanced flows to allocate future EV production. We first convert the trade balanced flows into sales ratios, that represent for each country the proportion of their LDV sales coming from different countries (domestic and imports). We then multiply the sales forecast vector with this matrix, obtaining production vector by country, which is later balanced using RAS to maintain the fundamental trade balance principle (P + I = S + E). Battery requirements are estimated using the average battery size of the country of destination (Figure 3).
Results
MONET Inputs
Figure 4 presents the forecasted sales of the top countries/regions for 2035, which is the main input for MONET (sales vector). The total forecasted global EV demand is for 57 million EVs in 2035, concentrated mostly in China, United States (U.S.), and Europe. The figure shows that developing regions will likely experience growth in their LDV and EV demand because, with economic development, car ownership rates should grow. For developed countries with mature economies, car ownership is likely to remain stable, presenting a shift from ICEVs to EVs. Recent sales are shown in Figure 4—of LDVs in 2019 and EVs in 2021—to contrast the big upscale of EV demand expected in the future, and the growth of LDVs in developing regions.
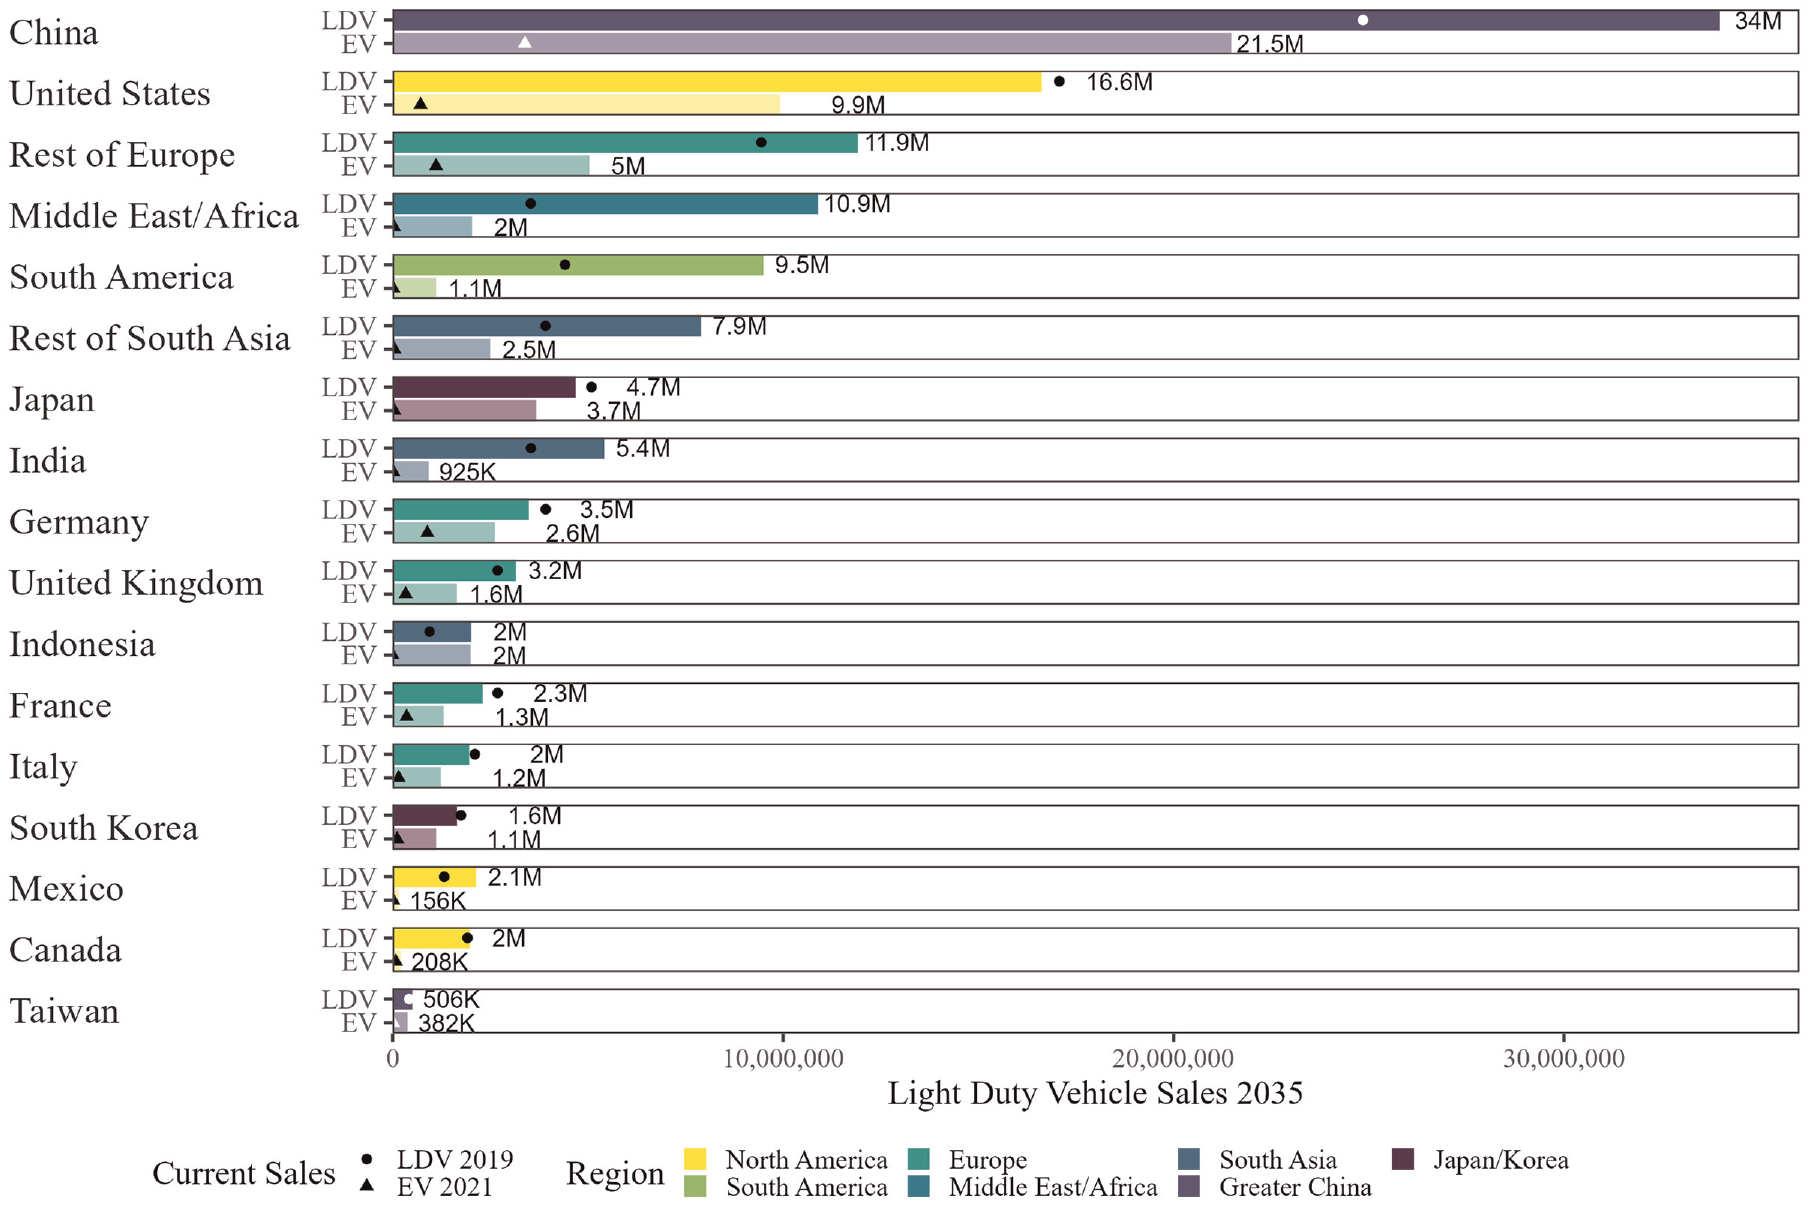
Forecasted light-duty vehicle (LDV) and electric vehicle (EV) sales for 2035.
Figure 5 presents the LDV balanced trade ratios for each market segment for the 2017–2019 period. The rows represent exports from each country, the columns represent imports, and the diagonals correspond to domestic supply. Interesting trade flow patterns can be observed from the figure:
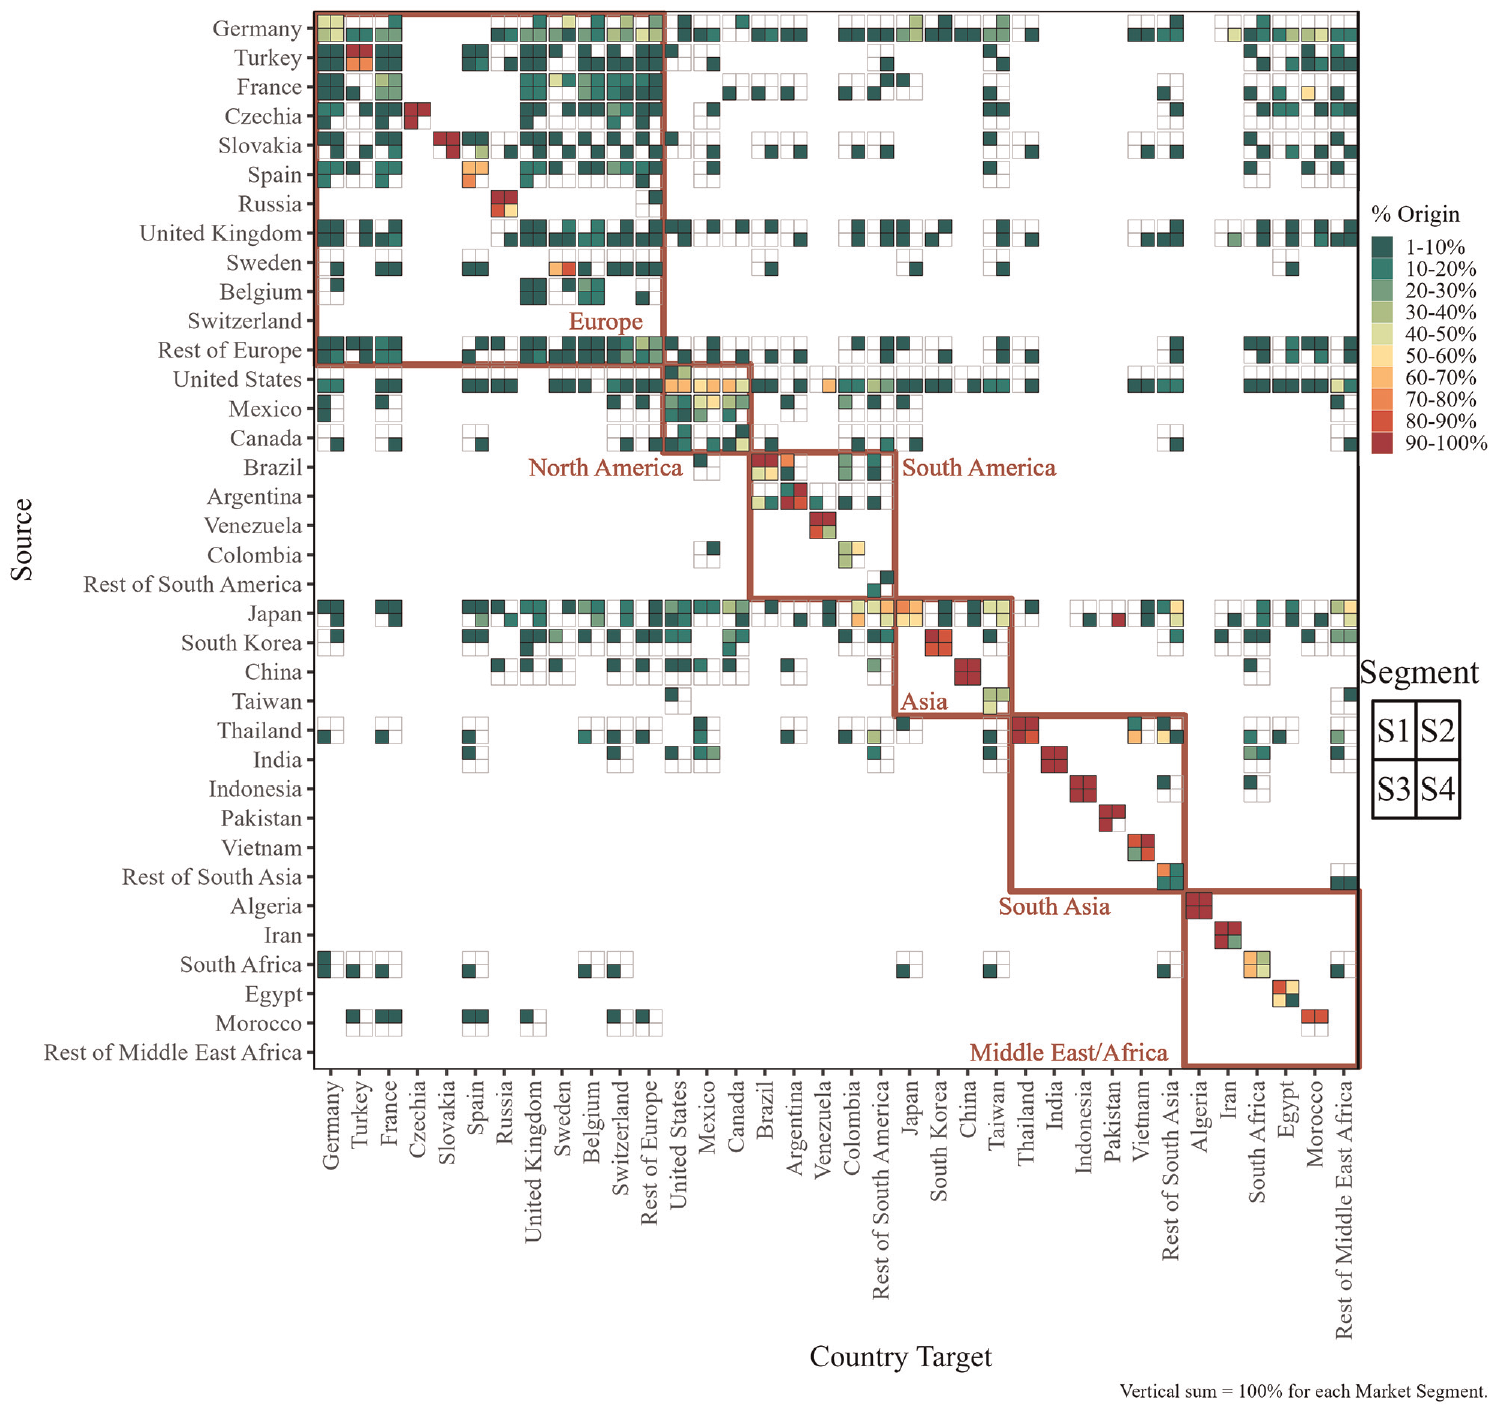
Balance trade ratios for light-duty vehicles (LDVs) 2017–2019 by market segment.
2035 EV Supply Chain
We can visualize the trade relationship for each major vehicle-producing region (see Figure 6 and the Note for directions on Sankey diagrams interpretation). We can observe interesting insights into the supply side of EVs based on market segmentation and global trade:
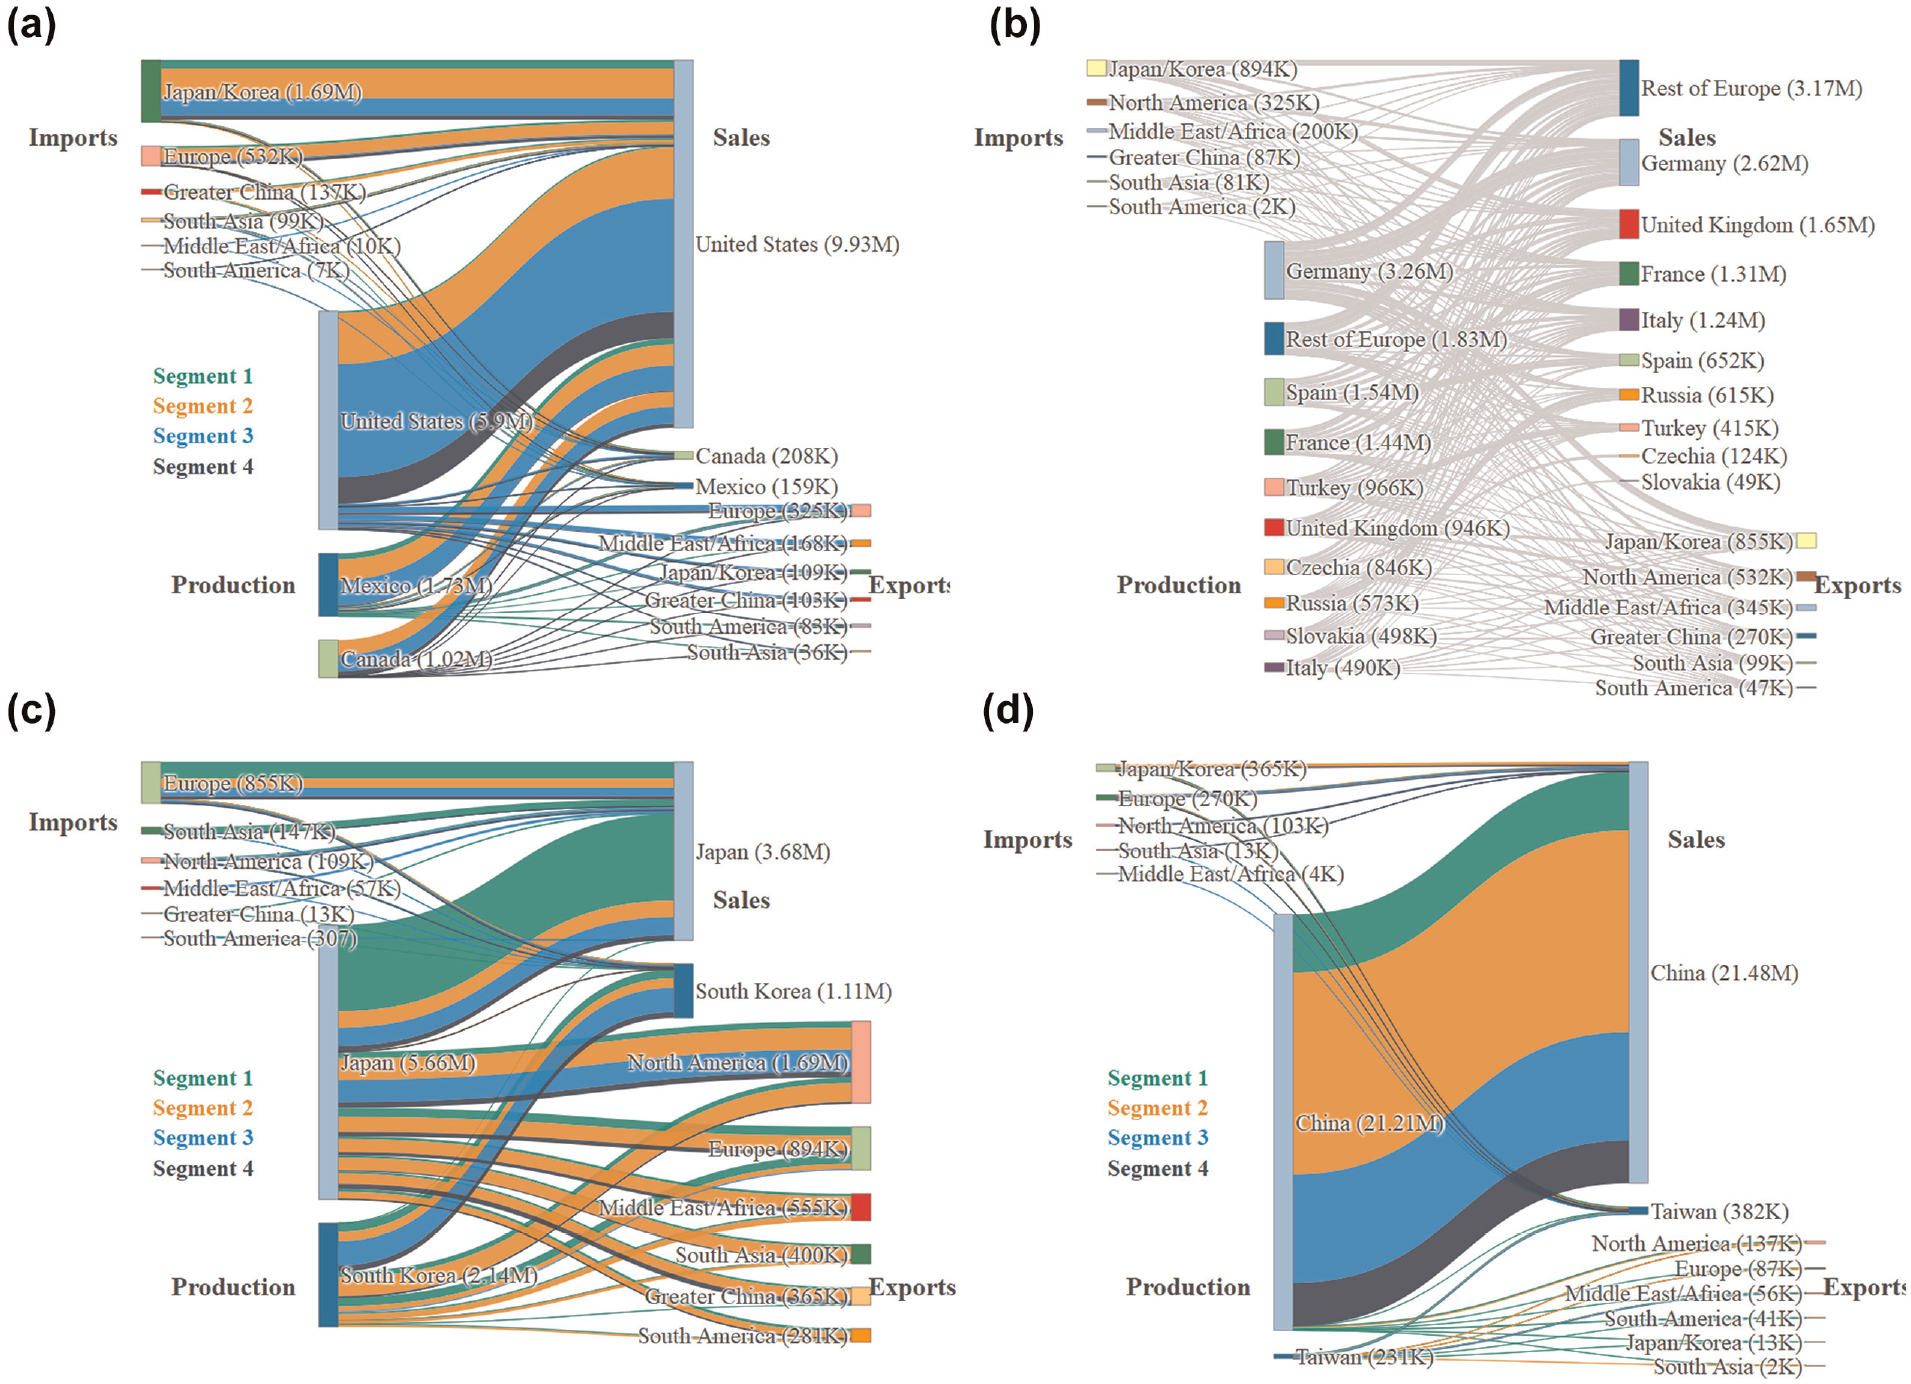
Projected 2035 light-duty electric vehicle supply chain dynamics under baseline trade scenario (T1: light-duty vehicle 2017–2019 trade ratios) for major automobile producing regions: (a) North America, (b) Europe, (c) Japan and South Korea, and (d) Greater China.
EV Supply Chain Under Trade Scenarios
We can analyze the global EV supply chain under the different trade scenarios. Figure 7 shows the EV supply chain dynamics for the Japan and South Korea region under the different trade scenarios. This region was chosen as it is the major exporter region of vehicles in the world. We can observe that current LDV ratios show a similar pattern to the global free trade scenario, with slightly more production in the region under free trade. In the scenarios with higher domestic supply chain and China exporting a share of their production, an important decline in production occurs in the region. With regard to market segments, the region is mostly dominant in the small and medium vehicle sizes, where less competition is likely to occur because of the lower relative value per vehicle.
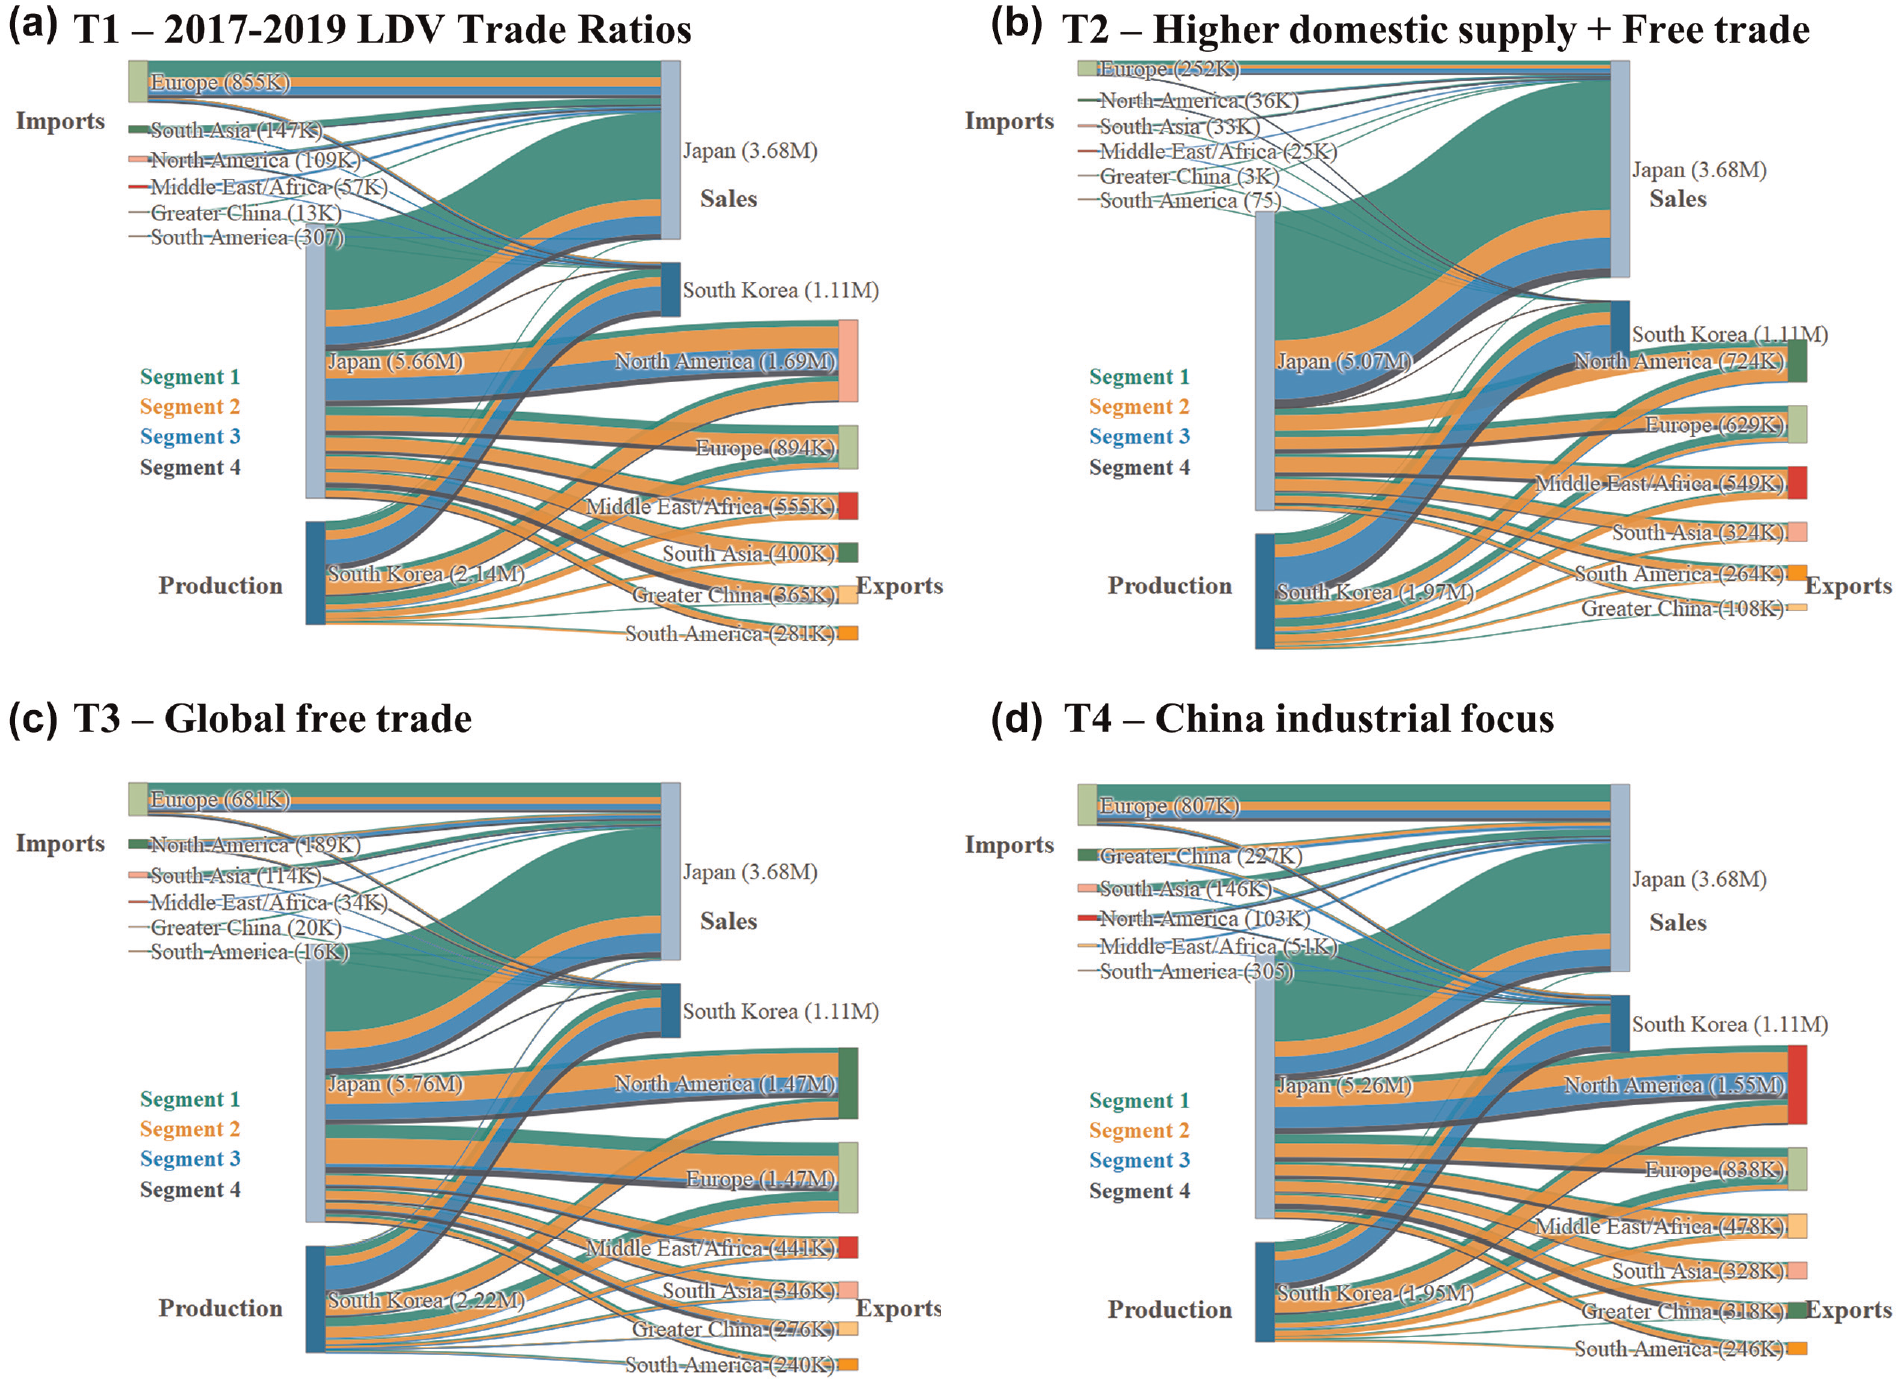
Projected 2035 light-duty electric vehicle supply chain dynamics for the Japan and South Korea region under different trade scenarios: (a) baseline scenario, (b) higher domestic supply scenario, (c) global free trade scenario, and (d) China industrial focus scenario (allocating 20% of demand toward exports).
Figure 8 shows total production by country under the different trade scenarios considered. Differences can be observed between scenarios and share of segments. For example, the U.S. loses production under T3 and T4 scenarios, mostly in the smaller vehicle segments. The segmentation also shows the degree of specialization among countries, with fewer of them producing in the S4 larger segment. Producer countries that do not have a large domestic demand, relative to their production level, depend more on exports and are more susceptible to global trade changes. The production level of Japan, Germany, Mexico, and Canada varies around 20% under the different trade scenarios, showing their industry exposure to the global export market and exogenous trade factors.
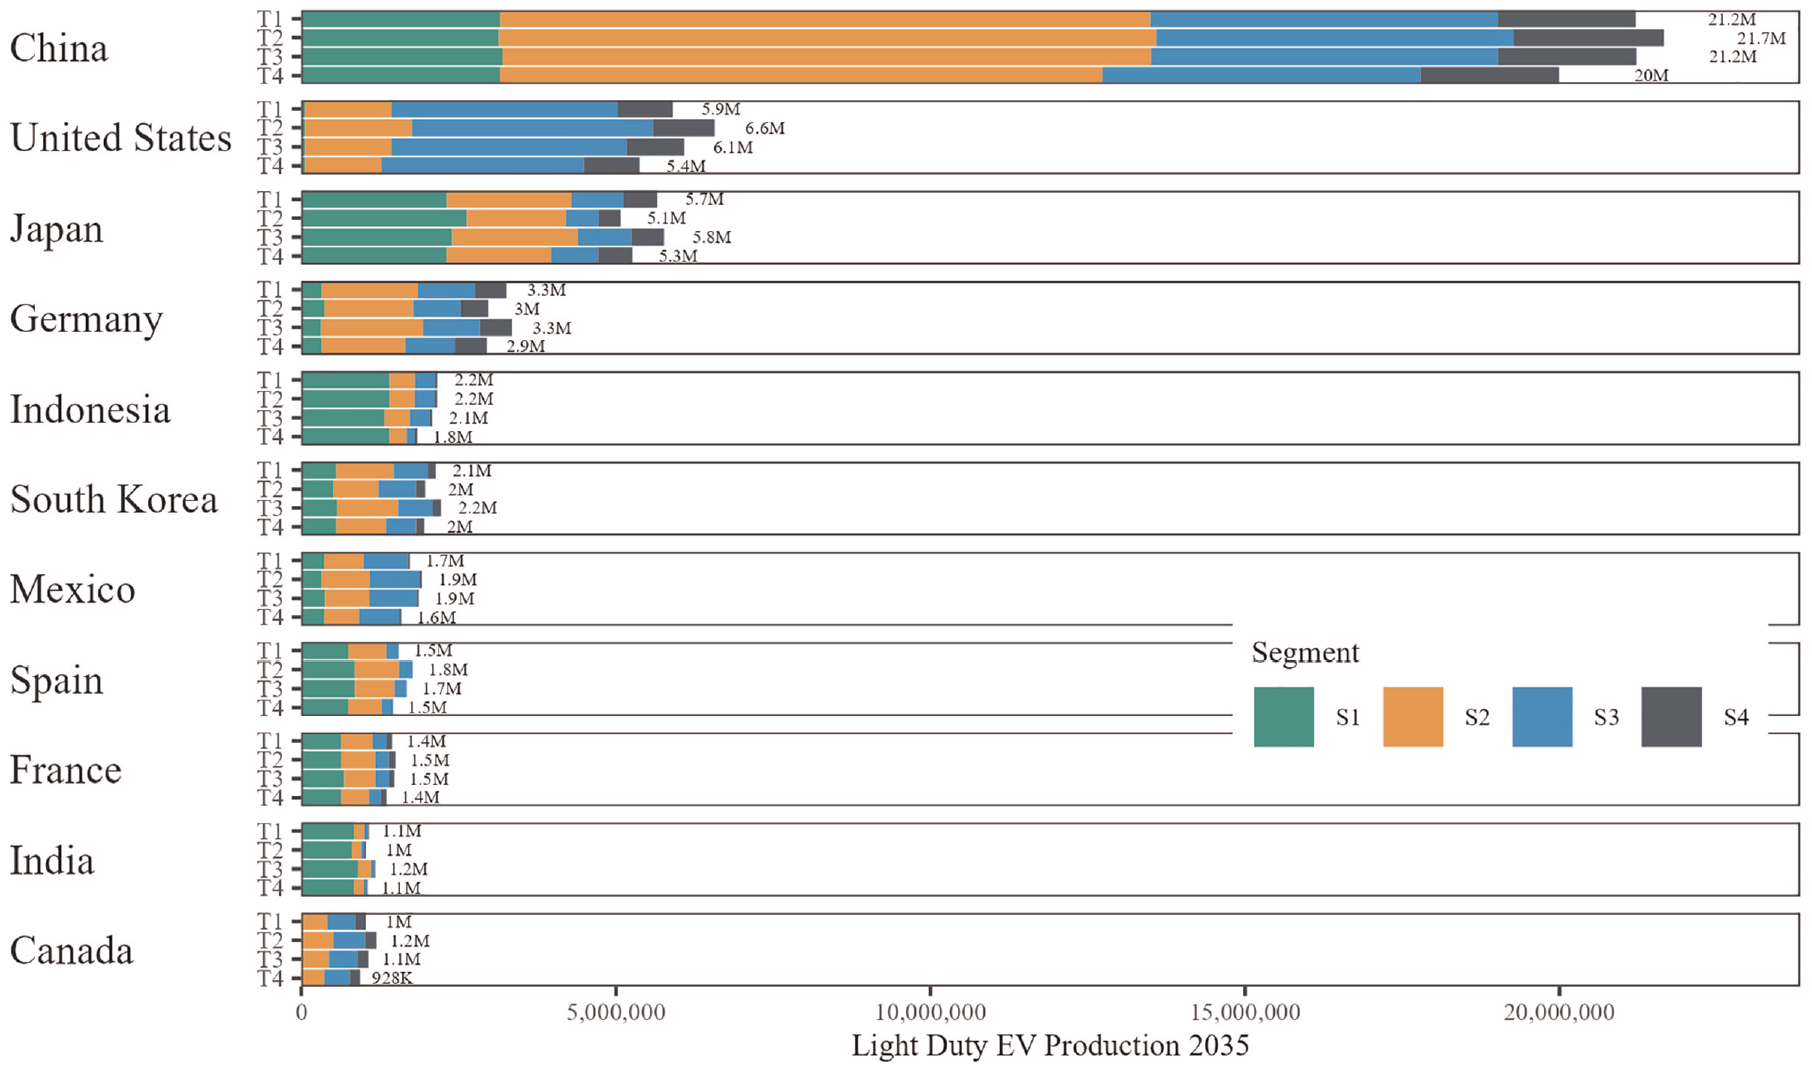
Projected 2035 light-duty electric vehicle (EV) production of the top 11 producing countries by market segment under different trade scenarios: (a) T1: 2017–2019 light-duty vehicle ratios, (b) T2: higher domestic supply and free trade United States–Mexico–Canada agreement and European Union, (c) T3: global free trade, and (d) T4: China (allocating 20% of their production toward exports).
Battery Requirements per Producing Country
With the estimation of future EV trade flows between regions we can estimate total battery requirements per producing country, based on the battery size per segment and country of destination (see Figure 3). Figure 9 shows a comparison of the spatial distribution of battery requirement under two different modeling assumptions. The first is allocating battery requirements to countries where the demand for EVs will take place, as most critical materials studies have done ( 5 , 6 ). The second is using results of MONET to allocate battery requirement toward the producing country. There is a contrast in the difference for major exporting countries, such as Japan, Mexico, Spain, and Canada. For example, taking the forecasted demand for Spain gives the inaccurate battery requirement of 37,000 MWh, while the country will require 81,000 MWh to produce EVs destined for domestic supply and exports. The opposite case can be made for the U.S.; using the demand to estimate battery requirements results in an overestimation, as an important share of vehicles sold in the U.S. are produced elsewhere. The distinction matters less for countries with less vehicle global trade activity, such as China.
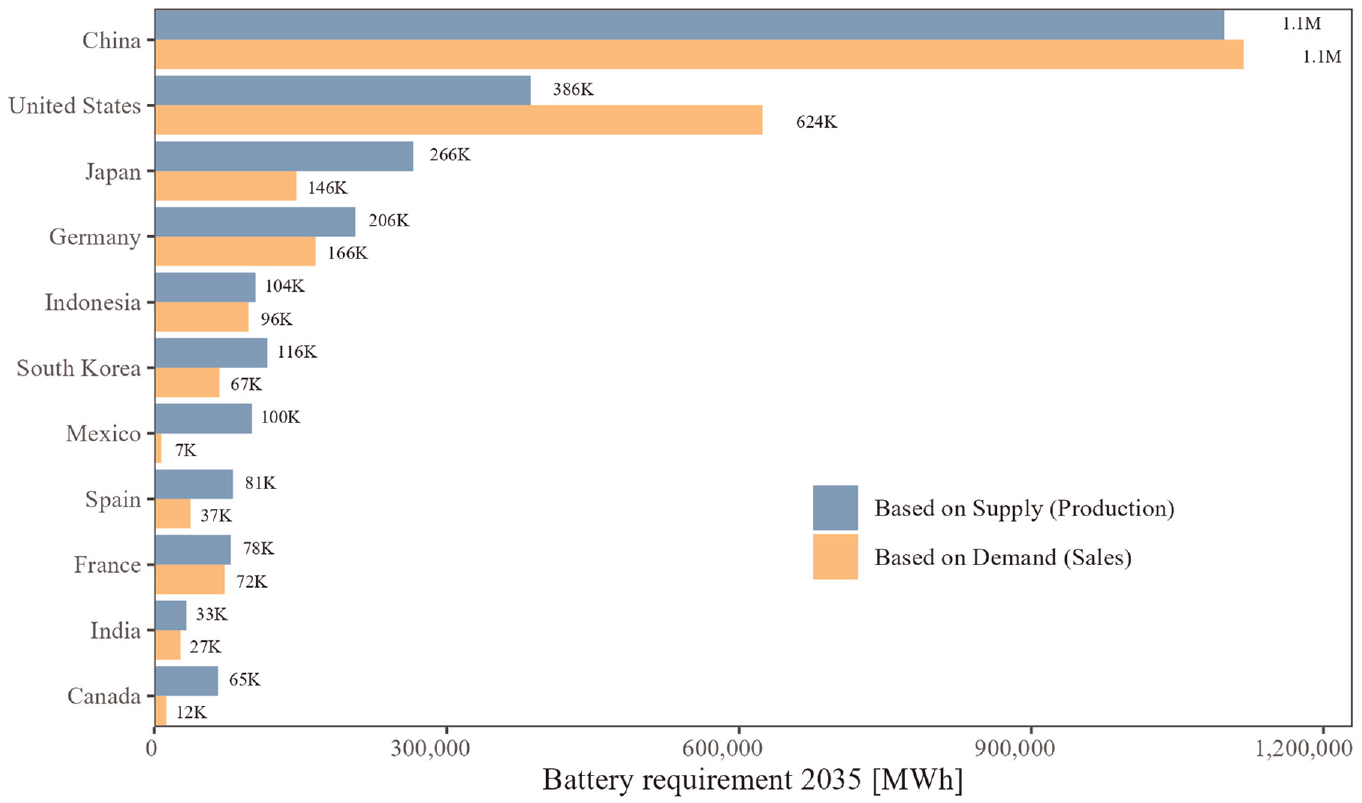
Projected 2035 battery supply requirements for light-duty electric vehicles if considering the location where the car is sold (demand) or where it will be produced (supply), for the top 11 producing countries.
Discussion
The results from MONET indicate a future EV global trade dominated by trade within world regions. The four major regions show distinct trade needs: North America is a big producer that still requires imports to meet their demand, Europe is a big trade region within itself, Japan and South Korea are the big exporters of EVs, and China’s current production goes almost entirely to domestic supply. The above relationship holds for market segments, where North America produces and buys big cars, while Japan and South Korea produce and buy smaller cars. The current trend of preferences toward larger vehicles is being replicated in EVs, and this could play a determinant role in production allocation ( 8 ).
The future global EV trade relationships will be shaped by economic and geopolitical factors, evolving from the current LDV global market. A major assumption in MONET is to start with present LDV trade flows to forecast future EV flows, under the assumption that countries will shift from ICEV to EV production. To complement the analysis, we run several trade scenarios that show contrasting supply chain dynamics and the evolution of different trade relationships. Countries that rely heavily on exporting their EV production are more exposed to exogenous trade shocks. The emergence of the developing world could play a major role in changing trade dynamics, for now Brazil and India are big producers of smaller car segments and in a similar situation to China, producing almost entirely for domestic supply. The development of the industry in these countries could have major implications for exporter countries, such as Japan, Germany, or Mexico, among others. The supremacy of North America in producing large vehicles may be especially challenged by China, which is also an important producer in those segments, or another country interested in the higher margin of profit provided by bigger vehicles. Other trade scenarios based on upcoming policy and geopolitical developments could be modeled using MONET as a baseline.
As shown in Figure 9, battery requirements differ greatly for countries depending on whether we consider the country where the vehicle will be sold or where it will be produced. MONET is a novel attempt to close this research gap between supply and demand of future EVs and battery materials. Battery requirements per country also depend on adequately characterizing market segments, as battery requirements are different by vehicle size (see Figure 3). MONET results of battery requirements are especially important for country and original equipment manufacturers (OEMs) to plan and secure battery and mineral supply in the location of production. Moving toward co-location of battery and final EV assembly has many potential benefits, such as reducing shipping costs, reducing the carbon footprint of shipping parts, sharing of knowledge, and integration of the supply chain. MONET results inform countries to plan for producing batteries near vehicle production.
A future research direction for MONET is to incorporate forecasts of battery size and battery chemistry development to include a mineral requirement module. Our results reveal important differences in battery size among countries and car segments (see Figure 3), which determine battery requirements. Battery size depends on the range and vehicle energy efficiency, which depends mainly on vehicle size and weight, so technological innovations in both areas could reduce battery needs ( 45 ). For lithium-ion battery chemistries, the current dominant technologies for are nickel manganese cobalt (NMC), lithium iron phosphate (LFP), and nickel-cobalt-aluminum oxide, but some potential trends are toward higher-nickel-content batteries, such as NMC 811, or cobalt-free batteries, such as LFP ( 2 ). The technological development of chemistry will play a big role in the total critical mineral requirements, because of heterogeneity in mineral intensities (kg of minerals per kWh). MONET is well suited to incorporate this analysis, as chemistry is also likely to vary by vehicle size and powertrain. Estimations of critical mineral requirement per EV producing country should also show a contrasting picture between demand and supply (see Figure 9), even as total global demand for critical minerals remains the same. Further exploration could be made toward characterizing the remaining supply chain for batteries, which include the processes of mineral extraction, mineral processing, and battery production. Concerning the circularity of critical minerals contained in EVs, most studies indicate that recovery of substantial amounts will not play a major role in the coming 2 decades ( 6 ). In the future, the EV-consuming countries will contain the majority of spent batteries; however, global trade in second-hand vehicles could change this picture ( 46 ). Additional avenues for future work are the analysis of the effect of country-level demand-side policies on global EV production, which may alter the total number of EVs and their share by segment.
Conclusion
The present study shows the importance of accounting for future EV global trade. Demand for EVs in each country does not translate into proportional production, as sales are supplied by multiple countries. In this regard, there is a mismatch between buyers of EVs and producers of EVs, even as the literature has used the country of demand to allocate battery and critical mineral requirements. This mismatch is even more pronounced when considering vehicle market segments and their different battery requirements per vehicle. MONET presents a method to close this research gap, and accurately estimate which countries will likely produce EVs for the global transition. The battery requirement picture changes drastically when considering country of production. The results presented should help to inform policymakers and OEMs in moving toward co-location of battery production and final EV assembly, to avoid additional costs and environmental impacts associated with shipping and to consolidate their supply chain. Information on producing countries could also help to inform environmental impact analysis, as location is a key determinant of damage. The transition to EVs could generate impact burden shifted toward producing countries. Ultimately, MONET shows the importance of characterizing not just the future demand for EVs, but the supply side as well. Additional research directions of MONET are a better characterization of the forecasted EV demand under high and low economy scenarios; the inclusion of additional new trade scenarios that take into account global changes in production, trade agreements and industrial policies; and a more detailed modeling on battery size and critical mineral requirements ( 47 , 48 ).
Footnotes
Author Contributions
The authors confirm contribution to the paper as follows: study conception and design: G. Tal, P. Busch; data collection: P. Busch, F. Pares, M. Chandra; analysis and interpretation of results: P. Busch, G. Tal, F. Pares, M. Chandra; draft manuscript preparation: P. Busch, G. Tal, A. Kendall. All authors reviewed the results and approved the final version of the manuscript.
Declaration of Conflicting Interests
The author(s) declared no potential conflicts of interest with respect to the research, authorship, and/or publication of this article.
Funding
The author(s) disclosed receipt of the following financial support for the research, authorship, and/or publication of this article: The authors acknowledge funding provided in collaboration with the University of California Alianza MX initiative.
Data Accessibility Statement
The public data that support the findings of this study are available on request from the authors. Proprietary data used in this study are already presented at aggregate level in the main body of the paper.
This work represents the views of the authors, not necessarily those of the funding entity.