
Abstract
To address the methodological limitation of cross-sectional studies and the data constraints of longitudinal/panel studies, this paper presents a model-based method to fuse repeated cross-sectional travel survey data based on the theory of rational inattention (RI) in discrete choice modeling. In the proposed framework, older cross-sectional data are used to model the prior probability of choice alternatives, and more recent cross-sectional data are used to capture conditional heterogeneous choices. The fusion method is theoretically more robust and computationally less burdensome than existing data pooling techniques. The method is empirically tested using data from two cycles of a large-sample post-secondary student travel survey in the Greater Toronto and Hamilton Area to investigate the commuting mode choices of post-secondary students. Parameter estimates of the RI-based multinomial logit (MNL) model indicate that the proposed method can generate behaviorally consistent results. Validation of the estimated model using a holdout sample indicates its improved forecasting performance compared with the classical random utility maximizing MNL model. The fusion method can be extended to more than two cycles of repeated cross-sectional data by updating the prior probabilities whenever new cross-sectional data become available. Thus, the study presents a continuous framework for fusing information from multiple time points using repeated cross-sectional datasets to capture preference evolution better and enhance the forecasting robustness of discrete choice models.
The transportation ecosystem is undergoing major transformation owing to internet/smartphone-based shared on-demand services (e.g., ride-sourcing, car sharing, bike sharing), telecommuting and online shopping options, connected and automated vehicle technologies, and natural disruptions like the COVID-19 pandemic. The emerging mobility options and post-pandemic adaptations constantly evolve our travel-related behaviors, significantly affecting future travel demand patterns (1–4). The state-of-the-art travel demand modeling uses data from the most recent time point, even when cross-sectional data are available from multiple time points ( 5 ). This is because the most recently available data context is believed to be the most similar to the context of a future time point. Thus, travel demand forecasts based on the most current data are expected to be more accurate. However, completely ignoring older information is an inefficient use of available data. More importantly, data from a single time point (i.e., a single cross-sectional survey) cannot adequately capture the constant evolution of travel behavior.
Panel data, that is, data obtained by tracking behavior of the same individuals over multiple time points ( 6 ), can be used to account for the changing travel behavior. However, panel data suffer from sample attrition and response bias ( 7 ). One way to address both the methodological limitation of cross-sectional studies and the data constraints of longitudinal/panel studies is to use multiple cross-sectional data collected at different time points in the region of interest. These repeated cross-sectional surveys make similar measurements on samples from an equivalent population at different points in time without ensuring that any respondent is included in more than one round of data collection ( 8 ). Such repeated cross-sections or “pseudo-panels” have been used in the travel demand literature to investigate the temporal transferability of models and to account for changing preferences over time ( 5 , 9–14). Most studies used repeated cross-sectional datasets by pooling them together and estimating meta-models with additional temporal factors in the year-specific constants and scale parameters. However, these temporal factors do not provide adequate behavioral explanation and, in many cases, can mask the effect of other factors not captured by the models.
This study adopts an alternative approach to fuse repeated cross-sectional travel survey data based on rational inattention (RI) theory in discrete choice modeling ( 15 , 16 ). RI relaxes the assumption of perfect knowledge and exhaustive computation of the utility functions of all choice alternatives of traditional random utility maximization (RUM)-based discrete choice models. Instead, it considers that choice makers have a prior probability of choices, and they process any further information at the expense of an information processing cost. Thus, RI-based models consider choice makers as Bayesian agents and require additional information about their prior probability that is difficult to obtain. By applying the RI concept for repeated cross-sectional survey data (i.e., pseudo-panel data), this study proposes a temporal data fusion framework to capture preference evolution and enhance the forecasting robustness of discrete choice models. It also demonstrates the feasibility of RI-based empirical investigations using multiple cycles of cross-sectional revealed preference data. Specifically, it uses data from two cycles of a large-sample, multi-institution post-secondary student travel survey in the Greater Toronto and Hamilton Area (GTHA) to investigate the commuting mode choices of post-secondary students in the area.
The remainder of the paper is organized as follows. The next section reviews previous studies that used repeated cross-sectional datasets for travel behavior analysis. Following this, the formulation of the RI-based fusion method proposed in this study is outlined. The empirical investigation of commuting mode choices of post-secondary students in the GTHA is then presented. The final section summarizes the findings and presents recommendations for future research.
Literature Review
Data from repeated cross-sectional surveys have been used in the transportation literature since Deaton ( 17 ) introduced the concept of pseudo-panels in 1985. A pseudo-panel consists of grouping individuals from cross-sectional surveys into cohorts, the averages of which are then treated as individual observations in an artificial panel. This approach is used without actual panel data to approximate the latter by following virtual persons (created by the aggregation into cohorts) over time. Examples include the analysis of vehicle ownership evolution (18–21), travel demand forecasting (22–24), and so forth. However, obtaining enough artificial observations while avoiding biased estimates of cohort averages poses a challenge in estimating robust models using the artificial pseudo-panel data generated from repeated cross-sectional surveys.
The repeated cross-sectional data have also been applied for disaggregate travel behavior analysis. In this regard, datasets collected in different years are pooled, and a meta-model is estimated with year-specific scale parameters and coefficients of key variables. For example, Sobhani et al. estimated a scaled version of the Multiple Discrete Continuous Extreme Value model to study the evolution of Canadian’s activity participation decision using four waves of data from the General Social Survey ( 25 ). Habib and Weiss ( 26 ) accommodated a parameterized scale function in their logit captivity model to investigate the temporal evolution of commuting mode choice preference using data from three cycles of the Transportation Tomorrow Survey (TTS) ( 27 ). Similarly, Anowar et al. proposed the scaled generalized ordered logit model to study the evolution of vehicle ownership in Montreal, Canada using cross-sectional origin–destination survey datasets from 1998, 2003, and 2008 ( 9 ).
Recently, Dias et al. used two cycles of repeated cross-sectional data to analyze the evolution of ride-hailing adoption and usage in the Puget Sound region ( 28 ). They estimated a joint binary probit–ordered probit model on the pooled data to account for sample-selection differences between the two surveys. On the other hand, Borysov and Rich proposed a method to study travel behavior dynamics by constructing detailed synthetic pseudo-panels from repeated cross-sectional data ( 29 ). The method is based on modeling a high-dimensional joint distribution of travel preferences conditional on detailed socioeconomic profiles by using a conditional variational autoencoder.
Some studies in the literature have used repeated cross-sectional data to test the temporal transferability of travel demand models. By pooling available data and estimating meta-models with year-specific coefficients and scale parameters, these studies have demonstrated the capability of repeated cross-sectional data to account for changing travel preferences and enhance forecasting robustness. For example, Habib et al. used three waves of the TTS to estimate year-specific and pooled models with additional temporal factors in commuting mode choice ( 13 ). The authors found that the pooled model outperforms year-specific models in model transferability. Sanko also reached a similar conclusion while analyzing the temporal transferability of the alternative-specific constants and the level-of-service (LOS) and socioeconomic parameters ( 5 , 10 ). Similarly, Salem and Habib demonstrated the applicability of the repeated cross-sectional data for investigating the temporal transferability of activity generation and scheduling models ( 11 , 12 ).
However, these studies expressed the temporal factors and/or year-specific scales as a function of time ( 11 , 12 ) or macro-economic variables like gross domestic product ( 10 ). Such parameterization may not provide adequate behavioral explanation and can mask the effect of other factors not captured by the models. Moreover, estimating the pooled data model becomes increasingly expensive in relation to computational requirements as newer cycles of data become available. Deciding how many data cycles to pool is also a critical decision that might affect the model’s forecasting performance. To overcome these issues, this study proposes a fusion framework for repeated cross-sectional travel survey data that is based on RI theory in discrete choice modeling. The following section presents the detailed formulation of the fusion method, including the motivation for choosing the RI concept.
Methodology
RI has been discussed in general choice-making since the 1950s (30–32). However, its application in discrete choice modeling is quite recent. Matějka and McKay first proposed the RI-based discrete choice model by measuring the cost of information processing and optimizing the random utility of choice-making ( 15 ). The proposed model takes the classical multinomial logit (MNL) formulation when information cost is modeled using the Shannon entropy ( 33 ), as shown below.
Suppose a choice maker faces a discrete choice context of

For convenience, we can consider that the

Given
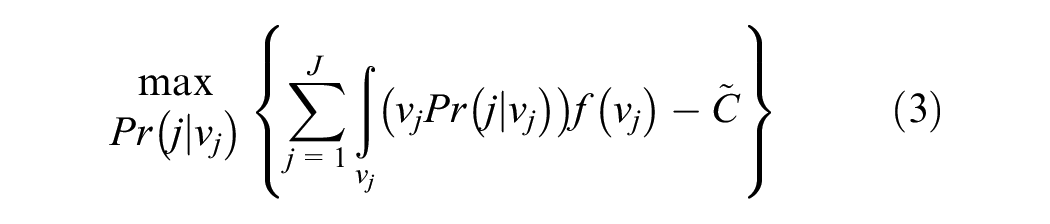
Subject to constraints of non-negativity of probability:
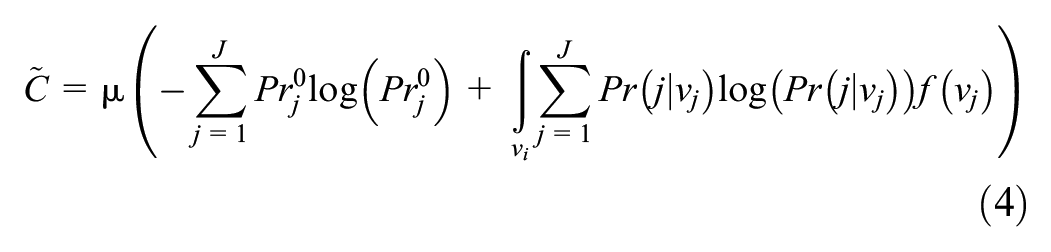
Here,
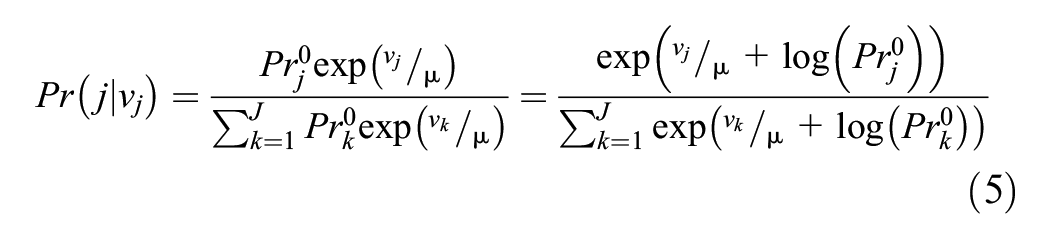
This is equivalent in formulation to the MNL model where the systematic utility of a choice alternative is offset by the prior probability of choosing that alternative. The key challenge to estimating (5) is the specification of the prior probability function,
In this study, we propose to measure the prior probability using the individual-specific perceived market share of alternatives from an older dataset of the same population (i.e., an older repeated cross-sectional survey data). Thus, we propose to utilize the concept of pseudo-panels in the context of RI. In this case, as the same individual is not observed between the datasets,
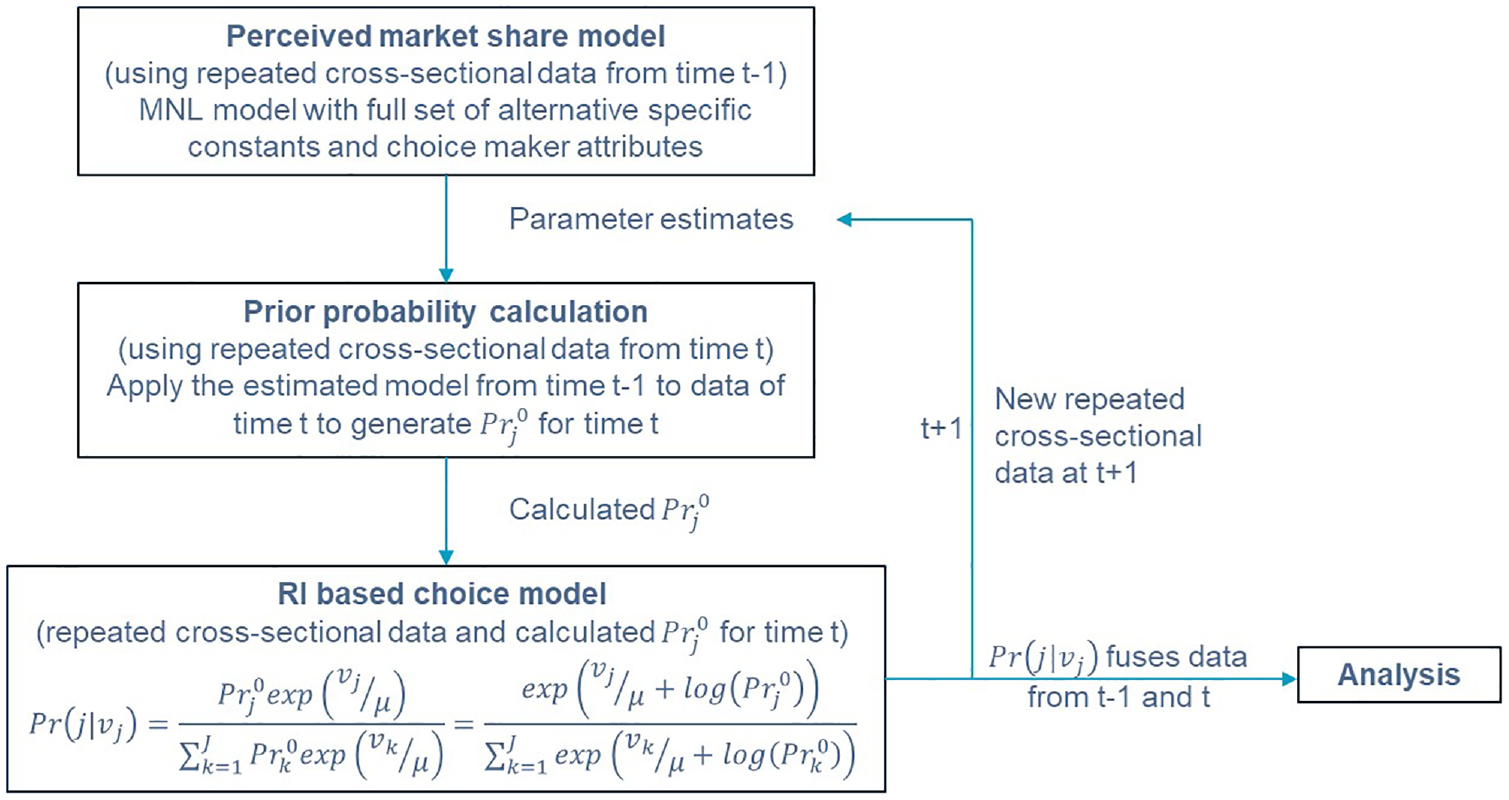
Proposed RI-based temporal fusion method.
The proposed RI-based fusion method can be easily extended to more than two cycles of repeated cross-sectional data. An interesting feature of the framework is that only the estimated model from each time period can be carried over to the next period like a Markov process. So, the current state is dependent only on the immediately prior state, and there is no need to estimate computationally expensive pooled data models.
Empirical Analysis
Data Description and Study Area
Data for the empirical investigation of this paper come from the two cycles of a large-scale post-secondary student travel survey conducted in the GTHA. The survey is named StudentMoveTO (SMTO) ( 40 ). The two datasets were collected at an interval of 4 years (Fall 2015 and Fall 2019). Four universities participated in both survey cycles, representing nearly 184,000 post-secondary students across seven campuses. All of these campuses are situated in Toronto; however, the students’ home locations are spread across the entire study area. The surveys collected information on individual and household socio-demographics, mobility tool ownership, a one-day travel diary, and typical commute characteristics. As the objective of the empirical exercise is to investigate post-secondary students’ commuting mode choice decisions, we took only respondents who reported complete information about socio-demography, mobility tool ownership, and travel diary. Table 1 compares the two samples used in this study.
Descriptive Statistics of the 2015 and 2019 StudentMoveTO Samples
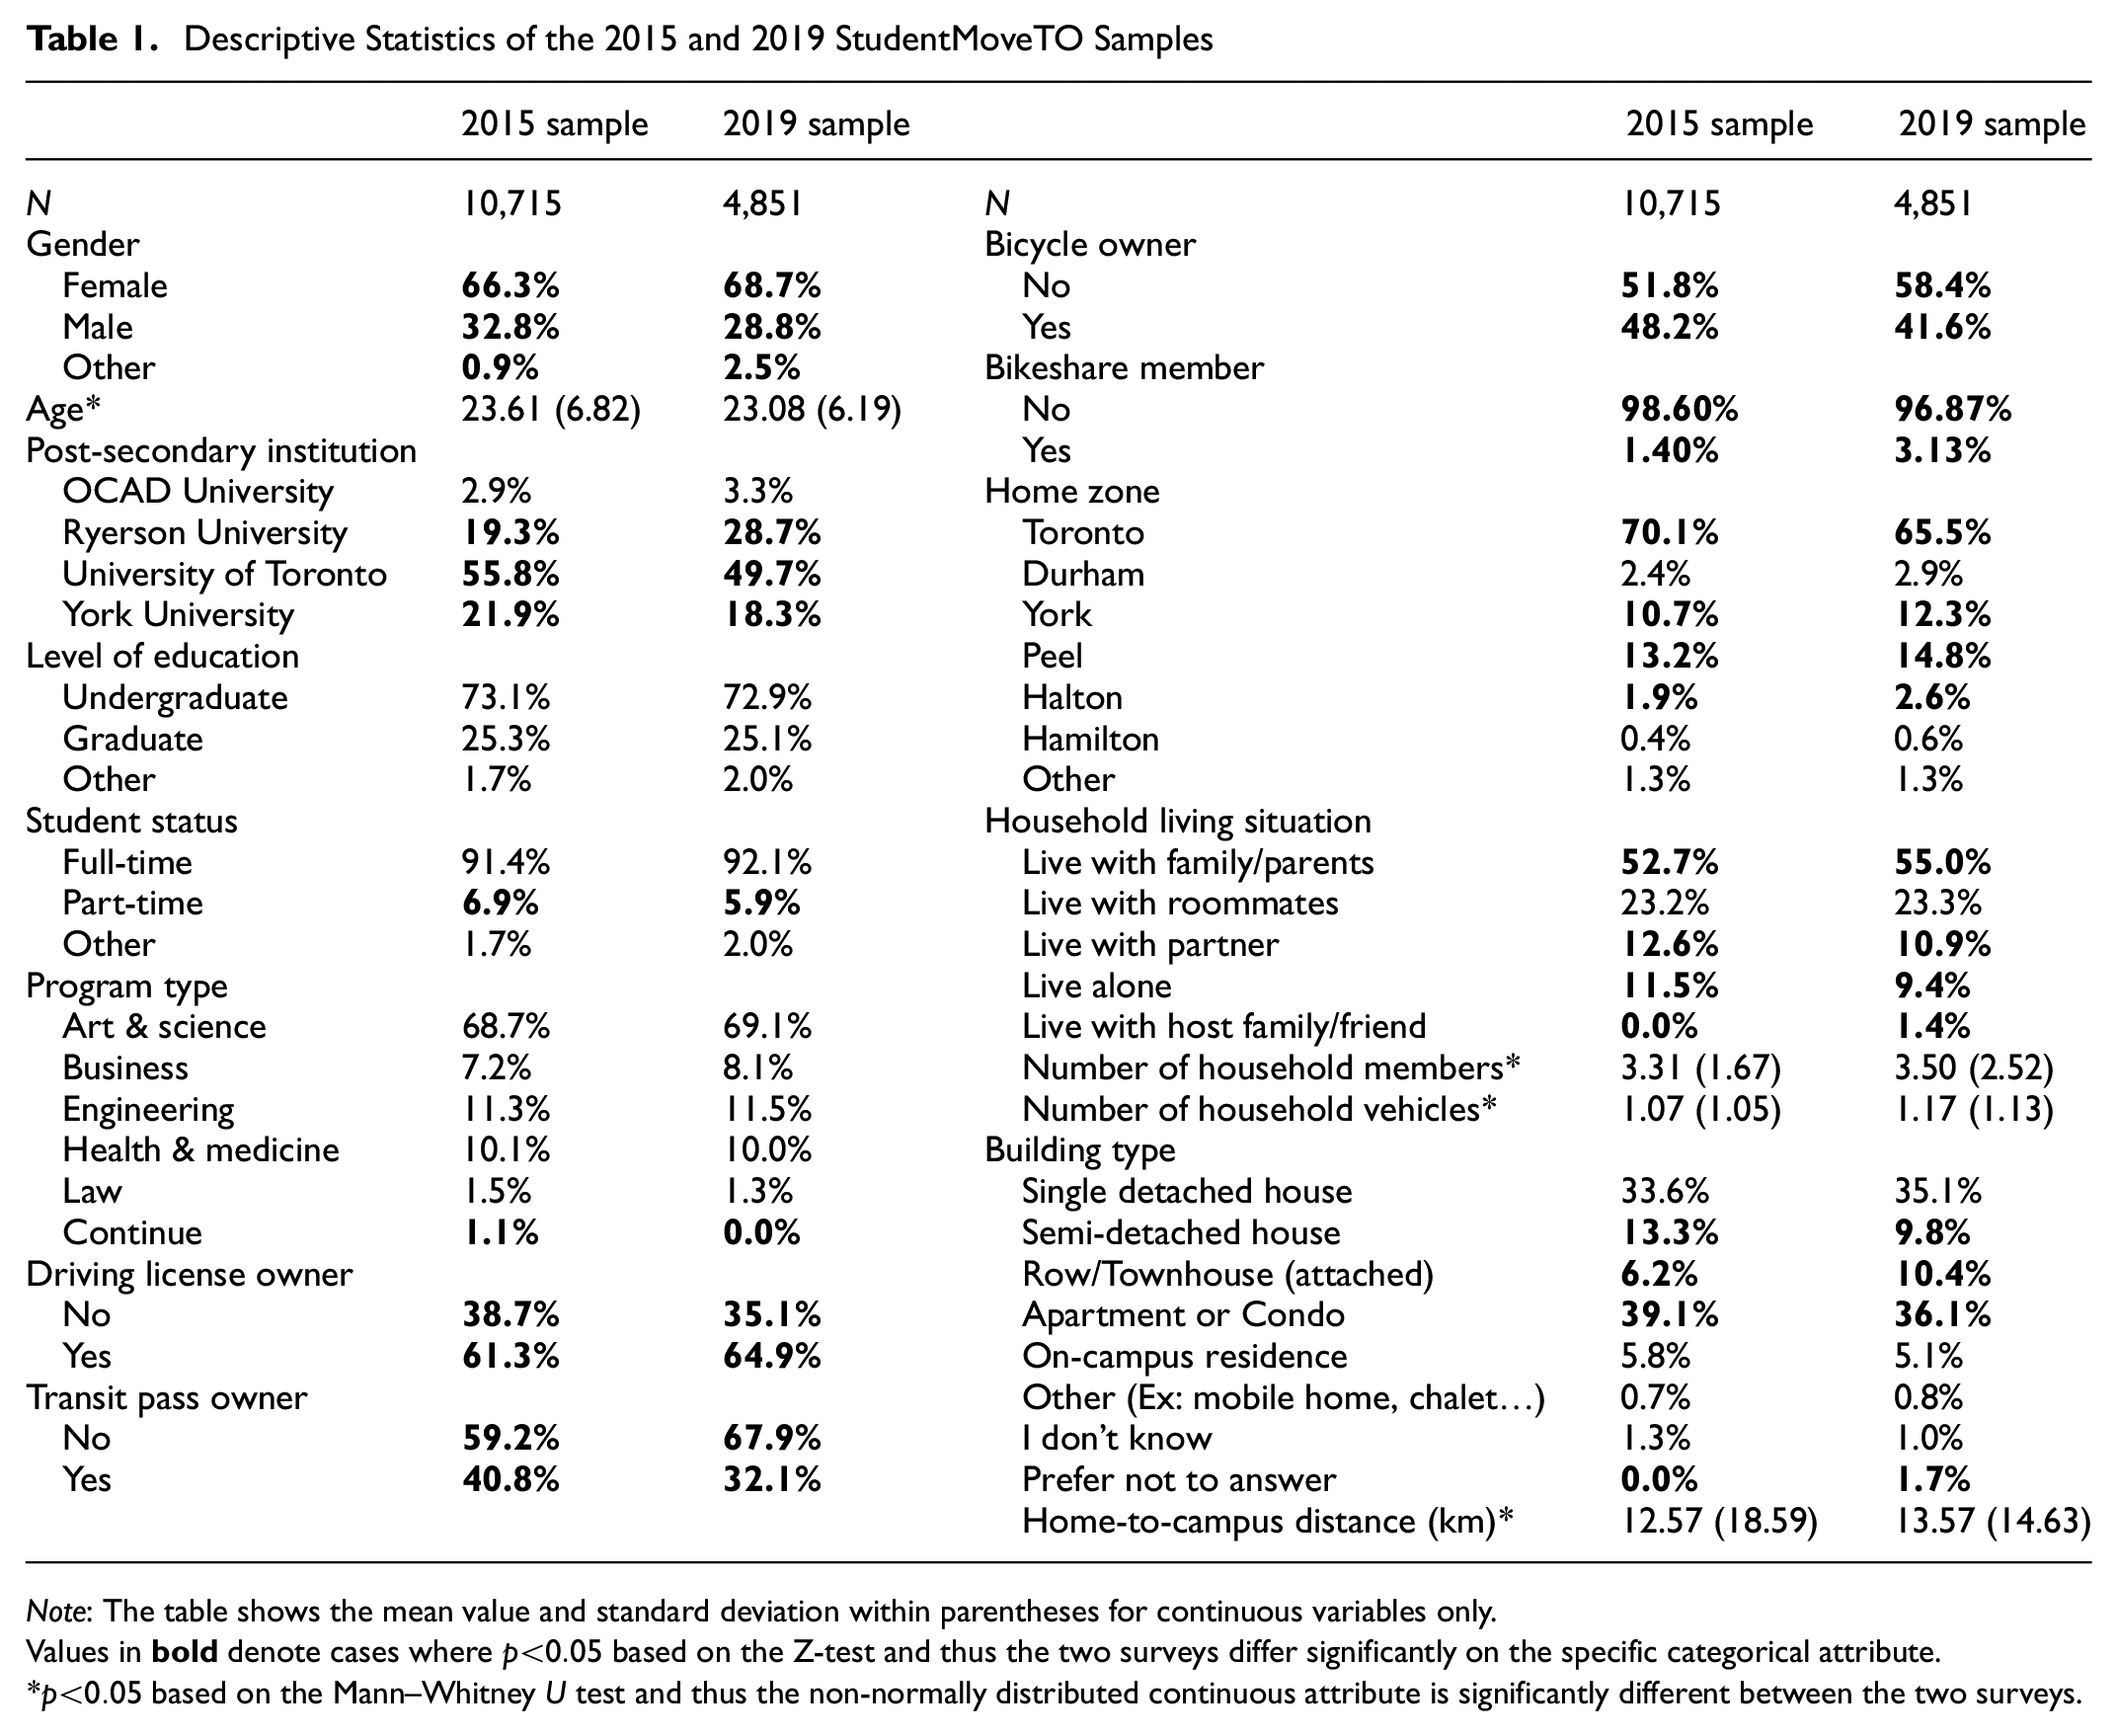
Note: The table shows the mean value and standard deviation within parentheses for continuous variables only.
Values in
During the 4-year time lag between the two survey waves, the most important transportation infrastructure change in the study area was the extension of a subway line where six new stations were added to the network. Thus, in general, the students of the two waves were making mode choices based on similar characteristics of the travel alternatives available to them. However, the cost of living in Toronto increased significantly within these 4 years, thereby forcing the students to live further away from their campuses, which in turn affected their travel mode choices.
In general, the samples appear to be similar in relation to individual and household socio-demographics. The average age of the two datasets is about 23 years. Both the samples are skewed toward female respondents, a common issue in the post-secondary student travel data collection process ( 41 ). Some 73% of the respondents in the datasets are undergraduate students, and about 91% are full-time students. The distribution of program types in the datasets is also quite similar (69% Arts & Science students, 11% Engineering students, 10% Health & Medicine students, and about 7% Business students). In relation to household attributes, more than 50% of the students live with family, whereas 23% live with roommates. About 5% of the students live in on-campus residences. The average household size in both the samples is above three, and the average number of the household vehicle is about one. However, using appropriate statistical tests (the Z-test and the Mann–Whitney U test), it is found that the two surveys differ significantly on specific attributes like gender, home zone, household size, number of household vehicles, home-to-campus distance, and so forth. This is expected given that the two surveys were conducted on different cohorts of students at different time periods.
From Table 1, the students are found to live further from campus in 2019 compared with 2015. In relation to mobility tools, more students have driver’s licenses and bikeshare memberships, whereas fewer students own transit passes and bikes in 2019 compared with 2015. Interestingly, the proportion of transit pass holders decreased significantly in the second wave, although the proportion of students using “Transit with walk access” increased (see Figure 3 below). This may be linked to students living further from campus in 2019 and therefore they might be choosing classes in such a way that their schedule is consolidated to a few days per week. This might require them to commute less frequently. As such, paying for monthly transit pass might be more expensive than paying for individual trip and therefore fewer students are buying it in 2019 compared with 2015.
The travel diary components of the two surveys collected information about all trips made by the respondent on the survey day, including trip start time, travel mode, trip origin and destination locations, and trip purpose. The diary data indicate that more than one-third of all student trips are for commuting purposes (i.e., home-to-campus trips) (Figure 2). This highlights the importance of better understanding the factors that affect their commute mode choice decisions. Among the other destination types, more work trips and fewer shopping/errand & leisure/entertainment trips were observed in 2019.
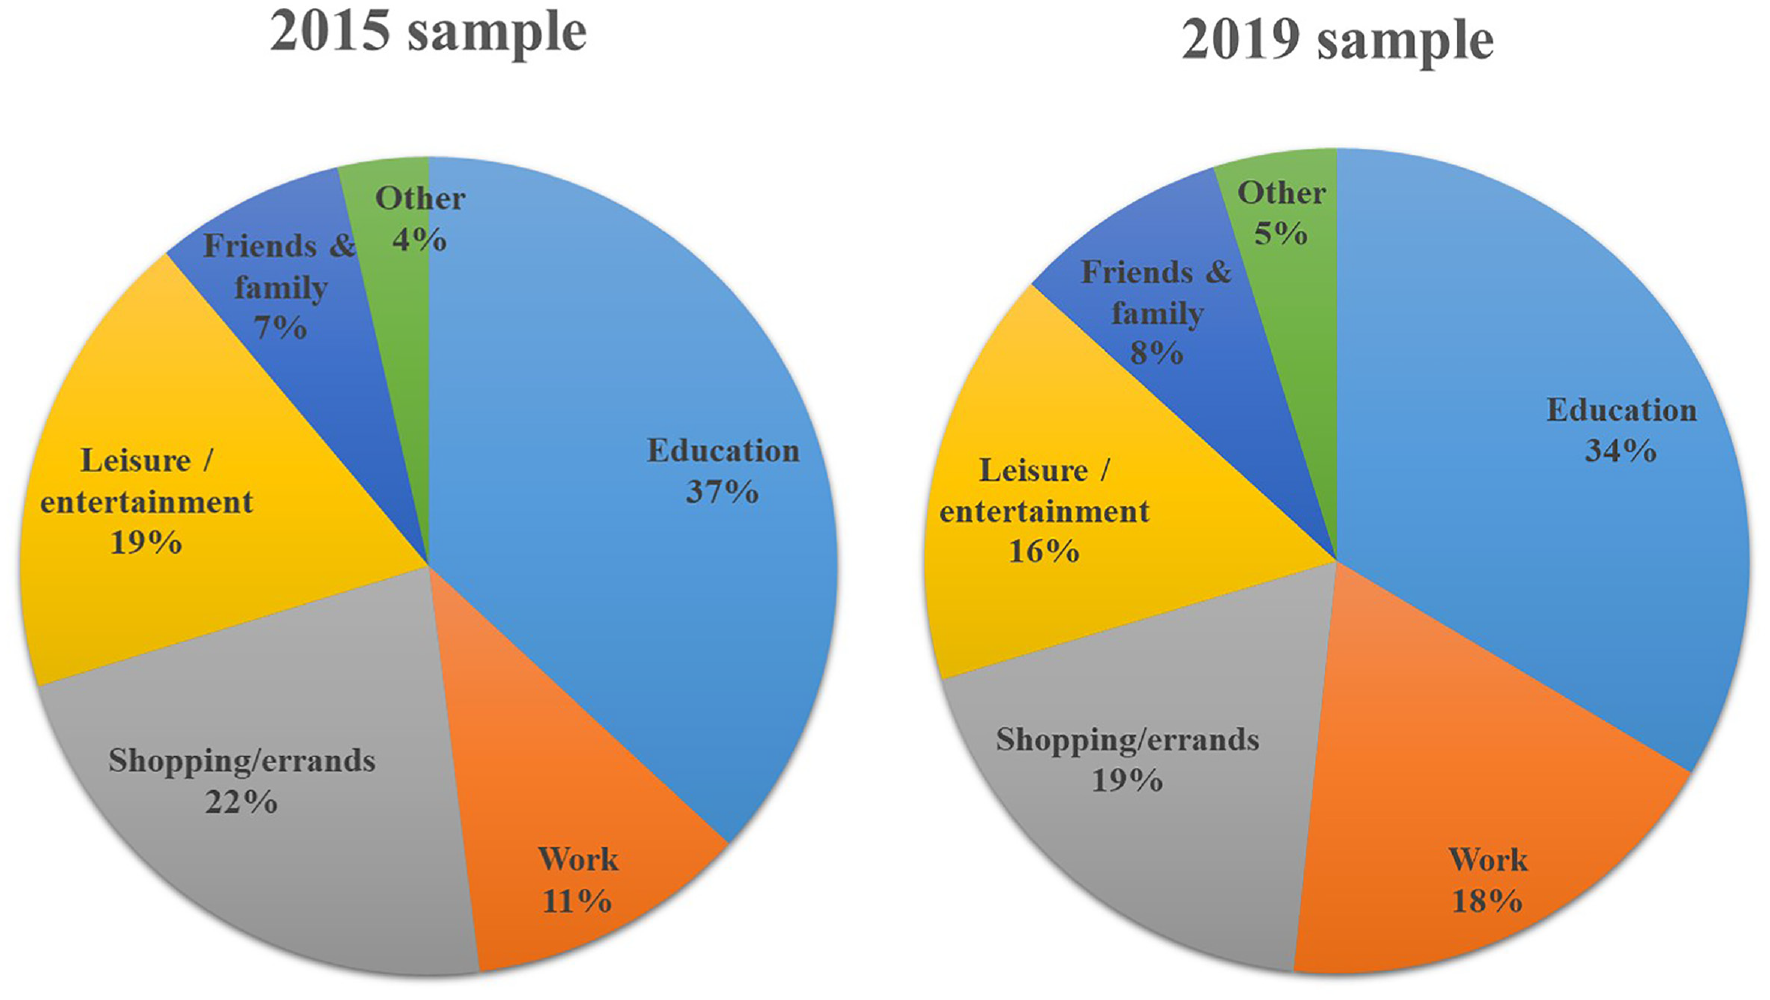
Distribution of trip purposes observed in the two samples.
The SMTO does not collect user-defined LOS (travel time and travel cost) information of the trips. These are imputed using a calibrated deterministic user equilibrium traffic assignment model called the GTA model. The GTA model is calibrated using the 2016 TTS data. TTS is a large-scale (5% sample) household travel survey conducted in the GTHA ( 27 ). The assignment model consistently produces expected travel time and cost by auto and transit for any given pair of traffic analysis zones in the study area. It should be noted that the GTA model, like most other large-scale transport models, is susceptible to endogeneity ( 42 ). However, addressing this limitation is outside the scope of this paper.
The choice set for each individual was determined using feasibility constraints: one must have a driver’s license and a car to use the car drive mode; total transit travel time over 150 min is considered to be infeasible for commuting; a distance over 3 km is considered to be infeasible for walking, and a distance over 10 km is considered to be infeasible for using bicycle. The feasibility constraints for transit, walk, and bicycle are based on the sample data. After removing the observations with infeasible mode choices, missing personal and household socioeconomic information, and missing LOS attributes, final datasets of 6,941 and 2,497 commuting trips from the same number of commuters are obtained for 2015 and 2019, respectively (i.e., the trips in the final datasets are made by different individuals, so there is no scope for potential biases in the data).
In the datasets, seven major commute modes are observed: car drive, car passenger, transit with walk access, park and ride, kiss and ride, walk, and cycle. The distributions of the modes are shown in Figure 3. Students are highly reliant on transit, with almost half of the respondents using transit for their commute trips (45% in 2015 and 53% in 2019). A gradual shift from active to motorized modes (especially transit) is observed between the samples. This can be partly associated with students living further from campus in 2019. A similar shift is also observed for the non-commuting trips, indicating a transition in travel mode preference among students, which necessitates an in-depth mode choice investigation. To accurately capture the evolution of commute mode choice behavior over the years, this study fuses the two samples using the proposed RI-based temporal fusion method. Specifically, the 2015 data are used to estimate the “perceived market share model” to calculate the prior probabilities for the 2019 data. About 80% of the 2019 sample is used to estimate the proposed RI-based MNL model of commute mode choices, and the remaining 20% is used as a holdout sample for model performance validation.
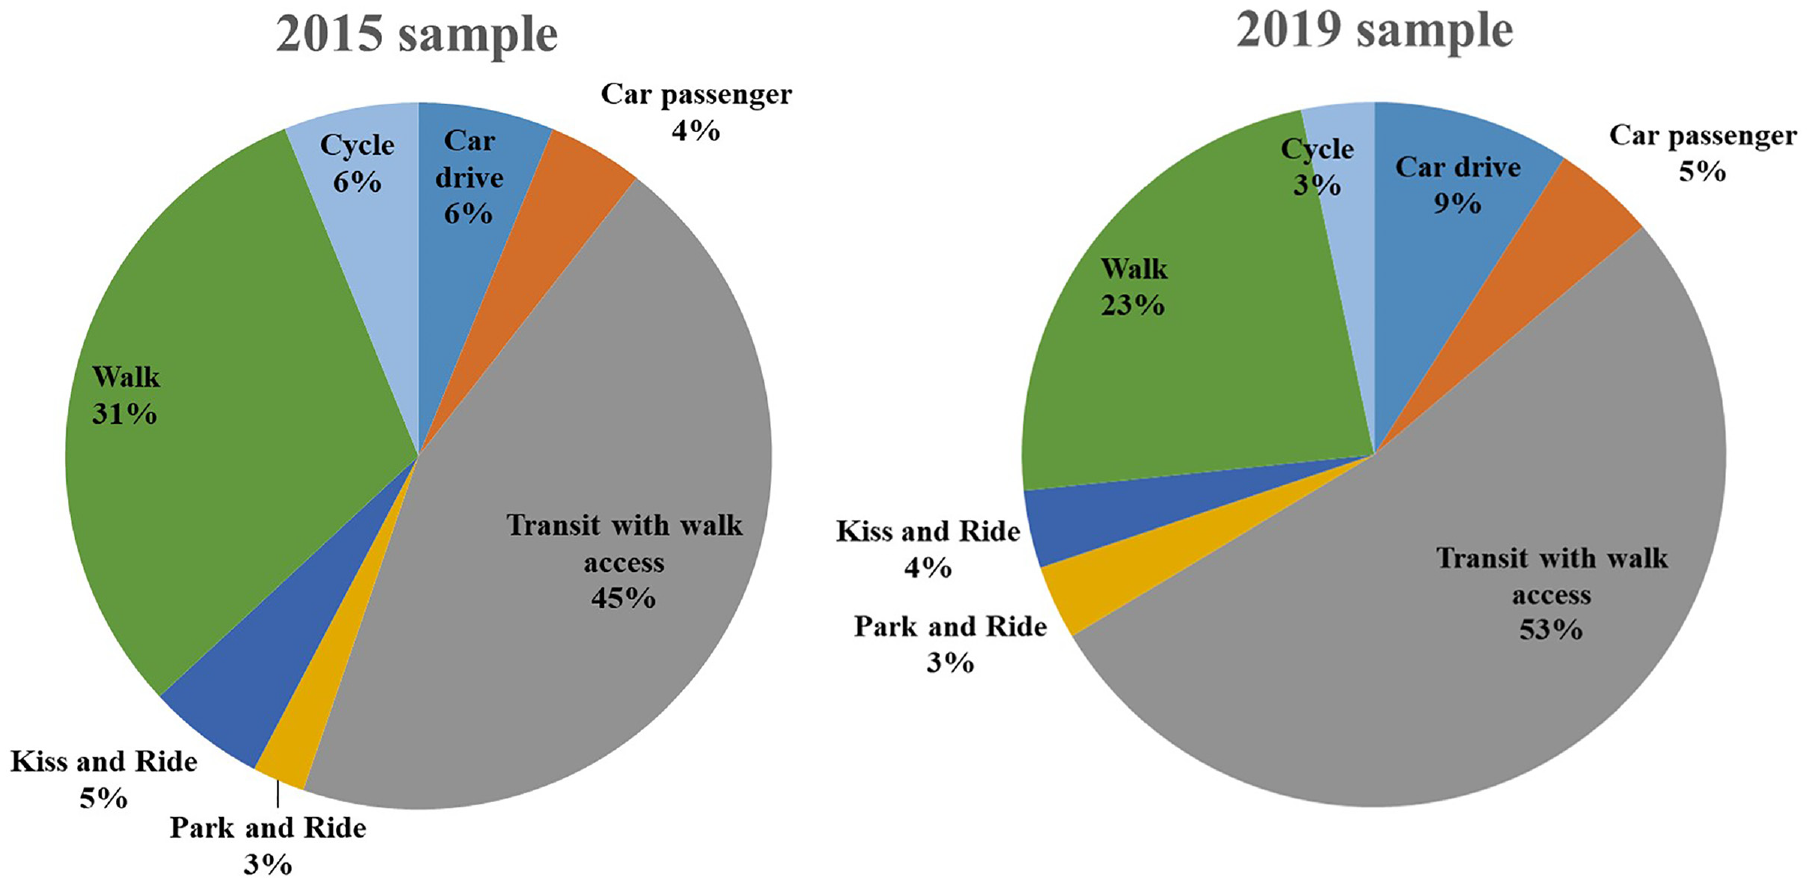
Distribution of commute modes observed in the two samples.
Results
Table 2 presents the final RI-MNL model. To reach the final model, we first estimated the “perceived market share model” or “prior probability sub-model” (which is a classical MNL model containing alternative-specific constants and choice-maker attributes) using the 2015 data. Then, we applied the estimated model to the 2019 estimation data to calculate prior probabilities for the 2019 respondents. Finally, the full RI-MNL model was estimated using the 2019 estimation sample along with the calculated prior probabilities. The model specification was derived by accommodating variables with proper signs and statistical significance. The critical value of the t-stat with a 95% confidence limit was used as the threshold for considering variables in the model. However, a few parameters with lower t-stat values are retained in the model because the corresponding variables provide considerable insight into the behavioral process.
Empirical Models
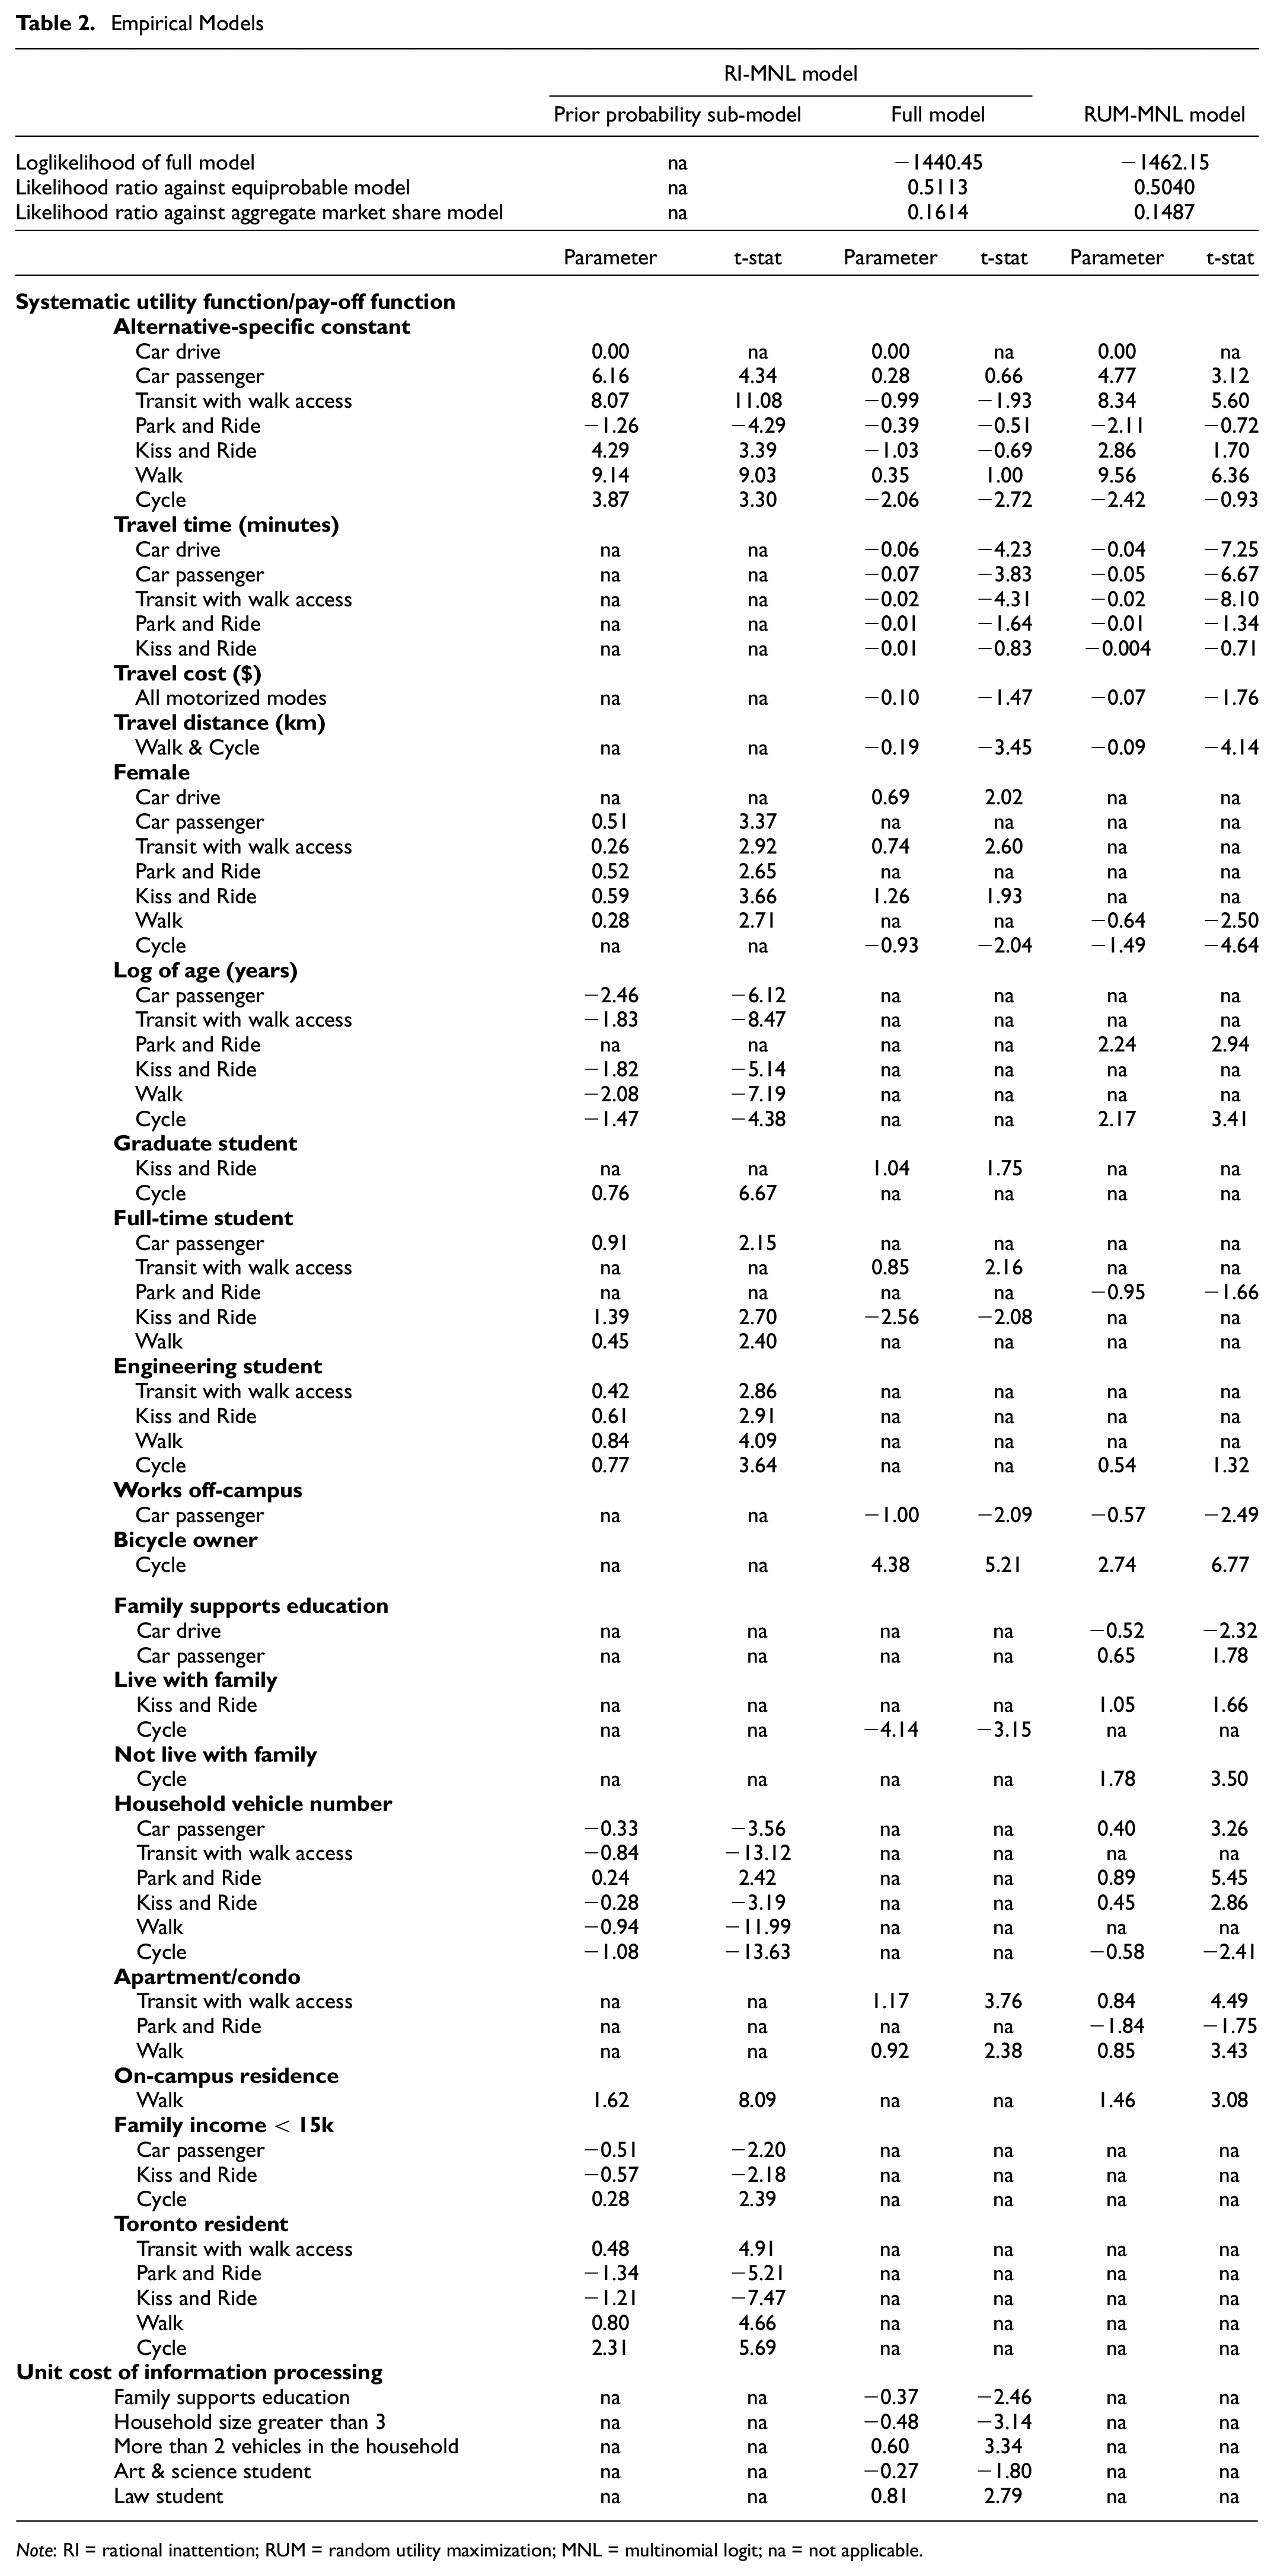
Note: RI = rational inattention; RUM = random utility maximization; MNL = multinomial logit; na = not applicable.
The estimates of the prior probability sub-model meet expectations and are in line with other studies in the literature. For example, female students are more likely to share rides, use transit, or walk to campus than driving or cycling. The negative association of females with driving and cycling has been well documented in previous studies ( 41 , 43 , 44 ). Based on the model estimates, older students are more likely to choose “car drive” and “park and ride” for commuting, whereas full-time students are more likely to choose “car passenger,”“kiss and ride,” and “walk”. The number of household vehicles is positively associated with driving modes and negatively associated with non-driving modes. Students who live on campus are more likely to walk to class. Students from lower-income households are less likely to share ride and more likely to cycle to campus. Students who live in the City of Toronto are more likely to choose transit, walk, or cycling for commuting, which makes sense given the city’s high transit accessibility and well-connected cycling network.
The estimates of the full RI-MNL model show that LOS attributes (travel time, travel cost, and trip length) have negative signs that match expectations. In relation to socio-demographic attributes, students who work off-campus are less likely to share rides, perhaps because they have more out-of-campus commitments and cannot synchronize their schedules with others for ridesharing. Students who live in apartments or condominiums are more likely to use transit or walk. This makes sense because apartments and condominiums are usually constructed in areas well served by transit.
A key feature of the RI model is that it allows us to capture the unit cost of information processing, which, formulation-wise, is equivalent to the scale parameter of the classical model. In this study, we specified the information processing cost as an exponential of a linear-in-parameter function to ensure positivity. Thus, a variable with a positive parameter in the function has a higher unit cost of information processing. This tends to make the choice maker less calculative in decision-making and vice versa. The model confirms that information processing costs are lower for students whose families financially support their education. It indicates that these students are more attentive to the performances of the choice alternatives than students who do not receive financial support from their families. Students whose household has more than three members spend more attention on the performances of choice alternatives than students belonging to smaller households. Commuters with more than two household vehicles tend to be less attentive to the performances of alternative modes as they are more likely to choose private car-based modes. Arts and Science students spend more attention whereas law students spend less attention on the performances of the commuting mode choice alternatives.
To assess the performance of the RI-MNL model estimated using data from two survey cycles, we compare it with a classical RUM-based MNL model estimated using the 2019 estimation sample only. It should be noted that the purpose of this RUM-MNL model is to serve as a baseline for assessing the benefit of using data from two survey cycles (via the RI-based MNL model) in comparison to using data from one cycle only. As such, it is estimated by using data from 2019 only and not by pooling data from the two survey cycles. The parameters of the base model are shown in Table 2. Overall, the estimates align with that of the RI-MNL model. However, some socio-demographic variables, like respondent age, are significant in the prior probability model but not in the full fused data model. This indicates that for post-secondary students, age tends to affect only the prior probability of choosing an alternative (like an underlying generational factor); however, the cost of additional information processing for choice-making is affected by other more direct factors like mobility tool ownership, living situation, work status, and so forth.
Interestingly, the fused data model fit the 2019 estimation data slightly better than the classical MNL model. This implies that introducing pseudo-panel-based prior probabilities in the RI-MNL model improves its explanatory power. Subjective values of travel time savings (SVTTS) are also estimated to have better intuitive evaluation of the models. SVTTS is defined as the ratio of travel time to travel cost coefficients. It captures the time–money trade-offs in mode choices. Table 3 presents the SVTTS estimates of the RI-MNL and RUM-MNL models presented in Table 2.
Subjective Value of Travel Time Savings (SVTTS) Estimates
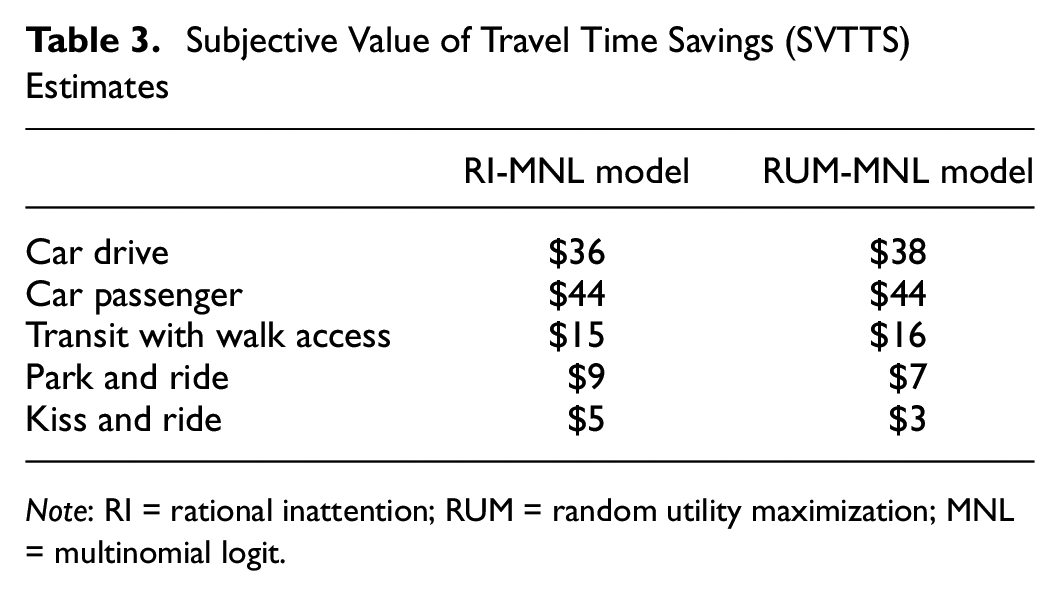
Note: RI = rational inattention; RUM = random utility maximization; MNL = multinomial logit.
Alternative-specific travel time coefficients and generic travel cost coefficients are considered for the motorized modes to capture the difference in their SVTTS estimates. Although it is impossible to have any ground truth about the values of SVTTS, it is found that the classical RUM-MNL model over-estimated the SVTTS for the larger market share alternatives like “Car drive” and “Transit with walk access” whereas the RI-MNL model over-estimated the SVTTS for the smaller market share alternatives like “Park and Ride” and “Kiss and Ride”. More in-depth analysis is required to correctly understand the underlying cause of such variation in mode specific SVTTS estimates between the two models. Overall, the results provide evidence that our proposed method provides an appropriate framework to fuse repeated cross-sectional datasets based on the theory of RI in discrete choice modeling.
Validation
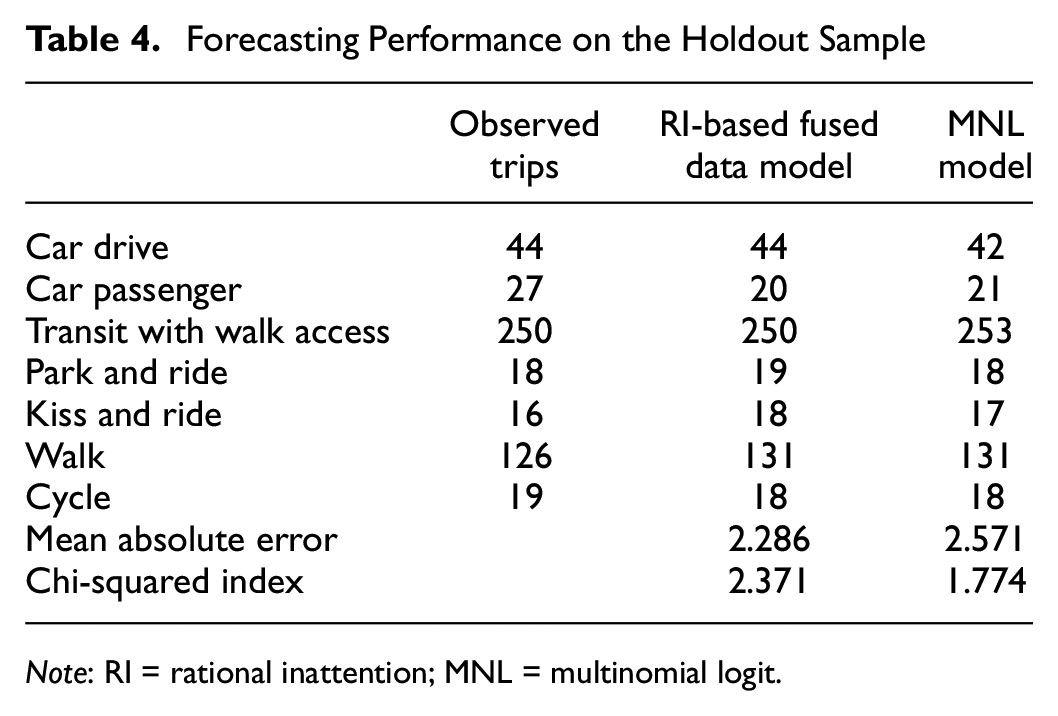
In this section, we compare the forecasting performance of the RI-based model (estimated using data from two survey cycles) with that of the classical RUM-based model. For this validation exercise, we use the holdout sample of the 2019 data, which comprise 500 commuting trips. We apply both models to this dataset and compare the predictions using multiple metrics as shown below.
First, we estimate the first preference recovery (FPR) ( 8 ) for both the models. FPR, also referred to as “percentage of correct predictions,” is an aggregate measure that shows the proportion of individuals effectively choosing the alternative (travel mode) with the highest modeled utility. The measure is given by Equation 6:

Here,
Forecasting Performance on the Holdout Sample
Note: RI = rational inattention; MNL = multinomial logit.
Table 4 presents the observed mode choices and predictions for each model, mean absolute error, and Chi-Squared values (summation of the squared difference between observed and predicted modal shares normalized by corresponding observed share). At a 5% significance level, the critical chi-squared value for 6 degrees of freedom is 12.59. The results show that both models perform quite well in immediate short-term prediction. However, the fused data model’s slightly lower mean absolute error hints toward its improved forecasting performance.
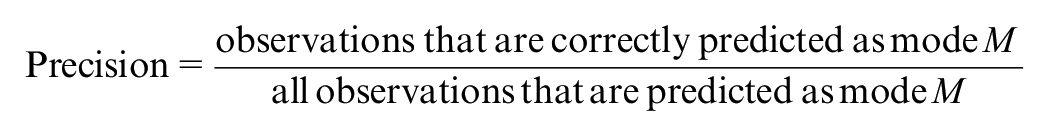
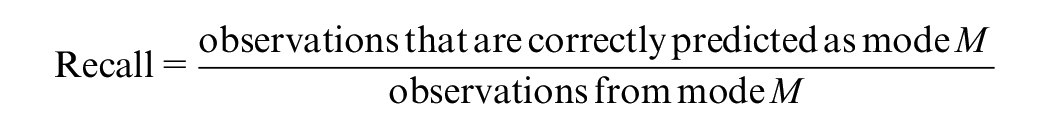
To better understand the forecasting performance, we present the validation results of each model in the form of a confusion matrix, which includes the observed and predicted number of trips for each mode, as well as recall and precision accuracies. The equations used to calculate precision and recall are presented below:
Tables 5 and 6 present the confusion matrices for the RI-based fused data model and the classical MNL model, respectively. For both the models, the recall accuracies for transit and walk are found to be the highest, which is probably because of the significantly larger number of transit and walk trips in the estimation data. The two models are also evaluated based on their corresponding F-score, which is an accuracy measurement defined as the harmonic mean of recall and precision. Higher F-score represents higher prediction accuracy. The F-score is computed for each travel mode in the two models. Table 7 illustrates the comparison of F-scores across modes and models.
Confusion Matrix of Rational Inattention (RI)-based Fused Data Model
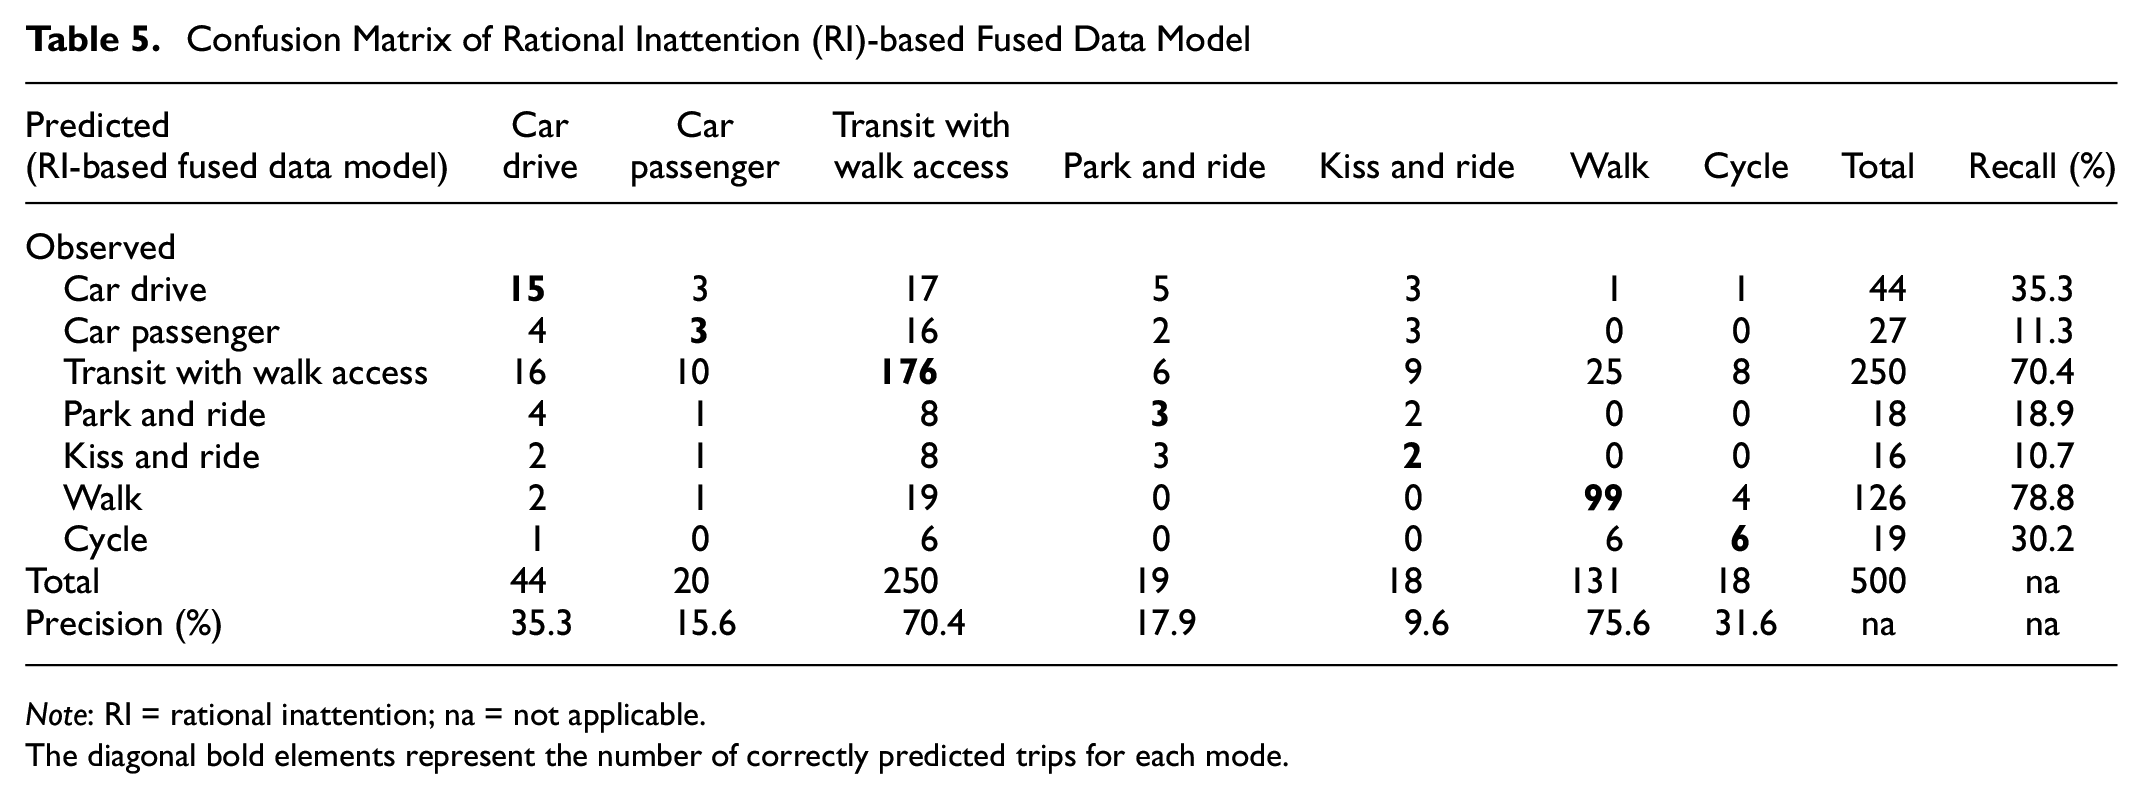
Note: RI = rational inattention; na = not applicable.
The diagonal bold elements represent the number of correctly predicted trips for each mode.
Confusion Matrix of Classical Multinomial Logit (MNL) Model
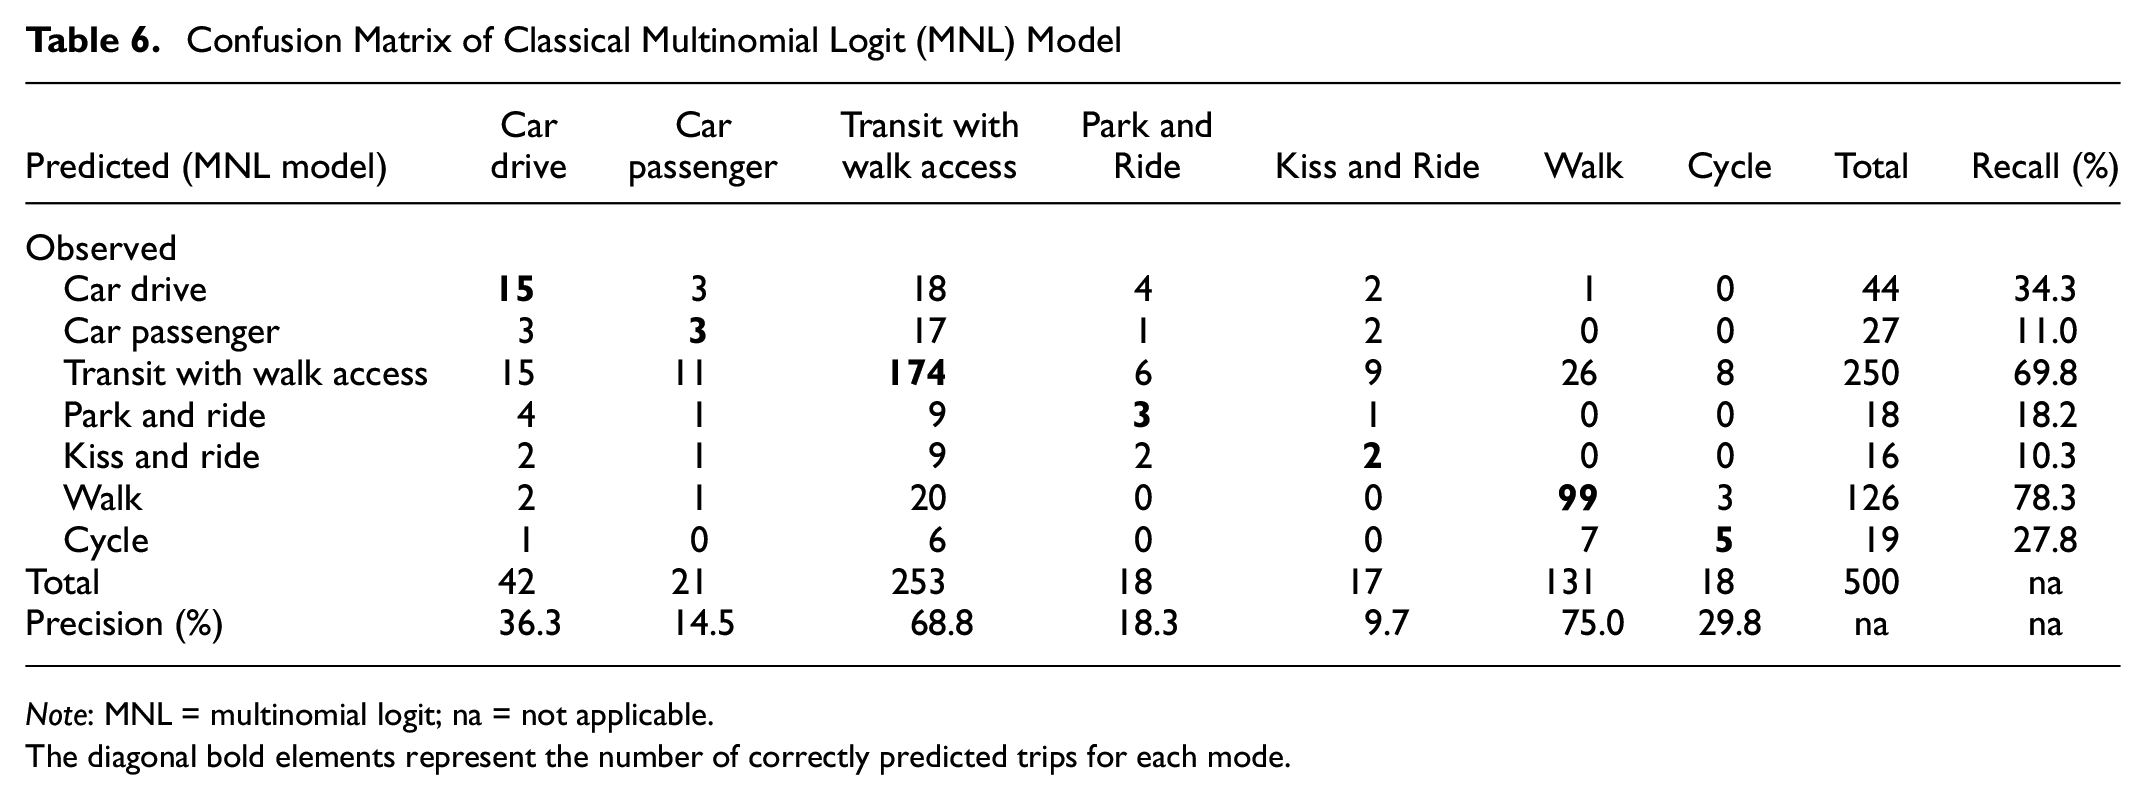
Note: MNL = multinomial logit; na = not applicable.
The diagonal bold elements represent the number of correctly predicted trips for each mode.
Comparison of F-scores across Modes and Models
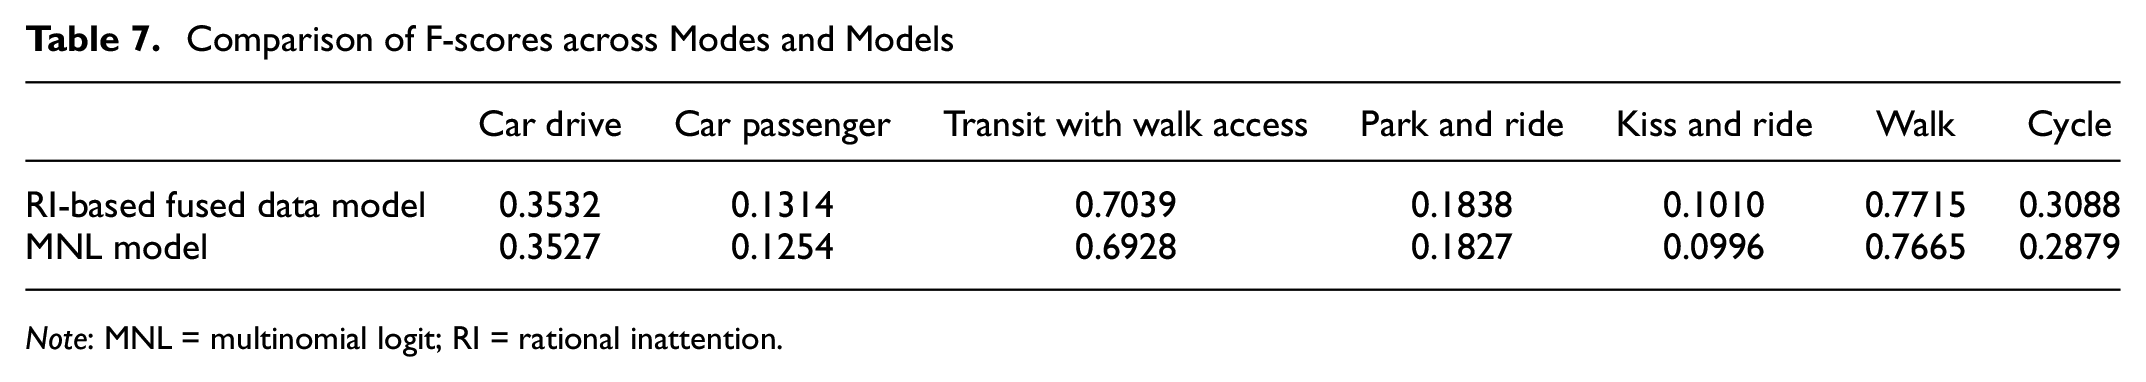
Note: MNL = multinomial logit; RI = rational inattention.
Although the models’ performances are quite similar, the weighted average precision, recall, and F-score of the RI-based fused data model (60.3%, 61.0%, and 0.61) are slightly better than those of the MNL model (59.4%, 60.3%, and 0.59), highlighting its improved forecasting accuracy. However, to reach conclusive evidence, future studies should stress test the models using independent data from a more recent time point.
Conclusion and Future Works
The state-of-the-art travel demand models use data from the most recent time point, even when cross-sectional data are available from multiple time points. Forecasts of travel demand based on the most current data are expected to be more accurate. However, data from a single time point cannot capture the constant evolution of travel behavior. To overcome the limitation, this study proposes a method to fuse repeated cross-sectional travel survey data based on RI theory in discrete choice modeling. For empirical application, it uses data from two cycles of a large-sample post-secondary student travel survey in the GTHA to investigate the commuting mode choices of post-secondary students in the area. The study contributes to the literature in two ways. First, methodologically, it proposes an approach to fuse repeated cross-sectional datasets to generate better insights into the evolution of travel preferences. Second, empirically, the study contributes to university students’ commute mode choice literature by estimating the proposed model using a rich set of exogenous variables. Although the proposed method is empirically tested for mode choice decisions in this study, it can easily be extended to other contexts of disaggregate travel behavior analysis.
The study proposes to measure the prior probability of choice alternatives in the RI model using an individual-specific perceived market share of alternatives from an older dataset of the same population (i.e., an older repeated cross-sectional survey data). A more recent dataset should be used to model the conditional heterogeneous choices. The proposed fusion method is theoretically more robust than existing pooling techniques (where repeated cross-sectional datasets are pooled together to estimate meta-models with year-specific temporal factors and scale parameters). Moreover, it is computationally less burdensome. Empirical investigation demonstrates that the proposed method generates behaviorally consistent results and thus provides an appropriate framework for fusing repeated cross-sectional datasets.
Validation of the estimated RI-MNL model using a holdout sample indicates its improved forecasting performance compared with the classical MNL model. Future studies should stress test the models using independent data from a more recent time. Moreover, future work should also attempt to overcome the independent and irrelevant alternative (IIA) limitation of the RI-MNL by adopting the information cost function proposed by Fosgerau et al. ( 16 ). Currently, research is underway to apply the proposed method to fuse multiple cross-sectional travel surveys conducted at different time points during the pandemic to offer a better understanding of the potential trend of post-pandemic mobility.
Footnotes
Author Contributions
The authors confirm contribution to the paper as follows: study conception and design: S. Hossain, K.N. Habib; data collection: S. Hossain; analysis and interpretation of results: S. Hossain, K.N. Habib; draft manuscript preparation: S. Hossain, K.N. Habib. All authors reviewed the results and approved the final version of the manuscript.
Declaration of Conflicting Interests
The author(s) declared no potential conflicts of interest with respect to the research, authorship, and/or publication of this article.
Funding
The author(s) disclosed receipt of the following financial support for the research, authorship, and/or publication of this article: The research was funded by an NSERC Discovery Grant.
The authors claim the sole responsibilities of all results, comments, and interpretations made in the paper.