
Abstract
To achieve climate goals in the transport sector, many countries are trying to promote the use of public transport. However, to implement effective policies, one must understand the motivations of people who use or do not use public transport today. In this study, we examine the psychographic profiles using latent class analysis to identify the reasons why people use or do not use public transport and link these profiles to reported travel behavior. For the latent class analysis, we use selected psychological items of the German Mobility Panel (MOP), a national household travel survey, that capture attitudes toward public transport. The results highlight four classes that differ based on their psychological profiles: PT-Averse, Privacy Aware Environmentalists, Pragmatists, and PT-Lovers. The results further show that Privacy Aware Environmentalists and PT-Lovers, who have a strong personal norm, frequently use public transport and environmentally friendly transport modes. Thus, the personal norm is a driver of public transport use. The lack of privacy, which the Privacy Aware Environmentalists complain about in public transport, is not a barrier to public transport use.
Climate change is one of the greatest challenges of our time. While some sectors of the economy are meeting their climate targets or at least achieving reductions in greenhouse gases, the transportation sector has so far barely managed to do so. Despite technical progress and increasingly efficient engines, climate targets are being missed because of the growing urge for individual mobility and therefore rising traffic volumes, especially in private motorized transport. In addition to greenhouse gas emissions, land consumption is a problem, especially in densely populated urban areas. The inefficient use of space by private motorized transport, especially cars, results in more space being used for roads and consequently less space being available for housing, commerce, and parks. Therefore, many countries worldwide have committed themselves to a more sustainable development of their transport sector. One of the primary measures for this is to strengthen and expand public transport (PT). First, more people are transported in one vehicle, which means less land is used and fewer emissions are emitted per person. Second, the engines are often electric, especially in metros and commuter trains, which brings local emissions close to zero.
Consequently, local authorities and national governments around the world try to push their population toward environmentally friendly PT. This is to avoid local emissions and congestion. Two kinds of measures are used to achieve this. There are “push measures”, which aim to make car use unattractive, for example, through lower speed limits or a congestion charge. On the other hand, there are “pull measures”, which intend to draw people to a transport mode by more attractive offers for alternatives such as PT. Examples of this are cheaper or even completely free fares on PT or a more frequent service.
An in-depth understanding of people is required to increase the effectiveness of such measures. Here, the motives for using PT as well as the motives of those who do not use PT are important. This study contributes to this research by identifying and investigating the latent psychographic profiles of PT users as well as non-users, comprising also objective indicators of PT usage.
The question of the characterization of PT users and non-users is not new in the literature. However, a vast majority of existing studies focus on objectively measurable characteristics such as sociodemographics, the built environment at one’s place of residence or work, or accessibility to the PT system. Vance and Peistrup ( 1 ) find that women are likelier to own a PT pass than men. Therefore, they are more likely to use PT. In addition, they reveal that having children in the household reduces PT pass ownership, and therefore, the likelihood of using PT. This finding is independent of one’s gender. In addition, Ingvardson and Nielsen found that younger people nowadays are less satisfied with PT despite increased PT use ( 2 ). However, they also highlight that PT use of younger people is more by need than an actual choice, because they do not own a car.
According to the built environment at one’s residence, Boulange et al. ( 3 ) state that both an increasing gross residential density and a well-connected street network positively influence the use of PT and other active modes. Ding et al. ( 4 ) support the significant positive impact of built environment measures on PT usage. The study by Yang et al. ( 5 ) emphasizes the positive correlation between an increased PT accessibility at one’s place of residence or work and PT usage. They define PT accessibility by measures of bus and metro stop density.
Even if those characteristics play a significant role in the mode choice process, they cannot be regarded as direct indicators of the willingness to switch from individual motorized modes to PT. Especially if the level of service is already very good at one’s place of residence or work, a further improvement by increasing the density of stops or frequency of service will only lead to a marginal increase in PT use. For example, Mulaic et al. ( 6 ) found that when metro stations in Copenhagen, Denmark, are doubled, car ownership decreases by only 2%–3%, and PT usage increases only slightly. Barthelmes et al. ( 7 ) come to a similar conclusion using the Hamburg region, Germany, as an example. Even by simplifying access to PT, for example, through a unified and simple fare system, only a moderate increase in the willingness to switch to PT is observed by Abrate et al. ( 8 ) in the example of Italy.
The reasons for this may also lie in the universal applicability of the car. Kuhnimhof et al. ( 9 ) found that many car drivers also use PT. People who use various transport modes opt for PT in specific situations because it is the better option and not because no car is available. Although the car is often the better choice for families, single persons tend to use various transport modes. Furthermore, it was found that commuting by PT could be a key to using PT for other purposes.
In addition to standardizing the fare system, Germany is currently trying to further enhance PT use and accelerate the switch from motorized individual modes to PT with a very low price for a nationwide-valid PT pass. This campaign was introduced in May 2023 for a price of 49€/month (∼ 54 USD), after a testing phase for three months in summer 2022 with a price of 9€/month (∼ 10 USD). The heavily discounted price and the national validity represent a new era for the PT system in Germany. Although in-depth studies of the effect of the new 49€ ticket on PT usage are still pending, the sales figures show that fewer than 10% of ticket holders are currently new PT users, which is considerably low.
The preceding paragraphs show that sociodemographic and spatial characteristics are not solely sufficient to understand PT users and non-users. This is why the consideration of psychological characteristics and therefore, subjective motives play an increasingly important role in travel behavior research. They contribute to explaining individuals’ travel behavior to a notable extent by giving background information instead of only describing their behavior ( 10 ). Furthermore, they provide interesting insights into how to better influence people’s travel behavior in the future and to implement more target-oriented campaigns, for example, to promote PT usage. Such psychological characteristics include attitudes toward and experience with certain transport modes, but also perceptions or norms such as the perceived autonomy a mode gives an individual or the social norm an individual feels when using a certain mode ( 11 , 12 ). In this context, the study by Redman et al. ( 13 ) emphasizes the relevance of attitudes and perceptions when investigating PT usage and their relative importance compared with objective characteristics concerning the willingness to switch from individual motorized modes to PT. A study by Bamberg et al. ( 14 ) also suggests that different social contexts may influence people’s evaluation of PT as well as their actual PT use. Bamberg et al. stated that personal norms play a significant role in using PT instead of the car. In their study, Kroesen and Chorus ( 15 ) found that psychological attitudes toward and the use of modes of transport are bidirectionally related. This means that using a mode of transport also influences the attitudes toward it. They also found that psychological attitudes can change over time. This can also be found in Bamberg et al. ( 16 ).
Magdolen et al. ( 17 ) and von Behren et al. ( 18 ) use a segmentation approach to show that privacy and autonomy perceived in PT as well as the intention to use PT contribute to gain a better understanding of reasons for using or not using PT. Hereby, Shiftan et al. ( 19 ) find that privacy in PT seems less of a problem for environmentally conscious PT riders, whereas for “anxious amblers” privacy in PT plays a major role. In addition, using an ordered hybrid choice model, Barthelmes et al. ( 20 ) find that people use PT more often, although they see their privacy restricted in PT. Hess et al. ( 21 ) find that some respondents facing a lower need for privacy in PT still show a stronger positive attitude toward the usage of cars. According to the study of Gascon et al. ( 22 ) environmental consciousness does not consequently lead to a frequent PT usage, but they observe an increase in spontaneous PT usage.
Although studies exist that analyze the effect of sociodemographic and spatial characteristics as well as subjective motives on the usage of PT, the combination of both dimensions is rarely found in the literature. To fill this gap, the analysis in this study is based on a representative data set of a travel behavior survey conducted in Germany in 2022. This novel data set allows the psychographic profiles found in this study using latent class analysis (LCA) to be linked to actual reported travel behavior from trip diaries. This enables us to distinguish users from non-users and highlight the differences in usage between individual classes. As a result, we can identify drivers and barriers to PT use.
The paper is structured as follows. First, we briefly describe the survey design and the data used. Second, we provide further details on the methodology of the LCA and describe the model selection process and final model specification. Third, we analyze the results of the model. Finally, we draw a conclusion and give an outlook for future research.
Methods
In this section, we provide detailed information about our methodological approach. First, we introduce the data set and sample used for our analysis. Second, we present a detailed explanation of the attitudinal items used to distinguish different types of affinity toward PT. Third, we discuss the LCA approach. LCA allows for identifying and classifying latent groups based on patterns of responses to the attitudinal items. By employing this approach, we aim to uncover distinct profiles or types of PT affinity among the participants in our study.
Data Collection and Study Sample
This study uses data from the German Mobility Panel (MOP). The MOP is an annually conducted survey on the travel behavior of the German population. It was first conducted in 1994 and has been in operation until 2023. Participants aged ten and above contribute to the MOP survey by maintaining a trip diary, recording their daily travel activities for one week. The trip diary encompasses comprehensive information on the timing, transport modes, trip purposes, and distances of all their recorded trips. The survey is conducted during the fall, from September to November, and is divided into multiple survey weeks to mitigate the potential influence of extreme weather conditions. The MOP survey is funded by the German Federal Ministry for Digital and Transport (BMDV), with the design and scientific oversight being carried out by the Institute for Transport Studies at the Karlsruhe Institute of Technology ( 23 ).
The MOP offers valuable information layers that enhance our analysis. First, as an annual representative panel survey on travel behavior in Germany, it enables us to capture changes over time, particularly within specific population subgroups. This longitudinal aspect allows us to examine how travel patterns have evolved and adapted to various factors. Second, data availability for an entire week allows one to explore the diversity of individual travel patterns, particularly for activities that are not performed daily or exhibit day-to-day variations in the transport modes used. This enables a more comprehensive understanding of the complexities and variations in travel behavior.
In 2022, additional questions were integrated into the trip diary for the first time, aiming to capture further insights into travel-related changes. This inclusion was motivated by the increased cost of living in Germany because of the war in Ukraine, potentially influencing travel behavior. Specifically, questions about increased travel costs and PT use were asked. Furthermore, participants were asked about their attitudes toward PT. A subset of psychological items developed by Hunecke ( 12 ) was employed to measure these attitudes. These items are scientifically recognized and tested, allowing us to obtain reliable and valid information on attitudes toward PT. Importantly, for the first time in almost 30 years, the MOP enables us to link attitudes toward PT with actual travel behavior, as surveyed in the trip diary. This linkage provides a unique opportunity to explore the relationship between attitudes and behavior, shedding light on the interplay between individual perceptions and travel choices.
Participants also provide sociodemographic information. The households in the MOP are representative in car ownership, household size, and location size, while individual characteristics such as gender and age are also adequately represented. For our analysis, we utilize a subset of the data collected in 2022; MOP participants who did not complete the psychological items cannot be examined in the LCA. The data set comprises responses from 1,573 participants from 969 households who completed additional survey questions and the trip diary. Figure 1 provides an overview of the sociodemographic characteristics of the sample.
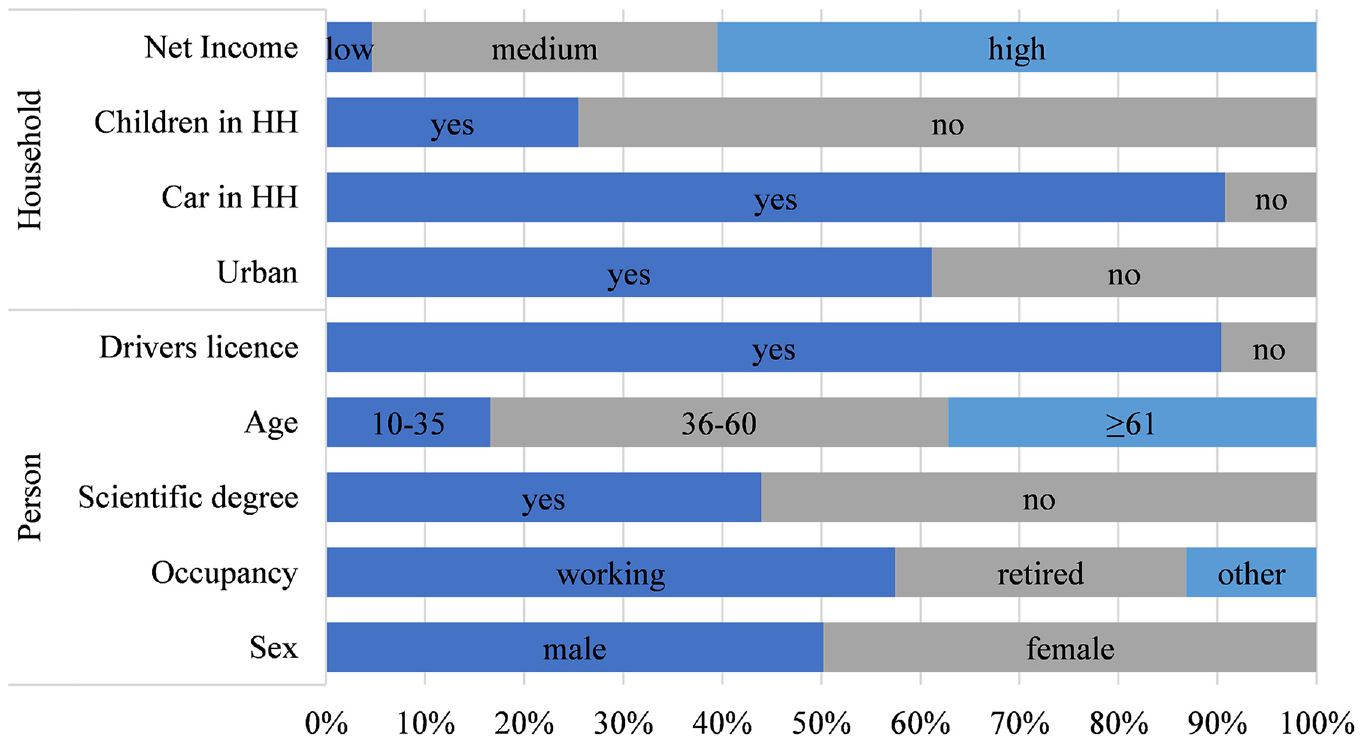
Sociodemographic characteristics.
The sample is predominantly representative for the German population. However, there are some skews in the sample. For example, people between the ages of 10 and 35 are slightly underrepresented (17% of the sample compared with 29% of the population), and the level of education in the sample is also higher than in the general population. For instance, in our sample, 44% hold a scientific degree compared with only 19% in the population. The data we used is unweighted, as the weighting only influences the class size and not the class composition. We had to drop around 20% of participants because of missing items. This may be one reason for skews in the sample. This must be kept in mind for the comparison of the LCA classes.
Psychological Profiles on Public Transport
For the identification of psychological profiles, we use a subset of the tested and standardized attitudinal item set from Hunecke ( 12 ). Given space constraints in the questionnaire, we could not incorporate the complete item set into our questionnaire. The items shown in Figure 2 can be separated into four groups:
Privacy: How do people perceive the level of privacy in PT?
Environmental Norms (Personal and Social): How do environmental concerns affect the PT choice?
Experience: How much do people like riding in PT?
Autonomy: How self-determined people can travel with PT?
We link these categories with the theory of planned behavior (TPB) by Icek Ajzen ( 24 ). TPB is a widely recognized theory of human decision-making, positing three key factors influencing decision processes. These factors are Attitudes, Subjective Norms, and Perceived Behavioral Control. Attitudes refers to an individual’s positive or negative evaluations of a behavior. In our study, these are represented by the items Privacy and Experience. Subjective Norms capture their perceptions of social pressure and influence from significant others. In our study, the items Personal Norm and Social Norm reflect this. Perceived Behavioral Control involves an individual’s beliefs about their ability to perform a behavior successfully. In our questionnaire, the items Autonomy and Forced Mobility are provided for this purpose. However, since they do not have a significant impact on the model result in the LCA, we did not include these items in the final model. TPB has been used in travel behavior research multiple times to gain insights on mode choice ( 25 , 26 ). Although not all TPB categories could be fully assessed in our study, we applied the available concepts to examine their relevance in PT use.
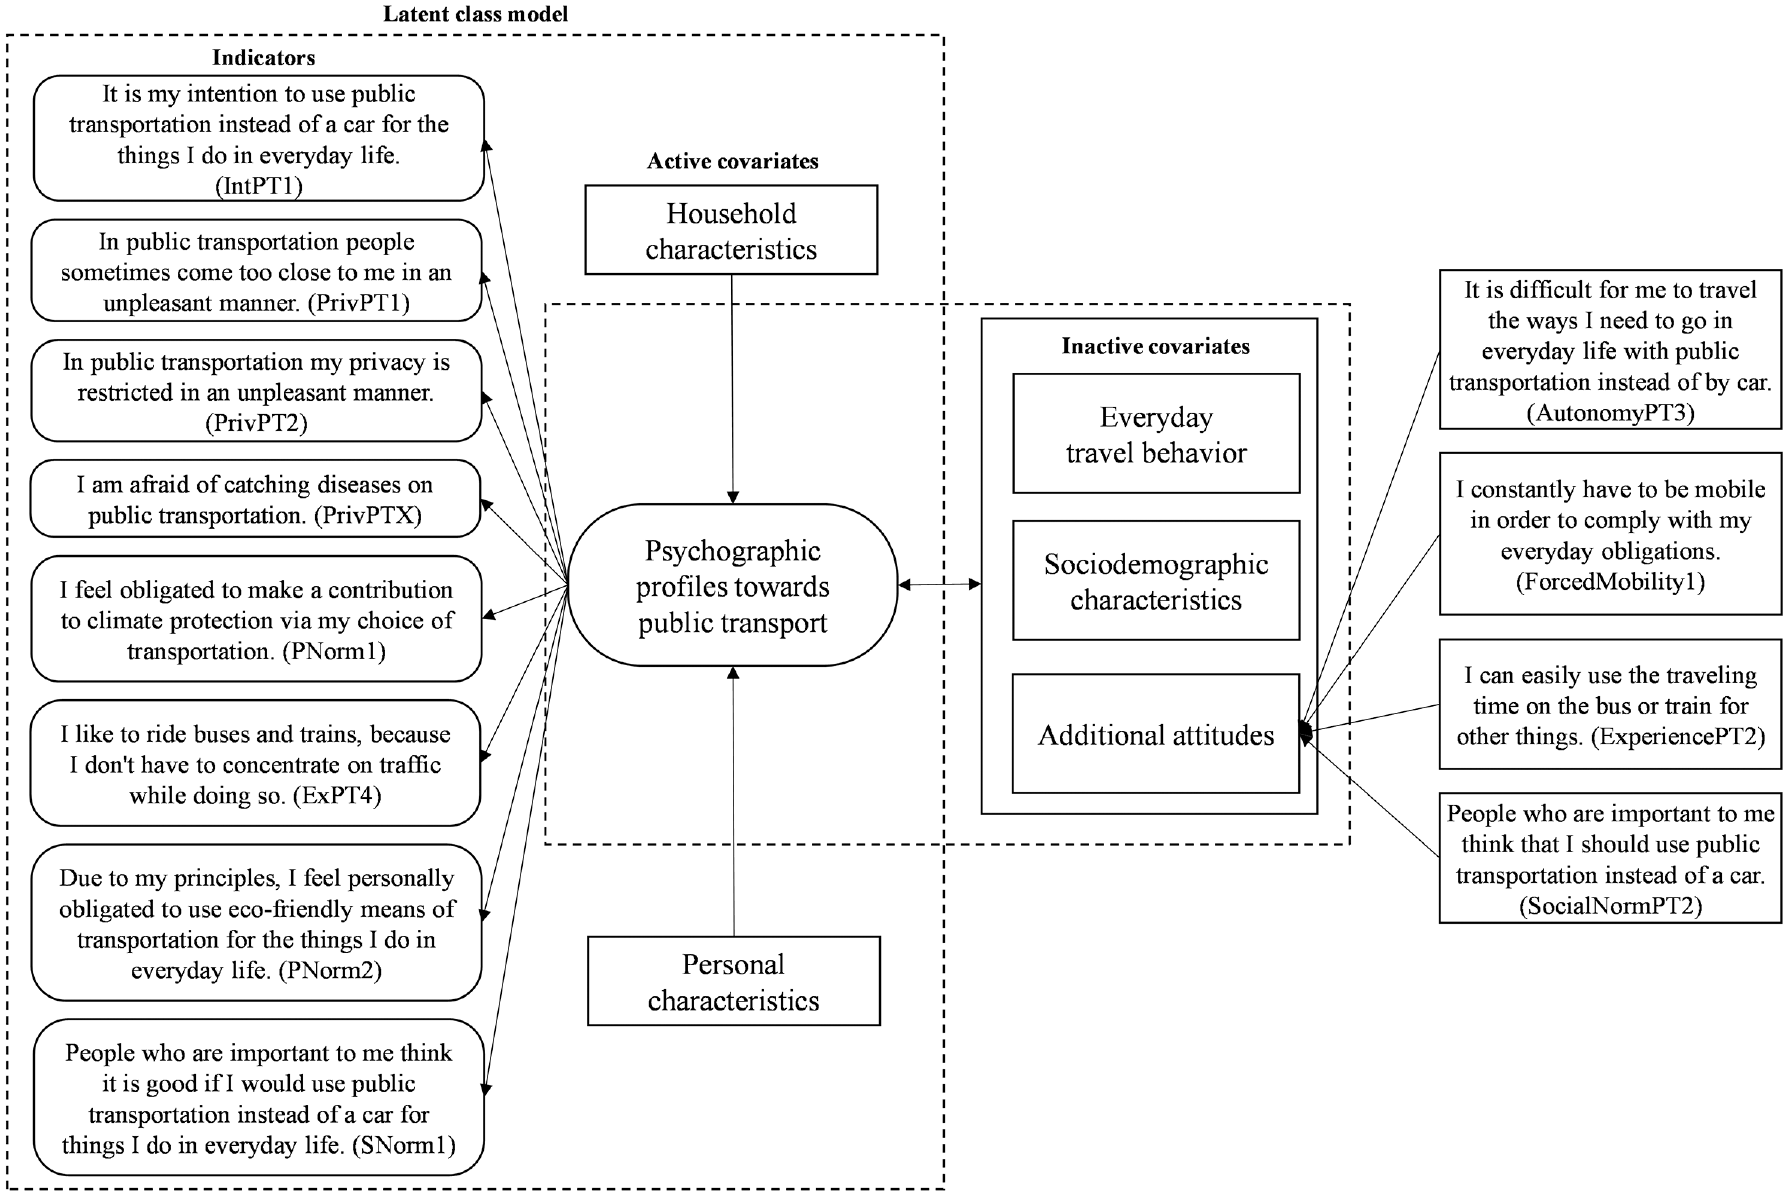
Research methodology for the latent class analysis.
Latent Class Analysis
LCA is a segmentation approach that assigns people to different groups based on their response pattern to categorical indicator variables ( 27 ). The goal is to find latent classes, or “hidden groups” within the population ( 28 ) that contain people with similar response patterns to the categorical indicator variables. LCA is a “person-centered approach”, whereas traditional factor analysis is a “variable-centered approach” ( 29 ). Thus, LCA is suited for grouping people based on their attitudes. An alternative method for the purpose of our research question would be a hybrid choice model (HCM). However, an LCA is more commonly used for group segmentations, whereas in an HCM the individual choice behavior is the focus. Therefore, differences between distinct groups become more easily apparent in an LCA than in an HCM. Moreover, the use of an HCM requires more data preprocessing, such as the construction of an appropriate decision variable or the aggregation of psychographic indicators to a limited number of principal components. For example, Barthelmes et al. ( 20 ) needed to compute an ordered decision variable and had to limit the consideration of psychographic characteristics to two dimensions. To keep the explorative character in the least biased manner, we opted for the LCA in this study.
In a basic LCA, the measurement model determines the probabilities of class membership based on individuals’ response patterns to indicator variables. The latent classes in this measurement model account for the associations among the indicators. However, an extension of LCA is required to incorporate the effects of sociodemographic variables into the analysis. This extension involves including covariates in the model, where the active covariates are used to predict individuals’ class membership. This expanded version is known as the structural model in LCA, which integrates both the latent class structure and the influence of active covariates on class membership probabilities ( 30 ). The active covariates cannot be endogenous to the indicators. An example of a non-suitable active covariate is possessing a driver’s license, which is endogenous primarily to the number of car trips ( 31 ). Thus, we chose sociodemographic variables as active covariates. Travel behavior, such as PT use, are included as inactive covariates that do not influence the class membership probabilities but help to describe the different latent classes. The mathematical details can be found in Lanza et al. ( 32 ), which comprehensively describes the methodology. However, the conceptual framework of our analysis is illustrated in Figure 2.
The literature does not specify a minimum sample size for conducting an LCA. However, at least 500 participants are recommended ( 33 ). This requirement is given in our study with over 1,000 observations.
Deciding on the number of classes in an LCA is considered one of the most challenging steps ( 28 ). To determine the optimal number of classes for our model, we initially only use the “measurement model”. Various fit indicators can be employed to determine the optimal number of classes. The log-likelihood should be maximal. Akaike’s Information Criterion (AIC) should be minimal, as should Bayesian Information Criterion (BIC) and consistent AIC (CAIC) ( 28 , 31 , 34 ). The entropy should be high. Values >0.8 show a good classification, but it should be at least 0.6 ( 35 ). The smallest class should be at least 8% of the total sample ( 31 ).
In our study, we employed categorical coding for the latent variables, following the approach outlined by Lanza et al. ( 32 ). We recoded the 5-point Likert scale items (1 = strong disagreement to 5 = strong agreement, with 3 as neutral option) into a binary format. Specifically, 1 was assigned to individuals who demonstrated a general affinity toward PT in a particular item, while 0 indicated the absence of PT affinity. A value of 1 was assigned for (strong) agreement and 0 for neutrality or (strong) disagreement, except for the Privacy items. For the Privacy items, the coding was reversed, with 1 assigned to disagreement, and 0 to neutrality or agreement. This reversal was because of the specific wording of the questions. Furthermore, the covariates were coded as dichotomous variables, following the guidelines presented by Lanza et al. ( 32 ).
To conduct the LCA and analyze the data, we utilized the PROC LCA software package in SAS, developed by Lanza et al. ( 32 ). This widely used software package provides robust and efficient tools for conducting LCA and was instrumental in our analysis.
Results
In this section, we present the results of our study. First, we present the process of selecting the final model. Second, we present the latent classes that were found. Third, we present the descriptive analyses we performed to provide a better understanding of the classes.
Model Selection
The number of latent classes is determined using various fit indicators described in the previous section. Different solutions are possible since the different fit indices usually do not suggest the same number of classes. The best solution is also determined by the model results ( 28 ).
Table 1 provides an overview of the goodness-of-fit measures for the models. In our model, the log-likelihood steadily increases with the number of classes but does not reach an absolute maximum. The AIC continuously decreases but also does not reach an absolute minimum. In contrast, the BIC reaches a minimum for the 4-class model. The entropy remains around 0.8 for the 2- to 5-class models but sharply decreases from the 6-class model onwards. The smallest class always comprises more than 8% of the total sample. The similar BIC values of the 4-class and 5-class models indicate that both variations are viable. While the 4-class model has a slightly lower BIC, the entropy in the 5-class model is slightly higher and exceeds 0.8. To select the appropriate model, we further examined the latent classes of both models. It became apparent that the two models are fundamentally very similar, with only one class in the 4-class model being split into two separate classes. However, since these two classes are very similar, we opted for the 4-class model.
Fit Indicators for Determining the Number of Classes of the Latent Class Analysis
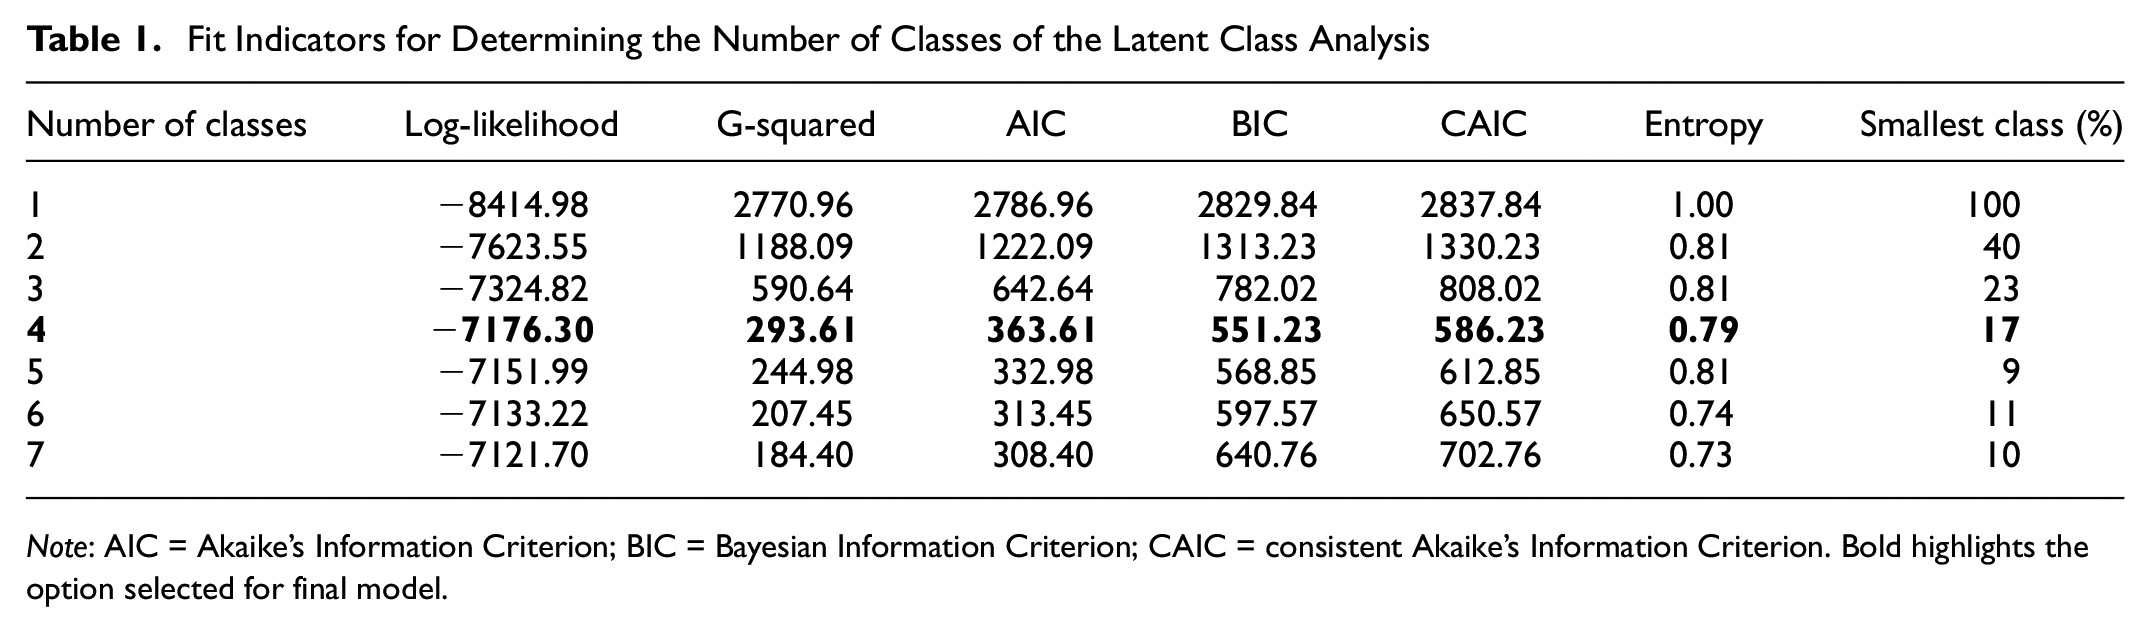
Note: AIC = Akaike’s Information Criterion; BIC = Bayesian Information Criterion; CAIC = consistent Akaike’s Information Criterion. Bold highlights the option selected for final model.
Description of the Latent Classes
Based on the 4-class solution we obtained the model results presented in Table 2. The measurement model shows the psychological attitudes of the individuals within the class. Values above 0.7 indicate high agreement and homogeneity within the class and are therefore highlighted in bold. The structural model describes the probability that a person with corresponding sociodemographic characteristics is assigned to a class. Here, the comparison is always made with the first class. Values above 0, therefore, mean that a person with the corresponding characteristic is more likely to be assigned to this class than to class 1. We tested various combinations of covariates, but the one used in the model achieved the best model improvement. Other possible covariates such as household income, children in the household, or age did not improve the model results.
Model Results
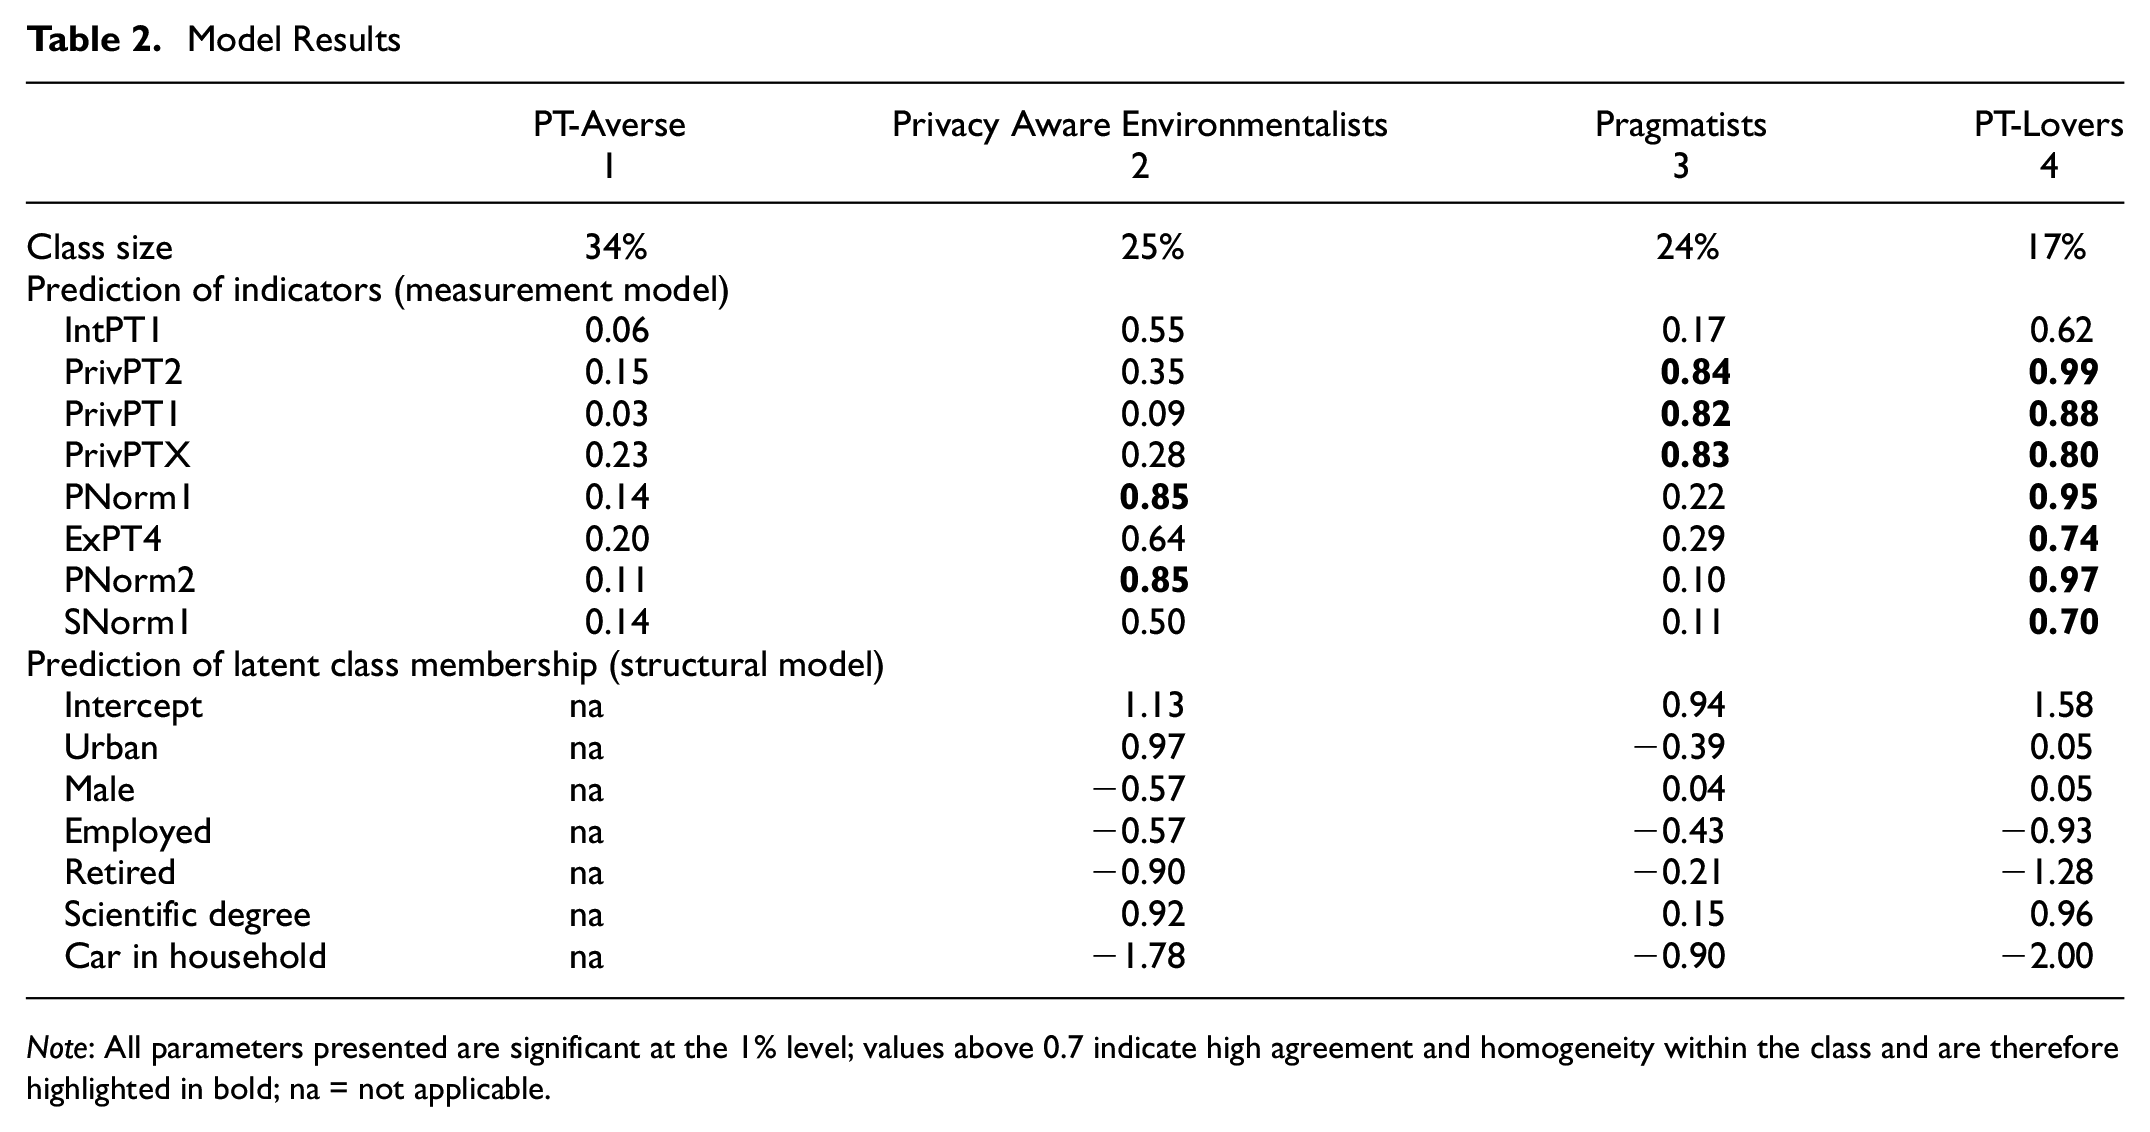
Note: All parameters presented are significant at the 1% level; values above 0.7 indicate high agreement and homogeneity within the class and are therefore highlighted in bold; na = not applicable.
The PT-Averse people are the largest class with 34% of the sample. They do not indicate any affinity for PT in the surveyed items. Therefore, they do not intend to use PT in their everyday life. The urbanity as well as the gender ratio are balanced. The class consists primarily of employed people and retirees. Other occupational groups, such as students, are less present, and the proportion of people with a university degree is lower than in the other classes. The car ownership rate of this class is the highest of all classes: about 98% of all people live in a household with at least one car.
The Privacy Aware Environmentalists are the second largest of the identified classes, with 25% of the sample. Members of this class have privacy concerns in PT. In return, they show a high private norm. Thus, they are environmentally conscious. The class is ambivalent about the intention to use PT in everyday life. A very high urbanity characterizes people of this class. In addition, the members of this class are predominantly female and highly educated. Car ownership is considerably lower than for the PT-Averse, yet about 80% of households own a car.
The class of Pragmatists includes only slightly fewer people than the Privacy Aware Environmentalists, with 24% of the sample. They have no problems with privacy in PT. Moreover, they do not show a high private norm. Thus, the environmental awareness of people in this class is low. They show no intention to use PT in everyday life. Persons in this class live in a less urban environment than PT-Averse people. In addition, persons in this class have a lower car ownership rate, yet about 95% of all households in this class own a car.
The PT-Lovers are the smallest class, with 17% of the sample. They show a high affinity for PT in all categories. The intention to use PT in everyday life is the highest among all classes, yet a certain ambivalence is also evident here. The social norm of this class is high. In addition to the members of this class, friends and family of the PT-Lovers also have a high level of environmental awareness, and there is a certain degree of social pressure. Many members of this class have a scientific degree. In addition, there are fewer employees and retirees in this class, so the level of students is higher than in the other classes. The car ownership rate of this class is the lowest among all classes.
Descriptive Analyses of the Latent Classes
To better understand individuals within each group, this section presents descriptive analyses of the travel behavior of the respective classes. First, we examine the transport mode use of individuals in each class during the reporting week. Figure 3 displays the transport modes bicycle, car and PT utilized by participants within one week. As individuals may use multiple transport modes, the bars do not sum up to 100%.
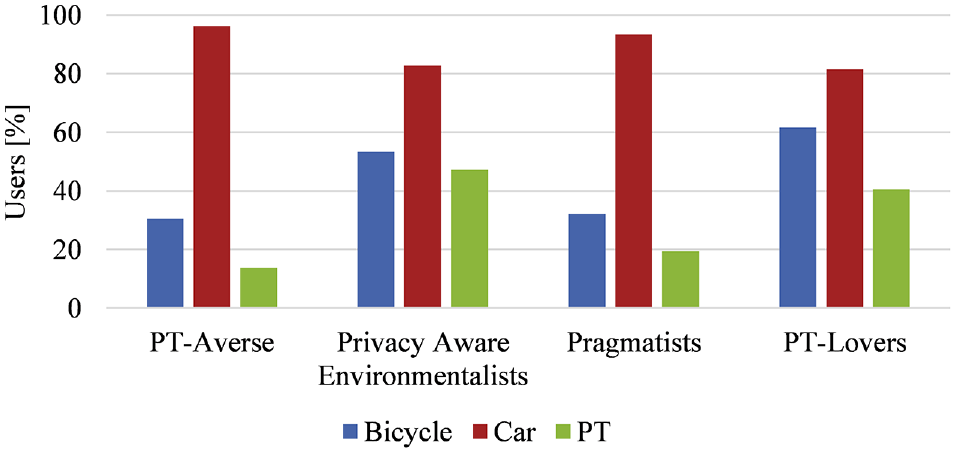
Mode users within each class during the week.
It becomes evident that, across all classes, the car is the dominant transport mode. However, there are notable differences between the classes. Among the PT-Averse individuals, car usage is the highest, with approximately 96% of them using the car during the reporting week. Around 14% of this class uses PT. In contrast, among the Privacy Aware Environmentalists, approximately 47% use PT, the highest proportion among all classes. Additionally, 53% of this class uses bicycles. Nonetheless, a substantial number in this class also rely on cars, with approximately 83% using them. The Pragmatists show a similar pattern to the PT-Averse, with 93% using cars during the week, while only 32% use bicycles and 19% PT, respectively. For the PT-Lovers, 62% use bicycles, 82% use cars, and 41% use PT. Despite their higher PT affinity, fewer PT-Lovers utilize PT than the Privacy Aware Environmentalists. However, they have a higher share of bicycle usage.
The modal split of each class, illustrated in Figure 4, further supports the previous results. Generally, both the PT-Averse and the Pragmatists exhibit similar travel patterns. Most of their trips are made by car as drivers, accounting for 57% and 54% of their total trips, respectively, with an additional 11% of trips with car as passengers. Overall, approximately two-thirds of their trips are conducted by car. Walking and cycling each constitute around 20% of their total trips, while PT plays a minor role for both classes, with the PT-Averse using it for only 3% of their trips and the Pragmatists for 5% of their trips.
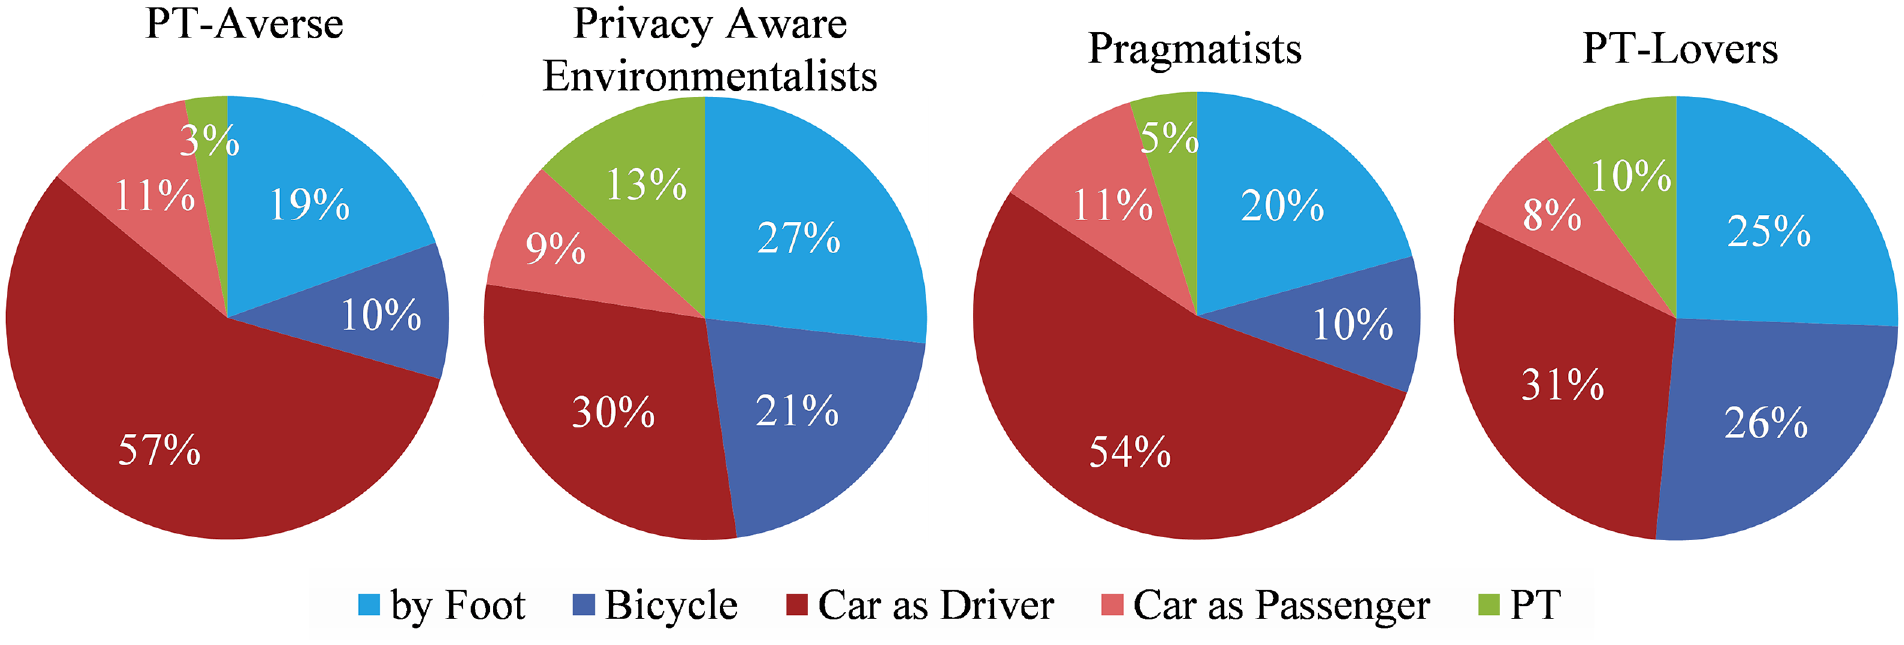
Modal split of trips taken for each class.
Similarly, the Privacy Aware Environmentalists and the PT-Lovers exhibit comparable modal splits. For both groups, transport modes are well balanced, with approximately a quarter of their trips being made by bicycle and on foot respectively. Car use as driver account for only 30% of their trips. Slight differences emerge in the use of PT, with the Privacy Aware Environmentalists using it for 13% of their trips and the PT-Lovers for 10% of their trips.
These findings underscore the distinct mobility preferences within each class, with the car being the dominant mode for the PT-Averse and the Pragmatists, whereas the Privacy Aware Environmentalists and the PT-Lovers demonstrate a more diversified and sustainable approach by using the mix of bicycles, walking, and PT more frequently.
The person kilometers traveled by each class are within a similar range. The PT-Averse and the Privacy Aware Environmentalists travel approximately 41 km per day, while the Pragmatists cover 42 km, and the PT-Lovers travel around 44 km per day. The distribution of kilometers traveled by different modes is presented in Figure 5.
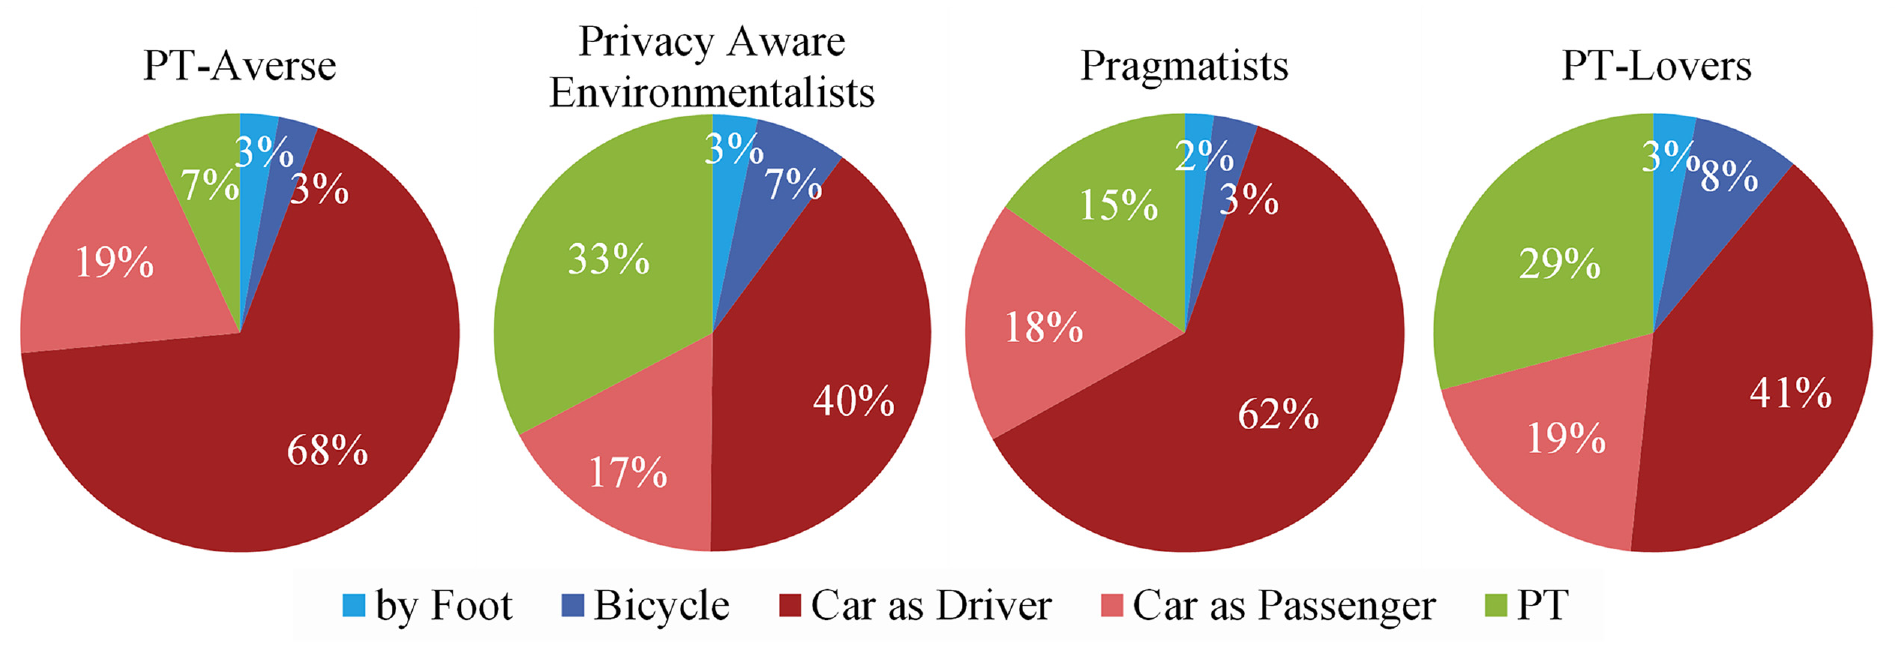
Kilometers traveled differentiated by transport mode and class.
Notably, differences in PT usage between the PT-Averse and the Pragmatists are evident. The PT-Averse rely on PT for only 7% of their total distance, while the Pragmatists use PT for approximately 15% of their kilometers traveled. This suggests that the Pragmatists opt for PT, particularly for longer distances. Both the Privacy Aware Environmentalists and the PT-Lovers use PT for around 30% of their kilometers traveled. Cycling and walking constitute only a small proportion of kilometers traveled for all classes. This observation is unsurprising, given that these modes are generally slower and primarily used for short distances in the neighborhood.
Finally, we examine the purposes for which each class utilizes PT. The number of PT trips per week and the distribution of trip purposes are presented in Figure 6.
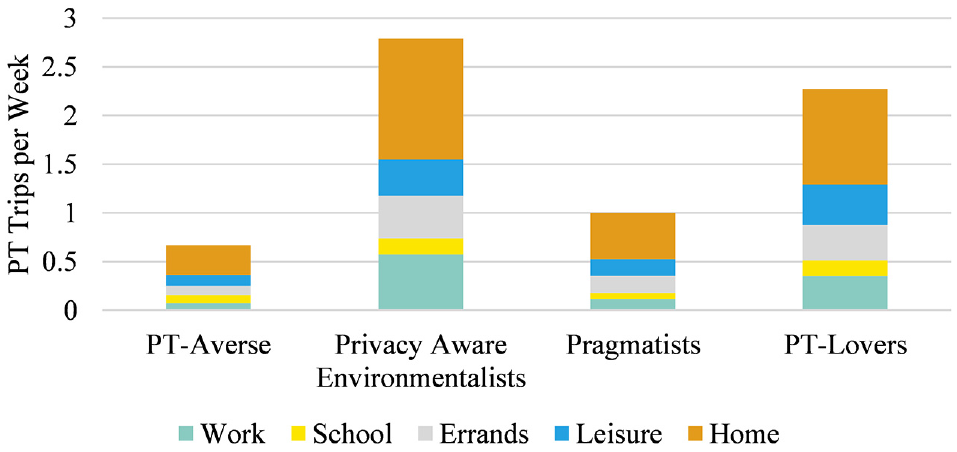
Trip purposes of public transport (PT) trips within a week differentiated by class.
The PT-Averse rarely use PT, and the trip purposes are mixed. No specific primary purpose for PT trips can be identified. As for the Pragmatists, they make approximately one PT trip per week. Similar to the PT-Averse, no clear primary purpose for their PT trips can be discerned.
In contrast, the Privacy Aware Environmentalists take an average of 2.8 PT trips per week—the highest among all classes. They frequently use PT for commuting to work and occasionally for errands and leisure activities. The PT-Lovers conduct around 2.3 PT trips per week. Unlike the Privacy Aware Environmentalists, they use PT less frequently for commuting to work, which can be attributed to the lower number of workers in this class. However, they utilize PT more frequently for school or university commutes, owing to the higher number of students in this class. Additionally, they use PT more often for leisure activities than the Privacy Aware Environmentalists.
These findings shed light on the varying trip purposes and frequencies of PT usage within each class, reflecting diverse travel behaviors and needs. Understanding the distinct travel purposes offers valuable insights for devising targeted strategies to encourage PT usage and address the specific mobility needs of different groups.
Discussion
In this chapter, we summarize the characteristics of the identified classes and guide how policymakers can encourage members of each class to use more environmentally friendly transport modes. Our evaluations show that we can divide our sample into four classes that differ in their willingness to use PT. These four classes can be divided into two fractions concerning actual PT use; there are two classes where people use PT regularly and two classes where people use PT less frequently.
We start by analyzing the groups with the highest PT use—Privacy Aware Environmentalists and PT-Lovers. They are characterized by a high private and social norm, so they have a high environmental awareness. In addition to the high personal norm, PT-Lovers show no privacy concerns. Therefore, their high use of PT comes as no surprise. In addition, they also have a high use of cycling and walking. Thus, we see that PT alone, although perceived as very good in all areas by PT-Lovers, does not fully meet people’s needs. Rather, a balanced mix of modes is needed to meet all needs.
The Privacy Aware Environmentalists have privacy concerns when using PT. Nevertheless, they use PT frequently. Like the PT-Lovers, they also have a high use of cycling and walking. This is a result of the high personal norm. The privacy concerns should be tackled to further increase their use of PT. Since many highly educated women are in this class, it is reasonable to assume they are afraid of being assaulted in PT. If PT can be made safer, privacy concerns could be reduced, and thus, PT use could be further increased.
In both cases, the Pragmatists show opposite psychological attitudes compared with the Privacy Aware Environmentalists. They have no problem with the lack of privacy in PT but show less environmental awareness. They hardly use PT. Thus, high environmental awareness is a clear driver of PT use. This is in line with the results of Bamberg et al. ( 14 ). Moreover, a lack of privacy is not a barrier to PT use. The low use of PT may be because of poor accessibility. Pragmatists live in rural areas, where PT is generally poorly developed. To enhance their PT use, accessibility in these places should be improved.
The PT-Averse have the lowest PT use. They show a personal dislike for PT, so they are probably hard to convince of PT. In contrast, Privacy Aware Environmentalists use PT, despite privacy concerns. Therefore, there are probably other factors that cannot be revealed by our method. Maybe it is so convenient to use their car that they do not think about alternatives. Therefore, push measures must be implemented to convince them of other, more environmentally friendly transport modes. One way of doing this is to reduce speed on inner-city roads, which increases travel time in cars and also improves the safety of other road users. Another possibility would be to increase parking fees.
Conclusions
This study identifies four latent classes of psychographic profiles toward PT. For this, we applied an LCA. By linking the latent classes with reported travel behavior, we were able to show which psychological attitudes are drivers of PT use, and which are barriers to PT use.
In our results, a high level of environmental awareness ensures a balanced mix of transport modes in everyday life. PT use is also independent of perceived barriers such as privacy concerns. We find that PT use is significantly influenced by environmental awareness. Individuals with lower environmental awareness, on the other hand, hardly use the PT at all. They do most of their daily chores by car.
We propose several measures to increase the use of PT among the population. First, the environmental awareness of the population should be increased. The high level of education of Privacy Aware Environmentalists as well as PT-Lovers indicates that high education can lead to more environmentally friendly behavior and thus contributes to environmental protection. Second, transport modes should be considered to match mobility options to people’s needs. In addition to strengthening PT, environmentally friendly transport modes such as walking and cycling should also be included in planning. Thus, when building PT infrastructure, care should be taken to ensure that stations are easily accessible on foot and by bicycle, and that bicycles can be taken along on PT. Having a look at the Privacy Aware Environmentalists, this point is striking. They live in very urban areas and usually have high accessibility to PT. However, to further support this hypothesis, a more detailed analysis of the PT accessibility at one’s place of residence and its integration in the LCA would be helpful.
Efforts should be made to encourage Pragmatists to use PT. Further research is needed to understand why they rarely use PT. They show no aversion to PT, yet usage is very low. Possibly this is because of the poor accessibility of PT. Although the item AutonomyPT3, which asks about the accessibility of PT for individuals, is not significant in the model, it could explain the lower use of PT in this class. In addition, a higher personal norm could increase PT use. However, care should be taken not to disadvantage Privacy Aware Environmentalists and PT-Lovers.
A limitation of our study is that we could not use all psychological items from Hunecke ( 12 ). In addition, the influence of accessibility to PT on its usage is currently not implicitly considered in our model and is up to future work. One way of doing this is to ask about subjective accessibility in the framework of psychological attitudes. This allows accessibility to be integrated into the LCA. Nevertheless, we identified parallels between our model and the theory of planned behavior (TPB) framework. Our analysis highlighted the significance of Subjective Norms, suggesting that social influences play a crucial role in PT use. Additionally, we observed that experience in PT and privacy have a minor impact on travel behavior in our model. Moreover, Perceived Behavioral Control did not significantly influence PT use. Despite the partial limitations, the TPB provided valuable insights for understanding the interplay between intentions, attitudes, norms, and perceived behavioral control concerning PT use.
Future research should focus on examining changes in psychological attitudes and their influence on the mode choice in more detail. This could shed more light on the interactions between changing attitudes and modes of transportation.
Footnotes
Author Contributions
The authors confirm contribution to the paper as follows: study conception and design: J. Vallée; data collection: J. Vallée, L. Ecke; analysis and interpretation of results: J. Vallée, L. Barthelmes, L. Ecke, P. Vortisch; draft manuscript preparation: J. Vallée. All authors reviewed the results and approved the final version of the manuscript.
Declaration of Conflicting Interests
The author(s) declared no potential conflicts of interest with respect to the research, authorship, and/or publication of this article.
Funding
The author(s) disclosed receipt of the following financial support for the research, authorship, and/or publication of this article: This paper presents analyses of the German Mobility Panel funded by the German Federal Ministry for Digital and Transport. Grant Number: VB600002.