
Abstract
Disruptions in transport networks have major adverse implications on passengers and service providers, as they can yield delays, decreased productivity, and inconvenience for travelers. Previous studies have considered the vulnerability of connections and infrastructures. Although such studies provide insights on general disruption management approaches, there is a lack of knowledge concerning integrated multi-level traffic management and its effects on travelers to reduce the impacts of disruptions. Integrated multi-level traffic management refers to coordinating individual network operations to create an interconnected mobility management system. This study sought to assess the management of road disruption utilizing multi-level disruption management. Multi-level disruption management is proposed that integrates an information dissemination strategy and allows changing the functionality of parking spaces to traffic lanes to facilitate the movement of travelers. The capacity/frequency of public transport vehicles is also increased to help travelers reach their destinations by changing to public transport mode. To achieve such goals, an extension to an agent-based simulation was developed. Numerical experiments are applied to a part of the city of Zürich. The results indicate that the proposed approach, multi-level disruption management in a multimodal network, can shorten travelers’ delays, especially comparing the effects of disruption management. Results show heterogeneity of behavior among agents. Adding lanes as a disruption management enhances the usage of car-mode by all agents, whereas it reduces the usage of car-mode by the directly affected agents, those who cannot pass the disrupted roads. In the presence of full information and increased capacity of transit vehicles, delay is reduced by 47%.
Keywords
Recurrent and unexpected events (e.g., construction, maintenance, floods) can lead to disruptions that affect travelers’ route choice and travel behavior, finally leading to service degradation. To reduce the adverse effects on travelers, transit and road operators need a multimodal model to test the pros and cons of their disruption management to find potential optimal solutions. For such an aim, testing disruption strategies in real cases has a cost burden. Therefore, it is practical to test such disruption management strategies through the mathematical and simulation environment. Thus, transit operators can benefit from testing their strategies through simulated scenarios to estimate the consequences of their disruption strategies related to the delay and cost to travelers. Such a model must be capable of including: (i) a large-scale network and volume of travelers, (ii) capacitated transit vehicle and network, (iii) multimodal network to be able to simulate both public transport and road network. The third-mentioned characteristic is fundamental for a model that provides operators with a tool to identify the flow propagation of travelers and delay on the network. Such a model allows us to identify the consequence of a road disruption on public transport, evaluate the effects of the disruption management, and finally identify how public transport can assist in such situations. Such needs motivated the authors to pursue this research.
Multimodal network management in this research can be defined as enabling the control of different modes, considering all transport infrastructure in a network (i.e., road, rail, etc.), in an integrated system to reach an optimum level of service according to the demand by different control strategies. Especially the multimodal management can respond to different events, also known as incidents in the network, with collaborative solutions between different modes. The success of a multi-level traffic management system depends on careful planning on the one hand, and on the other hand, an integrated system-level perspective among the network operators, which calls for advanced transportation analysis tools to estimate and predict network performance under different strategies and analyze the network for different tactical purposes. Multi-level disruption management in this research means integrating different disruption management simultaneously. In this research, the three levels of disruption management are integrated, which will be explained below.
To review the literature on this subject, the related recent articles for multimodal management were categorized under the non-disruption and disruption conditions, and for freight and passenger transport. In the field of multimodal network under normal operations (i.e., without a disruption), Zheng et al. ( 1 ) focused on the distribution of urban road space for a multimodal network and answered the question of how space distribution for modes and interactions among modes affect network traffic performance. Moreno et al. ( 2 ) provided a new approach for the management and exchange of information related to multimodal transportation. Boschian et al. ( 3 ) specified an integrated system devoted to the management of multimodal transportation networks to take both tactical decisions, that is, in an offline mode, and operational decisions, that is, in real time.
In the field of multimodal management during a disruption in freight transport, previous studies showed that mode shift as a response to disruption (assuming multiple modes are available) can reduce both the delay and cost ( 4 ). From a network perspective, transport systems of different modes can, especially during disruptions, complement each other and provide alternatives for freight transportation if infrastructure and service access are available ( 5 ). Woodburn ( 6 ) found that during a disruption caused by a rail link closure in Great Britain, intermodal terminals experienced less available handling time per train and faced issues handling trains arriving out of schedule. Therefore, Fikar et al. ( 7 ) argued that management actions should include different aspects; for instance, additional staff or backup equipment needs to be ensured. Ambra et al. ( 8 ) stated that mode shift begins to be attractive when the cost of switching is less than the delay costs, which usually happens when disruptions last multiple days.
In general, disruptions in transport networks cause longer travel times and slower speeds for different modes of traveling on disrupted days compared with regular days ( 9 ). To assist the management of a public transport disruption, Cebecauer et al. ( 10 ) considered bus bridging and taxi on demand. However, they limited the study of the effects of disruption management to the disrupted location, not including in detail possible cascading effects on the rest of the network. In the literature, there is a lack of multimodal network models integrating multiple actions, that is, levels at the same time in their complementary aspects, when managing disruptions.
Previous work also used approaches from the perspective of the network operator and associated cost incurred by them ( 11 , 12 ), based on traffic queue management ( 13 ), information strategies for public transport passengers ( 14 ), real-time information for road disruption ( 15 ), and bus bridging for transport disruption ( 16 , 17 ) to tackle the issue of disruption in road and public transport networks. In summary, the performance of the individual modes (e.g., railway or road traffic) is optimized separately. However, an integrated framework assessing all modes at once would be beneficial, as it is closer to the real-life need. Cebecauer et al. ( 10 ) modeled a collaboration between taxis and bus bridging to find the best tradeoff between the operators’ costs and waiting times of passengers to manage the disruption in public transport. In a similar approach, Tympakianaki et al. ( 9 ) studied the impact of a tunnel closures on the network, which leads to longer travel times and slower speed on the roads and bus routes. The advantage of the present work over previous research is that it uses a traveler-oriented model in which the various mode choices of the travelers, the delay they experience, and the value of time that can be saved for the passengers are considered, and finally the effects of information strategies on travelers are evaluated.
A nested model (multi-level disruption management model within a multimodal network) is proposed in which the public transport network alleviates road disruption by transferring travelers over the disrupted location. There is a gap in the literature for a comprehensive model to simulate the consequences of disruption management strategies on travelers. This research simulates the consequences of different actions on travelers’ behavior. A new multimodal microscopic agent-based model is presented, integrating multi-level disruption management, which simulates a road disruption, switching the mode of travelers to public transport or other modes, increasing the capacity or frequency of public transport networks and f different roads to mitigate the delays of travelers. A multi-layer multimodal hierarchical traffic control scheme is referred to, with the flow of information across the layers (vertical system design). Potential collaboration between the operators/managers/stakeholders of different modes (railway and road) can lead to concrete benefits for the overall mobility market.
This paper is structured as follows. The next section describes the methodology. The third section is devoted to the case study that is considered to test the nested model. The fourth section presents multi-level disruption management in agent-based simulation. The fifth section shows the numerical results of the delay, associated monetary value of time, and mode choice of travelers according to the disruption management strategy. The final section contains the conclusion and presents plans for future research.
Methodology
To simulate the behavior of travelers and estimate their delay, an agent-based transport simulation approach, MATSim ( 18 ), is used. MATSim is a simulation framework in which artificial agents represent travelers in the real world. Each agent has socio-demographic attributes such as age and gender and a daily plan. Each daily plan consists of activities and their types, containing information about the location of activities, start times, and duration. Activities are connected by trips containing a specific mode of transport and a route through the transport system. The simulation represents 24 h per day, and at each time step, agents are either in an activity location (i.e., being at one specific activity such as work or shop) or in transport (i.e., on the road network, in a public transport vehicle, or transferring at stops). Public transport (PT) mode is considered as a whole, that is, it is not differentiated explicitly by vehicle type or technology. In the iterative approach used, plans are randomly altered for certain percentage of agents, which includes mode change. In this case, the best route in the network is computed considering all technologies and vehicles having the same travel time multipliers, with no bias toward certain vehicle types. Movements in road vehicles are simulated through a directed graph network representing roads of the infrastructure. The infrastructure is capacitated (i.e., limited space on roads) so that interactions between agents lead to congestion. Simultaneously, along roads, PT-mode can also be included in the daily plans of agents. The situations (known as “events” in MATSim) such as denied boarding because of full capacity, boarding delays, failures because of overloading, and delays triggered by the simulation, are useful for modeling travel incidents. Each agent-based simulation is based on a synthetic population of the case study area, with the aim to represent approximately the real population and their daily trips. In MATSim scenarios, a calibrated disaggregated demand model is used (already used and tested in Rahimi Siegrist and Corman [ 19 ]), which determines the input for the agent-based simulation (also calibrated/evaluated in many previous studies such as Horni et al. [ 18 ]). MATSim is based on an iterative procedure to approximate the day-to-day user equilibrium state ( 18 ). Eventually, an equilibrium state is reached where the agents cannot further improve their plans unilaterally. Extension modules are developed in MATSim which enable us to evaluate different management strategies based on proposed performance indicators. The model applies replanning at origin/activity locations, re-routing, replanning (changing the mode of travel), informing travelers at various time spots and locations, and altering the functionality of traffic lanes in emergency cases.
For agent
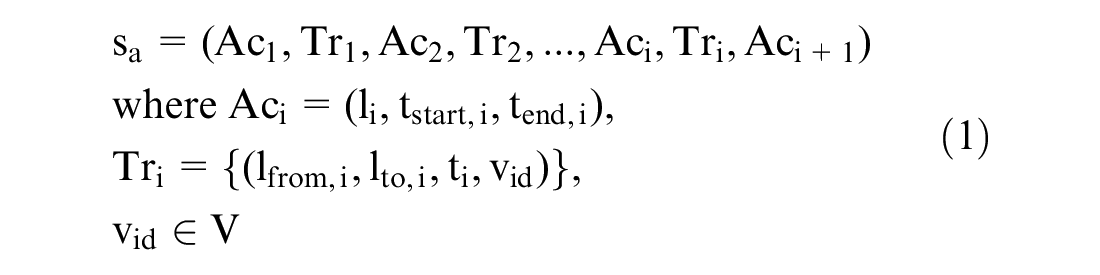
Each activity is defined by three elements: the location (
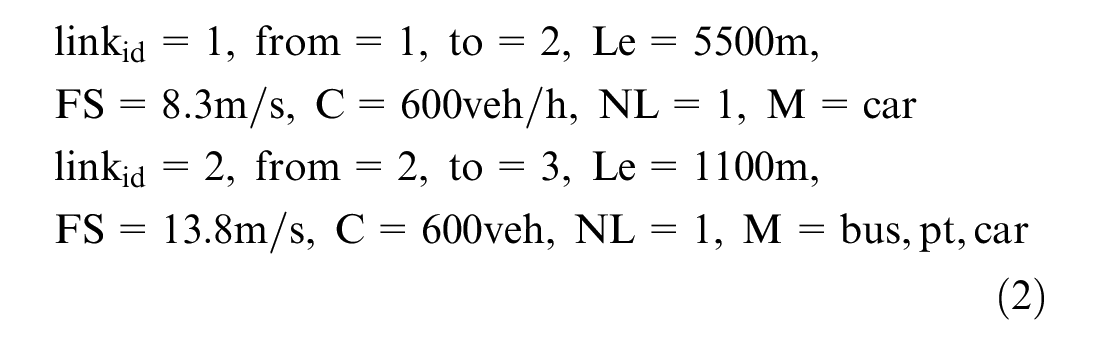
The movement of agents and vehicles is simulated in the network of Zürich. “Network” means the infrastructure on which agents (or vehicles) can move around. The network consists of nodes and links (which are referred to as vertices and edges in graph theory). The links in the network include the following information: link identity (
For simulating a road disruption, the approach consists of reducing the speed of the link to a minimal value. Initially, the link will still be used, but as the vehicles there exhibit a long travel time, it causes delays for agents passing the link, and eventually (in day-to-day iterations), all agents prefer to take a different route.
Each of the scenarios is investigated and compared in both equilibrium and non-equilibrium conditions. One non-equilibrium scenario is simulated as an information strategy in which agents do not have any information about the disruption to quantify the delay. It is assumed that under such an information strategy agents experience a long delay. Then, for the multi-level disruption management scenarios, the equilibrium condition is considered because the aim is to investigate passengers’ behavior, changes in the mode of traveling, and how they adapt their travel behavior according to the disruption and multi-level management. In equilibrium, agents can switch between different modes of traveling, but this characteristic is limited in the non-equilibrium condition, as agents who drive cars cannot leave their cars in the disrupted places, and therefore they are limited in their ability to switch to the PT-mode (or walk and bike) immediately.
Case Study
In this section, a road disruption scenario at a major bottleneck (Quaibrücke) in the urban network of Zürich city is simulated. The modeled urban region has 1.4 million inhabitants, and a great share of the traffic demand comes from commuting travelers. The bottleneck section exhibits a traffic of 60,000 cars per day. Seven tram lines and two bus lines move through the bottleneck in addition to such car traffic; around 76,000 people get on or off at the stop every day.
The authors would like to restate that the case study is a specific realistic network, but the methodology implemented in this research is not limited to any specific geographical situation and can be applied universally. The model/methodology referred to in this work is the software simulation used for the simulation. The case study refers to a network structure that describes a city or area. To implement the methodology, MATSim is used; however, this study could also be implemented in other simulation software. In the methodology, there is no specific modeling step specific to the Zürich area considered.
The population of Zürich is represented by agents at a 1% sampling rate; that is, each agent represents 100 persons in real life; the capacities of road links and vehicles are scaled accordingly, and in total, there are 12,072 agents. Quaibrücke is the bridge that connects two central places, Bellevue and Bürkliplatz, in Zürich. The simulated road disruption has the following criteria: the disruption is for the agents who aim to pass the bridge by car, whereas PT vehicles can still cross the bridge because the aim is to simulate a road disruption and evaluate the multimodal analysis of such disruption. The time dimension of the disruption is between 16:00 and 19:00 hours. The disrupted area on the map is distinguished with red color in Figure 1.
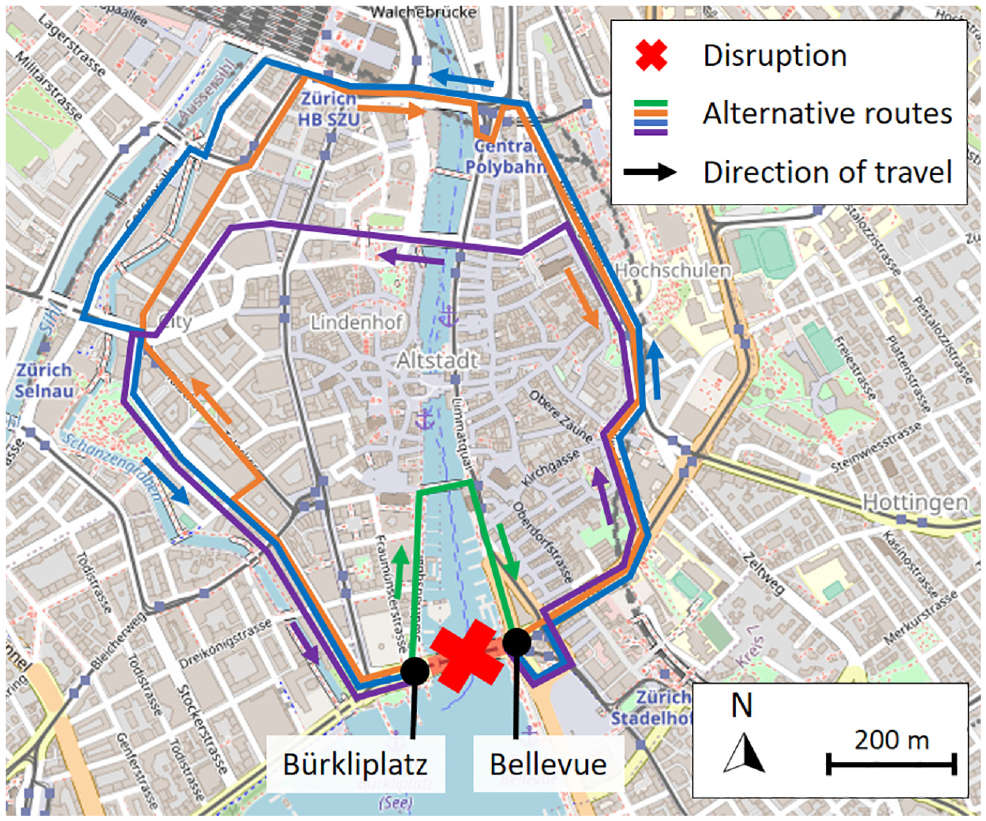
The investigated disruption (unavailability of a bridge) and the possible alternative routes resulting for passengers traveling between Bürkliplatz and Bellevue.
In the multi-level disruption management, the capacity/frequency of vehicles of tram line 10, line 11, line 33, and bus line 72 are increased. Such mentioned lines, with or without a transfer, allow for a connection between those stations (Bellevue to Bürkliplatz over the bottleneck). Tram 10 connects the Zürich central station to Zürich Oerlikon and then Zürich Flughafen, for instance. In the simulated test case, 65 agents (corresponding to 6,500 people in real life) cannot follow their usual route. These agents are referred to as “directly affected agents” and their delay and mode choice are analyzed in detail in the following. Understanding the number of directly affected agents is crucial because if we consider 65 agents with all the rest of the 12,007 agents (12,072 in total), then the total delay will fade among the whole population. Therefore, mode choice analysis is presented for both categories of whole agents and directly affected agents; and then the results are compared.
Disruption Management Actions
Information Management Actions
Two information scenarios are considered: no-information and full-information. In the “no-information” scenario, agents have no information about the disruption, and it is expected that agents will experience long delays. In the “full-information” scenario, agents have full information about the disruption, including its location and time dimensions. From the simulation point of view, this scenario is equivalent to the no-information scenario plus running it through the iterative process of day-to-day replanning in the agent-based simulation for several iterations to reach the equilibrium state. This scenario is an ideal solution, and the results for any other possible information management action would be worse than this ideal bound.
Adding New Lanes as Management Actions
As a disruption management action, the aim is to mitigate the negative impacts of the disruption by offering additional road space (i.e., traffic lanes) on relevant alternative routes. To achieve this aim, on-street parking spaces are removed, and the space is temporarily allocated to traffic by changing the functionality of the parking spaces. In other words, a new lane is added on each road. It is assumed that this reallocation of road space can be implemented at a very short time horizon. This applies, for instance, to a disruption announced a sufficient time ahead, and with appropriate policy about long-term on-street parking. In this case, short-term parking can be reallocated. The aim is to add new lanes to possible detour routes between Bürkliplatz and Bellevue when Quaibrücke is disrupted. There are two alternative bridges that can be used for cars. On OpenStreetMap, the routes are shown by putting Bürkliplatz as origin and Bellevue as destination and vice versa. Figure 1 shows possible alternative routes for which the lanes have been increased on the routes. Note that in Zürich one-way traffic is implemented at multiple locations; the detour routes, therefore, depend on the direction of travel.
It should be considered that if all the travelers switch to alternative routes rather than using the disrupted bridge, and in the afternoon peak hours, the estimation of time for passing alternative travel paths would significantly increase. Therefore, the scenario for increasing the lane on routes is introduced: “increased-road-capacity.” It is equivalent to the “full-information” scenario plus removing side parking space and changing the functionality of the parking space to extra lanes of the road.
Capacity Management Actions
As one of the goals of this study is to develop multi-level analysis of the traffic control, three scenarios are simulated in which the PT system helps to mitigate the delay from the disruption on the road in the Zürich network. Capacity management can be interpreted as both adding to the capacity of running services, for example, longer buses or trains, or adding to the frequency of running services. Such an analysis has also been investigated for one specific transport line within limited time and locations in Rahimi et al. ( 14 ). Their experiment showed that adding to the frequency of service on a line leads to less delay than adding capacity to that service. Therefore the following scenarios are considered.
The scenario “increased-PT-capacity-medium” is equivalent to “full-information” plus increasing the capacity of the whole public transport vehicles in the network by 39.67% which represents the medium term in the title of scenario. The scenario “increased-PT-capacity-large” is equivalent to “full-information” plus an increase in the capacity of the network by double (100%), termed as large. This study also considers one scenario in which the frequency (vehicle departures per hour) of running PT services has been increased. This allows us to test whether higher frequency in the PT network yields better performance in mitigating agents’ delay. This leads to a final scenario, “adding-frequency,” which is equivalent to “full-information” plus increasing the frequency of PT lines by double (100%) in the network.
Results
Delay Analysis and Related Cost
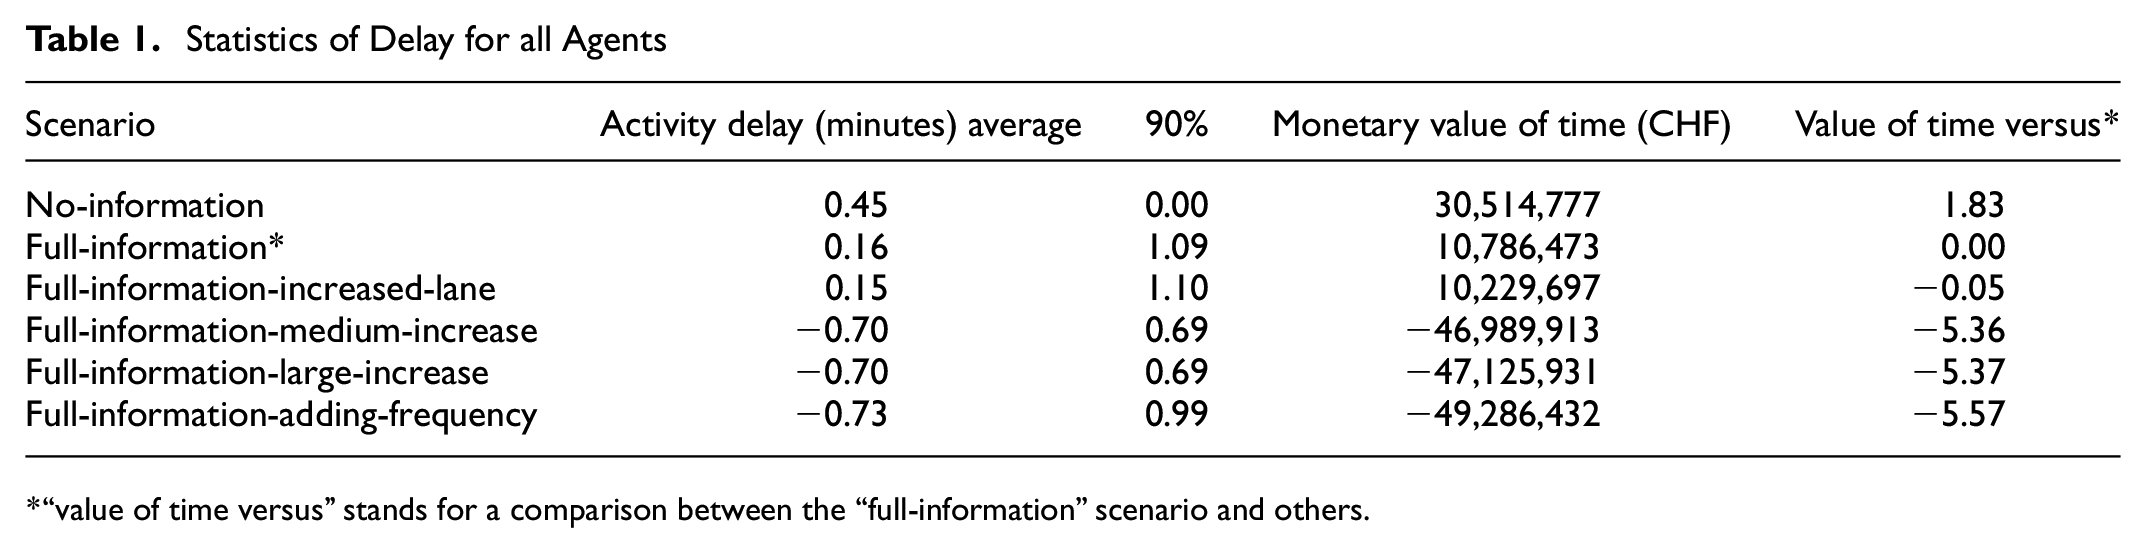
The delay that all the agents have experienced in the scenarios as a result of the disruption in Quaibrücke is presented in Table 1. The scenario “normal-day” is defined as a scenario without any disruption present. All the tested scenarios are compared with this scenario. The activity delay, which is the difference between the arrival time at activities in the scenario “normal-day” and the arrival time at activities’ locations, is studied in each disrupted scenario. In other words, the changes in delay between a considered scenario and a reference scenario are studied. The reference scenario is not reported in Table 1, as the entries would be zero. The average change in delay and its 90 percentile are reported. Knowing the total delays for agents, and the value of time, which is 27.81 CHF (Swiss francs) per hour ( 20 ), and the sampling rate of the agents, we can estimate the monetary value of delay (in CHF) for the entire set of travelers, which can be found in Table 1. The column “value of time versus*” stands for a comparison between the “full-information” scenario and others.
Statistics of Delay for all Agents
“value of time versus” stands for a comparison between the “full-information” scenario and others.
Table 1 illustrates that the “no-information” scenario causes an average of 0.45 min delay to the agents in Zürich. This small delay can be explained by the number of agents directly affected by the disruption, just 65, corresponding to 0.05% of all agents (12,072). As only a small share of agents are directly affected by the disruption, the delay of those agents is analyzed in a separate table. In the equilibrium situation, when agents adapt their travel plan based on the new disruption situation and through the iterations, the amount of the delay that agents experienced is reduced by 64.4 % (compared with the “full-information” scenario). Table 1 also shows that by multi-level management and allocating the parking spaces on particular routes to driving space, the amount of delay experienced by agents can be reduced by 66.6%, compared with the “no-information” scenario. However, building road infrastructure for such a solution requires a major investment. In Table 1, a negative value for average delay shows that agents have arrived earlier in such scenarios compared with the normal day (“normal-day”). The analysis also shows that 19% of all agents experience earlier arrival in the increased PT capacity scenario, and 24% in the increased PT frequency scenario. Table 1 also shows that increasing the frequency of running services results in less delay (earlier arrival time) on average compared with increasing the capacity (see the two scenarios, “full-information-adding-frequency” and “full-information-large-increase”).
For a more thorough investigation, the directly affected agents who pass the Quaibrücke between 16:00 and 19:00 in their car, on a normal day (i.e., without a disruption present) are identified. These directly affected agents amount to be 65 (where each agent represents 1% of the Zürich population). In the disruption situation, these 65 agents cannot follow their planned routes. Directly affected agents will find another route for their travel plan through the iteration as they learn that the disrupted roads are not available because of the large amount of delay that they experienced so they would choose another route for their travel plan. The delay experienced by directly affected agents in the equilibrium situation with the disruption condition is shown in Table 2. Similar to Table 1, the activity delays are compared with the “normal-day” scenario for each disrupted scenario.
Statistics of Delay for Directly Affected Agents
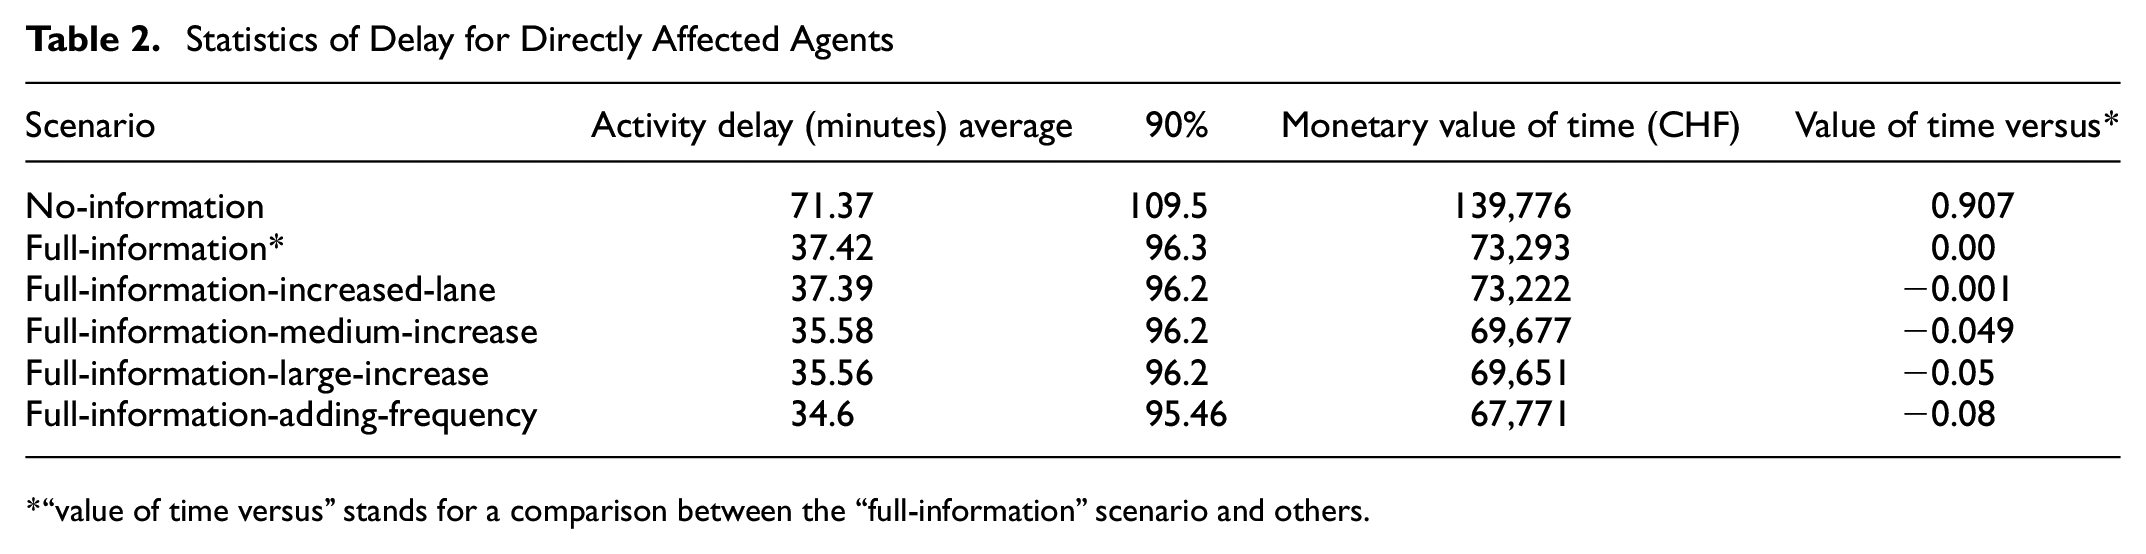
“value of time versus” stands for a comparison between the “full-information” scenario and others.
By comparing the average value in Tables 1 and 2, we can see a substantial difference in the delay time between the average delay for all the agents and the delay of directly affected agents. It means that a disruption at the Quaibrücke affects most agents only in a very limited manner, whereas it causes, on average more than 30 min delay for directly affected agents. Table 2 shows that disruption in Quaibrücke yields an average of 71.37 min delay for directly affected agents, in the no-information scenario, when agents have neither any information about the disruption nor any disruption management. Through the equilibrium solution, the delay experienced by directly affected agents is reduced by 47%, comparing the “no-information” scenario with the “full-information” scenario.
Mode Choice Analysis
Mode Choice Analysis for all Agents
This section investigates the effects of disruption and related multi-level management on the mode choice behavior of the agents, that is, the percentage of agents who shift to other modes of travel. The statistics of the mode choice percentage under different scenarios are shown in Figure 2. The x-axis shows the scenarios, and the y-axis shows the percentage, varying from 0 to 100; the mode choices are represented in the legend with specific colors. Different types of PT-mode are shown with the variation of green colors, represented as bus, train, tram, and others. The sum of all mentioned types of PT-mode is specified with the red line over the green sections in the bar chart.
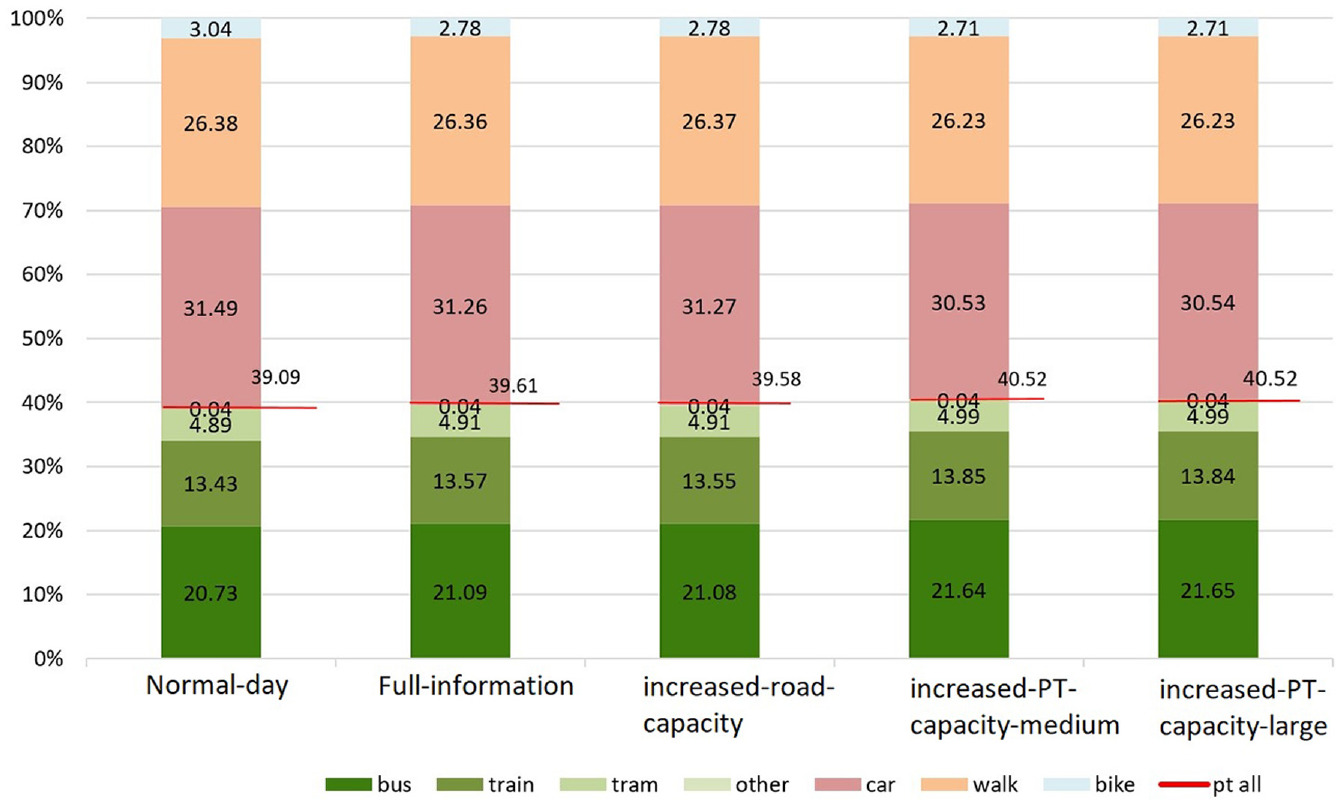
Mode choice analysis in scenarios for all 12,072 agents (based on each stage that agents traveled).
From Figure 2, it is visible that in all scenarios PT-mode is the most used means of transport in one day by the agents. In more detail, among the PT-modes, the bus-mode is the most used mode among the agents. After PT-mode, the second most used mode of traveling is the car, followed by walking and cycling. Figure 2 shows that by increasing the capacity (“increased-PT-capacity-medium” and “increased-PT-capacity-large” scenarios), 0.91% more agents are willing to use the PT-mode, while 0.28 % fewer agents are willing to use car-mode, compared with the “full-information” scenario. Comparing “increased-PT-capacity-medium” and “increased-PT-capacity-large” scenarios, we can see little difference between these two scenarios, which means that by increasing the capacity to the medium level, the travel demand is covered at a reasonable level. By comparing “normal-day” and “full-information” scenarios, it can be seen that under the latter (equilibrium solution) in the case of disruption without any disruption management, car-mode decreases by 0.23%. The road disruption also results in an increase of 0.52% in use of PT-mode. From Figure 2, it can be seen that increasing the capacity of transit vehicles by a medium level results in an increase of 1.43% in use of PT-mode compared with the “normal-day” scenario.
Mode Choice Analysis for Directly Affected Agents
This section quantifies the mode choice in scenarios for agents directly affected by the disruption. The statistics of the mode choice percentage under different scenarios are shown in Figure 3. Similar to Figure 2, the x-axis shows the scenarios, and the y-axis shows the percentage, varying from 0 to 100; the mode choices are represented in the legend with specific colors.
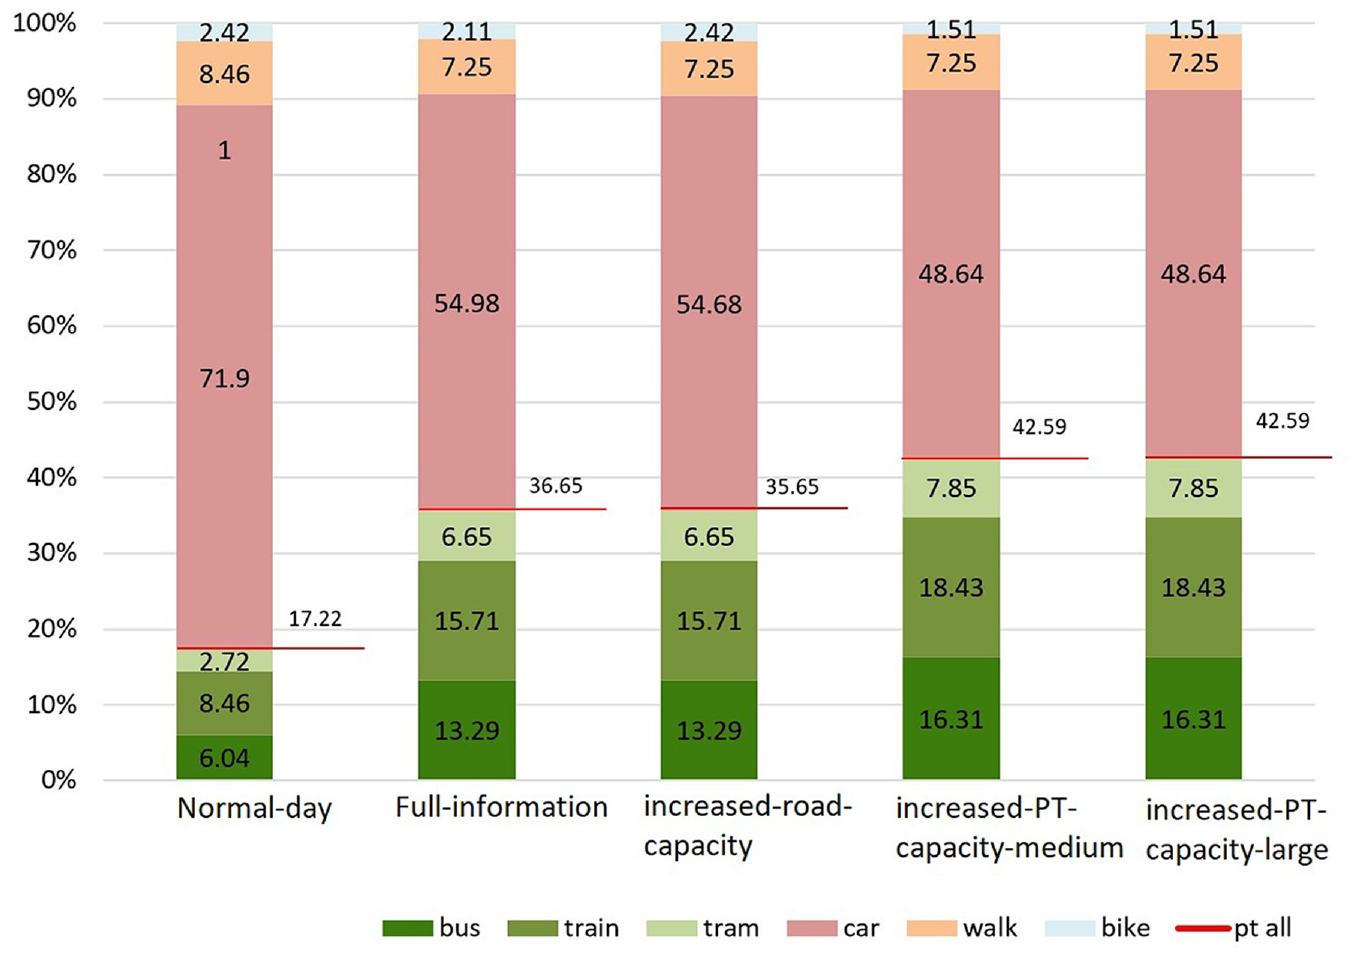
Mode choice analysis in scenarios for the 65 directly affected agents (based on each stage that agents traveled).
It can be seen in Figure 3 that the disruption causes the directly affected agents to reduce their usage of cars in all four scenarios compared with “normal-day.” In Figure 3, it is visible that implementing a disruption management strategy, that is, increasing the capacity for transit vehicles, leads to more usage of all sorts of PT-mode by the directly affected agents. More precisely, in the scenario “increased-PT-capacity-large,” directly affected agents use bus-mode (shown dark green in Figure 3), nearly 10% more compared with the “normal-day” scenario and around 3% more compared with the “full-information” and “increased-road-capacity” scenarios. From the results presented in Figure 3, we can learn about the disruption at hand: (i) Road disruption yields an increase in PT-mode by 18.43% by the directly affected agents, compared with the “full-information” and “normal-day” scenarios. In other words, 18.43% of directly affected road users shift to PT-mode. (ii) Road disruption results in a decrease in car usage. Directly affected agents in the scenario “full-information” use car-mode 16.92% less than in the scenario “normal-day.” (iii) By comparing the “full-information” and “increased-PT-capacity-medium” scenarios, we can see that increasing the capacity of the vehicles encourages agents to use trains 3% more, the same for buses, while it leads to an increase of just 1.2% in the usage of trams. Such an observation implies the priority of buses and trains over trams for the test population and provides a hint for operators that they may focus more on providing more infrastructure for buses and trains for the simulation area when they aim to improve the infrastructure and services. The model has implications for other networks as well and can help operators with better evaluation of the demand from the PT/road users.
Conclusion
Disruption management systems should consider communication between stakeholders and travelers, embrace the strength of complementary modes, and enhance collaboration between the modes, leading to increased system reliability, robustness, and recovery. This research proposes a multi-level disruption management of road disruption in a multimodal network and assesses the corresponding impacts. The problem is to estimate the effects of such disruptions comprehensively and in a rigorous manner, across different travel modes and actions of operators. Therefore, to reach the aim of this study, an extension to a state-of-the-art agent-based simulation was also developed ( 19 ). To test and verify the simulated model, a test case was considered focusing on a bottleneck in the city center of Zürich.
From the analysis of the test case and after analyzing the delay and mode choice of travelers in the simulated scenarios for the road disruption, the following outcomes can be concluded: the results indicate that the disruption yields significant delay for directly affected agents, without any information and disruption management. If passengers have perfect information, the delay is reduced by 47% (Table 2). In general, having more information about the disruption situation and the available alternative routes results in less delay for travelers. Road disruptions also reduce the usage of cars as a mode of travel and increase the usage of PT-mode. The results show that the disruption leads 18.43% of directly affected road users to shift to PT-mode. Increasing the capacity of transit lines leads to more usage of PT-mode by the directly affected agents. More precisely, in the scenario “increased-PT-capacity-large,” directly affected agents use bus-mode nearly 10% more compared with “normal-day” and around 3% more compared with the “full-information” and “increased-road-capacity” scenarios. The results also show that by implementing multi-level management and increasing the capacity of PT vehicles, 19% of all agents experience earlier arrival. These findings can support traffic and PT operators with valuable insights to support their reactions to disruption and its network effects. Such findings can help them in making better decisions on disruption management actions to mitigate the adverse effects and congestion.
Future research may further advance the proposed model to test scenarios based on a dynamic adjustment of demand, based on the within-day situation and compare the results. Another research direction can include the associated resource costs for increasing the PT capacity or frequency. It is challenging to estimate the costs for the operators, though, as they depend on working conditions, processes, and internal agreements. For some scenarios, such as adding extra lanes, the operator costs might be more than the value of the time saved for travelers.
Footnotes
Author Contributions
The authors confirm contribution to the paper as follows: study conception and design: M. R. Siegrist, F. Corman; data collection: M. R. Siegrist; analysis and interpretation of results: M. R. Siegrist, B. Büchel, F. Corman; draft manuscript preparation: M. R. Siegrist, B. Büchel, F. Corman. All authors reviewed the results and approved the final version of the manuscript.
Declaration of Conflicting Interests
The author(s) declared no potential conflicts of interest with respect to the research, authorship, and/or publication of this article.
Funding
The author(s) disclosed receipt of the following financial support for the research, authorship, and/or publication of this article: Research supported by the Swiss National Science Foundation under NCCR Automation, grant agreement 51AU40_180545.