
Abstract
The worldwide growth of bike-sharing systems demonstrates their mass appeal and success. Montreal’s bike-sharing system, BIXI, opened in 2009, is now one of the largest in the world, and has drastically expanded since being taken over by the City of Montreal in 2014. The system now has over 750 stations up from 459 in 2014. This paper analyzes BIXI’s expansion through the lens of equity, revealing how factors including race and income can explain its growth. First, we mapped high-need equity areas that BIXI could have plausibly expanded to, and those that BIXI actually expanded to. We then created a logistic regression model with dissemination areas that gained new access to BIXI as the dependent variable, and income, race, the number of nearby trips, the population count, and the number of bus stops as independent explanatory variables, and controlled for distance from existing stations. Our regression findings demonstrated that race and income were statistically significant in explaining BIXI’s expansion, with a general trend that BIXI was expanding into lower-income neighborhoods and neighborhoods with a greater proportion of visible minorities, as defined by Statistics Canada. Finally, we compared the same explanatory variables in areas that had gained access to BIXI stations, and those in areas that had not but plausibly could have to show the socioeconomic differences in areas gaining new access to service.
There are over 1,900 bike-sharing systems currently operating around the world, demonstrating the appeal of bike-sharing systems as a mobility option ( 1 ). Many cities worldwide have embraced docked bike-sharing systems in recent years to address a wide variety of societal goals, including reduction of greenhouse gas emissions and congestion, as well as making cities more livable and healthier. These systems often give customers the option to purchase yearly, monthly, seasonal, and daily passes, as well as the option to pay for a single trip. In general, after paying, users scan a barcode or enter a code to unlock a bike of their choosing and can drop it off at any other station, or “dock.” Systems often have time limits after which users pay additional costs. E-bikes have also become part of the fleet in several city’s systems, which can help overcome difficulties related to distance and slope. Essentially, bike-sharing systems allow users to cycle for transportation without the liability or other barriers to bicycle ownership.
The benefits of bike-sharing programs are well documented, including positive environmental, health, and economic impacts for cities and their populations ( 2 , 3 ). Studies on multiple cities claim that bike-sharing systems reduce carbon dioxide and nitric oxide emissions, as some bicycle trips may replace trips made by vehicles ( 4 , 5 ). For population health, bike sharing can encourage a model shift that encourages more physical activity, even if the shift is from trips by public transportation or walking, as studied in Montreal, Washington, D.C., and Minneapolis ( 6 , 7 ). Health savings include lower mortality rates by reducing traffic fatalities and a reduction of disability-adjusted life years, which also has a positive economic impact ( 8 , 9 ). Research also documents how bike sharing plays an important role in first- and last mile trips, especially with rail transit ( 6 , 10 , 11 ).
Like any transport system or transit agency, bike-sharing networks must grapple with sets of goals and objectives that may require trade-offs. For example, whether to plan network expansion with a goal to reduce driving, or to ensure that lower-income areas or racialized populations have convenient access to the system. Although there is a large body of literature looking at transport and mobility justice, the literature on cycling equity is younger ( 12 , 13 ). Recently scholars have been examining the distribution of cycling infrastructure (including bike-share networks) and the planning process to understand how equity goals are being considered ( 14 ). Given these numerous benefits, access to bike sharing can be a valuable commodity. However, access may not always be equal within cities, and it is therefore important for bike-sharing programs to be conscious of their network’s equity. As cities expand their bike-sharing networks, equity may even be a motivating factor.
Montreal’s docked bike-sharing program, BIXI, began in 2009, and has since become one of the largest bike-sharing programs in North America. Originally owned by PBSC, a private company, the City of Montreal bought BIXI in 2014 after PBSC filed for bankruptcy. Each year, BIXI adds new stations; initially starting with a system of 300 stations and 3,000 bikes ( 15 ) users currently have access to over 750 stations located around Montreal. The geographic area served by BIXI has also more than doubled.
In any given year, BIXI service has expanded to people who did not previously have access to the system. BIXI does not make public its strategy for expansion, so it is unclear which factors explain how the system has expanded, or whether equity or other considerations played a role. When deciding where to locate new stations, BIXI, like any bike-share provider, is likely to consider a variety of factors, such as filling gaps in the current system, responding to demand, improving connectivity and integration with public transit, and the location of existing cycling infrastructure. Other factors, such as community outreach and engagement, may also play a role. A desire to ensure that population groups that may lack access to other modes might also be a consideration. Of course, BIXI relies on ridership to stay solvent, so a “rational” business case points toward the need to recruit and retain riders, meaning they would, for example, prioritize more densely populated areas over those with fewer people. These considerations therefore place constraints on where new service is likely to be offered. Obviously, new stations would not plausibly be located beyond a reasonable distance threshold from existing stations (or from new stations established that year).
This paper analyzes the factors influencing the expansion of BIXI from 2014 to 2022, specifically, examining those served by the current system and how that has changed over time. It addresses the following research questions: What factors explain the growth of the BIXI network? Who is being served by the current system and how has that changed over time? Previous research has examined cross sectional analyses of bike-sharing systems but very few have looked at changes over time. This analysis fills a gap in how bike-sharing systems change over time, and offers insights into the decision-making process that determines which populations are served. We focused on one of the largest bike-sharing systems in North America, one that has seen rapid growth and expansion in recent years.
Note, from 2009 to 2014, the system expanded from 300 to 411 stations ( 15 , 16 ). However, the locations of these stations and the corresponding trip data are not published on BIXI’s website as, at that time, it was operated as a private company. Furthermore, beginning the analysis in 2014 allowed us to capture BIXI’s relationship with equity as a public company, where it is more obligated to serve all populations and not seek profits. Interestingly, BIXI’s mission, according to their website, is to offer “an active mode of transportation contributing to the health and well-being of Quebecers” ( 17 ). Although this is certainly a beneficial mission, BIXI does not mention equity in its mission statement, its vision for the company, or its values. This lack of detail from the company motivated us to engage in this equity analysis of BIXI service.
The rest of the paper is structured as follows. The next section presents a brief review of relevant literature concerning equity issues in cycling planning, including bike-share infrastructure, followed by a description of the data and methods used in the analysis. Finally, we discuss the results and implications for the planning of BIXI in Montreal and for similar systems elsewhere.
Literature Review
The link between bike sharing and equity has been the subject of recent scholarship. Previous research demonstrates that the placement of bike stations can favor areas with higher-incomes, better education, or a greater proportion of white individuals ( 18 , 19 ). In Chicago, Qian and Jaller found that bike-share demand was lower in disadvantaged areas, as were subscription rates, possibly owing to financial barriers ( 20 ). In Tampa, Chen et al. used Gini coefficients to compare bike-sharing accessibility, finding that half of the accessibility to bike sharing was available to only 2% of the population ( 21 ). Beairsto et al. found that bike sharing in Glasgow was more accessible to areas with lower deprivation, and examined the suitability of geographic areas for new stations using an approach that factored in a deprivation quintile of each area ( 22 ). In multiple cities, non-white people and people with lower incomes have cited financial and logistical barriers to using a bike-sharing system, including the use of a credit card as payment, high membership costs, financial liabilities if the bike breaks, and a lack of knowledge on how to use bike-sharing ( 23 ). With the known inequities in bike sharing, Caggiani et al. developed an equity-based model for station placement that factors in public transportation and budget availability ( 24 ).
Research has also compared the equity of bike-sharing systems across cities. A comparative study of bike-share equity in Boston, New York City, Washington, D.C., Chicago, Denver, and Seattle compared census variables in the service area to block groups outside of the service area in the city, finding that almost all cities had a greater proportion of white and college-educated people with incomes over US$100,000 per year in the service area than outside it ( 25 ). In Canada, a study of five major Canadian cities (Vancouver, Hamilton, Toronto, Montreal, and Ottawa-Gatineau), classified dissemination areas (DAs) into quintiles based on the 2011 Pampalon deprivation index ( 26 ), a well-known index developed in the Canadian context. This study determined that access to BIXI in Montreal was relatively equal across quintiles, whereas Vancouver and Ottawa-Gatineau provided greater access to the least deprived quintiles, and therefore favored more advantaged populations.
However, although the equity of bike-sharing systems has been widely explored in existing scholarship, most studies limit their time frame to a single year, or examine a system before and after one change. One such study on Citi Bike in New York City examined the equity of a bike-sharing system before and after an expansion of the system in 2015, finding that the expansion increased the number of high-poverty census tracts with stations from 12% to 16%, but still disproportionately provided access to high-income census tracts ( 27 ). Another study examined the 2018 “equity expansion” in Hamilton, Ontario’s bike-sharing network using travel time to stations as a measure of access, finding that the equity expansion did increase overall accessibility, but areas with lower median household incomes still had lower access to bike sharing at certain time thresholds ( 28 ). Finally, Goodman and Cheshire examined how gender and socioeconomic groups were affected by the 2012 expansion of London’s bike-sharing system and the doubling of its prices, revealing how the proportion of trips made by women did not significantly change after the expansion, but the proportion of trips by people in highly deprived areas doubled ( 29 ). Although before and after studies provide meaningful results on how one expansion can have an impact on equity and accessibility, a study with more expansions over a longer period of time would be able to more accurately capture how equity evolves in a bike-sharing system.
The COVID-19 pandemic has also influenced bike sharing. In New York City, bike sharing was more resilient than the subway with regard to ridership drop during the pandemic, and possibly influenced a modal shift from users riding the subway to using a bike-sharing system ( 30 ). Qiao compared bike sharing in Philadelphia before and after COVID-19, finding that bike sharing shifted to serve more recreational trip needs as opposed to commuting needs ( 31 ). The recent expansions of BIXI have taken place in the context of the pandemic, which may have accelerated changes to bike-sharing systems.
Data and Methods
This section describes how the data used in this analysis were selected, cleaned, and analyzed. To undertake this analysis, we needed to capture a variety of explanatory variables that would help explain why stations were located where they were. These included information collected in the census (total population, median household income, and other socioeconomic variables) as well as spatial characteristics such as proximity to transit stations and other BIXI stations.
Data for trips and stations were obtained through BIXI’s open data portal on the BIXI Montreal website. Trips from 2014 to 2022 were combined into one dataset, with columns for the start station ID, end station ID, start time, end time, and year. Note that, although BIXI has been running since 2009, comprehensive trip-level data are only available after 2014. Station datasets in this study from 2014 to 2020 are the same as the publicly available BIXI data, whereas the 2021 and 2022 datasets were checked for accuracy and the location of one station was adjusted for accuracy. Furthermore, in 2021 BIXI incorporated several trial locations for short periods of time. This meant that the number of unique station locations was unusually high, as several stations were temporary before being relocated. To more accurately reflect the reality of the network and whether a given area had access to a BIXI station, we removed any station in operation for fewer than 30 days in a year. This reduced the 2021 station count from 829 to 775, in line with media reports of how many stations were operational in 2021. This method of filtering was also performed on the 2022 dataset, removing six temporary stations.
Census data for DAs in the Montreal census metropolitan area (CMA) were obtained through the “cancensus” package in R, which accesses Canadian Census data and geometries from Statistics Canada. DAs are the smallest geographic area with standardized census data in Canada, containing between 400 and 700 people. Variables for median household income and the number of visible minorities were also included at the DA level, and the variable for number of visible minorities was divided by its parent vector to create a column with the proportion of visible minorities within a DA. Please note that “visible minority” is a term used by Statistics Canada to describe “persons, other than Aboriginal peoples, who are non-Caucasian in race or non-white in colour.” Census variables from both the 2016 and 2021 Canadian Census were used to more accurately capture the DAs, with each year of the analysis being assigned to the closest census year
We first intersected Montreal DA and station datasets for each year, adding columns with True/False values to indicate whether a DA had a station present. To determine whether a DA had access to the system, we then created 500-m buffers around stations and intersected the buffers with the DAs, allowing us to know which DAs could reach a BIXI station within 500 m.
As trips made in the previous year could affect where BIXI decides to place new stations, in other words, responding to observed demand, we summed the number of trips that originated from each DA. To calculate an accurate number of trips per DA, trips were filtered by year, grouped by the station from which they originated, and summed before being joined back to each station dataset. Next, Voronoi polygons were created around station points in each yearly station dataset, which were then intersected with the DA dataset. The area of each intersected polygon was divided by the area of the Voronoi polygons after the intersection to find the proportion of the intersection. This proportion was then multiplied by the number of trips in each Voronoi polygon, and then grouped by the DA ID and summed for each DA. This allowed us to represent the annual number of trips originating from each DA. We further calculated a sum of counts in adjoining DAs to account for nearby BIXI demand, our rationale being that (all things being equal) BIXI could plausibly choose to locate in areas that have already demonstrated demand to cater to those riders as well as to recruit new users.
A “new access” variable was then created by finding DAs with BIXI stations that did not have a station in the previous year: this was repeated for each year analyzed. Finally, the distance between each DA and the nearest BIXI station was calculated for each year. This dataset, which included the DA ID value, values for income and proportion of visible minorities, True/False values indicating whether a BIXI station was within the DA for each year, trip counts per DA for each year, and the distance to the nearest BIXI station per year.
To determine the population served by the system, we generated 500-m buffers around the stations, intersecting those with DAs, multiplying the population of the DAs by the proportion of the DA that fell within the service area, and summing the total. Population data from the 2016 census were used for 2014 through 2018, and population data from the 2021 census were used for 2019 through 2022.
We accounted for how BIXI would not consider every location in the Montreal CMA to be a realistic location for a new station, for example, new bike docks that are too far from existing docks would not be feasible sites. To do this, we defined a “plausible expansion zone” for each year. This was done by finding, for each year, the distance for each new BIXI station to the nearest existing station, and then taking the maximum such value. This represented the furthest expansion of the BIXI system in a given year, and thus gave us a realistic and empirical approximation of how large BIXI’s conception of possible space for expansion was within any given year. This allowed us to filter out DAs that could plausibly have obtained BIXI access for each year for use in mapping and modeling.
We modeled whether a DA received access to BIXI as a binary outcome in a logistic regression. We used the aforementioned method to filter DAs as being in the plausible expansion zone, and included only DAs that gained new access or did not have a BIXI station, which excluded DAs that already had access. Each yearly model used the new access variable as the dependent binary variable, with income, proportion of visible minorities, trips, number of transit stops, and population as the independent explanatory variables. We considered income and visible minority status to be the variables of interest as these capture meaningful aspects of equity-deserving groups, while controlling for elements of the built form that are likely to affect station placement (transit stops) and observed demand (number of BIXI trips in adjoining DAs in the previous year). We also looked at other explanatory variables such as metro access; however, as the BIXI system was already focused on serving these areas, they held no explanatory power in the models. All mapping and analyses were undertaken using the R programming language.
The next section presents the findings, starting with a general overview of how the system has changed, before moving on to the results of the regression models.
Findings
Figure 1 presents the extent of BIXI’s change over 9 years. BIXI’s station count increased by over 66% from 2014 to 2022, and every year saw an increase in the total number of stations. Furthermore, from 2014 to 2022, yearly BIXI trips increased by almost 180%. The COVID-19 pandemic clearly had an impact on BIXI trips in 2020 and 2021, which both had fewer trips than in 2019, but trips in 2022 surpassed by far the previous record for yearly trips.
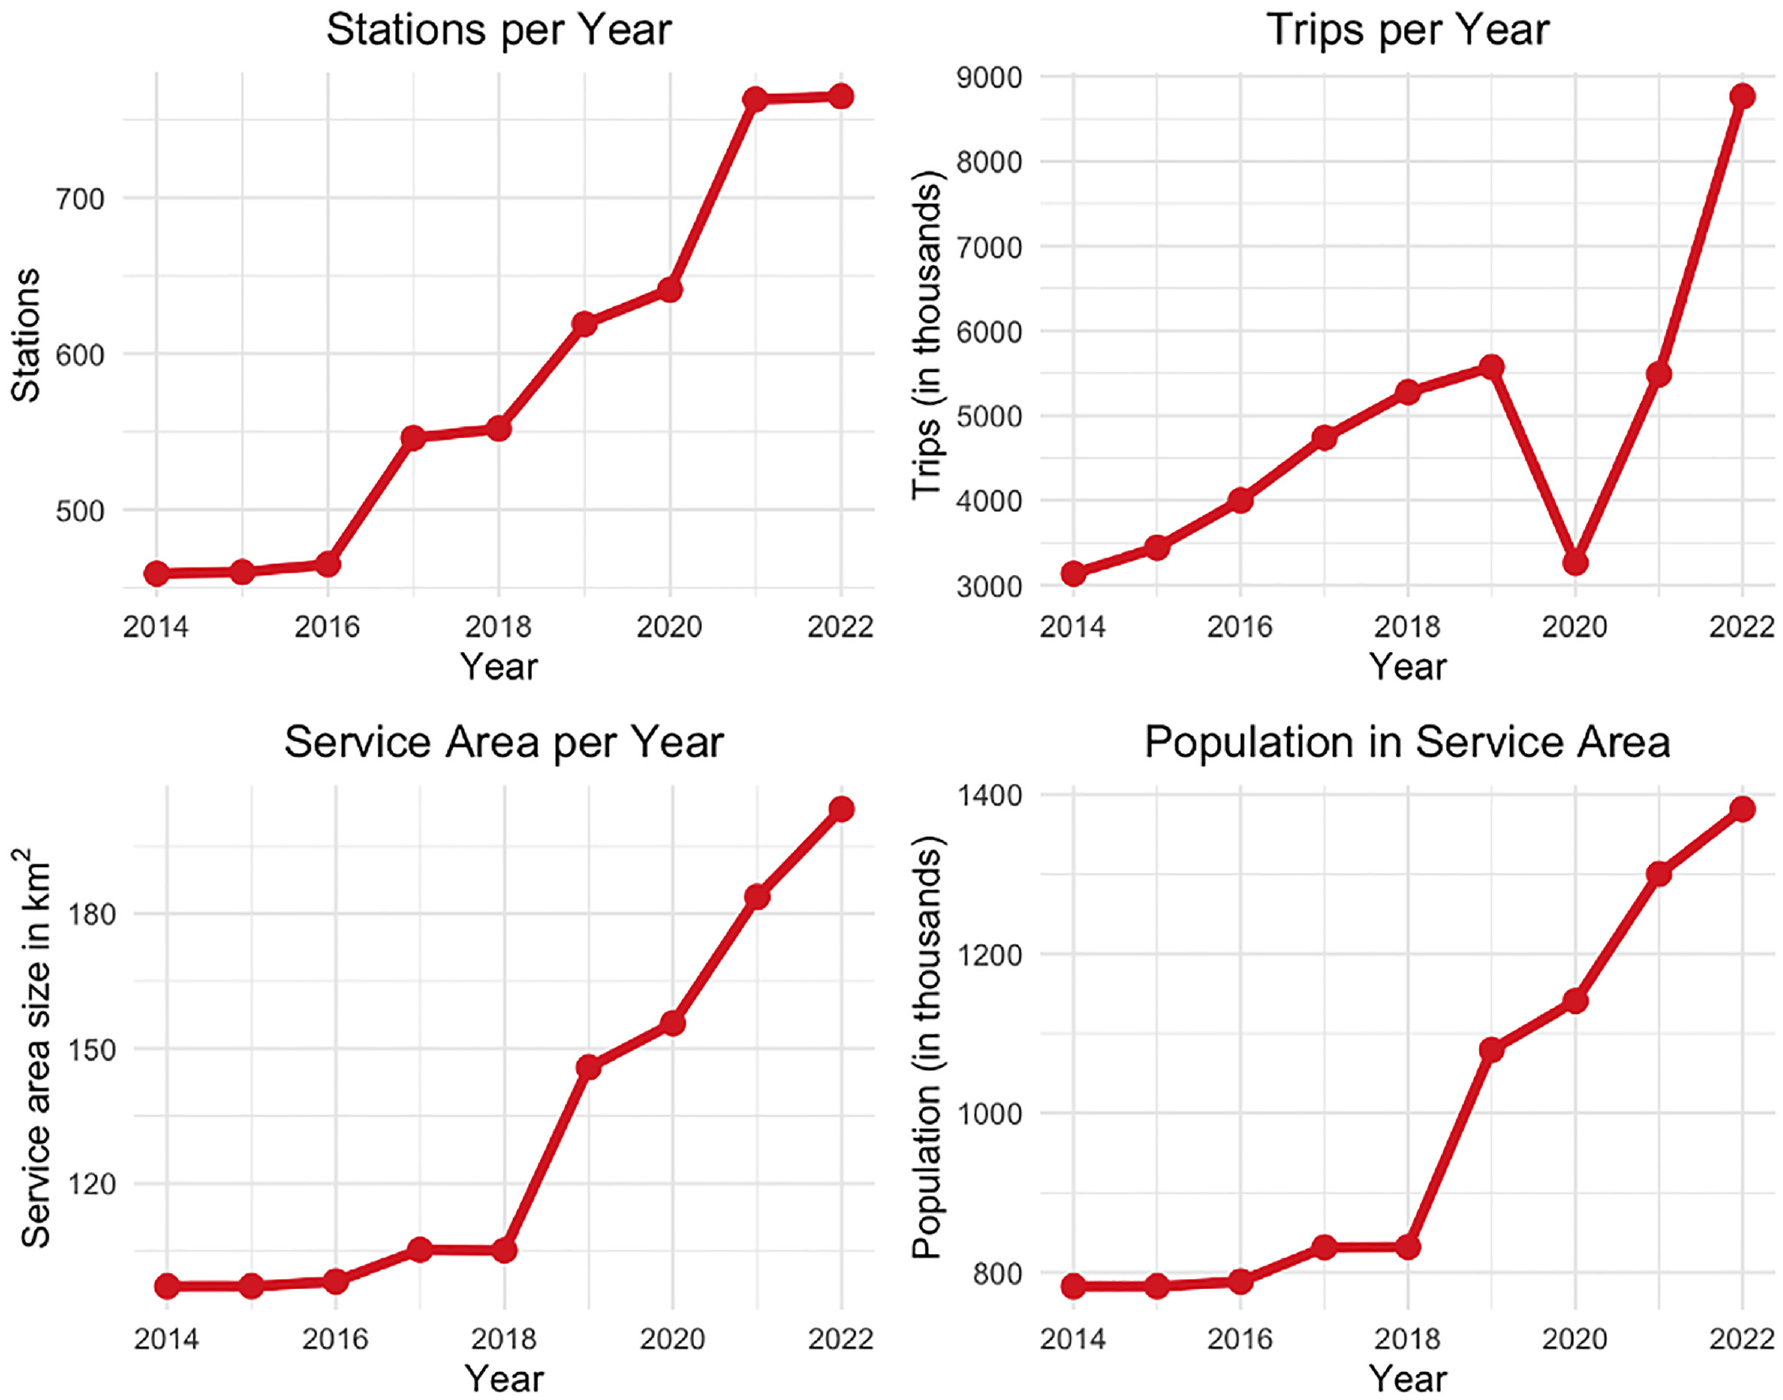
BIXI’s expansion, 2014 to 2022.
Service area is a measurement of the total area covered by 500-m buffers around each station. BIXI’s service area increased by over 100% from 2014 to 2022, now covering over 203 km2 both on and off the Island of Montreal. With the exception of 2018, BIXI’s service area has steadily increased every year, with particularly large increases in 2019 and 2021. BIXI now operates well outside of Montreal’s city boundaries, with stations located in Laval and Longueuil, (areas to the northwest and southeast of the main island) as well as within several smaller municipalities on the island. From 2014 to 2022, the number of people in BIXI’s service area increased by almost 77%, from 782,668 to 1,381,844. There has been an increase in population within the service area in each year, demonstrating how BIXI has expanded to reach new users. As of 2022, BIXI serves about one-third of the 4.3 million people in Montreal’s metro area, and over two-thirds of the 2 million people on the Island of Montreal, including municipalities on the island that are not part of the city of Montreal.
Figure 2 shows the locations of BIXI stations for each year of the study with darker points representing new stations for each year between 2014 and 2022. Note that the 2014 map shows all stations present that year without a distinction between new and existing stations. These maps allow us to visually inspect how the system has expanded over time. The 500 stations in 2014 were concentrated in the downtown core, and by 2017 the service covered more of the areas to the south and northwest. Notable increases in station numbers occurred in 2017, 2019, and 2021 with 81, 67, and 134 new stations respectively. A much larger part of the Saint Lawrence River waterfront is covered by these expansions. Interestingly, BIXI stations have grown to eventually serve each of the 68 stations of the Montreal Metro system (not shown on the map). By 2019 each metro station had an associated BIXI station. The service area maps (Figure 3) also illustrate this growth by showing which DAs have access to a station during each year.
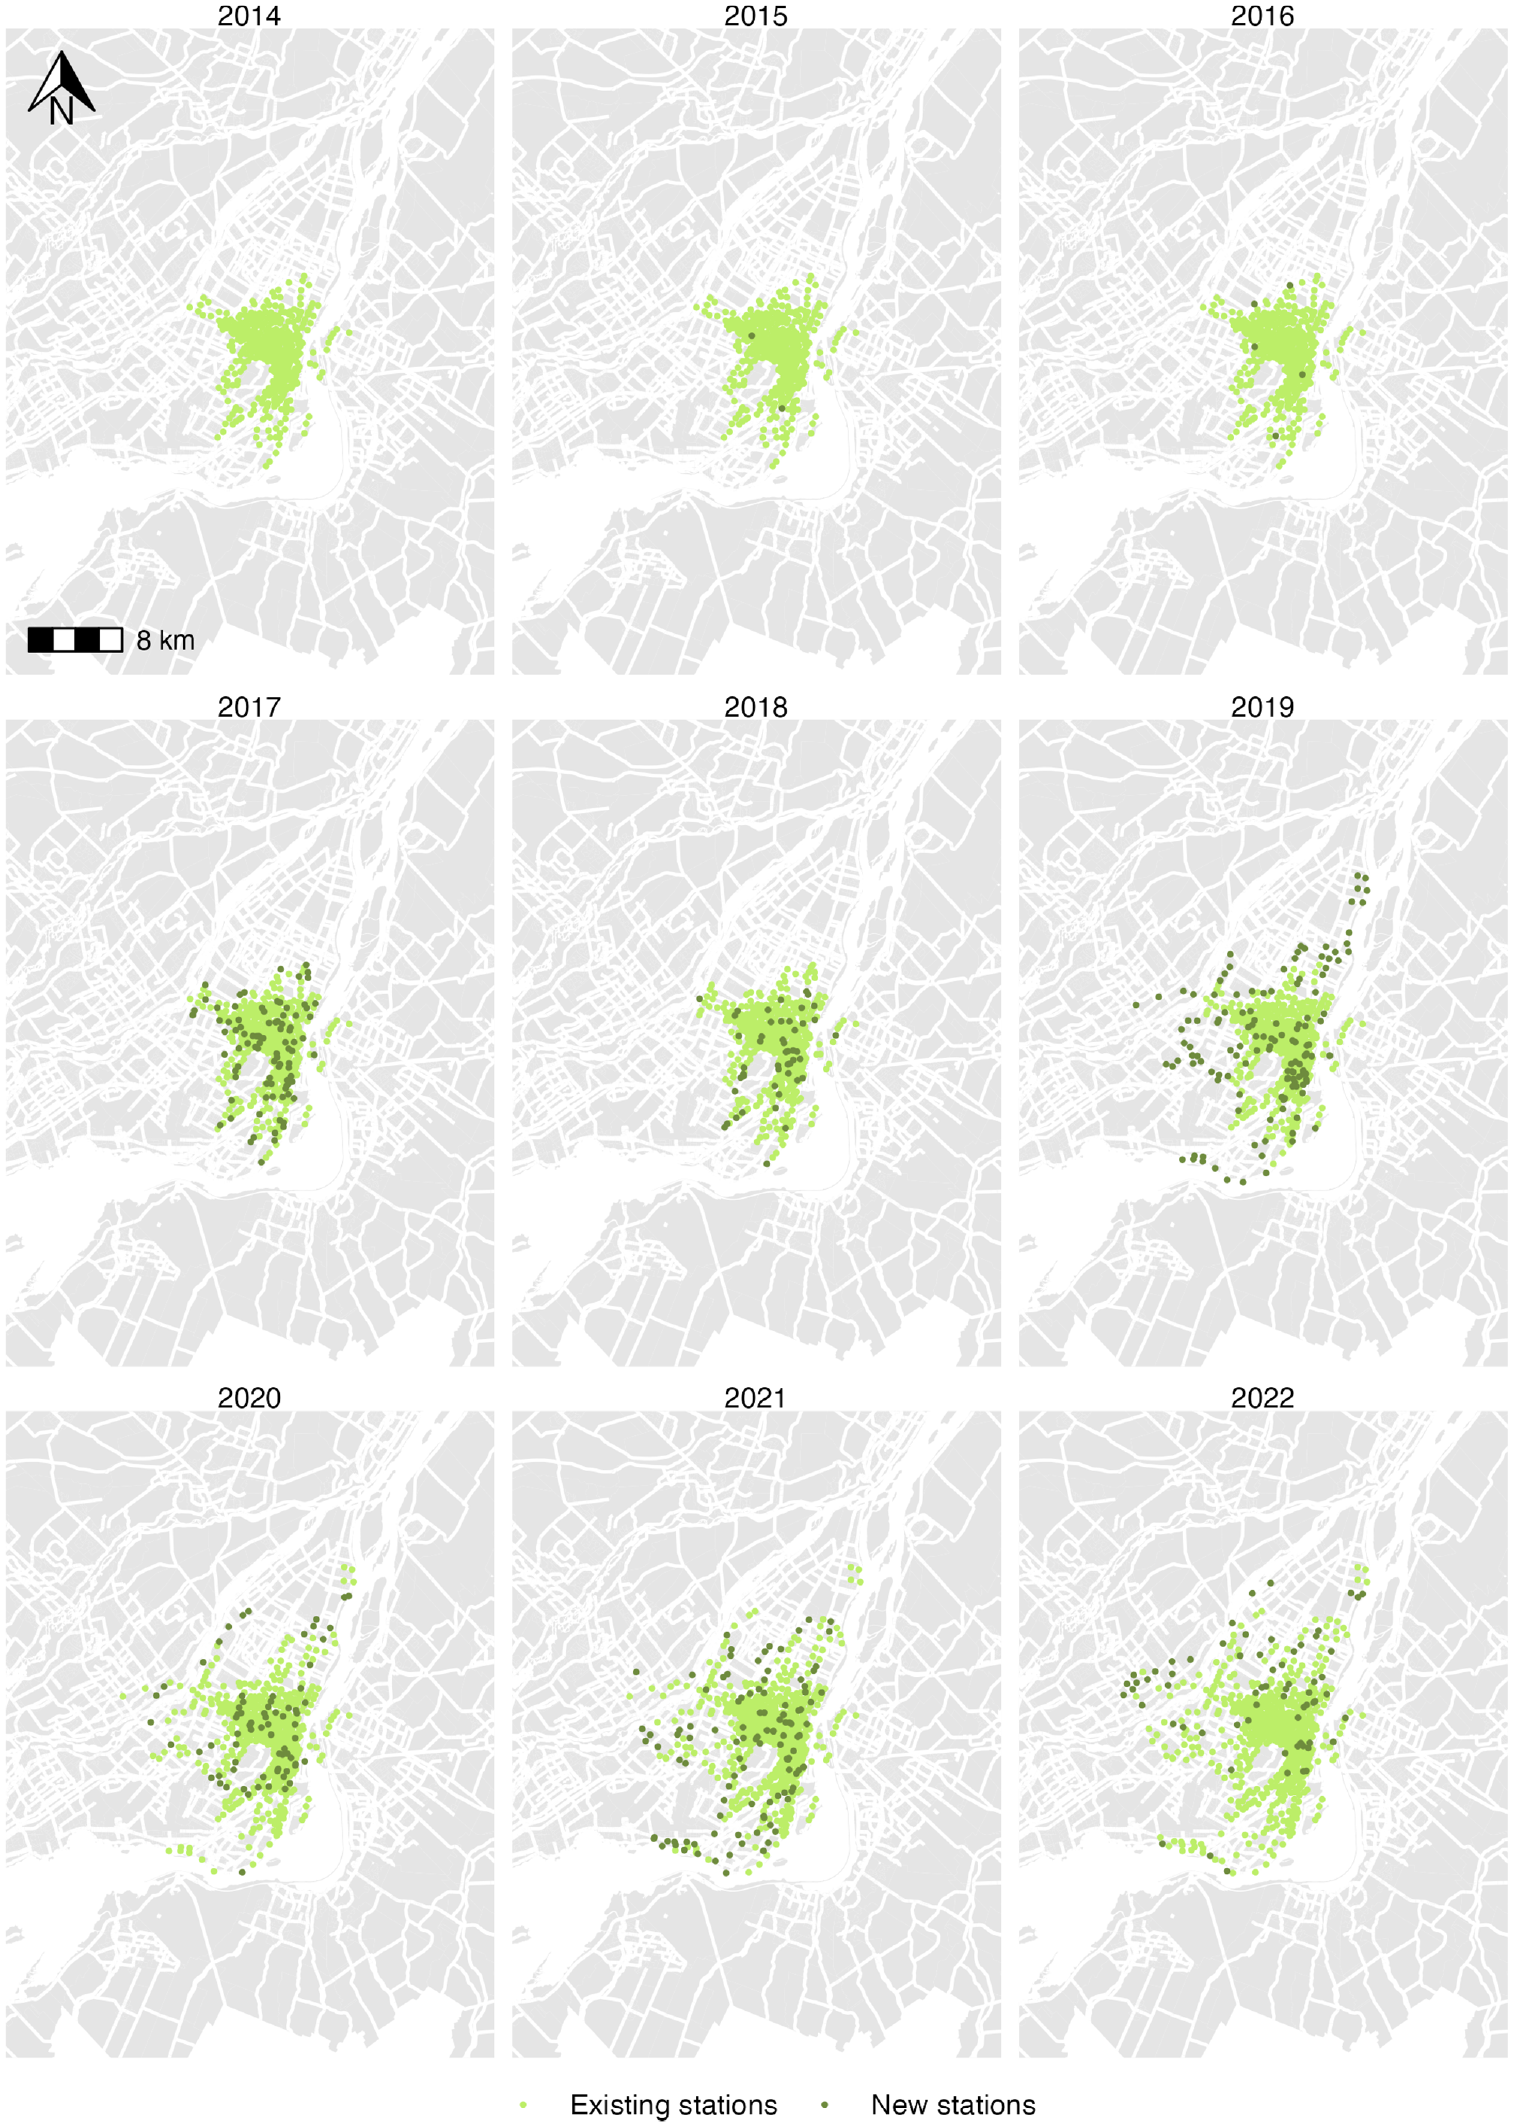
Location of new and existing stations, 2014 to 2022.
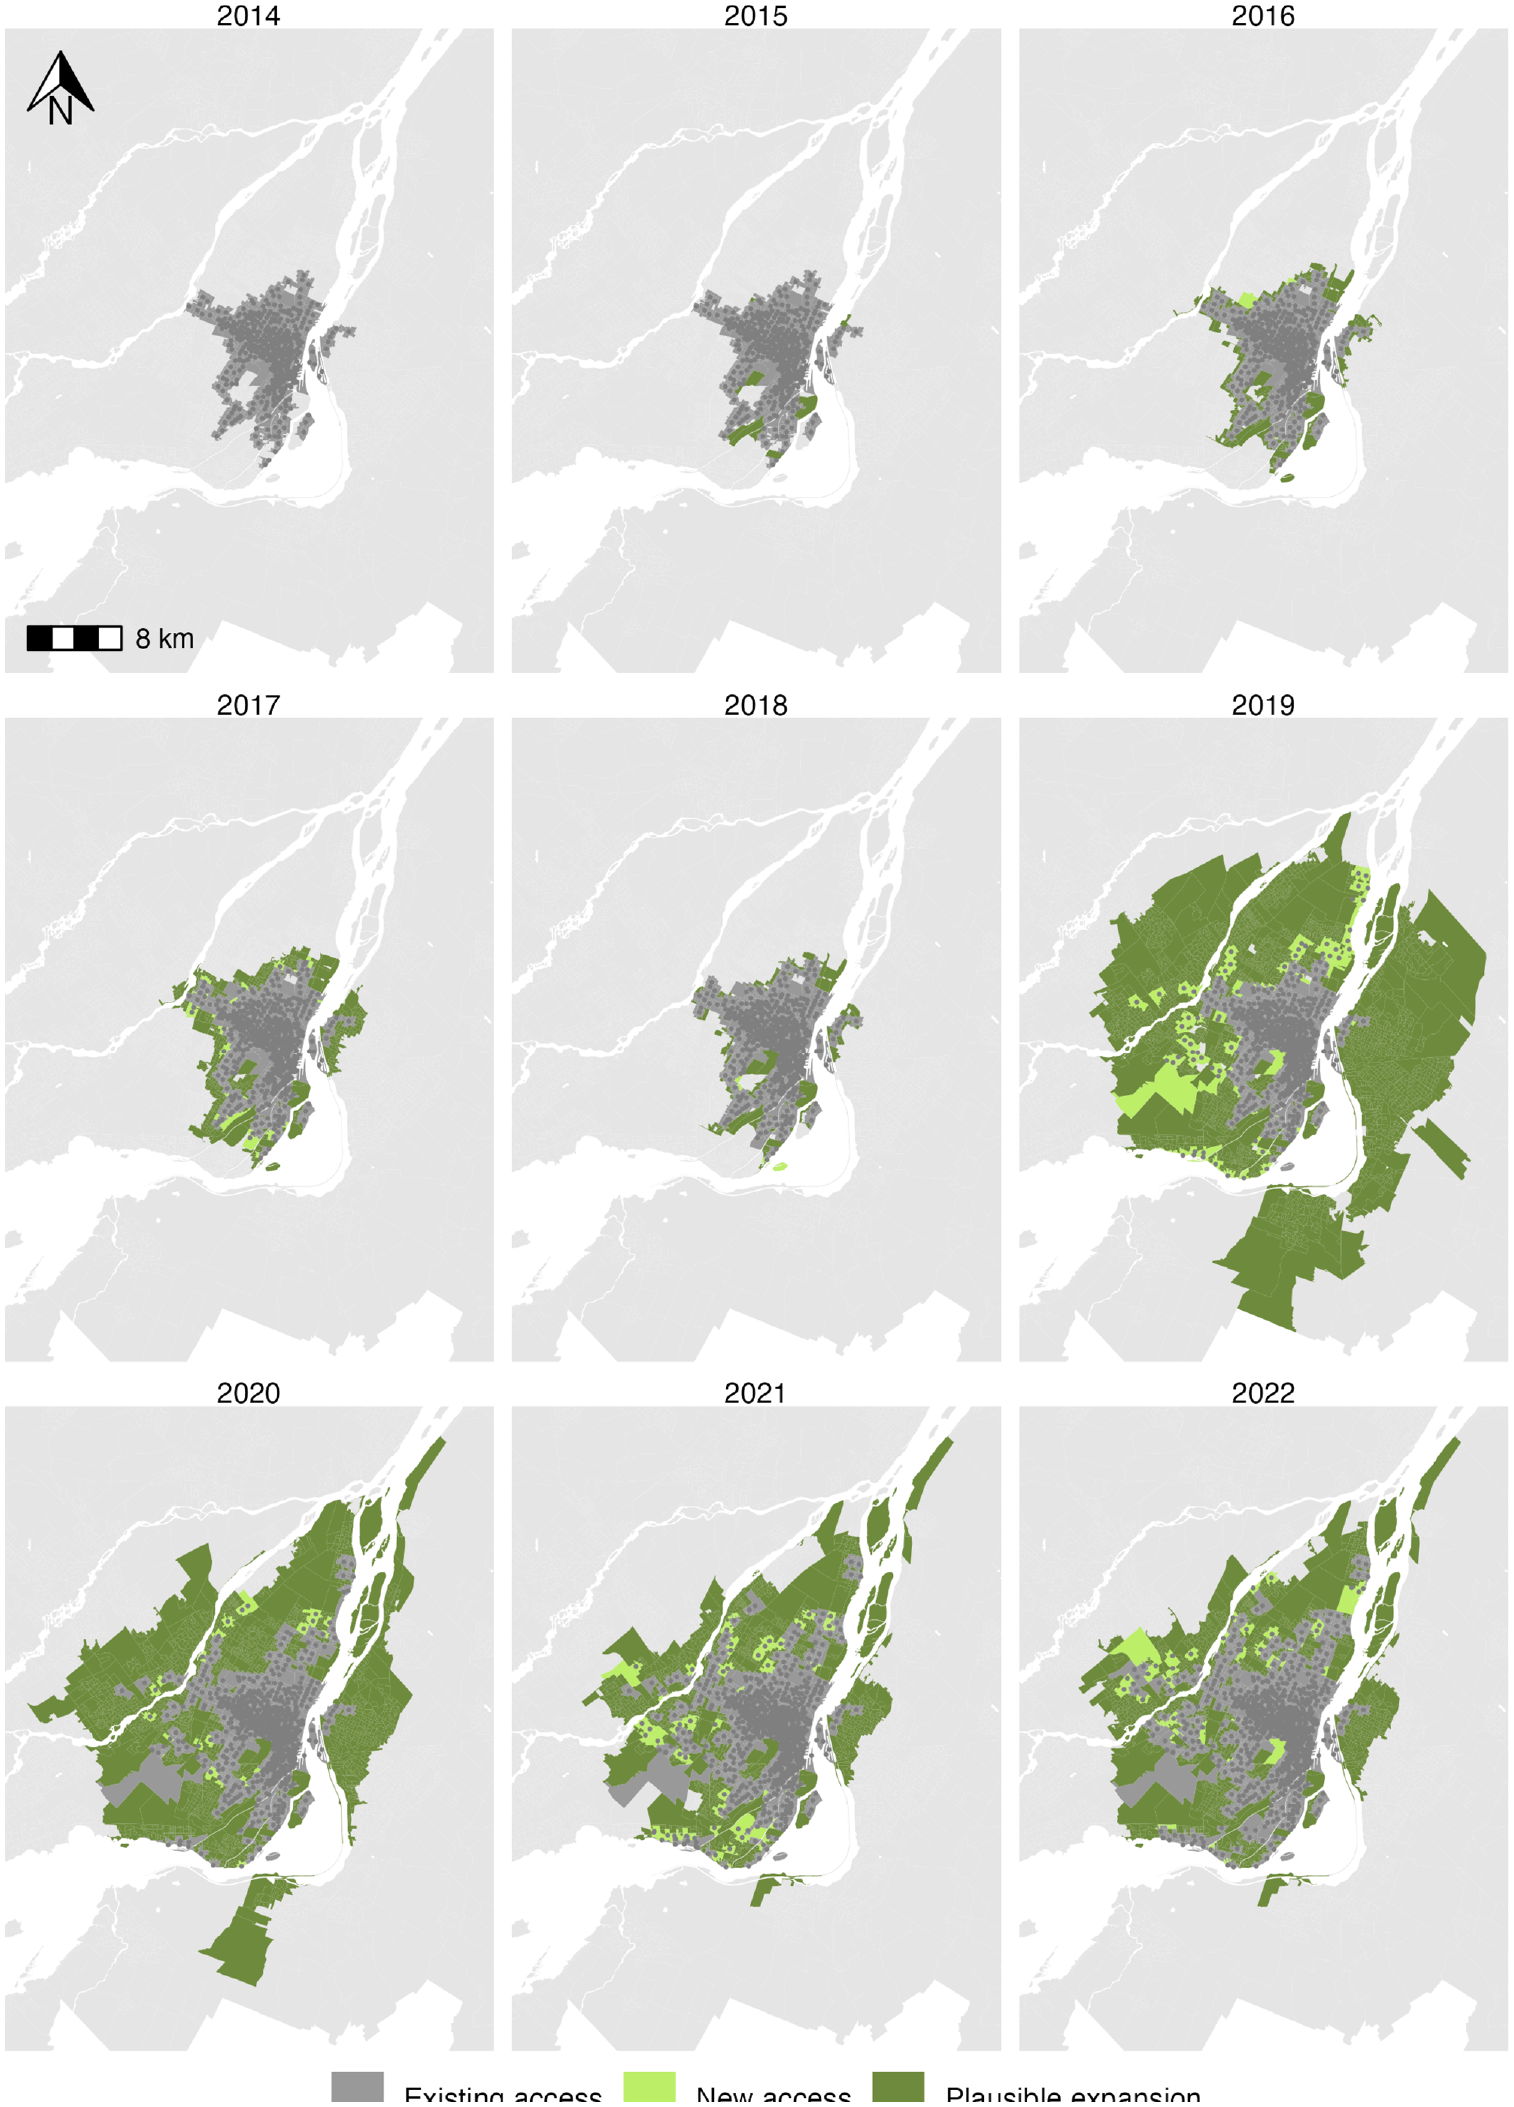
BIXI change in access area, 2014 to 2022.
DAs in the service area, meaning they are within 500 m of a station, are labeled as having “Existing access,” based on their status at any given year, whereas DAs that are new for that year are labeled as “New access.” If a DA is within the plausible expansion zone (described in the Methods section), it is labeled as “Plausible expansion,” meaning that BIXI could have plausibly expanded to that area in the following year based on its proximity to the existing network and the expanse of their planned changes. From 2014 to 2018, BIXI’s service area gradually expanded, with many stations added to DAs on the edge of the system or in gaps within the system. In 2019, BIXI made major expansions into Laval (the large island to the northwest of Montreal) as well as to areas of the city to the northeast and southwest. From 2020 to 2022, BIXI filled gaps from the 2019 expansions, and a few more DAs along the periphery of the service area gained new access. As of 2022, the system is still centered on the downtown area, but has made significant changes to give people access to a much larger area of the region, for instance along the Saint Lawrence River in both directions.
Figure 3 depicts which DAs gained new access to BIXI, and which areas BIXI could have plausibly expanded to, given the distance of their expansions that year. Although expansions from 2014 to 2018 were relatively small, mostly giving access to DAs that already bordered the existing access area, the 2019 expansion went well beyond the area of existing access. Expansions from 2020 to 2022 largely filled in gaps from the 2019 expansion, or expanded to DAs that bordered the existing access area, but at a much larger scale than from 2014 to 2018.
Figure 4 depicts DAs that gained new access to BIXI stations and DAs that could have plausibly gained access to BIXI stations, including areas of low and high need based on income quintiles.
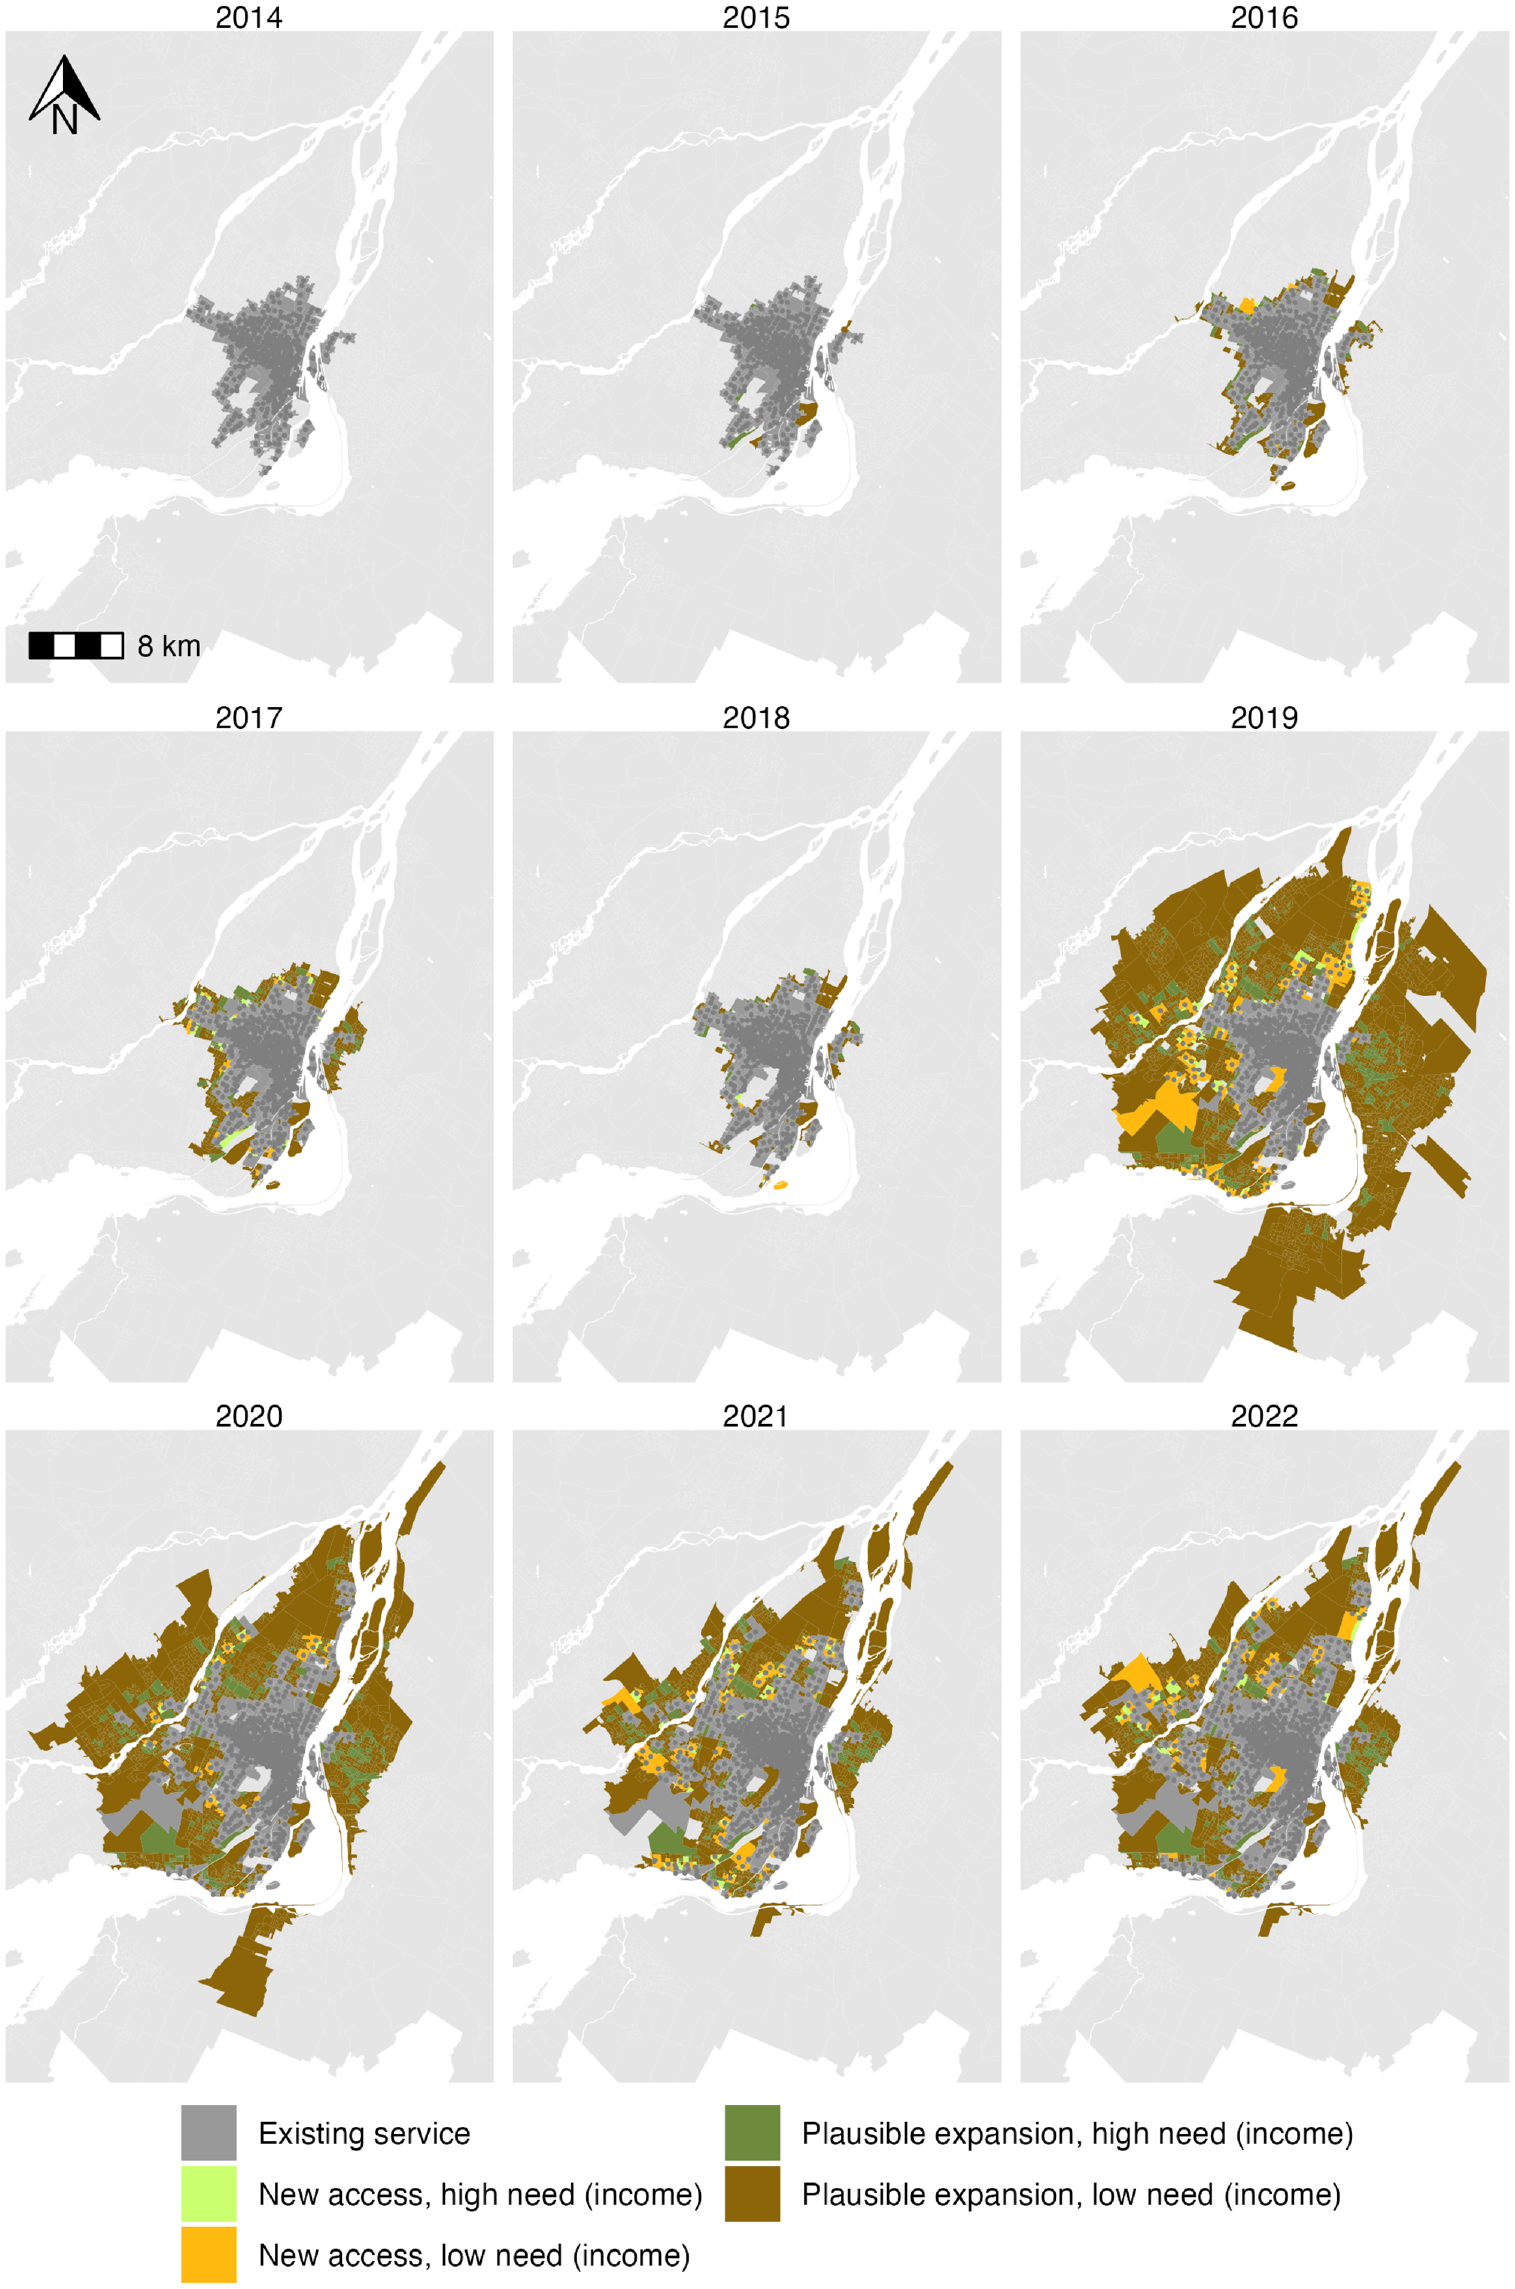
Access and income bivariate maps.
These maps demonstrate that BIXI is expanding to both areas of low and high need based on income, even though most plausible expansion DAs are classified as low need based on income.
Figure 5 depicts DAs that gained new access to BIXI stations and DAs that could have plausibly gained access to BIXI stations, including areas of low and high need based on the proportion of visible minorities within a DA. These maps demonstrate that there were far fewer high-need areas for expansion than low-need areas, based on the proportion of visible minorities. Therefore, most DAs with new access were DAs that had a low equity need. This points to how, given the geographic possibilities of where BIXI could have expanded, visible minority areas were neither excluded nor prioritized.
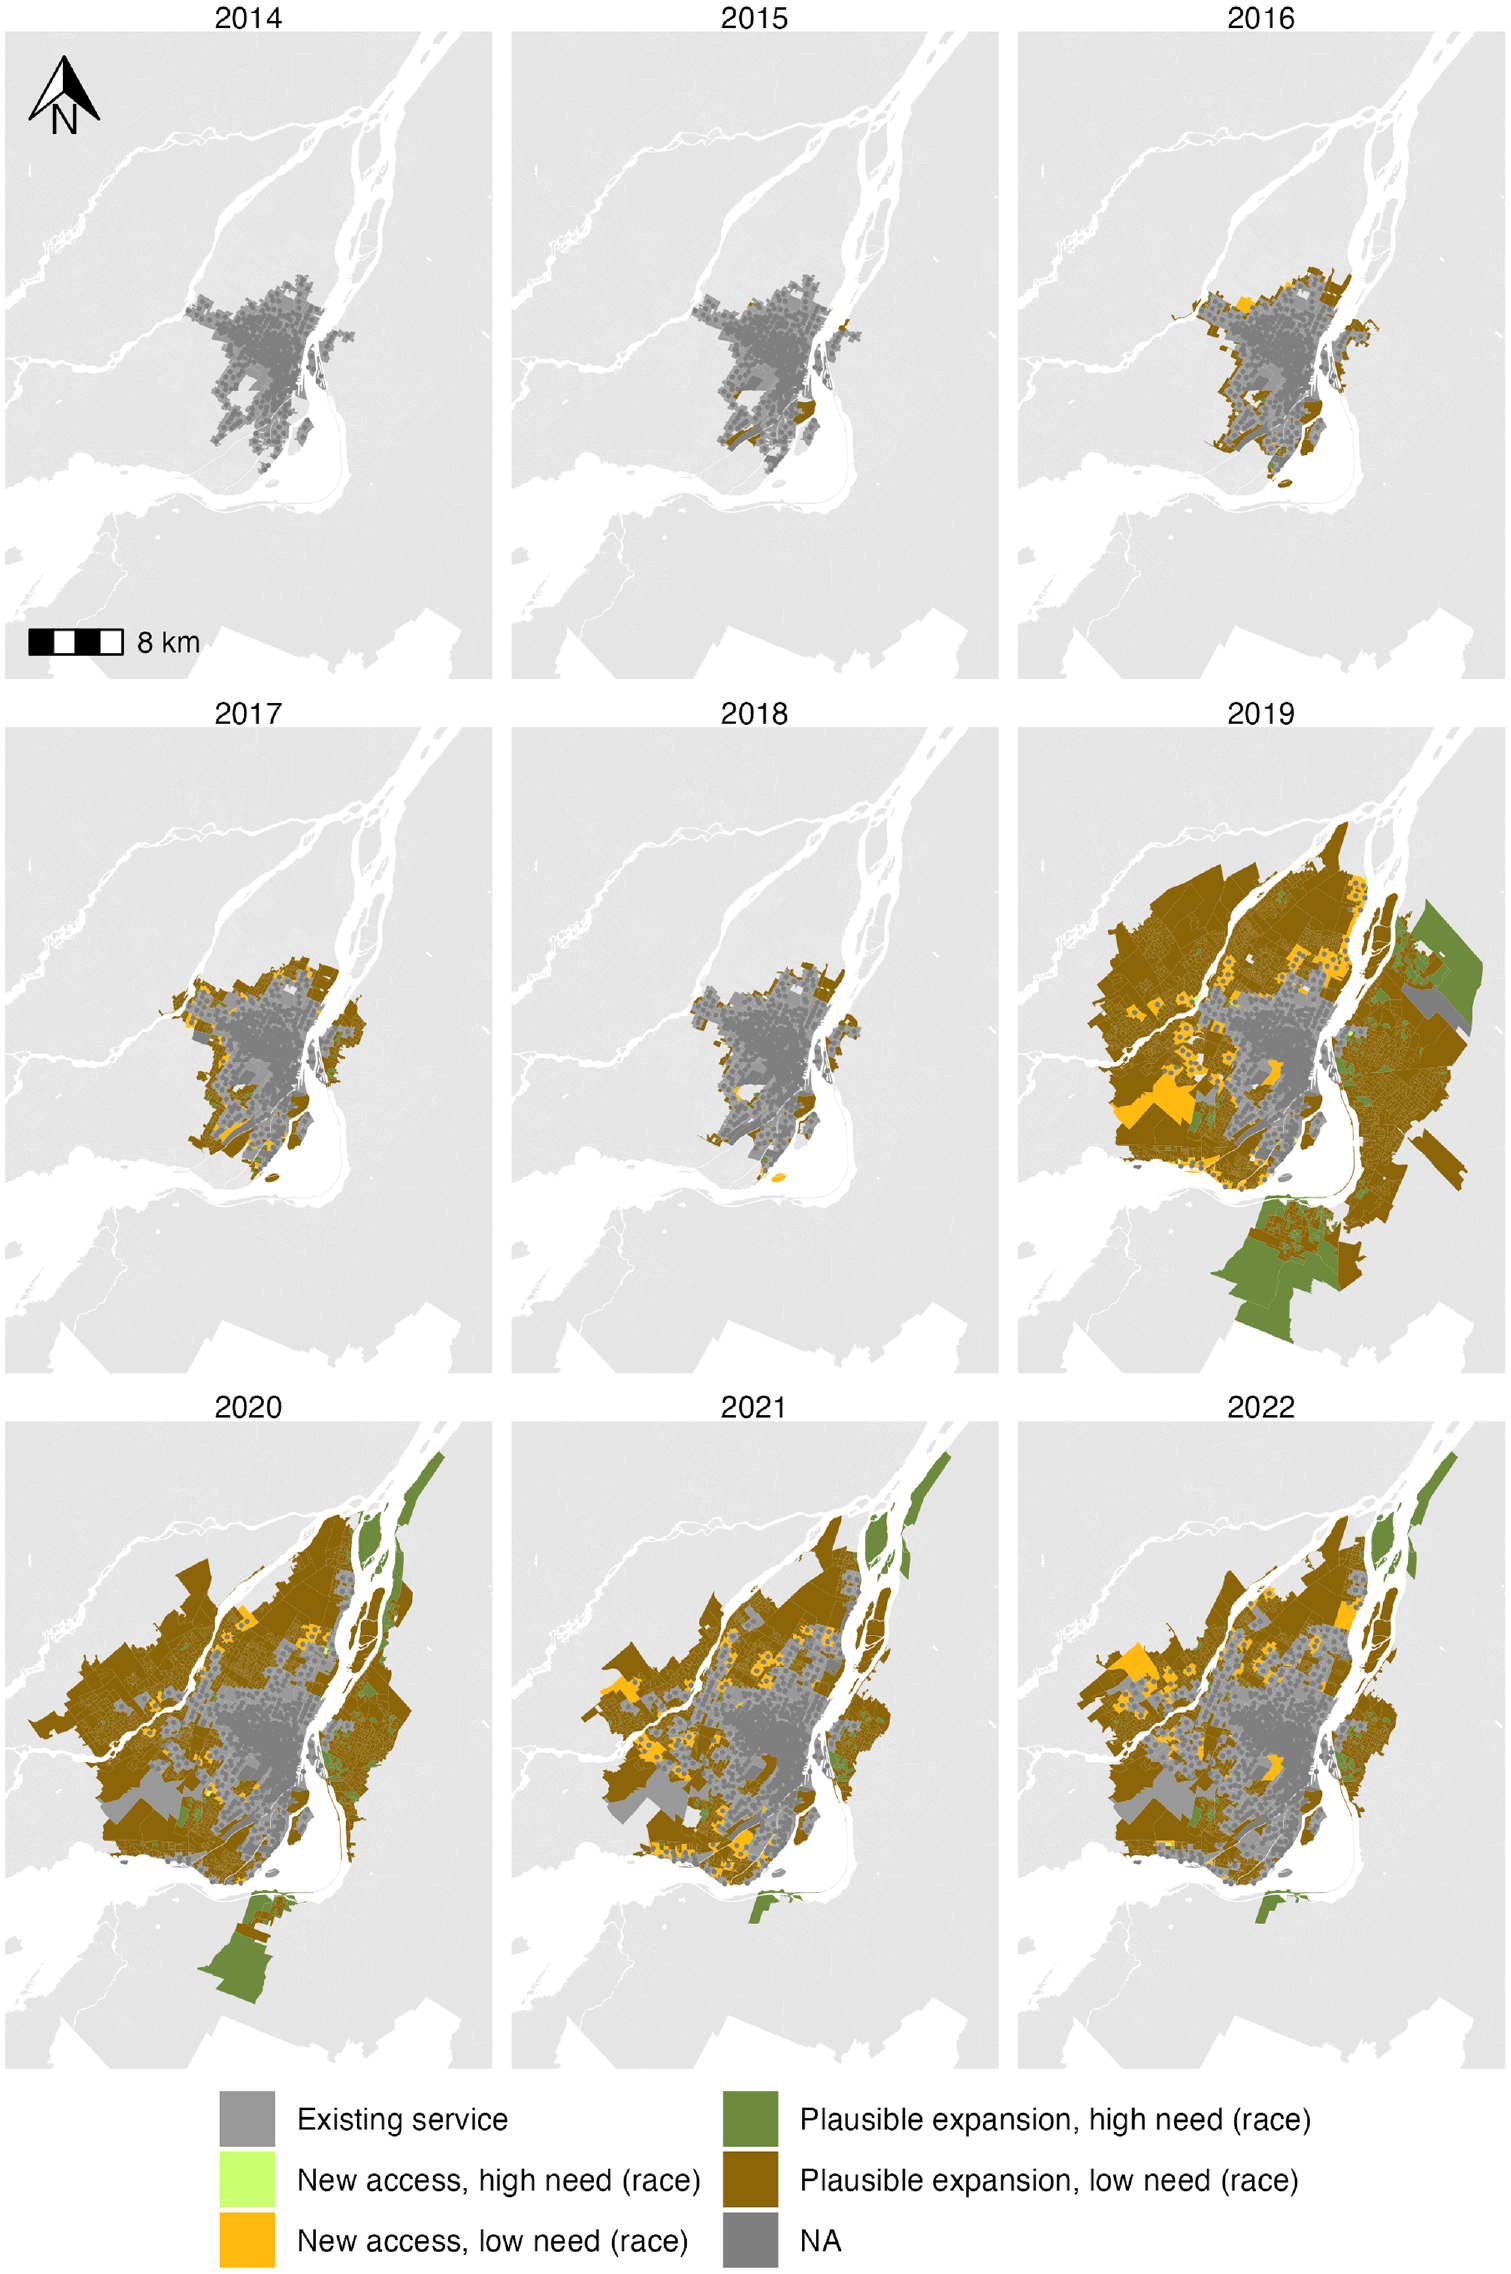
Access and race bivariate maps.
Regression Results
Table 1 presents the regression results for each year as odds ratios.
Regression Results Showing Odds Ratios Standard Errors in Parenthesis
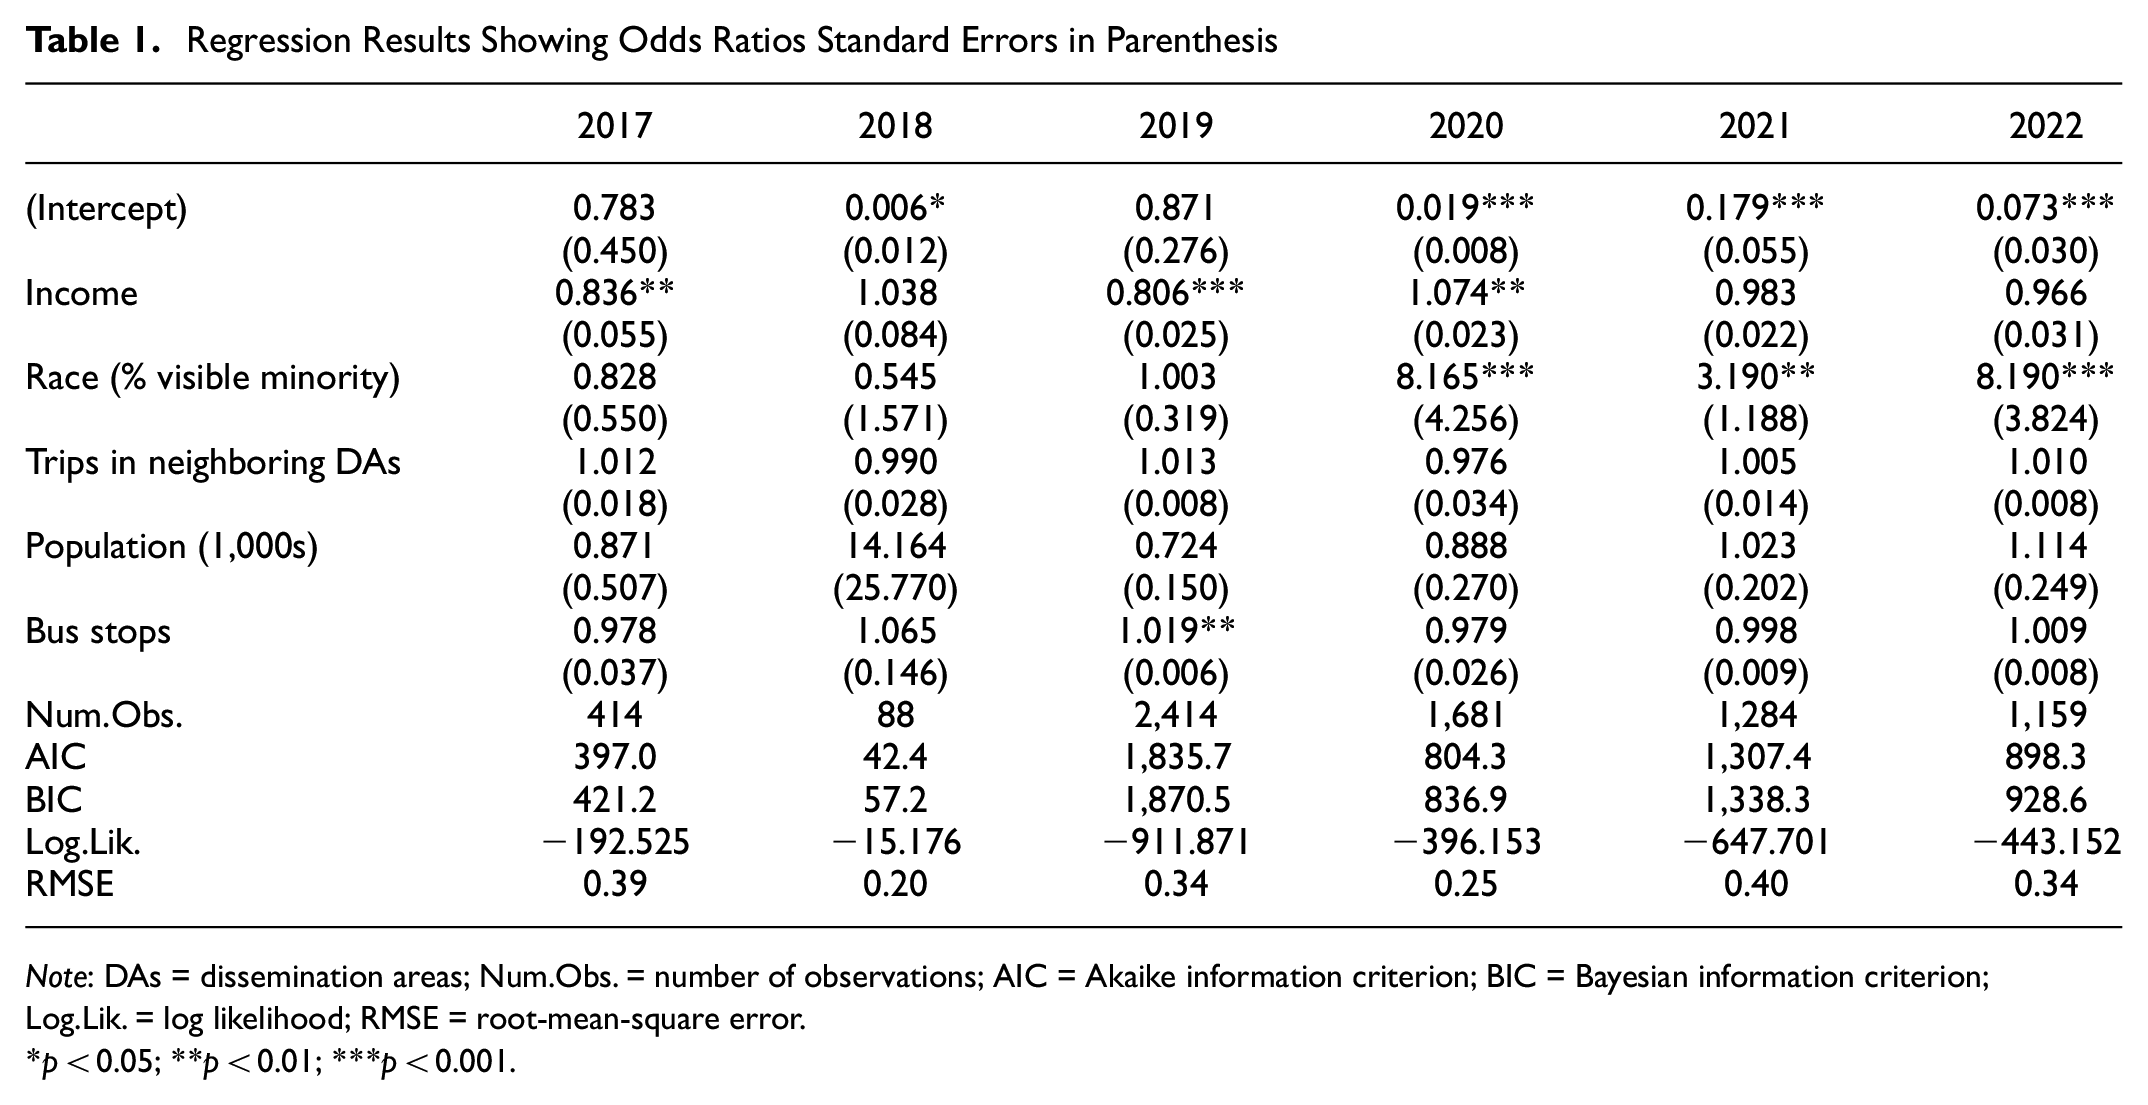
Note: DAs = dissemination areas; Num.Obs. = number of observations; AIC = Akaike information criterion; BIC = Bayesian information criterion; Log.Lik. = log likelihood; RMSE = root-mean-square error.
p < 0.05; **p < 0.01; ***p < 0.001.
Table 1 demonstrates that income was a statistically significant variable in 2017, 2019, and 2020. In 2017 and 2019, the odds ratios of 0.836 and 0.806 demonstrated that an increase in median household income by CA$10,000 was associated with a decrease in the likelihood that a DA would be given new access to a BIXI station, meaning that stations in these years were generally added to areas with lower median incomes. However, the opposite was true in 2020, in which income was associated with an increase in the likelihood that a DA would be given new access. Race, meaning the proportion of visible minorities in a DA, was statistically significant in 2020, 2021, and 2022. The odds ratio values (8.165, 3.190, 8.190) demonstrated that an increase in the proportion of visible minorities in DA was strongly associated with an increase in the likelihood that a DA would gain access to BIXI. The only other variable with a statistically significant odds ratio was the number of bus stops in a DA for the year 2019, in which an increase in bus stops was slightly associated with an increase in the likelihood that a DA would gain access to BIXI. The population and neighboring trips variables did not have any clear trend or statistically significant results.
Table 2 presents the mean values for DAs in the plausible expansion zone for all explanatory variables. The overall trend (with some exceptions) was that DAs that gained new access each year had, on average, a higher proportion of visible minority residents, a higher population density, and more transit stops. In five out the seven years presented here, the new access areas had lower incomes than the other possible sites. The demand variable (trips in surrounding areas) was somewhat inconclusive. This makes sense, given that the system has been expanding toward the periphery of the service area where trips counts are not likely to be as high.
Differences in Explanatory Variables Between Areas that Received BIXI Access and Those that Did Not. Mean Values are Shown
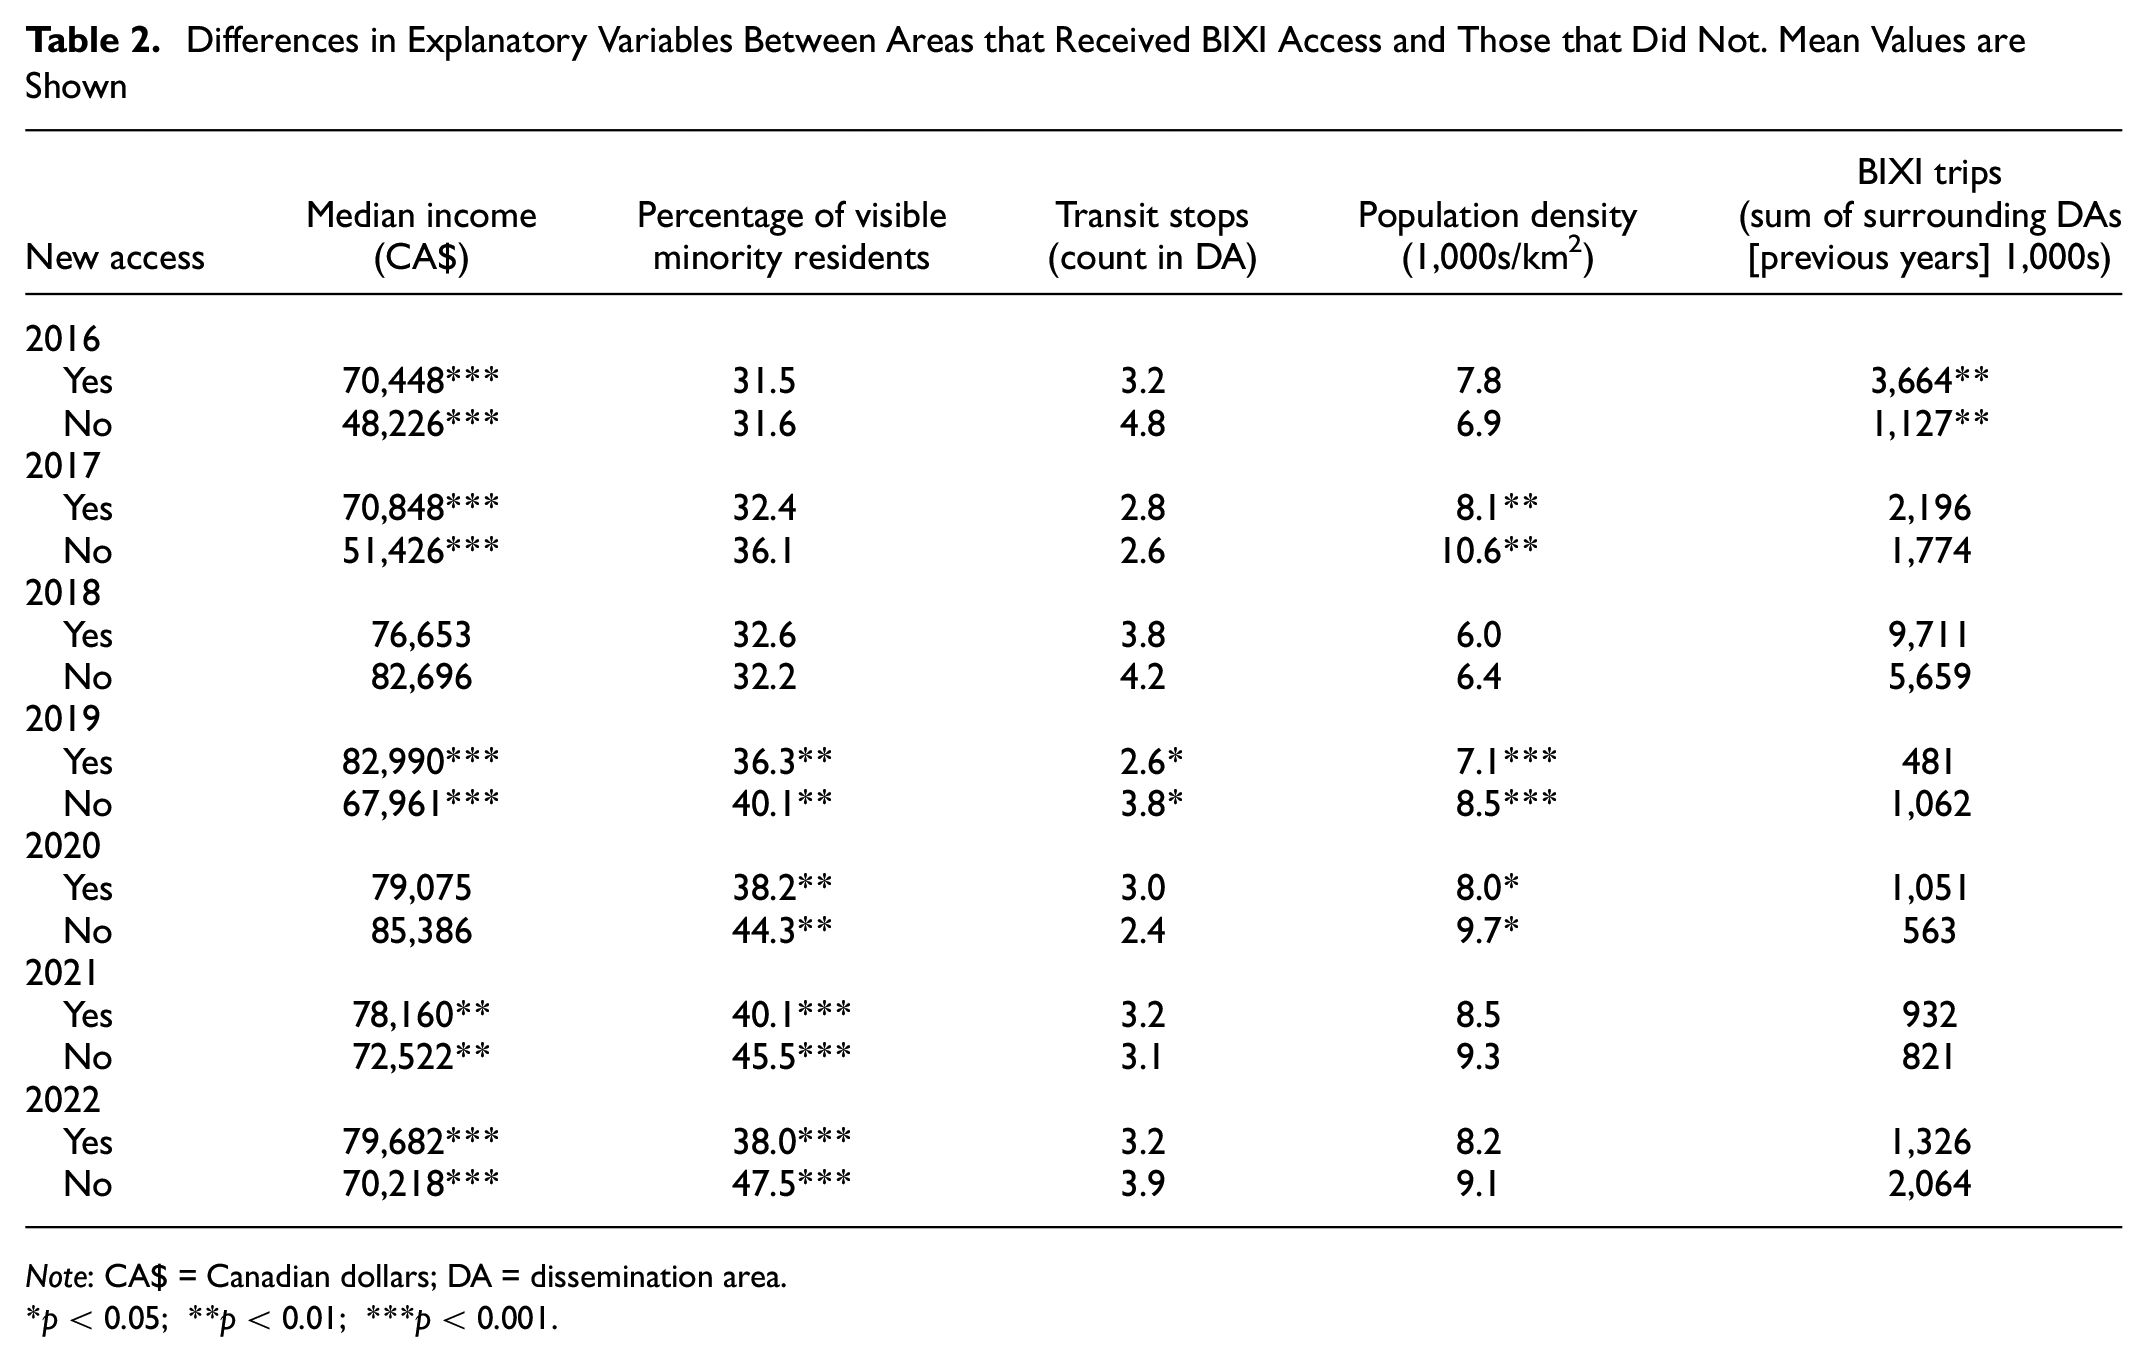
Note: CA$ = Canadian dollars; DA = dissemination area.
p < 0.05; **p < 0.01; ***p < 0.001.
Discussion and Conclusion
This study used equity as a lens through which to analyze yearly expansions in bike sharing in Montreal from 2014 to 2022. This analysis offered a novel and reproducible way of analyzing this expansion, or that of other similar networks. Through a series of methods, we examined how income and race were factors that helped explain which DAs gained new access to BIXI. In our regression model, lower-income DAs were generally associated with a higher likelihood of gaining access, whereas a higher proportion of visible minorities in a DA was also generally associated with an increase in the likelihood of gaining access. Maps supplemented these findings, while also revealing that there were few DAs with a high racial equity need for BIXI to have expanded to.
BIXI is an example of a successful bike-sharing system that has seen large-scale growth over the past decade. How it has grown and which areas and population groups are served are vital equity questions.
The regression results (see Table 1) demonstrated that BIXI expansions in 2017 and 2019 served lower-income populations, and the results from 2020, 2021, and 2022 demonstrated that BIXI expansions served visible minority populations. Although it is unclear whether these were conscious decisions by BIXI, it nonetheless revealed that certain equity needs were addressed through the expansions. Furthermore, the lack of a clear trend or statistically significant results for the neighboring trips and the population variables demonstrated that BIXI is not simply expanding into areas with the greatest demand. As mentioned in the introduction, BIXI does not make equity goals explicit in their mission statement or other documents. This analysis suggests the importance of bike sharing and other similar agencies being more transparent about their goals and how decisions about station and dock locations are made.
Although these results demonstrate that BIXI has improved the equity of its system since 2014, it could also achieve this in ways other than expansions. BIXI does not offer incentives or discounts for lower-income riders that we could find, unlike in other cities that have taken greater strides to address equity concerns. In both New York City and Boston, for example, riders who meet income qualification or belong to select programs (including housing or meal programs) are eligible for US$5 monthly memberships ( 32 , 33 ). In Vancouver, the bike-share program, Mobi, has a Community Pass program for similarly disadvantaged users, including those with low incomes or food bank membership ( 34 ). Given that this is an established way to address equity concerns, BIXI could implement a similar program for lower-income riders in Montreal, and take note of how transparent other cities are in their equity initiatives.
Although BIXI does have a group discount by which 20 or more members can sign up as a group for a 10% discount on a seasonal membership, this is targeted toward corporations and their employees, which may solely be assisting those who already have the financial means to pay for a full membership ( 35 ). Students at McGill University are also eligible for a 10% discount on a seasonal membership, but this is not specifically a low-income program.
Limitations and Future Work
Notably, trip-level data were not available for the entirety of the time that BIXI has been operational, we therefore focused on the 9 years between 2014 and 2022. It is therefore important to perform such an analysis in other locations, particularly in regions that have more pronounced patterns of spatial disparity among income groups and along racial lines. The methods described here are replicable in any region that has similar data available. Furthermore, there may be variables that could have better explained the growth of BIXI’s network that were not included in this analysis, such as proximity to green space or cycling infrastructure.
Footnotes
Acknowledgements
We acknowledge BIXI for making their data openly available for analysis.
Author Contributions
The authors confirm contribution to the paper as follows: study conception and design: P. Bligh, D. Wachsmuth, M. Bélanger De Blois, K. Manaugh; data collection: P. Bligh, D. Wachsmuth, M. Bélanger De Blois, K. Manaugh; analysis and interpretation of results: P. Bligh, D. Wachsmuth. K. Manaugh. draft manuscript preparation: P. Bligh, K. Manaugh; All authors reviewed the results and approved the final version of the manuscript.
Declaration of Conflicting Interests
The authors declared no potential conflicts of interest with respect to the research, authorship, and/or publication of this article.
Funding
The authors disclosed receipt of the following financial support for the research, authorship, and/or publication of this article: The McGill Sustainability Systems Initiative partially funded this research.