
Abstract
Concerns over urban congestion, air pollution, and health disparities have prompted many cities to expand their bicycle networks to foster a cycling culture. Given limited budgets, choosing a set of road segments for investments in cycling infrastructure to achieve a city’s ambitious goals is still a challenge. This study introduces a quantitative framework for prioritizing future bicycle improvement projects for implementation within budgetary constraints using different intervention strategies with regard to specific goals and objectives. The “connectivity-focused” prioritization strategy aims to consolidate bicycle networks and improve network connectivity. The “equity-based” strategy grows the bicycle networks and favors cycling equity goals; it prioritizes cycling projects that improve bicycle accessibility to urban opportunities for disadvantaged populations and mitigates disparities in access to bicycle facilities. The “modal shift” strategy seeks to build a bicycle network which would appeal to prospective bicycle commuters and thereby reduce vehicle kilometers traveled (VKT) and greenhouse gas (GHG) emissions. The results highlight the importance of growing bicycle networks in a systematic way and show that this framework is useful for guiding the implementation of new bicycle facilities with specific policy priorities.
The potential of cycling to combat congestion, diminish air pollution, address health disparities, and improve mental health has received increasing attention from scholars and policy makers ( 1 ). Although, in principle, road networks for motor vehicles are sufficient to connect the origins and destinations of cyclists, there is an agreement that building a complete network with bicycle-specific facilities is essential for cities seeking to provide a safe and comfortable experience that most cyclists prefer over sharing spaces with motorized vehicles ( 2 ). Cycling infrastructure, therefore, provides the backbone for cities’ bicycle plans, either for recreational or utility cycling, and decisions on where to build new bikeways are usually taken as part of strategic plans. Planners are faced with the problem of prioritizing and choosing a set of road segments for investment in cycling infrastructure within a limited budget.
The Island of Montreal is chosen as a case study since it has been making efforts to expand its bicycle network. From 2006 to 2021, the Island of Montreal has more than doubled the size of its bicycle network. Connections between boroughs and between municipalities were constructed to link various activity destinations, and several bicycle corridors have been built to connect green spaces and outdoor destinations. The recently released Quebec active transportation action plan pledged to invest in cycling infrastructure to close the gaps in the current network, reduce car dependency, connect communities, and address the needs and safety of people regardless of age, ability, or background ( 3 ). Montreal also promised to add an extra 840 km of bike paths and published the future bike network map ( 4 ) which guides the expansion of the bicycle network on the island. In this context, this paper aims to present a practical framework that planners can use to prioritize bicycle facility projects for implementation within budgetary constraints and assess the impacts of infrastructure interventions. This framework integrates readily available quantitative and spatial data sources, determines priorities of bicycle projects, and yields a proposed network in an easily interpretable format suitable for decision makers and the public. While we evaluate our methodology within the context of Montreal, the focus of this study is not to produce a locally specific model for a particular city, but to introduce a replicable framework that could be used to optimize cycling investments in any other city by using similar data sets.
This paper first reviews the literature related to identification of transportation-disadvantaged populations and the models and algorithms used for optimal planning of a bicycle network. The methodology section then introduces the data sources and explains the prioritization strategies related to specific goals and objectives. We then present proposed bicycle networks from prioritization strategies and their potential benefits. The final section provides a discussion and conclusions on the implications for practice relevant to the case of Montreal, and cities more generally, as well as limitations and possible refinements.
Literature Review
Transportation-Disadvantaged Populations
Access to transport services represents a critical factor in determining quality of life by enabling participation in essential activities central to a healthy and happy lifestyle. Transportation disadvantage (TD) has been defined as “a situation where people experience a shortage of transport options, which restricts their mobility and hence their access to goods, services and relationships” ( 5 ). Transportation-disadvantaged populations may, therefore, face chronic problems, not limited specifically to transportation services, such as poor health or lack access to jobs and other social opportunities ( 6 ).
While TD is increasingly receiving attention from researchers and planners, it remains a concept that is difficult to measure, given that it is a complex and multidimensional construct resulting from the interaction between environmental, socioeconomic, and demographic variables ( 7 ). Much work uses proxy indicators of socioeconomic status (SES), which are presumed to incline people toward TD, to identify disadvantaged populations ( 8 – 10 ). Common variables include car ownership, household income, minorities, immigrants, elderly, and children. Since socio-demographics alone do not make people transportation disadvantaged, several studies combine area mobility measures (e.g., distance to public transport services) with social indicators to identify transportation-disadvantaged areas ( 11 , 12 ).
Bicycle Network Planning
While a considerable number of policy guidelines have been written on the physical design of bicycle facilities ( 13 , 14 ), the literature on questions of cycling investment prioritization is relatively scarce. Efforts in that direction are primarily based on origin–destination (O-D) data to develop an optimization framework for urban bicycle network planning purposes. Larsen et al. ( 15 ) developed a grid-cell model for identifying priority areas within a region for investing in cycling infrastructure based on an O-D survey, a stated preference survey, and bicycle–vehicle collision data. Guerreiro et al. ( 16 ) developed a method based on a geographic information system (GIS) to objectively determine the optimum location of new bikeways based on data mining of disaggregated O-D data, considering current and potential users. Instead of identifying bike lanes between origins and destinations, Zuo and Wei ( 17 ) introduced systematic and quantitative analytics for locating new bike infrastructure, based on a multicriteria analysis technique, aiming to improve bicycling connectivity and bicycle–transit connection.
Given that traditional travel surveys do not capture accurate and comprehensive information about people’s routes or facility preferences, there is a growing body of literature on bicycle planning that uses crowdsourced data to support evidence-based transportation planning and inform decision making. Using large-scale bike-sharing trajectory data, along with a greedy network expansion framework, Bao et al. ( 18 ) developed bike lane construction plans for the city of Shanghai in China. They introduced a flexible beneficial score function to tune the benefit between the number of covered users and the length of bike trips. Inspired by percolation theory, Olmos et al. ( 19 ) proposed a data science approach to prioritize new facilities by integrating biking trajectories with O-D data extracted from mobile phone data. They defined the potential demand for cycling and prioritized streets with the highest potential bike flows.
In recent years, studies on bicycle network design have taken advantage of network science to measure the statistical and dynamical properties of bicycle networks and develop optimal strategies for bicycle network growth. One recent study by Szell et al. ( 20 ) took into account the structural complexity of bicycle networks and introduced growth strategies to optimize quality metrics including cohesion, spatial coverage, POI coverage, resilience, directness, and local and global efficiency. Finally, Akbarzadeh et al. ( 21 ) abstracted a weighted network based on the number of taxi trips. They detected seven different network clusters using a modularity maximization method and proposed bicycle routes that minimized the total travel distance in the network as priority corridors along which to build new bikeways. However, instead of building a connected network, they focused on connecting nodes in each sub-network to minimize travel time and the total length of proposed bikeways and, finally, to improve the directness.
In summary, decisions on where to build new bikeways are, in practice, currently made with less rigorous methods. Research optimizing planning of cycling networks is still emerging. Compared with motorized road users, cyclists consider a broader range of factors for selecting bicycle routes such as travel, distance, and comfort ( 22 ). However, many studies have yet to account for factors other than distance and travel time when determining the key bike travel corridors. By taking inspiration from previous studies and expanding on their limitations, this work will: 1) plan bicycle facilities considering the network as a whole; 2) propose bikeways in a manner that takes into account cyclists’ routing preferences; and 3) provide a variety of growth strategies with different prioritizations.
Methodology
Data Sources
This study uses multiple data sets to develop and demonstrate the capabilities of our approach for the prioritization of new bike lanes.
Sociodemographic data: The sociodemographic characteristics of the population in the dissemination area (DA) level are obtained from the Canadian Census of 2016 ( 23 ). The Island of Montreal contains 3,202 DAs, which are the smallest standard geography at which census data are publicly available; they contain a population of between 400 and 700 people ( 24 ).
Locations of transit stops: Transit data for 2021 provided by the Société de Transport de Montreal (STM) contain the locations of bus stops and metro stations on the Island of Montreal. This data set is used to identify neighborhoods that have poor access to transit services.
Commuting data: The commuting data are provided by Statistics Canada ( 25 ). This data set contains information on mode-specific commuting behavior at the census tract (CT) level and indicates the number of commuting trips between home and work locations, for the entirety of the employed labor force aged 15 and older having a usual place of work on the Island of Montreal.
Locations of urban opportunities: Point locations of urban opportunities are derived from the Enhanced Points of Interest (EPOI) data set of 2019 ( 26 ) provided by DMTI Spatial, which includes over 1 million business and recreational points of interests across Canada. We select four types of urban opportunities to represent destinations that are relevant for cyclists: groceries, pharmacies, health care facilities, and elementary and secondary schools. Groceries and pharmacies are selected because they were identified as “everyday shopping opportunities” ( 27 ). Health care facilities are selected because they provide necessary medical services. Elementary and secondary schools are selected because they provide early childhood education which is an essential element in future success.
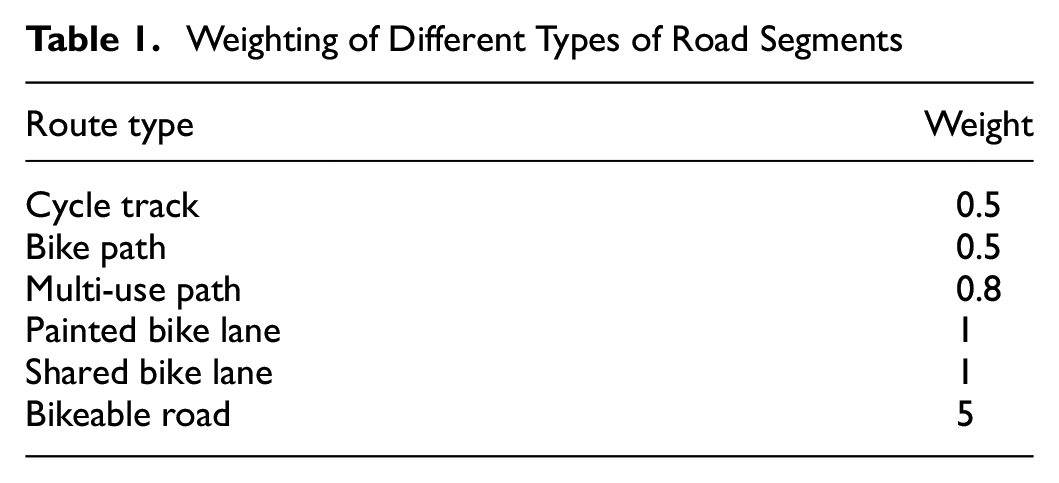
Existing and proposed bicycle networks: The current state of the bicycle network is obtained from the Montreal Open Data Portal. For analytical purposes, we reclassify cycling facilities into three categories based on the level of safety and user comfort: high-comfort bikeways, medium-comfort bikeways, and low-comfort bikeways. High-comfort bikeways are places where most cyclists will feel comfortable riding, including children. Cyclists are either physically separated from motor vehicle traffic or travel along an off-street path located away from a road. Route types include cycle track and bike path. Medium-comfort bikeways are low to medium stress routes, offering cyclists a shared lane where they interact with pedestrians. Multi-use paths fit within this category. Low-comfort bikeways include painted bike lanes and shared bike lanes. These facilities present high traffic stress and are uncomfortable for most cyclists. Cyclists either travel along an exclusive lane beside a busy road, a shared lane with motor vehicles, or in an exclusive cycling zone between a vehicular travel lane and on-street parking. The proposed bicycle network is constructed in ArcGIS based on the 2019 Montreal Bicycle Network Plan ( 4 ), which identifies potential road segments for new bikeways. Given the data limitations, all the projected bicycle facilities are categorized as low-comfort bikeways.
Road networks: The road network comes from the Montreal Open Data Portal. We exclude roads where cycling is prohibited (e.g., highways) and integrate road and cycling networks to build a bikeable network.
Connecting Network Components
Bicycle networks can be abstracted as graphs which consist of a set of vertices connected by a set of edges: edges represent bicycle-specific facilities; vertices represent intersections and endpoints of bicycle facilities; flows represent the bicycle trips on networks. Bicycle networks are generally not fully connected and are split into several network components, where no connection exists between nodes in different disconnected components. The number of network components can be used to measure how well connected a network is. Typically, as a network grows, the fragmented components are gradually connected, and the largest connected component will expand until it contains all the nodes in the network. The network components in the bicycle network on the Island of Montreal are identified using R package igraph ( 28 ). For the components identified, we calculate the total points of interest (POIs) that can be reached within 500 m from nodes as POI coverage.
Prioritization Strategy 1: Improving Connectivity of Bicycle Network
This prioritization strategy aims to consolidate the bicycle network and improve connectivity. By creating connections between network components, this growth strategy will deliver a fully connected bicycle network, allowing cyclists to rely on the bicycle network to get to their destinations. The following steps are suggested:
rank the network components according to their POI coverage;
identify the two components that cover the most POIs;
calculate the shortest path between two components using the proposed bicycle network and add it into the existing bicycle network; and
repeat steps 2 and 3 until only one component exists or the budget constraint is met.
Identifying Transportation-Disadvantaged Neighborhoods
Transportation disadvantage at the DA level is measured using six common socioeconomic variables from the literature and one mobility-related variable:
median household income;
low-income cut-offs (LICO);
low-income measure (LIM);
proportion of recent immigrants;
proportion of population without certificate, diploma, or degree;
unemployment rate; and
number of public transport services (e.g., bus routes and metro lines) within 500 m from centroids of Das.
Each variable is standardized using Z-scores and summed unweighted to create the disadvantage index. Lower values signify low accessibility to public transit and high socioeconomic need and, therefore, higher levels of transportation disadvantage. The DAs are then categorized into quantiles according to their index score, with quintile 1 (Q1) representing the most transportation-disadvantaged neighborhood and quintile 5 (Q5), the least. The identified transportation-disadvantaged DAs are predominantly characterized by immigrant households with low incomes, low educational achievement, and poor accessibility to public transit.
Estimating Potential Cycling Demand
Potential cycling demand is defined as the number of one-way bicycle trips between origins and destinations. Based on the bikeable network, we compute cycling routes for each O-D pair of the potential demand using the R package stplanr (
29
). To consider the level of traffic stress for cyclists, we assign a weight
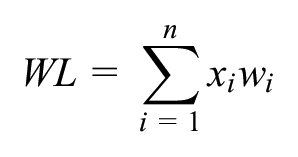
where WL is the weighted length of a potential route and
Weighting of Different Types of Road Segments
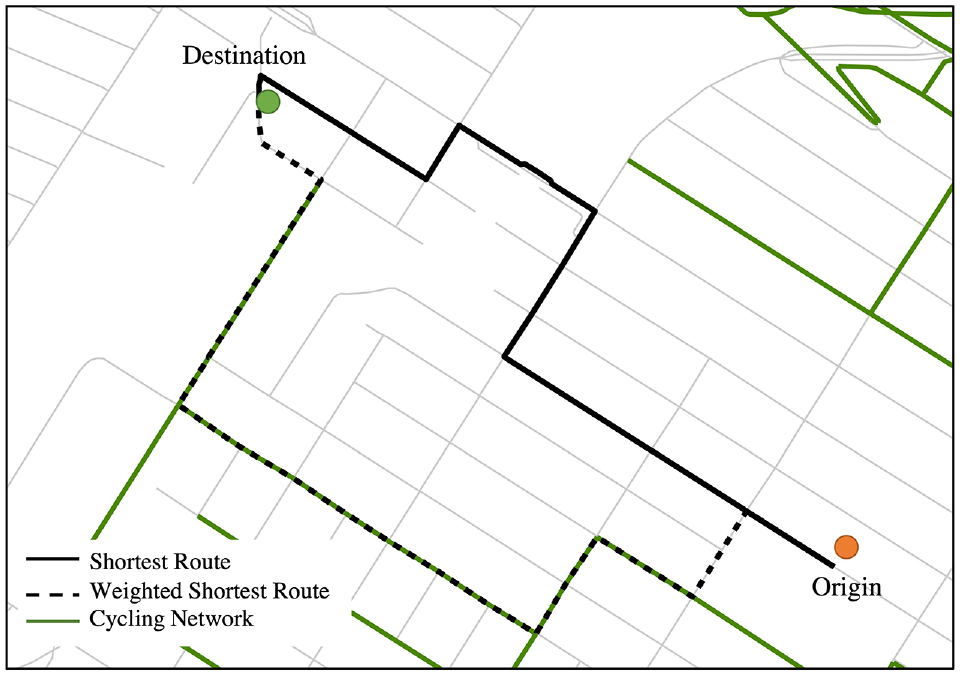
Potential routes between origin–destination (O-D) pair.
Growing Bicycle Networks
After assigning the potential cycling demand onto the bikeable network, we estimate the cumulative cycling potential at the road segment level by calculating the number of overlapping shortest routes. The proposed bikeway with the highest cumulative cycling demand will be prioritized. By doing so, we focus our attention on the routes that are most likely to serve the greatest number of cyclists, and ensure that new facilities serve places with high cycling demand. Considering the multiple priorities of the City of Montreal in expanding the bicycle network, we develop two prioritization strategies to allow us to compare a solution that focuses on accessibility to one that focuses on GHG emissions.
Prioritization Strategy 2: Enhancing Accessibility for Transportation-Disadvantaged Population
The second prioritization strategy set out to improve bicycle accessibility to urban opportunities for disadvantaged populations and mitigate disparities in access to bicycle facilities. Thus, the bicycle projects that connect key destinations with transportation-disadvantaged DAs (Q1) will be prioritized. The following procedures are suggested:
identify transportation-disadvantaged DAs;
calculate potential cycling demand between transportation-disadvantaged DAs and selected urban destinations;
identify cycling routes that consist of the proposed bikeways with the highest cycling potential and add them to the existing bicycle network; and
repeat step 3 until all cycling demand is satisfied or the budget constraint is met.
Prioritization Strategy 3: Reducing GHG Emissions From Transportation Sector
This prioritization strategy intends to prioritize the potential for substituting short car trips by cycling and reducing vehicle kilometers traveled (VKT) as well as GHG emissions. The network is consolidated by adding connections which concentrate modeled commuter rider flows described as follows:
identify car trips of less than 5 km as cyclable trips based on commuting data;
calculate potential cycling demand between CTs and assume that commuters would substitute cycling for car trips that are less than 5 km;
identify cycling routes that consist of proposed bikeways with the highest number of cyclable trips and add them to the existing bicycle network; and
repeat step 3 until all cycling demand is satisfied or the budget constraint is met.
Results
“Connectivity-Focused” Prioritization Strategy
Connectivity of Existing Bicycle Network
The existing bicycle network on the Island of Montreal contains close to 970 km of bike lanes, consisting of 17,534 nodes and 17,594 edges. The network is made up of 213 network components, and the largest connected component spans 53% of the existing network. Under the “connectivity-focused” growth scenario, the connectivity of the bicycle network is measured using the gamma (γ) index developed by Garrison and Marble ( 33 ). The γ index calculates the degree of connectivity as the ratio between the actual number of edges in the network and the maximum possible number of edges. Because bicycle networks are almost always planar where no edges cross each other, the potential number of edges is calculated as 3(v-2). Consequently, the degree of connectivity (γ) of existing bicycle network is 0.33, meaning that 33% of the network in the region is connected.
Besides measuring the connectivity from the perspective of graph theory, we estimate POI coverage to investigate whether the existing network of bicycle facilities can get cyclists to their potential destinations. For this, we created a buffer of 50 m from each link in the existing network. POI point data were then spatially joined to the buffers to obtain the number of urban opportunities accessible to the bicycle network. Currently, the bicycle network covers 29% (n = 910) of opportunities; 74% (n = 674) of them are accessible by cyclists using continuous cycling routes.
Priority Bicycle Network
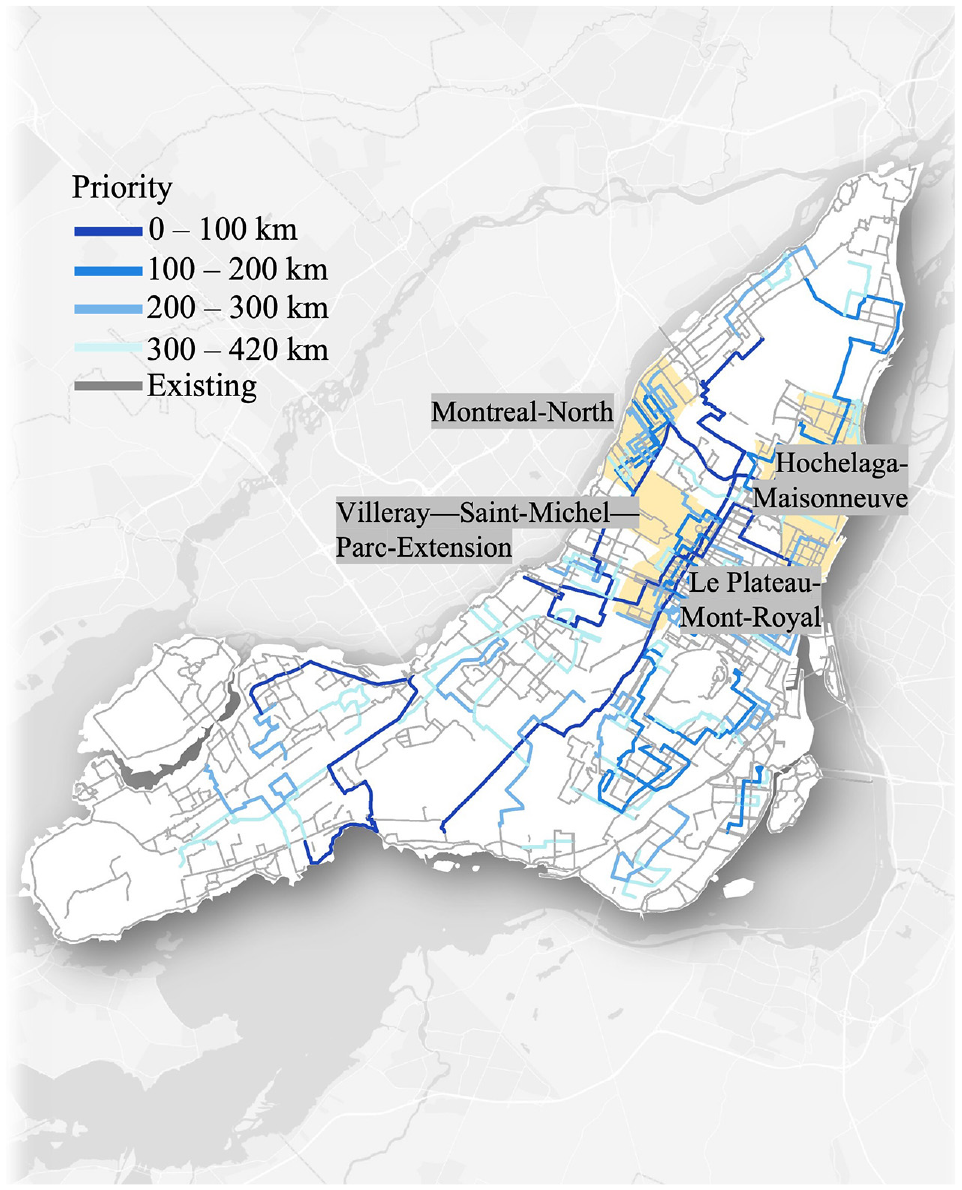
The “connectivity-based” intervention strategy seeks to give priority to cycling projects that connect the existing network with places of interest and, therefore, maximize connectivity of the bicycle network. As a result, this strategy yields a well-connected network that ensures people cycle to destinations without leaving dedicated bike lanes and using sidewalks or roads with a high volume of traffic. The expanded bicycle network is presented in Figure 2. The existing facilities are shown in gray, while all recommended routes are shown in different shades of blue representing the investment priority. As can be observed, bikeways that close “gaps” between network components in the existing bicycle facilities are prioritized. Cycling projects with high priority are primarily located in non-central areas of Montreal which can be explained by the connectivity of the cycling network, while bicycle facilities on the periphery are more fragmented and less continuous than those that lie centrally within the city.
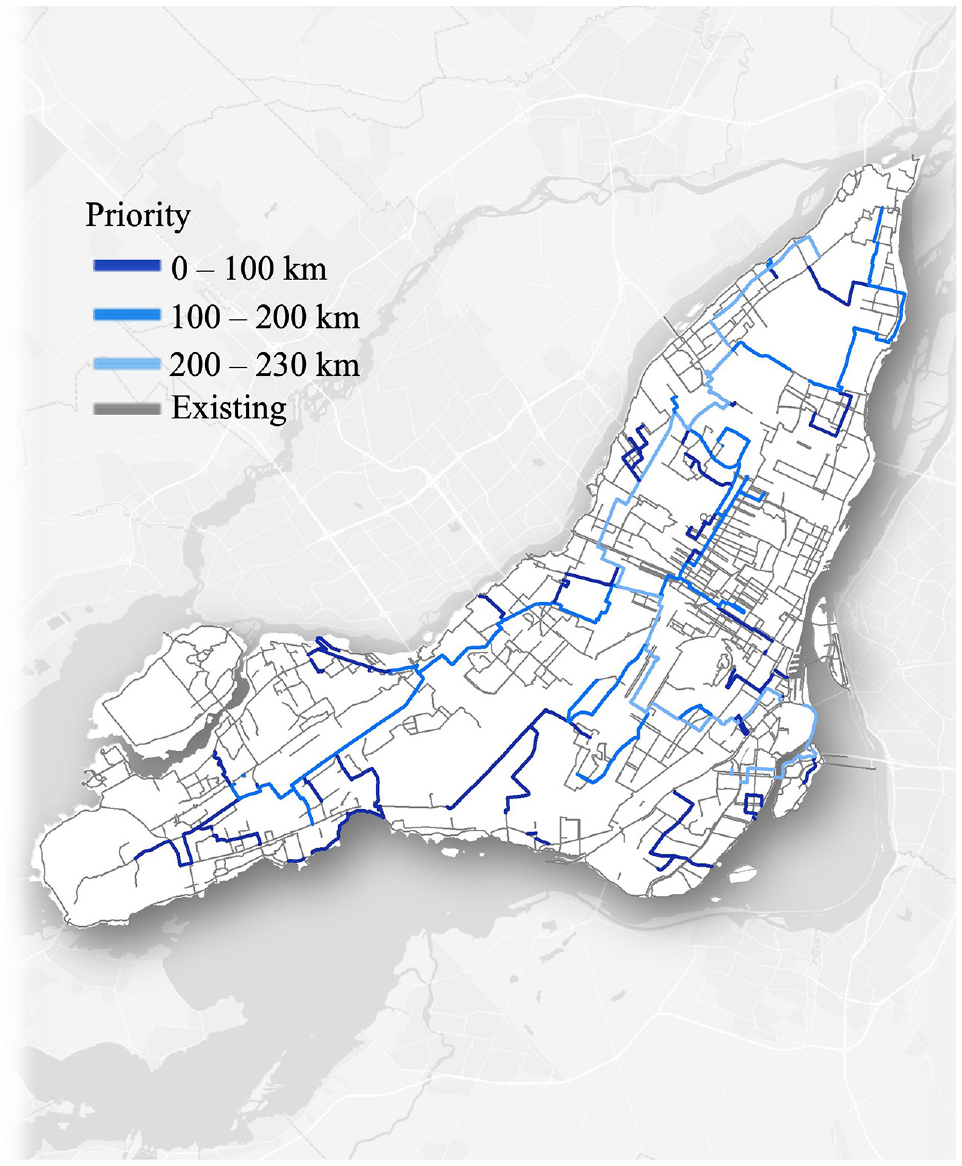
Priority bicycle network.
Potential Benefits
The potential benefits of a “connectivity-based” intervention strategy are shown in Figure 3. We can see that the number of components is reduced with newly added infrastructure. The expanded bicycle network consists of 19,417 nodes and 19,708 edges, featuring 128 network components. Cyclists will have access to 1,161 destinations using the proposed infrastructure. The addition of 230 km of dedicated bike lanes under this intervention strategy also more than doubles the size of the largest connected component, which will contain 1,118 km of bikeways and cover 1,150 POIs.
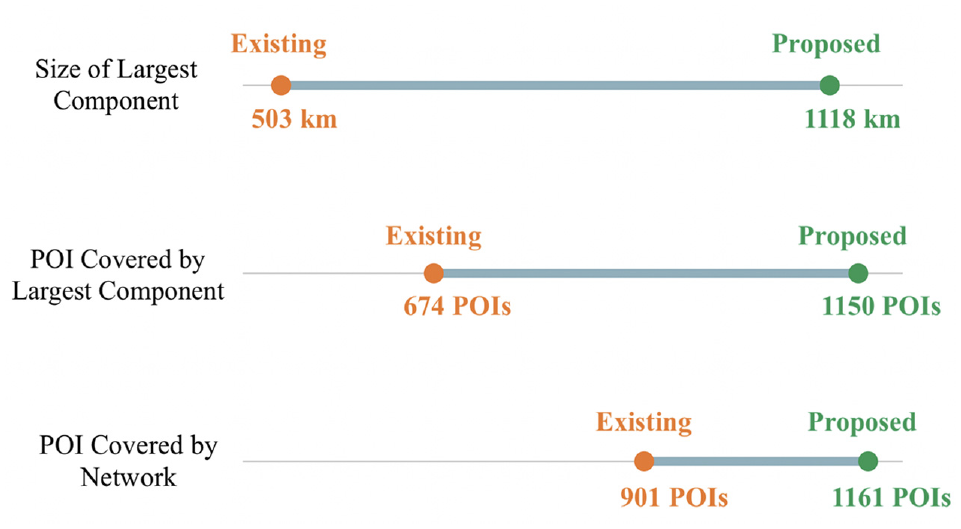
Potential benefits of “connectivity-based” strategy.
“Equity-Based” Prioritization Strategy
Transportation-Disadvantaged DAs
As discussed above, transportation-disadvantaged areas are identified based on a composite measure of socioeconomic and mobility-related variables to help planners prioritize areas where populations suffer from a lack of access to public transit which limits their ability to participate in essential activities. In 2021, around 25% of Montreal’s population lived in DAs with high socioeconomic need and low public transit accessibility. The spatial pattern of the transportation-disadvantaged areas is presented in Figure 4. Most DAs with the highest levels of transport disadvantage tend to be concentrated in suburbs, particularly in the eastern part of Montreal Island, including the boroughs of Montreal-North and Villeray–Saint-Michel–Parc-Extension, and southwest of downtown Montreal, such as Le Sud-Ouest. This is not surprising given that these areas already experience high levels of socioeconomic need since they have documented reputations as being the poorest and most racially diverse neighborhoods in Montreal. Also, they are not well served by public transit. All these factors result in great transportation disadvantage in these DAs.
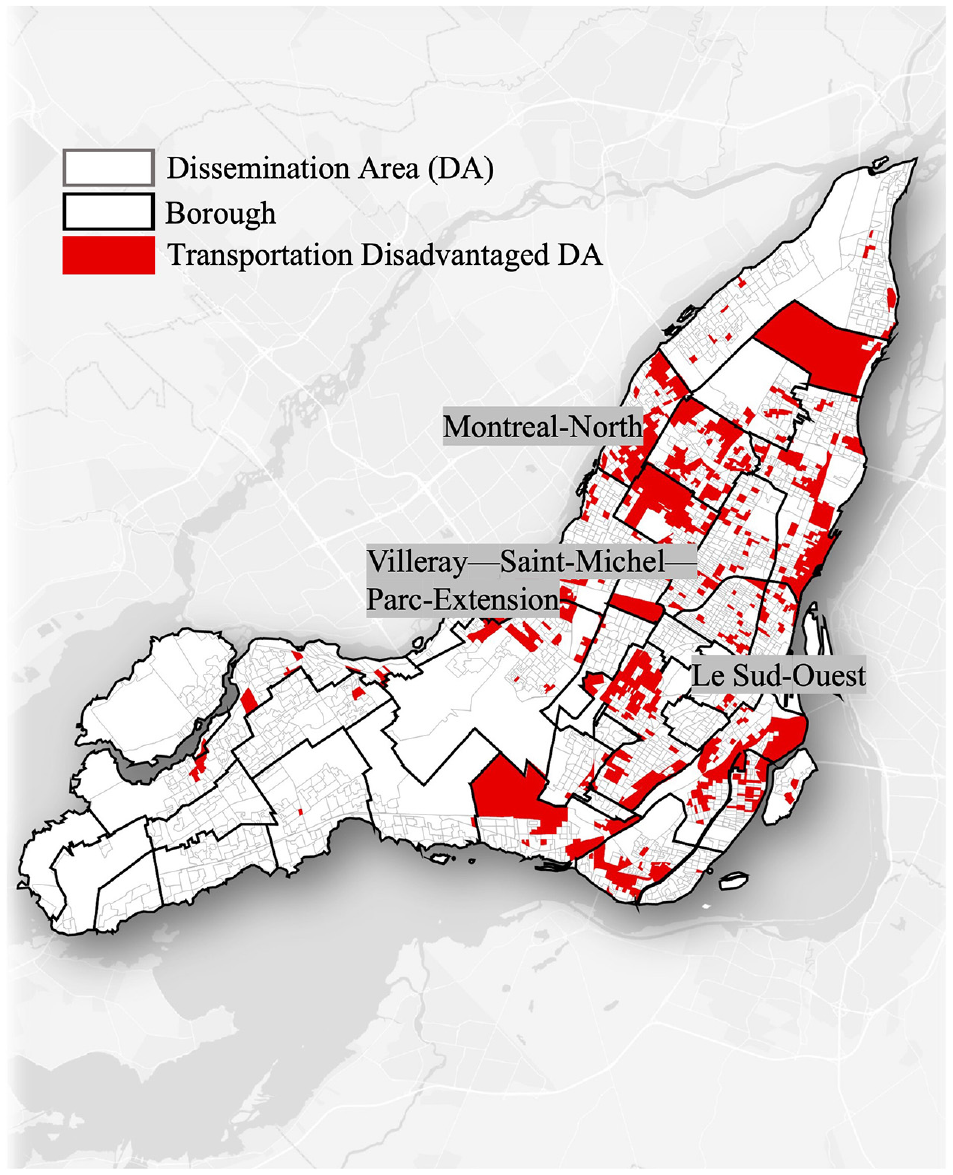
Identified transportation-disadvantaged dissemination areas.
Priority Bicycle Network
The “equity-based” intervention strategy focuses on cycling investment for neighborhoods that experience high levels of socioeconomic need and transportation disadvantage, and prioritizes route developments with high predicted volumes of disadvantaged cyclists. This strategy would, therefore, deliver a network that serves the most disadvantaged residents and assist them in traveling to major education, health, retail, and recreation destinations. As we can see, prioritized bike lanes are spaced closely together in identified transportation-disadvantaged neighborhoods, including the Hochelaga-Maisonneuve neighborhood and the boroughs of Montreal-North and Villeray–Saint-Michel–Parc-Extension, to ensure their residents have access to a bicycle route within a short cycling distance (Figure 5). Several bicycle corridors are prioritized to link disadvantaged areas to various activity destinations, such as the borough of Le Plateau-Mont-Royal.
Priority bicycle network.
Potential Benefits
We first examine the improvements in accessibility to the bicycle network to measure equitable outcomes of this intervention strategy. Figure 6 shows the changes in accessibility of the bicycle network, which are measured as the density of the bicycle network (left y axis) and the proportion of people that have access to the bicycle network (right y axis). We can see that, residents living in transportation-disadvantaged areas experience, on average, greater levels of accessibility to the existing bicycle network relative to the region’s average, implying that bicycle investments were directed to populations dependent on cycling, and bicycle plans took into account the needs of disadvantaged neighborhoods. In this equity-based scenario, all neighborhoods are gaining in accessibility to dedicated bike lanes given the expansion of the bicycle network, but the prioritized cycling investments improve accessibility more for transportation-disadvantaged neighborhoods than for the general population. With the prioritized infrastructure, accessibility for the disadvantaged population improves by 24% to 82%, while accessibility for the general population improves only marginally to 32%. This is expected because this intervention strategy focuses on prioritizing bicycle investments in light of the equity perspective to better serve disadvantaged residents. Also, from a vertical equity standpoint, disadvantaged neighborhoods are arguably the most important to prioritize in giving increased accessibility.
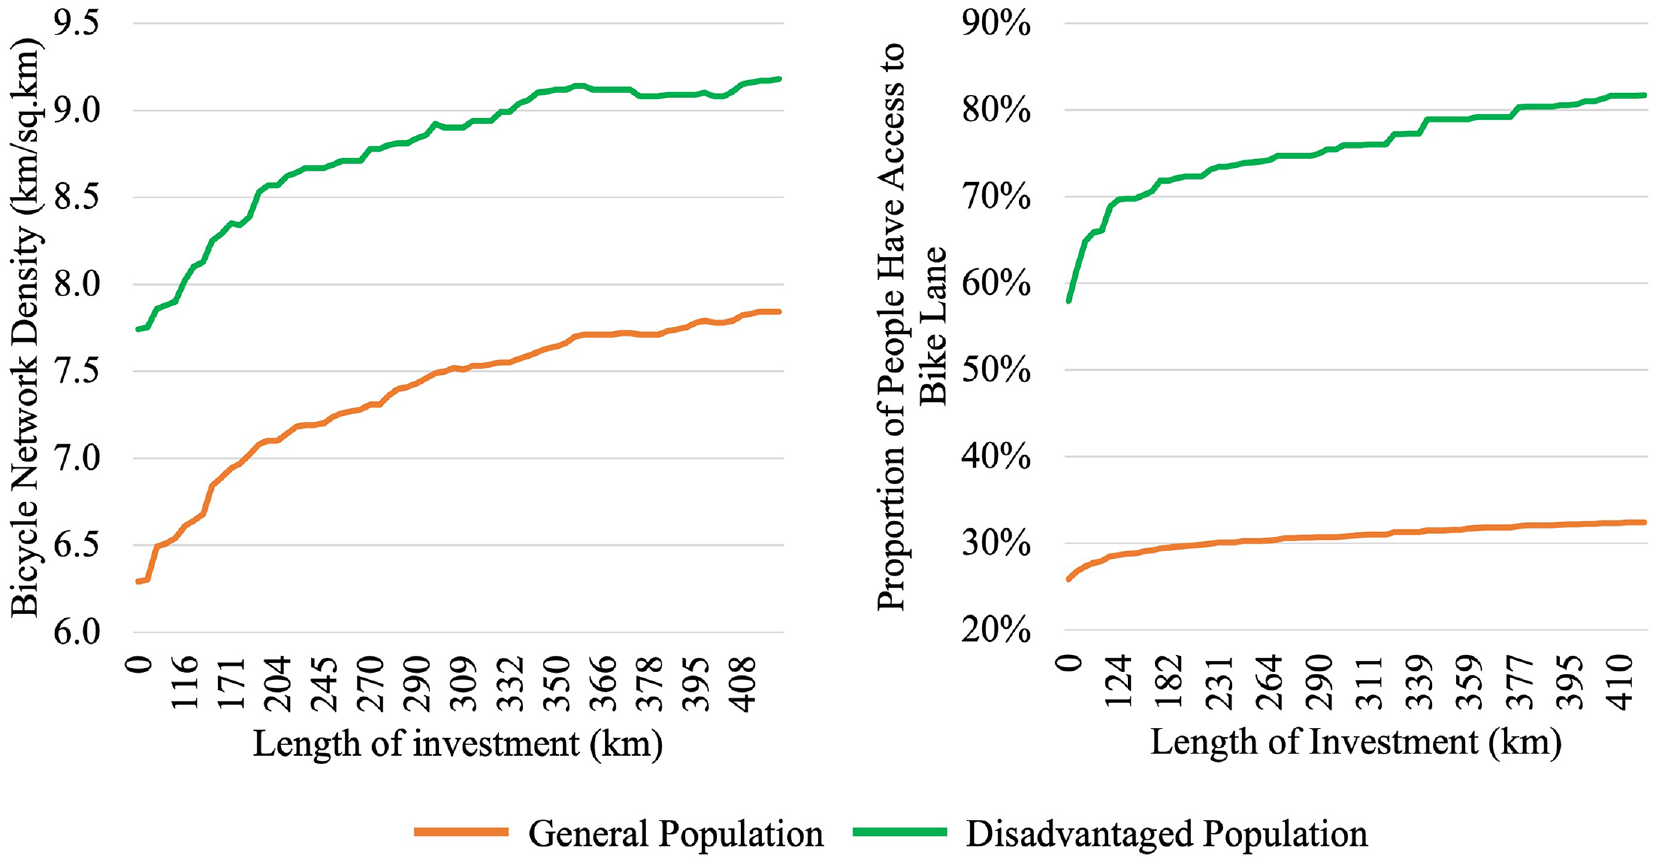
Changes in accessibility to bicycle network.
The proximity of the cycling network is not the only factor in understanding the potential benefit of this “equity-based” strategy. We also estimated the improvement in connectivity of bicycle facilities between centroids of identified transportation-disadvantaged DAs and urban destinations of cyclists. Under this scenario, network connectivity is quantified as the proportion of the route traveled on bicycle facilities. In this manner, we will be able to measure the degree to which each destination category is connected with origins using the proposed bicycle network, and whether residents of disadvantaged areas can access key destinations without leaving the proposed bicycle network and entering mixed traffic.
Figure 7 displays the current state of the network connectivity and the potential improvement that the proposed facilities will bring. The baseline level of connectivity for five types of destinations is quantified using the current bicycle network. We can see that pharmacies and grocery stores are poorly connected with origins by the existing bicycle network. While residents of disadvantaged neighborhoods can access their nearby pharmacy and grocery store using a path consisting of 20% of bicycle facilities, they travel a higher proportion of their trips on bikeways to the closest parks, on average 40%. This may be explained by the differences among quantities of pharmacies, grocery stores, and parks. On the other hand, the result reflects disadvantaged residents being unable to travel safely and comfortably from their homes to destinations using the current bicycle network. The additions of bicycle facilities under this proposed plan increases network connectivity levels, but the benefits of these improvements differ across destination categories. Particularly the increase in connectivity to health care facilities is large, yet the increase in connectivity to grocery store is smaller.
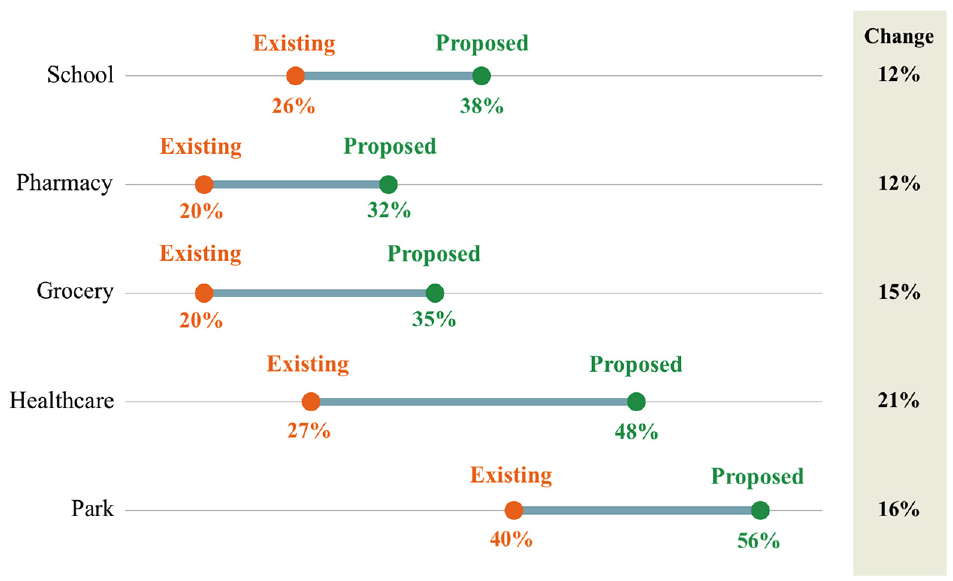
Improvement in proportion of route on facilities.
The final step in assessing the potential benefits of the infrastructure enhancements is to calculate the percentage of disadvantage suffered by residents under the set of combinations in travel distance and portion of route on facilities for each of the destination category. As shown in Figure 8, rows represent increased trip distances, while columns represent a greater proportion of route traveled along bikeways. The individual plots depict the percentage of the disadvantaged populations for each destination type under the specified thresholds. Currently, for trips of less than 2 km, more than 20% of the disadvantaged population could include over 50% of their rides on dedicated bike lanes to reach school, pharmacy, and grocery store, while less than 10% of disadvantaged residents could access all five destination types using a route consisting of more than 75% bikeways. After the prioritized infrastructure is added, more than a quarter of the disadvantaged population will be able to reach urban opportunities within 2 km by traveling over 50% of their trips on bicycle facilities.
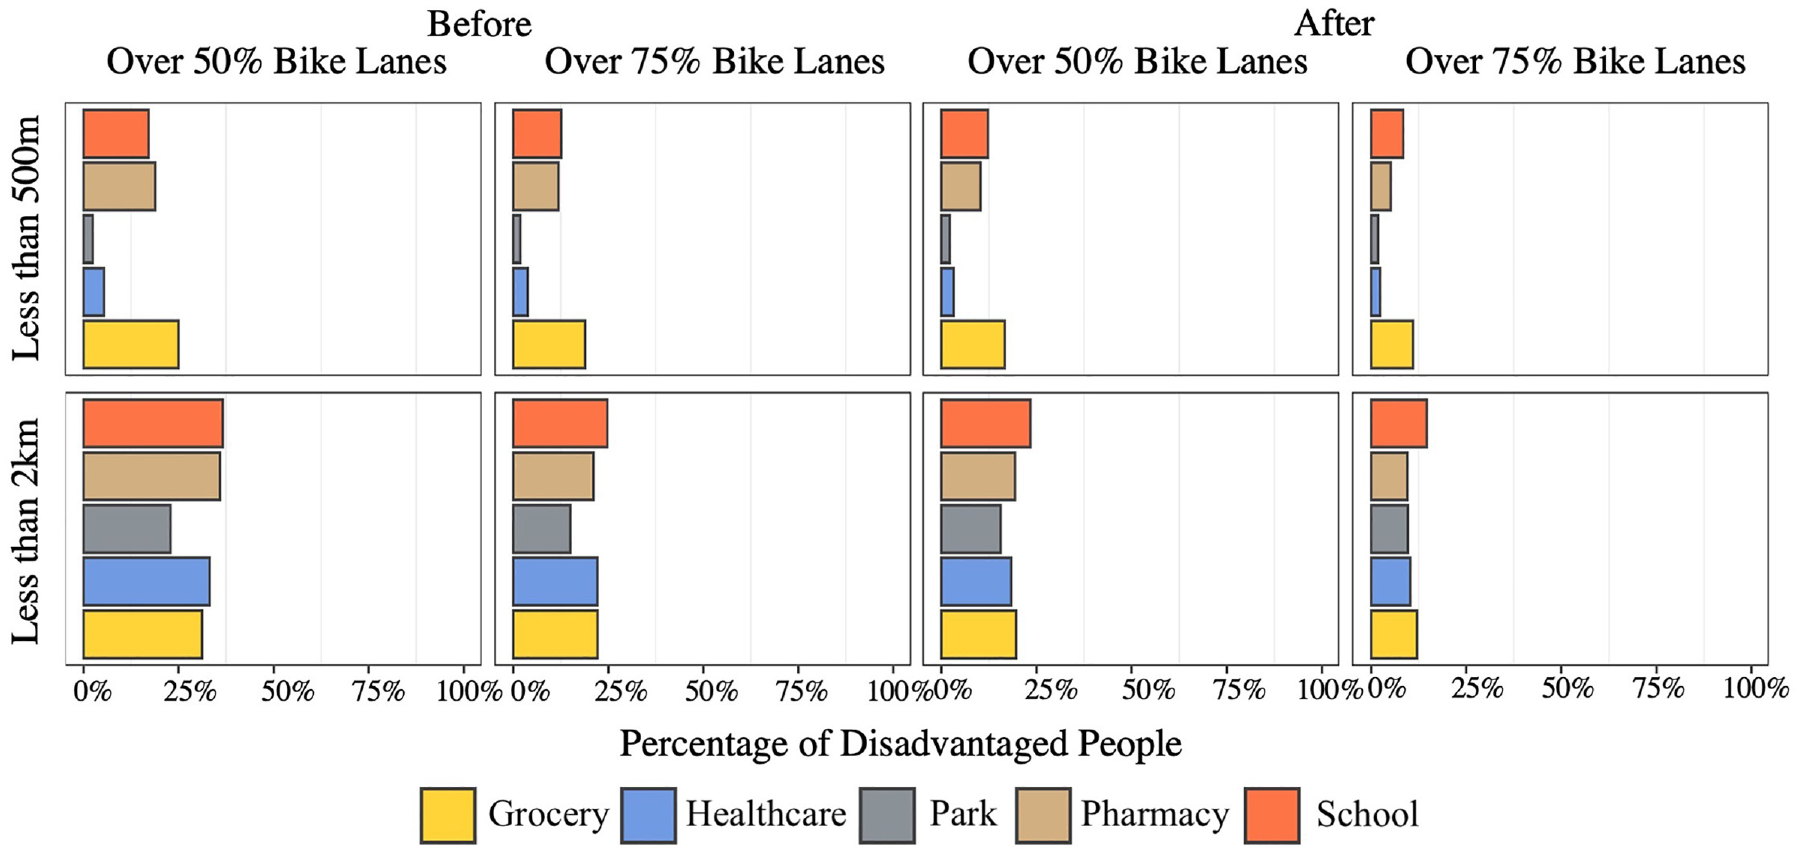
Potential benefit of “equity-based” strategy.
“Modal Shift” Prioritizations Strategy
Commuting in Montreal
The first step in identifying car trips that could be reasonably cycled is to explore commuting patterns. We categorized CTs between suburbs and urban areas using the Urban Core Index (UCI) ( 34 ). UCI was calculated as the sum of normalized values of three variables: (1) the percentage of dwellings built before 1946; (2) the percentage of non-single-family homes; and (3) the modal share of public transit and active transportation in a CT. Each variable was standardized (Z-score), weighted equally, and summed together to create the UCI. Urban areas were CTs with a UCI score of 1 or above. Based on the classification of urban and suburban CTs, we divided commuting flows into four main categories to describe commuting activity on Montreal Island: (1) traditional commute, in which commuters travel from suburbs to urban areas; (2) reverse commute, in which commuters travel from urban areas to suburbs; (3) inter-urban commute, in which commuters travel between urban areas; and (4) inter-suburban commute, in which commuters travel between suburbs.
The Island of Montreal showed strong urban dominance. Urban CTs account for the majority of employment destinations with 92% of commutes. Historically, traditional commuting from suburbs to urban areas was dominant in Canada. However, the inter-urban commuting share outnumbered the share of workers who have a traditional commute in the region (Figure 9a). With regard to the distribution by modes of commuting, commuters of Montreal Island were heavily dependent on public transit. In 2015, 43% of commuters used public transit, including bus, subway, light rail, and ferry, while another 45% of workers commuted to work using an automobile, either driving alone or carpooling. Active transportation, including walking and cycling, made up a small proportion of all commute trips at a rate of 12%. The modes of commuting differ according to the types of commuting flows. The greatest tendency to drive was found in inter-suburban flows at 78%, while the rate of commuters who rely on nonmotorized transportation was notably high in commuting from urban CT to urban CT where there tend to be more dedicated bike lanes. The spatial distribution of share of car trips by origin is shown in Figure 9b. Montreal’s urban areas (i.e., downtown and surrounding CTs) have systematic concentrations of relatively low driving rates. In other parts of the Island of Montreal, driving rates are relatively high. However, we find that 29% of car trips were shorter than 5 km, suggesting a strong potential for mitigating car dependency and reducing GHG emissions.
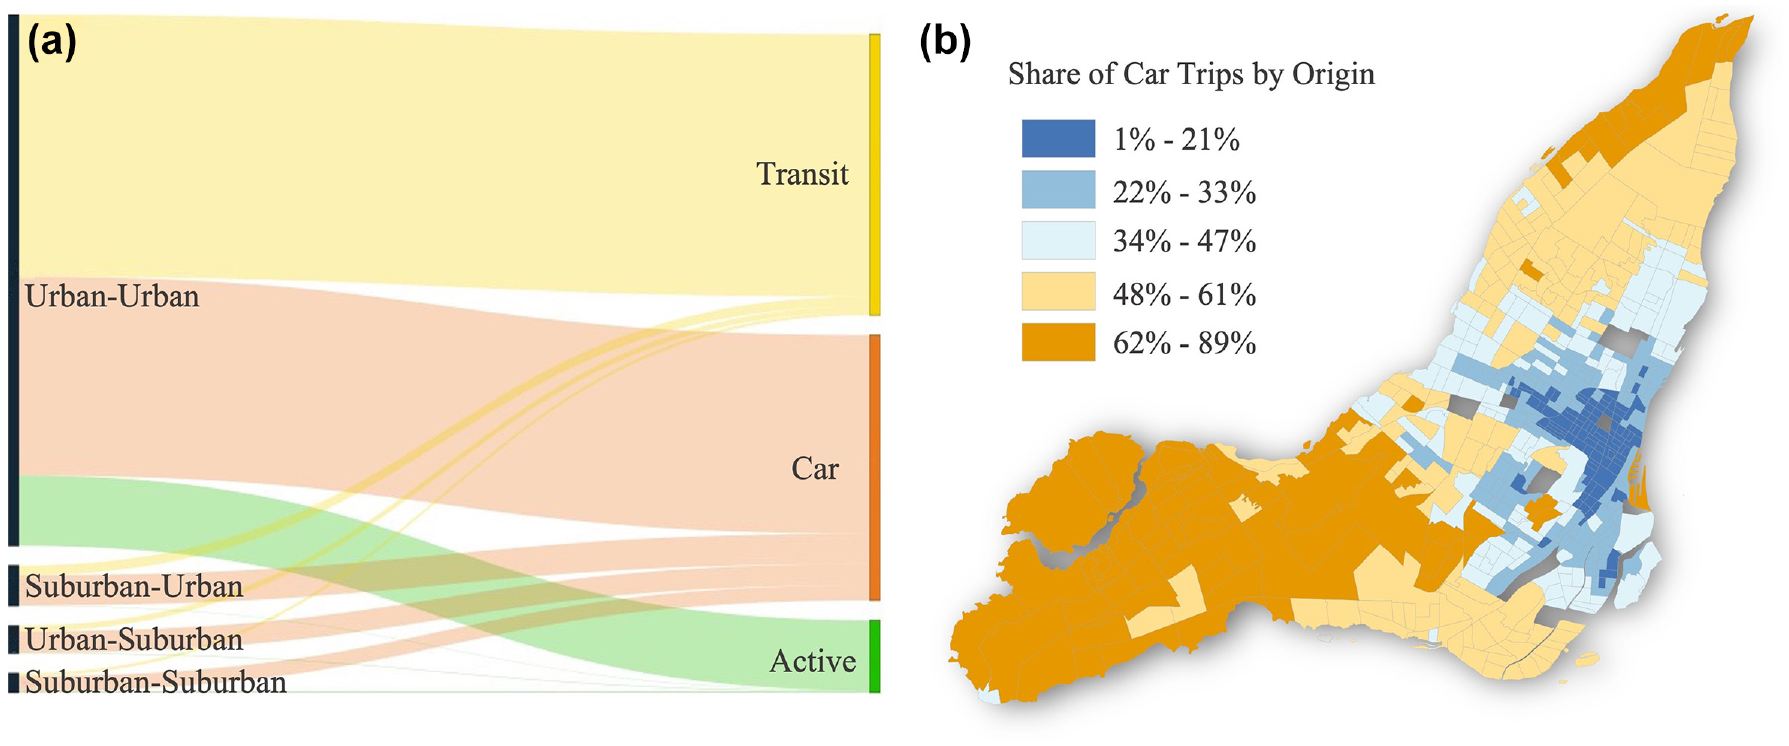
Commuting in Montreal: (a) inter-urban commuting share; and (b) the spatial distribution of share of car trips by origin.
Priority Bicycle Network
The “mode shift” strategy prioritizes bicycle facilities where there are high future volumes of people cycling to work to make cycling a viable option for commuters. This strategy would create a bicycle network that connects homes to workplaces and support short commuting trips, enabling a modal shift from car driving to cycling. Figure 10 indicates that bikeways are mainly suggested in central regions of the Island of Montreal where jobs are concentrated, but route developments which connect areas with a high proportion of commutes by car (e.g., West Island) to main employment are prioritized to facilitate further growth in the cycling rate.
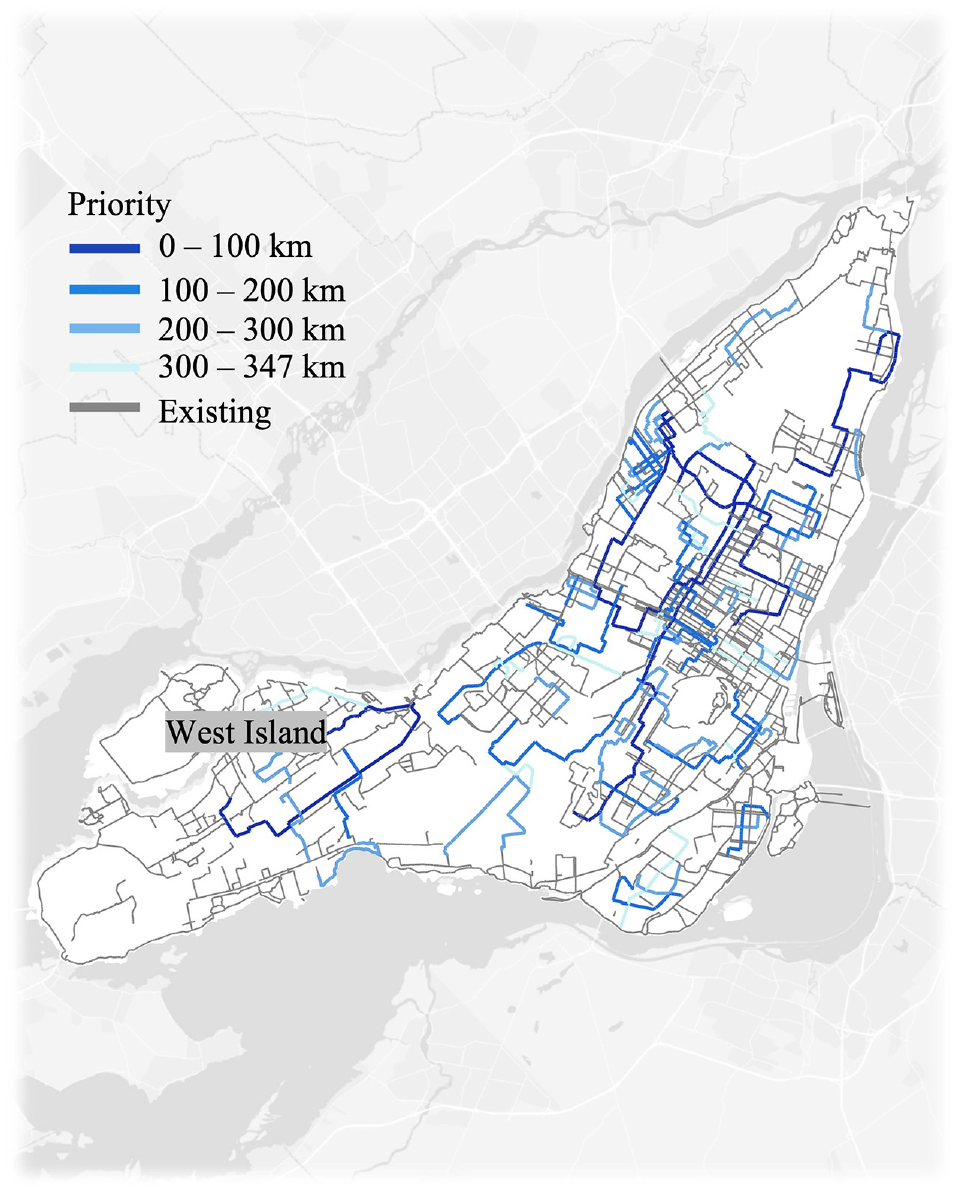
Priority bicycle network.
Potential Benefits
Figure 11 demonstrates the power of the “modal shift” intervention strategy by showing the change in potential for savings in GHG emissions from replacing short car trips with cycling. Given the lack of data on car details (e.g., vehicle age, fuel type, vehicle size) and vehicle speed, the CO2 emissions were estimated based on the distance traveled for each car trip. The calculations applied in this study were based on the suggestions by Brand et al. ( 35 ) that the average CO2 emissions savings by cycling compared with 100 km of car driving is 19 kg. As can be observed, the number of potential cyclable trips and the reduction in VKT are gradually increased as more infrastructure is added. With an investment of 347 km of bicycle facilities, potentially 14% (n = 48,890) of car trips would be cycled, and such a move would shift approximately 143,090 VKT in short car trips and thereby reduce GHG emissions by 27,187 kg every day.
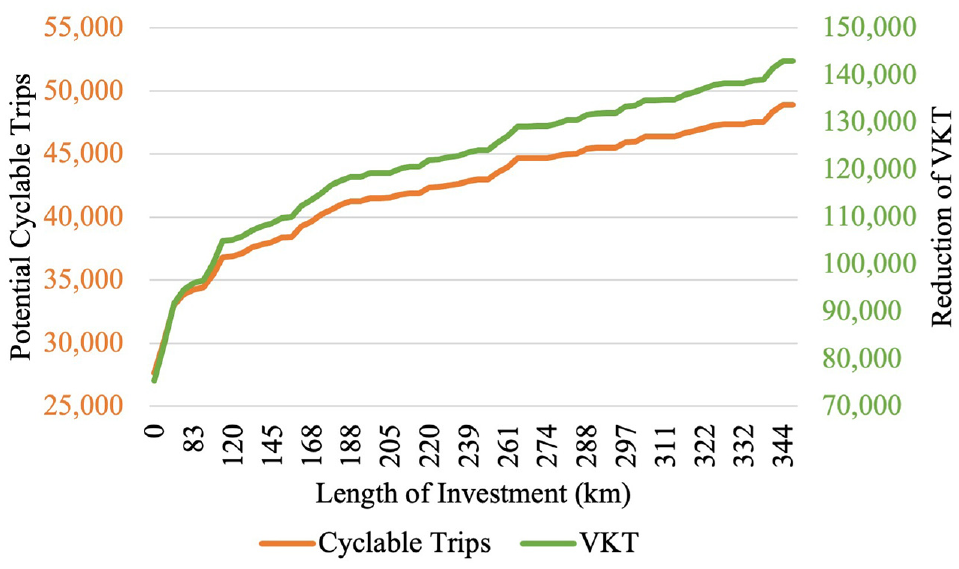
Potential of GHG emissions.
Discussions and Conclusions
With the growing consensus on the benefits of cycling, cities are expanding bicycle networks to foster a cycling culture. This paper set out to formulate a framework that supports the planning of bicycle facilities. Although this is not the first study tackling the problem of planning a bicycle network, the paper is unique in introducing quantitative methods for prioritizing future bicycle improvements, which have been proposed in Montreal Bicycle Network Plan, using different intervention strategies with regard to specific goals and objectives.
The “connectivity-focused” prioritization strategy considered the connectivity objective and sought to establish a well-connected bicycle network by employing a network-theoretical methodology. We prioritized cycling projects that connect fragmented network components to increase the size of the largest component and maximize coverage of important destinations. The “equity-based” intervention strategy grew the bicycle network favoring cycling equity goals. To improve accessibility to bicycle networks and urban opportunities for those neighborhoods that are currently socially isolated and experience a shortage of transit services, we first identified transportation-disadvantaged DAs by using a composite index comprised of six socioeconomic indicators plus one mobility-related indicator. Project priorities were then decided based on a project’s ability to connect identified disadvantaged neighborhoods to destinations via connected dedicated bike lanes. The “modal shift” strategy focused on commuting trips, which aligns with the sustainability goals of Montreal, being to promote cycling as an alternative to driving and thereby to increase cycling ridership and reduce carbon emissions. We prioritized cycling projects which concentrated several possible overlapping short car trips of less than 5 km to build a bicycle network that would appeal to prospective bicycle commuters.
After determining priorities for future investment, we modeled the impacts of proposed bicycle projects beyond added kilometers. The results suggested that the “connectivity-focused” scenario would increase the size of the largest connected component from 503 km to 1,118 km. Cyclists would access 1,150 important destinations using connected cycling routes. It is important to note, however, that bicycle projects proposed by Montreal Bicycle Network Plan cannot connect all fragmented components. The “equity-based” scenario demonstrated that the expanded network would improve accessibility to bicycle facilities for transportation-disadvantaged neighborhoods from 58% to 82%. Residents living in those areas would be able to access a majority of destinations using a path consisting of more than 35% bicycle facilities. The findings from “modal shift” scenario showed an increase in potential cyclable trips and reductions in VKT and GHG emissions.
Overall, by applying this methodology to the bicycle network on the Montreal Island, the results proved that this framework is not only useful for guiding the implementation of new bicycle facilities with specific policy priorities but could also provide insights on how the improvements in the network impact both existing and potential cyclists. In addition, the output of project prioritization highlighted the importance of growing the bicycle network in a systematic way and could help cities maximize the benefits of cycling investment within budget constraints. Lastly, this approach does not involve context-specific considerations. Planners and engineers elsewhere can, therefore, easily replicate this methodology using similar data sets.
This study is not without limitations. A major problem to have evolved in this study is that of defining transportation-disadvantaged neighborhoods based on census data. The aggregate approach falsely assumed that the attributes of areas reflect those of the residents living in the areas and therefore may miss transportation-disadvantaged individuals in other neighborhoods. In addition, when deciding about prioritization of bike path section investments, it is important to take into consideration intersections where the majority of bicycle–vehicle conflicts occur ( 36 ). This could help in measuring the quality of proposed facilities to prioritize investments that reduce the risk of conflicts and increase safety for cyclists. Modeling cycling potential also presents its own unique challenges. We assumed all of the commuters with potentially cyclable trips would switch to bicycle, without knowing whether or not the trip is cyclable for them. Since the propensity to cycle to work is determined by multiple factors, trip and traveler characteristics, as well as the environmental and social characteristics, the potential cycling demand may be overestimated. We anticipate that a future stream of work should include disaggreagated data to enhance our abilitiy to explore who lives in certain neighborhoods. Moreover, using detailed travel survey data would allow for a more accurate determination as to where there is high potential for cycling.
Footnotes
Author Contributions
The authors confirm contribution to the paper as follows: study conception and design: Qiao Zhao, Kevin Manaugh; data collection: Qiao Zhao; analysis and interpretation of results: Qiao Zhao, Kevin Manaugh; draft manuscript preparation: Qiao Zhao, Kevin Manaugh. All authors reviewed the results and approved the final version of the manuscript.
Declaration of Conflicting Interests
The author(s) declared no potential conflicts of interest with respect to the research, authorship, and/or publication of this article.
Funding
The author(s) disclosed receipt of the following financial support for the research, authorship, and/or publication of this article: The authors are grateful to the McGill Sustainability Systems Initiative (MSSI) for support of this research.